mkhululi ncube - university of the...
TRANSCRIPT
IMPACT OF WORKING CAPITAL ON THE PROFITABILITY OF SOUTH
AFRICAN FIRMS LISTED ON THE JOHANNESBURG STOCK EXCHANGE
by
Mkhululi Ncube
Thesis submitted in fulfilment of the requirements for the degree of
Master of Management in Finance & Investment
in the
FACULTY OF COMMERCE, LAW AND MANAGEMENT
WITS BUSINESS SCHOOL
at the
UNIVERSITY OF THE WITWATERSRAND
SUPERVISOR: DR. Thabang Mokoteli

i
DECLARATION
I, Mkhululi Ncube declare that the research work reported in this dissertation is my own,
except where otherwise indicated and acknowledged. It is submitted for the degree of
Master of Management in Finance and Investment in the University of the Witwatersrand,
Johannesburg. This thesis has not, either in whole or in part, been submitted for a degree
or diploma to any other universities.
Signature of candidate Date: 31 December 2011

ii
ABSTRACT
This study examines the influence of working capital management components on the
profitability of South African firms listed on the Johannesburg Stock Exchange (“JSE”). In
addition, the study investigates how the influence of the selected working capital
management components changes as macroeconomic conditions change. The study used
accounting based secondary data obtained from I-Net Bridge and BF McGregor for 254
firms from 2004 to 2010. The Pooled Ordinary Least Squares (“OLS”) regression models
were used in the analyses. The key findings from the study indicate the following: (1) that
there exists a significant negative relationship between the net time interval between actual
cash expenditures on a firm‟s purchase of productive resources and the ultimate recovery
of cash receipts from product sales (cash conversion cycle) and profitability. This negative
relationship suggests that managers can create value for the shareholders of the firm by
reducing the cash conversion cycle; (2) that there exists a significant negative relationship
between days sales in receivables and profitability. This indicates that slow collection of
accounts receivables is associated with low profitability and suggests that corporate
managers can improve profitability by reducing credit period granted to their customers;
(3) that an increase in the length of a firm‟s cash (operating) cycle tends to increase
profitability during an economic recession than during an economic boom. This result
indicates that firms adopt a more generous trade credit policy during an economic
recession than during a boom in an attempt to boost sales which would ordinarily dwindle
during a recession. The implication of this positive relationship in comparison with a
negative relationship between the normal cash conversion cycle and profitability is that
corporate managers need to streamline their trade credit policy and change it accordingly
as the macroeconomic environment changes in ensuring that the company‟s sales are not
adversely impacted as economic conditions change.
Furthermore, the study finds that there exists a highly significant negative relationship
between profitability and the following respective ratios: days payables outstanding,
current ratio, and capital structure. The negative relationship found between profitability
and debt to equity ratio (used as a proxy for capital structure) indicates that South African
firms‟ profitability tends to decrease at excessively high and increasing levels of debt.

iii
ACKNOWLEDGEMENTS
I would like to thank my Supervisor; Dr Thabang Mokoteli for her guidance and in
helping me with this research.
I am especially grateful to my family for always keeping me going. In particular, I am
grateful to my father and mother, my partner, my daughter Khanyisile Makhosazana, as
well as my late brother Stanley to whom this thesis is dedicated. Above all, I thank God
for His presence in my life and in all my endeavours.

iv
TABLE OF CONTENTS
DECLARATION .................................................................................. I
ABSTRACT ........................................................................................ II
ACKNOWLEDGEMENTS ................................................................. III
LIST OF TABLES ............................................................................. VI
LIST OF FIGURES ........................................................................... VI
1 INTRODUCTION ...................................................................... 7
1.1 INTRODUCTION .............................................................................................. 7
1.2 CONTEXT OF THE STUDY .................................................................................. 7
1.3 PROBLEM STATEMENT ................................................................................... 10
1.4 OBJECTIVES OF THE STUDY ............................................................................ 11
1.5 RESEARCH QUESTIONS .................................................................................. 12
1.6 SIGNIFICANCE OF THE STUDY ......................................................................... 12
1.7 OUTLINE OF THE STUDY ................................................................................. 13
2 LITERATURE REVIEW .......................................................... 14
2.1 INTRODUCTION ............................................................................................ 14
2.2 DEFINITION OF KEY TERMS AND CONCEPTS ....................................................... 14
2.3 EXISTING AND RELEVANT LITERATURE ............................................................ 15 2.3.1 WORKING CAPITAL MANAGEMENT COMPONENTS ....................................................... 16 2.3.2 CAPITAL STRUCTURE ................................................................................................ 18 2.3.3 EARNINGS MANIPULATION USING WORKING CAPITAL .................................................. 19
2.4 CONCLUSION OF LITERATURE REVIEW ............................................................ 20
3 RESEARCH METHODOLOGY ............................................... 22
3.1 INTRODUCTION ............................................................................................ 22
3.2 DATA AND DATA SOURCE .............................................................................. 22
3.3 VARIABLES AND HOW THEY ARE MEASURED..................................................... 23
3.4 VARIABLES PREDICTED SIGN(S) ..................................................................... 27
3.5 DETERMINING ECONOMIC BOOM AND RECESSION PERIODS ................................. 27
3.6 RESEARCH DESIGN ....................................................................................... 29

v
3.6.1 MODEL SPECIFICATIONS ............................................................................................... 29 3.6.2 GENERAL REGRESSION MODEL .................................................................................... 30 3.6.3 SPECIFIC REGRESSION MODELS ................................................................................... 31
3.7 DIAGNOSTIC TESTS ....................................................................................... 33 3.7.1 TEST FOR HETEROSKEDASTICITY .................................................................................. 33 3.7.2 TEST FOR MULTICOLLINEARITY ..................................................................................... 35
3.8 SUMMARY ................................................................................................... 36
4 PRESENTATION OF RESULTS .............................................. 37
4.1 INTRODUCTION ............................................................................................ 37
4.2 DESCRIPTIVE STATISTICS ............................................................................... 37
4.3 CORRELATION MATRIX ................................................................................. 38
4.4 REGRESSION ANALYSIS ................................................................................. 40 4.4.1 MODEL SPECIFICATION (I) .......................................................................................... 41 4.4.2 MODEL SPECIFICATION (II) ......................................................................................... 44
4.5 SUMMARY ................................................................................................... 46
5 DISCUSSION AND CONCLUSION .......................................... 48
5.1 INTRODUCTION ............................................................................................ 48
5.2 DISCUSSION ................................................................................................. 48
5.3 CONCLUSION ............................................................................................... 51
5.4 FUTURE RESEARCH ....................................................................................... 52
REFERENCES .................................................................................. 53
APPENDICES ................................................................................... 56
vi
LIST OF TABLES
Table 1: Variables used in the study ...................................................................... 24
Table 2: Proxy variables and predicted relationship .............................................. 27
Table 3: South Africa - annual GDP growth .......................................................... 29
Table 4: Breusch-Pagan Test for Heteroskedasticity – Model I .............................. 34
Table 5: Breusch-Pagan Test for Heteroskedasticity – Model II ............................. 34
Table 6: Variance Inflation Factor ........................................................................ 35
Table 7: Descriptive Statistics ............................................................................... 37
Table 8: Correlation Matrix - Coefficients ............................................................. 38
Table 9: Regression - Relationship between profitability and working capital ........ 41
Table 10: Direction explanatory variable to take to increase profitability ............... 52
LIST OF FIGURES
Fig. 1: Operating and cash conversion cycles ......................................................... 15
Fig 2: Yearly Global GDP Growth ........................................................................ 28

7
1 INTRODUCTION
1.1 Introduction
This study empirically examines the impact of working capital management components on the
profitability of quoted companies in South Africa. In addition, the study determines how the
impact of working capital management components changes as macroeconomic conditions
change from a boom to a recession. This chapter is organised as follows: Section 1.2 sets-out
background on working capital management as well as on the trade-off between liquidity
preservation and profit maximisation faced by companies. Section 1.3 describes the problem
statement under investigation and further expounds on the trade-off emanating from managing
working capital. Section 1.4 chronicles the main objectives of the study and is followed by section
1.5 which specifies the key questions to be examined by the study. Section 1.6 highlights the
significance of this study and pin-points the gaps in theoretical and previous studies that this
research seeks to fill in. The last section of the chapter outlines how the entire research paper is
organized.
1.2 Context of the study
Corporate financial management primarily deals with three core areas that have a bearing on a
firm‟s financial goals. As postulated by Firer et al (2008), these three core areas of corporate
finance are as follows: (1) capital budgeting, which encapsulates the process of planning and
managing a firm‟s long-term investments; (2), capital structure, which outlines the specific
mixture of long-term debt and equity maintained by a firm and last, (3) working capital
management, which deals with management of a firm‟s short-term assets and liabilities.
The literature on both capital structure and working capital management is rich in as far as
explaining how these two corporate finance areas directly affect firms‟ profitability and liquidity
(e.g., Lemke, 1970; Kaveri, 1985; Hamlin and Heathfield, 1991; Deloof, 2003; Lazaridis and
Tryfonidis, 2006; Biger et al, 2010).

8
In their respective studies of working capital management, Deloof (2003) and Nasr and Raheman
(2007) find that current assets of a typical manufacturing firm accounts for more than half of the
total assets and that the high levels of current assets within a firm may directly affect its
profitability and liquidity. In the same vein, Demirgunes and Samiloglu (2008) affirm that while
excessive levels of working capital can result in substandard return on investments, inconsiderable
levels may result in shortages and difficulties in maintaining day-to-day operations. Laughlin and
Richards (1980) hold the same view and confirm that inattention to working capital management,
which essentially reflects the firm‟s liquidity position, may cause severe difficulties and losses
due to adverse short-run developments even for the firm with favourable long-run prospects. The
upshot of the foregoing is that incorrect evaluation of liquidity implications of a firm‟s working
capital needs may result in unanticipated risks of company failure.
Instructive to note is that while the ultimate goal of a firm is to maximise profit, preserving
liquidity is also an important objective considering that increasing profits at the cost of liquidity
can bring problems to the firm. Thus, there is a trade-off between these two objectives and
disregarding liquidity may result in insolvency and bankruptcy (Nasr and Raheman, 2007). It is
partly as a result of this trade-off between profit maximization and liquidity preservation that this
research determines the relationship between various working capital management components
and profitability of South African firms listed on the JSE.
The primary components of working capital management include inventory levels, trade credit
(accounts receivables), accounts payables, as well as cash conversion cycle (Biger et al, 2010).
Cash conversion cycle is a popular measure of working capital management that reflects the net
time interval between actual cash expenditures on a firm‟s purchase of productive resources and
the ultimate recovery of cash receipts from product sales (Laughlin and Richards, 1980). From
this definition, the insinuation therefore is that the longer this time lag, the larger the investment
in working capital. As Deloof (2003) and Biger et al (2010) proclaim, a longer cash conversion
cycle might increase firm profitability given that it leads to higher sales, primarily as a result of
generous trade credit policy that allows customers to assess product quality before paying, as well
as a result of a reduction in risk of stock-out, which essentially reduces the jeopardy of business
operations interruption. Notwithstanding the possible increase in profitability as a result of a
generous trade credit policy and/or reduction in risk of stock-out, it is not unthinkable that
corporate profitability may decrease as cash conversion cycle elongates, particularly if the costs of

9
higher investment in working capital rise faster than the benefits of holding more inventory and/or
granting more trade credit to customers. It is precisely on the back of this dichotomy that this
research determines whether or not working capital management components have an impact on
profitability of South African firms and if so, gauge the direction and extent to which working
capital management components impact on profitability.
Lazaridis and Tryfonidis (2006) did an almost similar study and examined three components of
working capital management, namely accounts payables, accounts receivables and inventory.
They conclude that these three working capital management components can be managed in
different ways in order to maximize corporate profitability. They argue that while some firms use
trade credit as a vehicle to attract new customers, these firms will be prone to cash flow and
liquidity problems since capital will be invested in customers. The problem created by trade credit
is that while it may lead to improved sales as well as increased market share, it is not certain that
it will lead to increased profitability and vice versa. This study explores the relationship between
South African firms‟ profitability with the following variables: (1) cash conversion cycle, (2) days
sales in inventory, (3) days sales in receivables, (4) days payables outstanding, (5) current ratio,
(6) capital structure, and (7) market/economic conditions.
Additional analysis explores the difference and the extent to which working capital management
components impact on profitability of South African firms as economic conditions change; i.e.
from an economic boom to an economic recession. The underpinning for the assessment of the
impact as economic conditions change is that economic conditions in which firms operate might
arbitrarily change necessitating the change in a firm‟s strategy in as far as management of
working capital is concerned. Hamlin and Heathfield (1991) uphold that the ability of managers to
respond to rapidly changing circumstances is a vital aspect of their companies‟ competitiveness.
They argue that those who can react quickly and appropriately to unanticipated events such as raw
material price shocks gain a competitive advantage over their rivals. Given that inventory forms
part of working capital and in view of the implications of changes in economic circumstances on
inventory prices, this research explores if there is a difference in how working capital
management components impact profitability as economic conditions change.
While current ratio does not form part of the cash conversion cycle, the paper explores its impact
on profitability precisely because it is one of the key measures of liquidity. Lemke (1970) asserts

10
that current ratio has been almost venerated by accountants and other financial decision-makers as
a prime criterion of liquidity. Similarly, Laughlin and Richards (1980) concur and state that
financial analysts traditionally have viewed the current ratio as a key indicator of a firm‟s liquidity
position.
Although the primary focus of this particular research is to investigate how profitability is
impacted by working capital management components, the research further investigates how
profitability is impacted by capital structure, which is viewed by many researchers such as De
Angelo and Masulis (1980), Salawu (2009) and Brabete and Nimalathasan (2010) as the most
vital of all aspects of corporate capital investment decision.
While it is not implausible that income smoothing (defined by Schipper (1989) as a purposeful
intervention in the external financial reporting process of a firm with the intention of obtaining
some private gain) may be employed by firms by manipulating composition of working capital
management, the primary focus of this paper is not to assess how working capital management is
used in earnings manipulation but to examine the relationship between various working capital
management components and profitability.
1.3 Problem statement
Deloof (2003) and Biger et al (2010) state that a longer cash conversion cycle might increase firm
profitability given that it leads to higher sales, primarily as a result of generous trade credit policy
that allows customers to assess product quality before paying, as well as a result of a reduction in
risk of stock-out, which essentially reduces the risk of business operations interruption. It is
however not inconceivable that corporate profitability may decrease as cash conversion cycle
elongates, particularly if the costs of higher investment in working capital rise faster than the
benefits of holding more inventory and/or granting more trade credit to customers. The problem
is, we do not know and we are not aware of any study that investigates whether or not working
capital management has an impact on profitability of South African firms. In the same vein, we do
not know if the impact (if any) of working capital management components on profitability of
South African firms is positive or negative. Furthermore, we do not know how and the extent to
which the impact changes as economic conditions change.

11
Although studies on working capital management have been carried out by various scholars such
as Lazaridis and Tryfonidis (2006), Demirgunes and Samiloglu (2008), and Biger et al (2010), it
is instructive to note that there is still ambiguity regarding the appropriate variables that might
serve as proxies for working capital management. This study will investigate the following
working capital management variables: (1) cash conversion cycle, (2) days sales in inventory, (3)
days sales in receivables, (4) days payable outstanding, (5) current ratio (6) capital structure, and
(7) market conditions. Previous studies provide no clear-cut direction of the relationship between
any of the aforementioned variables and firm‟s profitability
While considerable amount of research on working capital management has been undertaken by a
number of researchers (for example, Lazaridis and Tryfonidis, 2006; Demirgunes and Samiloglu,
2008 and Mathuva, 2010), their studies are primarily on companies in geographic jurisdictions
other than South Africa. Much of the currently available empirical literature on working capital
management is focussed on its impact on firms in developed countries/regions such as the United
States of America (U.S.) and Europe. This paper focuses on South African firms where only
limited research has been conducted.
Similarly, there is relatively little evidence available on the effect of capital structure on the
profitability of listed companies in South Africa. This study bridges this gap by examining the
effect of capital structure on profitability of quoted firms in South Africa.
1.4 Objectives of the study
This study has three main objectives and these are:
One: to empirically examine if working capital management components, namely: cash
conversion cycle, days sales in inventory, days sales in inventory, days payables outstanding,
current ratio, and capital structure impact on profitability of South African listed firms; two: to
build a model that gauges how working capital management, particularly cash conversion cycle,
impact on profitability when the economy moves from a boom to a recession, and three: to
determine if the impact of working capital management components on profitability of companies
in the industrial sector and those in the rest of the other sectors is different. The underpinning for
this investigation of the impact in different sectors is that, relative to the rest of the companies in

12
the other sectors, companies in the industrial sector (which comprise manufacturing and
production led firms) have significantly higher levels of current assets (which form part of
working capital) on their respective balance sheets. Thus, the objective is to examine if there is a
difference in the direction and extent of the impact on profitability if working capital levels
change from significantly high levels to relatively low levels.
1.5 Research questions
The key questions to be investigated by this study are as follows:
(i) Do firm‟s liquidity measures impact on profitability of South African companies; i.e. are
the working capital management variables statistically significant in explaining variation
in profitability?
(ii) If statistically significant, what is the direction of the impact of each variable; i.e. is it a
negative or a positive relationship?
(iii)Does liquidity affect profitability of companies within the industrial sector and the rest of
the sectors different?
(iv) Is there any difference in how working capital management impacts on profitability as the
economy moves from a boom to a recession?
(v) Does capital structure impact on profitability of South African firms, and if so, is the
relationship between capital structure and profitability positive or negative?
1.6 Significance of the study
In addition to determining if working capital management components impact on profitability of
South African firms, this study has many contribution-enhancing positive features which include
the following: Firstly, unlike previous studies that examined working capital by not differentiating
between different market conditions, this paper explores the level of the impact of working capital
management on profitability as market conditions change. Specifically, it dissects the impact of
working capital management under both an economic downturn as well as under an economic
boom. This information will be enlightening in trade credit policy formulation in that it will give
guidance to company corporate managers in implementing and adapting an appropriate trade

13
credit policy fitting for each market condition, as opposed to having a one size fits all trade credit
policy. Secondly, the study investigates the relationship between capital structure and profitability
of South African firms where limited empirical research exists. Given that capital structure is
viewed by a number of researchers such as De Angelo and Masulis (1980), Salawu (2009), and
Brabete and Nimalathasan (2010) to be the most vital of all the aspects of capital investment
decision, the study therefore examines its relationship with profitability so as to give guidance to
management in their attempt to identifying the optimal capital structure of the firm that
maximizes market value.
Thirdly, the scope of the research has been extended to explore if the selected liquidity measures
impact on profitability of companies in the industrial sector and those in the rest of the other
sectors different. This will give guidance to corporate managers in adopting an appropriate trade
credit policy applicable in their sector.
1.7 Outline of the study
This research paper comprises five chapters including this introduction section and is organised as
follows. Chapter 2 provides literature review of the earlier work undertaken on working capital
management and how it affects profitability of firms in other geographic jurisdictions. In addition,
chapter 2 defines key terms and variables used in the study. Chapter 3 describes the
methodological approach that will be followed to address research questions put forward under
section 1.5 above. Chapter 4 presents and analyses results of the study. It is followed by chapter 5
which discusses the results in comparison with findings from previous studies and then concludes
by suggesting further work to be done in congruence with this study.

14
2 LITERATURE REVIEW
2.1 Introduction
This chapter highlights the contribution of some of the previous studies on working capital
management across the globe. Section 2.2 discusses key definitions and concepts relevant to
working capital management. Section 2.3 captures comprehensive literature review on working
capital management and its components and how they affect profitability in other geographic
jurisdictions. Section 2.4 gives an overview of key findings from previous studies. Furthermore, it
highlights how this study bridges the pointed-out gaps in literature.
2.2 Definition of key terms and concepts
Working Capital
The term “working capital” refers to the investment in current assets which are required to carry
on the operations of the business (Firer et al, 2008). Kaveri (1985) refers to it as the difference
between current assets and current liabilities. Managing the firm‟s working capital is a day-to-day
activity that ensures that the firm has sufficient resources to continue its operations and avoid
costly interruptions.
Trade Credit
Trade credit is an element of working capital. In its wider sense, it refers to both trade dues
(sundry creditors or trade payables) and trade receivables/sundry debtors (Bhole and Mahakud,
2004). While the former serves as a source of funds, the latter represents the use for them. The
concept of trade credit originates from a widespread practice in the business world where
transactions take place without spot payments.
Components of Working Capital Management
Biger et al (2010) proclaim that a popular measure of working capital management is the „cash
conversion cycle‟ which is calculated as „days of sales in receivables‟, plus „days sales in

15
inventory‟ minus „days payable outstanding‟. This cycle essentially denotes the number of days a
company‟s cash is tied up by its current operating cycle (Fried et al, 2003).
The various interrelationships among working capital components are shown in Figure 1 below.
Fig. 1: Operating and cash conversion cycles
Source: Jordan et al, 2003.
The cash conversion cycle depicted in Fig. 1 above captures the interrelationship of sales, cash
collections, and trade credit in a manner that the individual numbers may not. To the extent a firm
uses credit, the length of the cash (operating) cycle is reduced.
Capital Structure: Firer et al (2010) refer to capital structure as the specific mixture of long-term
debt and equity the firm uses to finance its operations. The problem of how firms choose and
adjust their strategic financial mix has drawn interest in corporate literature primarily because the
mix of the funds (leverage ratio) affects the cost and availability of capital and thus firm‟s
investment‟s decisions (Salawu, 2009).
2.3 Existing and relevant literature
Working capital management has been revisited by a considerable number of scholars such as
Deloof (2003), Lazaridis and Tryfonidis (2006) and Demirgunes and Samiloglu (2008) in
postulating its impact on firm‟s profitability. While the primary focus of the studies by these
scholars has been to ascertain if there is a relationship between working capital management and
profitability, it is instructive to note that the studies were conducted primarily for companies
operational in developed countries within the European Union and in the U.S. Equally important

16
to note is that there is no clear-cut conclusion on direction of the impact of working capital
management components impact on profitability. Also, the choice of explanatory variables differs
from one research to another.
2.3.1 Working Capital Management Components
In their research paper, Lazaridis and Tryfonidis (2006) examine a sample of 131 companies
listed in Greece on the Athens Stock Exchange for a period of four years from 2001-2004. The
primary focus of their study was to establish whether there is a relationship that is statistically
significant between profitability (defined as gross operating profit) and the cash conversion cycle
and its components (accounts receivables, accounts payables, and inventory). They used both
Pearson correlation and pooled ordinary least squares (OLS) to analyse the relationship. They
found that lower gross operating profit is associated with an increase in the numbers of days of
accounts payables. Furthermore, they conclude that managers can create profits for their
companies by handling correctly the cash conversion cycle and keeping each different component
of cash conversion cycle to an optimum level.
From the perspective of Belgian firms, Deloof (2003) undertook a study of 1,009 large non-
financial firms for a period of five years from 1992-1996 to determine if working capital affects
profitability of Belgian firms. Unlike other researchers such as Nasr and Raheman (2007) who
used return on investment (ROI) as a profitability measure, Deloof (2003) measured profitability
by gross operating income, which he calculated as („sales‟ minus „cash costs of goods‟) divided
by („total assets‟ minus „financial assets‟). Deloof‟s justification in deducting financial assets from
total assets in the formula above is that in a number of firms in his sample, financial assets, which
mainly comprise shares in other firms, are a significant part of the total assets and as such,
operating activities would have contributed little to the overall ROI. Thus, the above formula
associates profitability with the operating activities of the company for the defined period. By
using correlation and regression analysis, Deloof found a significant negative relationship
between gross operating income and the number of days in accounts receivables, inventories, and
accounts payables of Belgian firms. While it is not unthinkable to assume that an increase in the
number of days in payables increases the cash-flow position of a company and therefore increases
a company‟s profitability, Deloof found that for Belgian firms, there is a negative relationship
17
between number of days accounts payable and gross profit income. He argues that this negative
relationship is underpinned by the fact that less profitable firms wait longer to pay their bills.
An almost similar research to Lazaridis and Tryfonidis‟s (2006) paper was undertaken by Biger et
al (2010). The paper is an extension of Lazaridis and Tryfonidis‟s (2006) research and differed in
that it looked precisely at American manufacturing firms listed on the New York Stock Exchange.
They used a sample of 88 American firms for a period of three years from 2005-2007 to
determine the relationship between working capital management and corporate profitability.
Based on regression analysis and consistent with Lazaridis and Tryfonidis‟s (2006) findings, the
study found a statistically significant relationship between cash conversion cycle and profitability,
measured as gross profit margin. They conclude that profitability can be enhanced if firms
manage their working capital in a more efficient way.
Nasr and Raheman (2007) conducted a research to establish the effect of different working capital
variables such as cash conversion cycle and its components, as well as current ratio, on
profitability of Pakistani firms. They measured profitability as net operating profit. They used a
sample of 94 Pakistani firms listed on Karachi Stock Exchange for a period of six years from
1999-2004. Using Pearson correlation and regression analysis based on pooled least squares and
general least squares, they found that there is a strong negative relationship between variables of
working capital management and profitability of Pakistani firms. They conclude that as the cash
conversion cycle increases, profitability decreases. Also, they found that there is a significant
negative relationship between liquidity of firms and profitability and that there is a positive
relationship between size of the firm (another explanatory variable they used) and profitability.
Another explanatory variable they used was debt, which they found to have a significant negative
relationship with profitability.
From an African perspective, Mathuva (2010) used a sample of 30 firms listed on the Nairobi
Stock Exchange in Kenya for a period of 16 years from 1993-2008 to examine the influence of
working capital management components on corporate profitability. Using both the pooled OLS
and the fixed effects regression models, Mathuva (2010) found that the following: (1) that there
exists a highly significant negative relationship between the time it takes for firms to collect cash
from their customers and profitability; (2) there exists a highly significant positive relationship
between the period taken to convert inventories into sales and profitability. This finding however

18
is contrary to the findings of other researchers such as Deloof (2003) and Nasr and Raheman
(2007), who found that there is a negative relationship between days sales in inventory and
profitability for companies in their respective jurisdictions and (3) there exists a highly significant
positive relationship between the time it takes the firm to pay its creditors and profitability,
implying that the longer a firm takes to pay its creditors, the more profitable it is. While Mathuva
found a positive relationship between the time it takes to pay creditors and profitability, it is also
noted that Deloof (2003) found that there is a negative relationship between days accounts
payable and profitability. The difference in the direction of impact in Kenyan firms compared to
Belgian firms discussed above could be attributable to their different characteristics.
Another similar research on the effect of working capital management on firm profitability was
studied by Demirgunes and Samiloglu (2008) on Turkish firms. They used a sample of
manufacturing firms listed on the Istanbul Stock Exchange for the period of 1998-2007. Using
multiple regression model, their empirical findings show that accounts receivables period,
inventory period and leverage affect profitability negatively while growth in sales affects firm
profitability positively.
Similarly, empirical research by Garcia-Teruel and Martinez-Solano (2006) on the effect of
working capital management on profitability of small to medium enterprises (SMEs) in Spain
demonstrates that shortening the cash conversion cycle by reducing a firm‟s number of accounts
receivable and inventories improves firm‟s profitability. Their sample included 8,872 SMEs
covering the period 1996-2002.
2.3.2 Capital Structure
The other variable that will be used in the study is capital structure. While it does not form part of
working capital management, it is included in the study mainly because: (1) it is viewed by a
number of researchers such as De Angelo and Masulis (1980), Salawu (200), and Brabete and
Nimalathasan (2010) to be the most vital of all the aspects of capital investment decision, and (2)
it has called for a great deal of attention and debate among corporate financial literature. Fried et
al (2003) state that the analysis of a firm‟s capital structure is essential in evaluating a company‟s
long-term risk and return prospects as it measures the solvency of a company. While theoretical
and empirical analysis of capital structure has been done by many researchers such as Modigliani

19
and Miller (1958 and 1963), De Angelo and Masulis (1980), and Salawu (2009) there is no clear-
cut conclusion on its impact on profitability. For example, Modigliani and Miller (1958 and 1963)
postulate that in a frictionless world, financial leverage is unrelated to firm value, but in a world
with tax deductible interest payments, firm value is positively related to capital structure.
Modigliani and Miller (1963) argue that, as a result of the tax deductibility of interest payments,
companies may prefer debt to equity, thus, presupposing that highly profitable companies tend to
have high levels of debt. In contrast, De Angelo and Masulis (1980) argue that interest tax shields
may be unimportant to companies with other tax shields such as depreciation. In his research on
the effect of capital structure on profitability of Nigerian firms, Salawu (2009) found that there is
a negative association between the ratio of total debt to total assets (which ratio will be used as a
proxy of capital structure in this research) and profitability. In contrast, Brabete and Nimalathasan
(2010) found that for Sri Lankan firms, debt to assets ratio is positively and strongly associated
with profitability. Thus, it is evident that there is some level of ambiguity on the association
between capital structure and profitability between counties. Considering the relatively little
evidence on the association between capital structure and profitability of the listed companies in
South Africa, this research attempts to determine how profitability of South African firms is
impacted by capital structure, to be measured as total debt to total assets.
2.3.3 Earnings Manipulation using Working Capital
While composition of working capital management may be used by a firm in earnings
management manipulation, the main focus of this paper is not necessarily to examine how
working capital management is manipulated in earnings management but to examine the
relationship between various working capital management components and profitability. Gunny
(2010) assessed the relationship between earnings management using real activities manipulation
and future company performance and finds that real activities manipulation is positively
associated with firms meeting earnings benchmarks. In their paper, Dechow and Skinner (2000)
postulate that earnings management can be classified into two categories: accruals management
and real activities manipulation, where accruals management involves within generally accepted
accounting principles (GAAP) accounting choices that try to “obscure” or “mask” true economic
performance. On the other hand, real activities manipulation occurs when managers undertake

20
actions that change the timing or structuring of an operation, investment, and/or financing
transaction in an effort to influence the output of the accounting system. Gunny (2010) elaborates
on this earnings management concept and states that accruals management is not accomplished by
changing the underlying operating activities of the firm, but through the choice of accounting
methods used to represent those activities. In contrast, she states that real activities manipulation
involves changing the firm‟s underlying operations in an effort to boost current-period earnings. It
is not inconceivable that working capital management components are vulnerable to manipulation
using real activities manipulation which changes the underlying operations of a firm in an attempt
to boost earnings. Gunny (2010) lists the examples of real activities manipulation as follows:
Firstly, overproduction reflecting an intention to cut prices or extend more credit terms to boost
sales and/or overproduction to decrease cost of goods sold (COGS) expense. Given that extending
credit terms results in creation of “days sales in receivables”, which forms part of working capital
management components, it is therefore not implausible that days sales in receivables, in addition
to other working capital management components can be manipulated in boosting sales/earnings
of a firm. Secondly, timing the sale of assets (both non-current assets and current assets, which
form part of working capital management) to report gains. Thirdly, decreasing the discretionary
selling, general, and administrative (SG&A) expenses to increase income. Fourthly, decreasing
research and development (R&D) expense.
The foregoing activities indicate that working capital management components may be
manipulated by firms in boosting sales/earnings. While this manipulation may be undertaken by
firms, the primary focus of this study is not to examine how working capital management
components are manipulated by firms in boosting sales/earnings but to examine the relationship
between various working capital management components and profitability of South African
firms listed on the JSE.
2.4 Conclusion of Literature Review
The upshot of the foregoing literature review on working capital management is that while
working capital management components may impact on profitability of firms, there is ambiguity
regarding both the appropriate variables that might serve as proxies for working capital
management as well as on the direction of the impact of different components on profitability. For

21
example, in his research, Mathuva (2010) finds that there exists a highly significant positive
relationship between the period taken to convert inventories into sales and profitability, which
finding is contrary to that of Deloof (2003) whose study findings conclude that there is a negative
relationship between days sales in inventory and profitability. This therefore shows that there is
no clear-cut direction of the relationship between any of the variables of working capital
management and firms‟ profitability. The differences in the direction of the impact could be
attributable to any one of the following factors: (1) different characteristics of firms per country,
(2) difference in the nature of the industries selected in different studies, and (3) differences in the
economic conditions for the selected time frames.
Also noted in literature review is that there is no clear-cut direction on the impact of capital
structure on profitability from one country to another. For example, findings by Salawu (2009)
show a negative relationship in clear contrast with findings by De Angelo and Masulis (1980) that
show a positive relationship.
The other consideration noted in literature review is that working capital management
components can be manipulated by firms in boosting sales. This however is not the focal point of
this study.

22
3 RESEARCH METHODOLOGY
3.1 Introduction
This chapter describes the methodology that will be followed in order to address the research
questions formulated in section 1.5. Section 3.2 discusses the data and data source with the
following section presenting the different variables used in the regression models. Section 3.2
further defines how variables used in the study are measured. Section 3.4 shows the predicted
direction of the impact of each respective explanatory on the profitability. It is followed by
section 3.5 which highlights the approach used in determining the economic boom period as well
the recession period. Section 3.6 presents the research design of the study. In essence, it gives a
description of the methodological approaches adopted in analysing the impact of working capital
management on profitability.
3.2 Data and data source
The data used in the study is solely accounting based data mainly contained in the firm‟s financial
statements. The financial statements are obtained from both I-Net Bridge and BF McGregor. The
following ratios were extracted from I-Net Bridge: (1) days sales in inventory, (2) days sales in
receivables, (3) days payables outstanding, and (4) current ratio. Ratios extracted from BF
McGregor are the debt to equity ratio and the operating profit margin. The other variables such as
cash conversion cycle and dummy variables were calculated from the extracted data.
Consistent with Lazaridis and Tryfonidis (2006) and Mathuva (2010) who collected financial data
of firms listed on respective stock exchanges, this paper collects data exclusively on JSE listed
firms. The reason we chose this market is primarily due to availability and reliability of the
financial statements in that they are subject to mandatory audit by recognised audit firms.
Furthermore, firms listed on the stock exchange present true operational results in comparison
with unlisted companies (Lazaridis and Tryfonidis, 2006). The number of all non-financial firms
across different sectors of the JSE whose data is available for the period under investigation
(2004-2010) totals 254 firms. Under these 254 firms, there are 1,461 firm year observations for
the seven year period starting in January 2004 to December 2010.

23
It is noted that while the focus of the study is to analyse all companies listed on the JSE, both I-
Net Bridge and BF McGregor do not have some working capital management components for
financial institutions that this study explores. For example, ratio of “days sales in inventory” is not
available under financial institutions given that financial institutions‟ current assets do not contain
inventory unlike non-financial institutions. In view of this nature of the financial statements for
the financial institutions, this study excludes financial institutions from the study and includes all
non-financial institutions across all sectors.
3.3 Variables and how they are measured
As mentioned in chapter 1, the explanatory variables to be used as proxies of working capital
management are (1) cash conversion cycle, (2) days sales in receivables, (3) days sales in
inventory, (4) days payables outstanding, and (5) current ratio. In addition, the seventh (7)
explanatory variable to be explored by the study is capital structure (whose proxy in this study is
debt to equity ratio) and the eighth (8) variable in the study is the market condition, which is used
to examine the difference and the extent (if any) of the impact of working capital, particularly
cash conversion cycle, on profitability as economic conditions change.
While this study explores the impact of the aforementioned seven variables on profitability, it is
noted that this list of the selected variables is not exhaustive as there are a number of liquidity and
capital structure measures that may impact profitability. The choice of explanatory variables is
based on the following factors: 1) alternative theories related to working capital management (for
example, one theory stating that a longer cash conversion cycle increases firm profitability given
that it leads to higher sales, and the opposing theory stating that corporate profitability decreases
as cash conversion cycle elongates, particularly if the costs of higher investment in working
capital rise faster than the benefits of holding more inventory and/or granting more trade credit to
customers) and 2) working capital management variables used in previous studies conducted in
other geographic jurisdictions such as Greece, Belgium, U.S., Kenya, and Turkey.

24
Below is a Table showing all variables used in the study. It is followed by a succinct description
of how they are measured.
Table 1: Variables used in the study
Variable Abbreviation
Cash Conversion Cycle CCC
Days Sales in Receivables DSR
Days Sales in Inventory DSI
Days Payables Outstanding DPO
Current Ratio CRA
Debt to Equity Ratio DTE
Operating Profit Margin OPM
Dummy Variable - Economic Conditions D^
Dummy Variable - Industry D^^
Cash Conversion Cycle
The cash conversion cycle is used as a measure to gauge profitability. It measures the net time
interval between actual cash expenditures on a firm‟s purchase of productive resources and the
ultimate recovery of cash receipts from product sales (Laughlin and Richards, 1980). It is
measured as follows:
CCC = DSR + DSI – DPO (1)
In turn, the three components of cash conversion cycle are specified below.
Days Sales in Receivables
Days sales in receivables measures the number of days it takes to collect cash from debtors. Fried
et al (2003) state that days sales in receivables measure the effectiveness of the firm‟s credit
policy. It indicates the level of investment in receivables needed to maintain the firm‟s sales level
and is measured as follows:
DSR= (Trade Receivables / Sales) * 365 (2)
Days Sales in Inventory

25
Days sales in inventory measures the number of days inventory is held by the company before it is
sold. The less number of days sales in inventory indicate that inventory does not remain in
warehouses or on shelves but rather turns over rapidly from the time of acquisition to sale (Fried
et al, 2003). This ratio is measured as follows:
DSI = (Inventory / Cost of Goods Sold) * 365 (3)
Days Payables Outstanding
Days payables outstanding measure the number of days a firm takes to pay its suppliers. Thus,
this ratio represents an important source of financing for operating activities. The ratio is
measured as follows:
DPO = (Accounts Payable / Purchases) * 365 (4)
Where purchases are computed as cost of goods sold plus the change in inventory.
The two other variables to be used in the study which do not form part of the cash conversion
cycle are given below:
Current ratio
Current ratio is the best-known and widely used ratio that measures short-term liquidity. In
essence, it measures the ability of the firm to meet its short-term obligations. While it might be
good for a firm to have a high current ratio as it indicates liquidity, it may also indicate inefficient
use of cash and other short-term assets. This ratio is measured as follows:
Current Ratio = Current Assets / Current Liabilities (5)
Capital Structure
Capital structure measures the extent to which a company is funded through debt relative to
equity. For the purpose of this study, the proxy for capital structure is the “debt to equity”, which
was readily available on I-Net Bridge. Debt is expressed as both current and long term debt.
While the definition of short-term debt used in practice may include operating debt (accounts
payable and accrued liabilities), short-term debt used in this particular study excludes operating

26
debt because: (1) it is a function of the firm‟s operations and its essential business and contractual
relationship to its suppliers rather than external lenders, and (2) the operating debt such as
accounts payable is already accounted for in equation 4 above (days payables outstanding). The
“debt to equity” ratio is expressed as follows:
Debt to Equity = (Total Debt / Total Equity) (6)
Dependant Variable: Profitability
Finally, the dependant variable used is operating profit margin (OPM). Unlike other researchers
such as Nasr and Raheman (2007) who used return on investment (ROI) as a profitability
measure, this study uses operating profit, consistent with researches by Deloof (2003) and Biger
et al (2010).
Operating profit margin measures profitability of sales resulting from regular business and
measures the proportion of a company's revenue left over after deducting direct costs and
overhead and before taxes and other indirect costs such as interest. It is selected in this research
as a profitability measure primarily because it is an operating ratio and relates with operating
explanatory variables used in the study, e.g. cash conversion cycle and days sales in inventory.
The OPM formula is as follows:
OPM = (Operating Income / Sales) * 100 (7)
Economic Conditions
Considering that the research analyses the impact of working capital management, particularly
cash conversion cycle, on profitability as economic conditions change, the years under economic
boom as well as economic recession are taken as dummies in ascertaining if economic conditions
have an impact on profitability as well as in determining the explanatory power (if any) of cash
conversion cycle as economic conditions change. The years under economic boom (years 2004 to
2007) are assigned dummy digit 0; i.e. D = 0, while the years under economic recession (years
2008 to 2010) are assigned D = 1.

27
Industry Variable
To determine if working capital management, particularly cash conversion cycle, impacts
profitability of industrial companies and the rest of the companies in other sectors different, the
study uses industry as a dummy, wherein D = 0 denotes industrial companies and D = 1 denotes
the rest of the firms from other sectors.
3.4 Variables Predicted Sign(s)
Table 2 below summarizes the theoretical predicted signs that each of the six explanatory
variables is expected to have on firm profitability. It shows that the relationship of each
explanatory variable with profitability could either be positive or negative.
Table 2: Proxy variables and predicted relationship
Proxy Variable Predicted Sign
1 Cash Conversion Cycle (CCC) +/-
2 Days Sales in Inventory +/-
3 Days Sales in Receivables +/-
4 Days Payable Outstanding +/-
5 Current Ratio +/-
6 Debt to Equity +/-
7 Dummy - Economic Conditions +/-
8 Dummy - CCC as Economic Conditions change +/-
9 Dummy - Industry +/-
3.5 Determining economic boom and recession periods
Blanchard (2011) states that while the recent global recession, which he defined as the general
slowdown in economic activity resulting in business cycle contraction, was triggered by the U.S.
housing price decline, its effects were enormously amplified throughout the world. He states that
from mid-2007 to the end 2008, stock prices lost more than half of their value. Blanchard (2011)
further states that although growth in advanced economies and emerging market countries is
different and that emerging market countries had less negative growth than advanced countries, -
2.5% and -4% in the last quarter of 2008 and the first quarter of 2009 respectively, compared to -
7.8% and -7.9% respectively for advanced countries (reflecting the fact that emerging countries
have higher average growth than advanced countries) the decrease in growth was however

28
roughly the same for both groups. Thus, the sharp decline in output in both groups marked a
global crisis.
In determining which period denotes economic boom and which one represents economic
recession, the research is guided by IMF data depicted in Fig 2 below.
Fig 2: Yearly Global GDP Growth
Source: IMF, International Financial Statistics (2009).
Fig 2 above shows that the GDP growth for the whole of the emerging markets was above 6%
from 2004 through to 2007, after which it drastically contracted. This data is in tandem with
another IMF data shown in Table 3 below which depicts a sharp decline in year on year South
African GDP growth from 2008.
In view of the foregoing, the period taken in this study to represent economic recession is 2008 to
2010. On the other hand, the period taken to represent economic boom period is 2004 to 2007
(wherein average growth for the emerging markets, which includes South Africa, was above 6%).

29
Table 3: South Africa - annual GDP growth
Source: Statistics South Africa (2011).
3.6 Research Design
3.6.1 Model Specifications
To analyse the impact of working capital management on profitability, the study uses the
following methods: (i) descriptive statistical analysis wherein a description of features of the data
in the study such as mean and standard deviation of each variable is presented; (ii) correlation
matrix, which measures the degree of association between all the variables under consideration. In
essence, the matrix explores whether or not the relationship between variables is positive or
negative, in addition to determining the degree of the association between variables under
consideration; and (iii) regression analysis is used to gauge the extent to which a unit change in
each respective explanatory variable has on profitability, while other independent variables are
held fixed. Pooled ordinary least squares method is used in regression analysis, wherein time
series and cross-sectional observations is combined in determining the causal relationship
between profitability variable and the independent variables used in the study.

30
3.6.2 General Regression Model
The impact of working capital management components on profitability is modelled using the
following general regression equation:
(8)
Where: Yit = Operating Profit Margin of firm i at time t.
αo = The intercept of equation
βi = Coefficient of Xit
Xit = Independent variable at time t.
t = time = 1, 2…. 7 years (from year 2004 to 2010)
εit = The error term.
The research uses panel data regression analysis of cross-sectional and time series data. In line
with studies by Deloof (2003), Garcia-Teruel and Martinez-Solano (2006), and Mathuva (2010),
this study determines the impact of working capital on profitability using pooled regression
ordinary least squares, wherein each respective variable for all the companies under study and for
all the corresponding years is pooled together in a single column in running the ordinary least
squares regression models. While some researchers such as Dermirgunes and Samiloglu (2008)
and Mathuva (2010) used fixed effects regression model, which, according to Mathuva (2010),
explains the variations in profitability within firms, this study uses the pooled ordinary least
squares regression model which explains the variations in profitability between firms. The choice
of the model is underpinned by the fact that the aim of this research is not necessarily to examine
variations in profitability within firms but to examine variations in profitability between all firms
listed on the JSE during an economic recession as well as during an economic boom. According
to Nasr and Raheman (2007), pooled regression model is one where both intercepts and slopes are
constant, wherein cross-section firm data and time series data for each variable are pooled
together in a single column.
Given that CCC in equation 1 is made up of other ratios used in the study, namely DSR, DSI and
DPO, to avoid multicollinearity problem, defined by Koop (2006) as a problem that arises if some

31
or all of the explanatory variables are highly correlated with one another, in addition to avoiding
endogeniety problem wherein an exogenous explanatory variable impacts on another explanatory
variable within the same regression model and therefore distorting impact of both explanatory
variables on independent variable, the study uses different model specifications wherein the
model containing CCC ratio is separated from the one containing DSR, DSI, and DPO ratios.
3.6.3 Specific Regression Models
(i) Model specification (I) – containing Cash Conversion Cycle
OPMit = α0 + β1CCCit + β2CRAit + β3DTEit + β4Dit + β5CCCit*Dit + εit (9)
Where: α0 = intercept of the regression,
β1, β2, β3, β4 & β5 = coefficients on each respective explanatory variable,
OPMit = operating profit margin – for company i at corresponding time t.
CCCit = cash conversion cycle - for company i at corresponding time t.
CRAit = current rati0 - for company i at corresponding time t.
DTEit = debt to equity - for company i at corresponding time t.
Dit = dummy representing economic conditions, for company i at time t.
CCC*Dit = transformed variable – working capital during different economic
conditions for company i at corresponding time t,
t = time; year 1, 2…. 7 (from year 2004 to 2010), and
εit = is the error term of the regression - for company i at time t.
Model specification (I) above determines the impact of: (1) cash conversion cycle, (2) current
ratio, and (3) debt to equity ratio on profitability for all the selected years, i.e. from year 2004 to
2010. In addition, the specification gauges whether or not profitability of South African
companies is affected by changes in economic conditions, i.e. as the economy moves from a
boom to a recession. The dummy variable is denoted as follows: D = 0 represents years under
economic boom and D =1 represents years under economic recession.

32
Also, given that one of the objectives of the study is to determine how profitability of South
African firms is affected by working capital management; whose primary proxy under this study
is the cash conversion cycle, as economic conditions change, the study uses model specification
(I) above to measure the impact of cash conversion cycle as the economy moves from a boom to a
recession. The methodological approach is structured such that the CCC ratio for each company is
multiplied by the Dummy variable for the corresponding year, wherein D = 0 denotes economic
boom and D = 1 denotes economic recession. Profitability is then regressed against this
transformed variable (CCC*D – market conditions).
In essence, a resultant positive coefficient on this transformed variable will indicate that an
increase in the length of the cash (operating) cycle tends to increase profitability during an
economic recession (D = 1) than during an economic boom. In the same vein, a negative
coefficient will indicate that an increase in the length of the cash conversion cycle tends to lessen
profitability during an economic recession than during an economic boom.
(ii) Model specification (II) – without unmodified Cash Conversion Cycle
OPMit = α0 + β1DSIit + β2DSRit + β3DPOit + β4CCCit*Dit + εit (10)
Where: α0 = intercept of the regression,
β1, β2, β3, and β4 = coefficients on each respective explanatory variable,
OPMit = operating profit margin – for company i at time t,
DSIit = days sales in inventory – for company i at time t,
DSRit = days sales in receivables – for company i at time t,
DPOit = days payable outstanding – for company i at time t,
t = time; year 1, 2…. 7 (from year 2004 to 2010), and
CCC*Dit = transformed variable – industry, for company i at time t, and
Model specification (II) above measures the impact of the rest of working capital management
components used in the study, namely days sales in receivables, days sales in inventory, days
payables outstanding, and industry. Following research question 3 posed in chapter 1, section 1.5,
33
which seeks to determine if liquidity affects profitability of industrial companies and the rest of
the companies in other sectors different, the study uses a dummy variable, wherein dummy (D) in
model specification (II) above denotes the industry (i.e. D = 0 denotes companies in the industrial
sector and D = 1 denotes companies in the rest of the sectors). The transformed variable (CCC*D
- industry) in model specification (II) above determines if cash conversion cycle impacts on
profitability of companies in the industrial sector and those in the rest of the other sectors
different. In the same vein as the interpretation to be made under model specification (I), a
resultant positive coefficient on this transformed industry variable under model specification (II)
indicates that an increase in the length of the cash (operating) cycle tends to increase profitability
of companies in the industrial sector than those in the rest of the other sectors and a negative sign
indicates the opposite.
3.7 Diagnostic Tests
Diagnostic tests are robust statistical tests carried out to verify if the data used have met the
assumptions underlying the ordinary least squares regression and where possible to remove
problems associated with panel time series data. Some of the problems of panel time series data
include heteroskedasticity, multicollinearity, and autocorrelation, among others. The diagnostic
tests carried out in the study are detailed below.
3.7.1 Test for Heteroskedasticity
One of the main assumptions for the ordinary least squares regression is the homogeneity of the
variance of the residuals. If the variance of the residuals is non-constant, then the residual
variance is heteroskedastic making the regression estimates, namely coefficients and standard
errors, to be biased if the models are not re-specified or variables not transformed. As per
equation 11 below, heteroskedasticity means that the variance of the error term is not constant
overtime.
≠ for all i, (11)

34
This study uses the Breusch-Pagan test in all the two regression model specifications to verify
whether or not heteroskedasticity is present in the models. The null hypothesis is that the variance
of the residuals is homogenous. Thus, if the p-value is very small (less than 0.05), we would reject
the null hypothesis and accept the alternative hypothesis that the variance is not homogenous.
Tables 4 and 5 below present the Breusch-Pagan test results for heteroskedasticity for model
specification I and II respectively. The results show that the variance of the error term in each
model specification is not constant, which if not corrected leads to biased standard errors. The
presence of heteroskedasticity was however controlled by using the “robust” command when
performing both regressions, resulting in generation of “robust standard errors”. Montgomery and
Peck (2007) state that the “robust standard errors” address the problem of errors that are not
independent and identically distributed and that the use of “robust standard errors” does not
change the coefficient estimates provided by the ordinary least squares, but change the standard
errors and significance tests.
Table 4: Breusch-Pagan Test for Heteroskedasticity – Model I
---------------------------------------------------
estat hettest
Breusch-Pagan / Cook-Weisberg test for heteroskedasticity
Ho: Constant variance
Variables: fitted values of opm
chi2(16) = 320.31
Prob > chi2 = 0.0000
---------------------------------------------------
Table 5: Breusch-Pagan Test for Heteroskedasticity – Model II
---------------------------------------------------
estat hettest
Breusch-Pagan / Cook-Weisberg test for heteroskedasticity
Ho: Constant variance
Variables: fitted values of opm
chi2(115) = 1139.91
Prob > chi2 = 0.0000
---------------------------------------------------
35
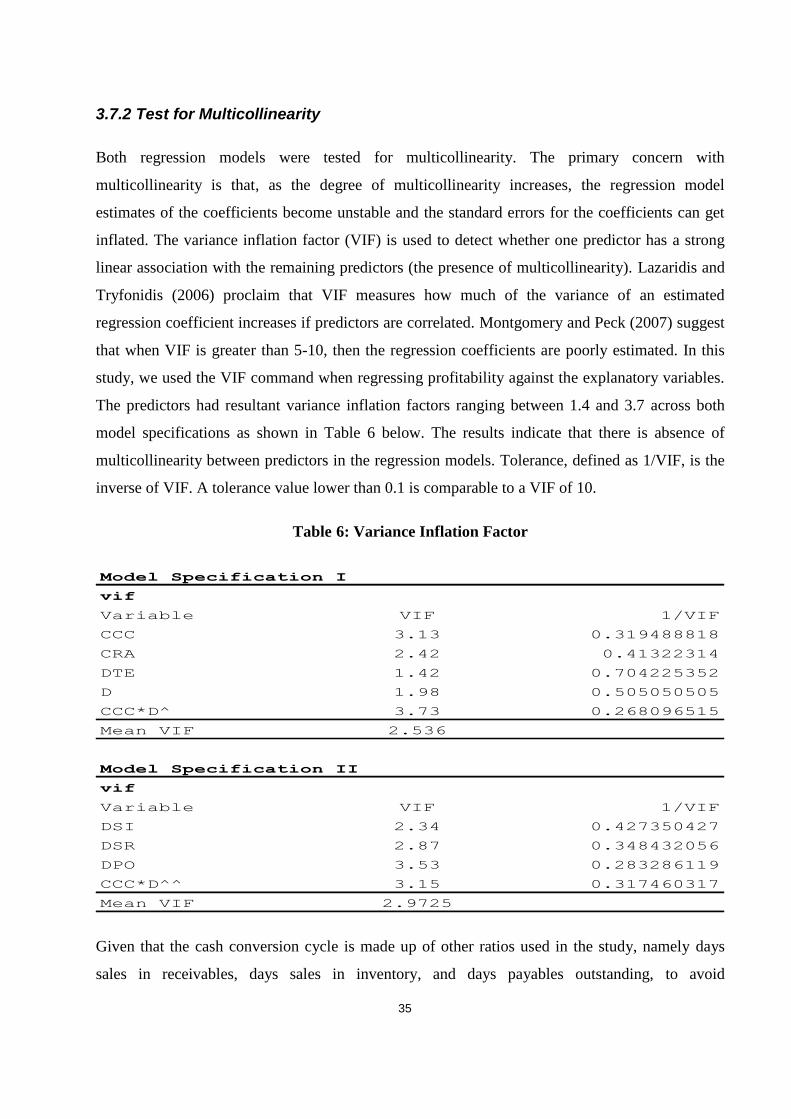
3.7.2 Test for Multicollinearity
Both regression models were tested for multicollinearity. The primary concern with
multicollinearity is that, as the degree of multicollinearity increases, the regression model
estimates of the coefficients become unstable and the standard errors for the coefficients can get
inflated. The variance inflation factor (VIF) is used to detect whether one predictor has a strong
linear association with the remaining predictors (the presence of multicollinearity). Lazaridis and
Tryfonidis (2006) proclaim that VIF measures how much of the variance of an estimated
regression coefficient increases if predictors are correlated. Montgomery and Peck (2007) suggest
that when VIF is greater than 5-10, then the regression coefficients are poorly estimated. In this
study, we used the VIF command when regressing profitability against the explanatory variables.
The predictors had resultant variance inflation factors ranging between 1.4 and 3.7 across both
model specifications as shown in Table 6 below. The results indicate that there is absence of
multicollinearity between predictors in the regression models. Tolerance, defined as 1/VIF, is the
inverse of VIF. A tolerance value lower than 0.1 is comparable to a VIF of 10.
Table 6: Variance Inflation Factor
Model Specification I
vif
Variable VIF 1/VIF
CCC 3.13 0.319488818
CRA 2.42 0.41322314
DTE 1.42 0.704225352
D 1.98 0.505050505
CCC*D^ 3.73 0.268096515
Mean VIF 2.536
Model Specification II
vif
Variable VIF 1/VIF
DSI 2.34 0.427350427
DSR 2.87 0.348432056
DPO 3.53 0.283286119
CCC*D^^ 3.15 0.317460317
Mean VIF 2.9725
Given that the cash conversion cycle is made up of other ratios used in the study, namely days
sales in receivables, days sales in inventory, and days payables outstanding, to avoid

36
multicollinearity problem, the two model specifications were developed separating one model
containing the cash conversion cycle from the other containing days sales in receivables, days
sales in inventory, and days payables outstanding.
3.8 Summary
This chapter described the methodological approaches followed in examining the impact of all
selected working capital management components on the profitability of JSE listed companies. In
particular, the approaches used in the study are: (1) descriptive statistics, (2) correlation matrix,
and (3) regression analysis. Regression model specification I was developed to examine the
impact on the endogenous variable (profitability) by five exogenous working capital management
variables, namely cash conversion cycle, current ratio, debt to equity, years, and economic
conditions. On the other hand, model specification II is used to regresses profitability against days
sales in inventory, days sales in receivables, days payables outstanding, and industry. The models
were separated into two so as to circumvent multicollinearity problem given that the cash
conversion cycle is made up of days sales in inventory, days sales in receivables and days
payables outstanding.
Diagnostic tests were carried out to verify if the data used have met the assumptions underlying
the ordinary least squares regression and where possible to remove problems associated with
panel time series data. Although the diagnostic results show presence of heteroskedasticity in both
models, this problem was however controlled by using “robust standard errors” resulting in non-
spurious regression results, which are presented in Chapter 4 below.
37
4 PRESENTATION OF RESULTS
4.1 Introduction
This chapter presents results obtained by the models. First, descriptive statistics showing relevant
phenomena such as median and mean of variables used in the study are presented under section
4.2. It is followed by section 4.3 which presents the conventional correlation matrix which
measures the degree of association between different variables under consideration.
Section 4.4 presents the regression analysis which outlines an in-depth examination of the causal
relationship between profitability of South African firms and the various explanatory variables
under consideration. The regression analysis uses pooled ordinary least squares regression to
determine the influence of the various explanatory variables under consideration on profitability.
Lastly, a summary highlighting key findings of the study is presented under the last section.
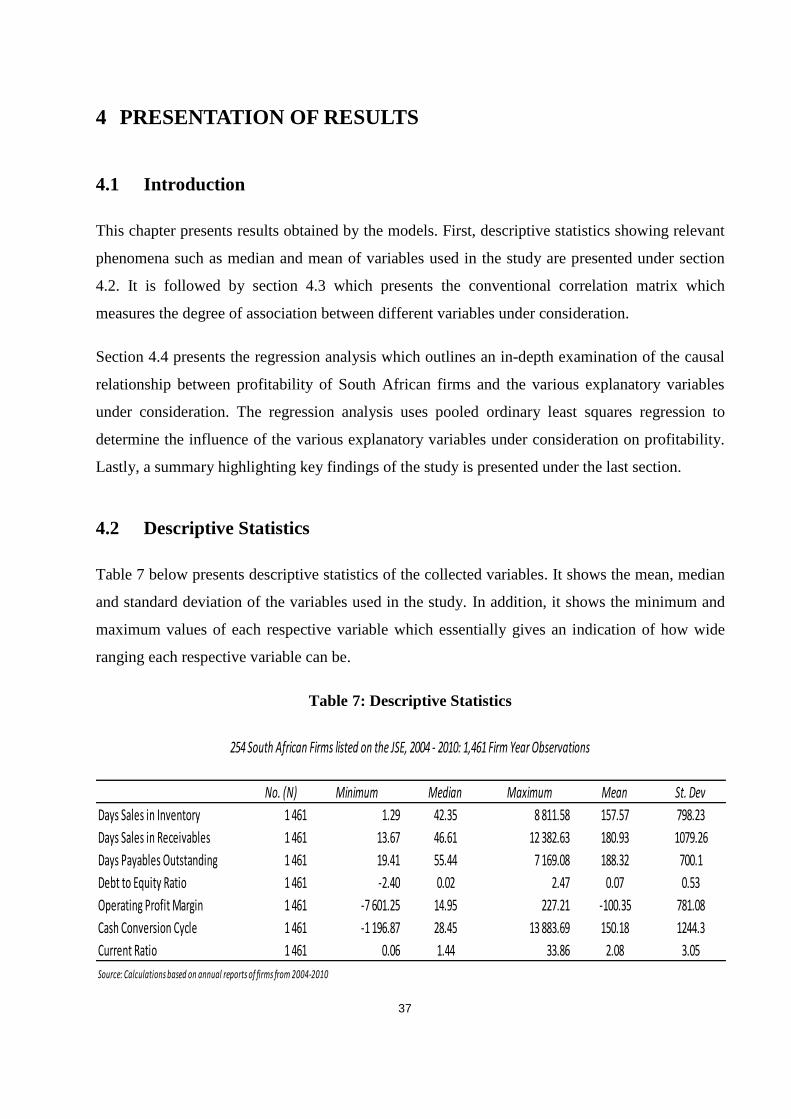
4.2 Descriptive Statistics
Table 7 below presents descriptive statistics of the collected variables. It shows the mean, median
and standard deviation of the variables used in the study. In addition, it shows the minimum and
maximum values of each respective variable which essentially gives an indication of how wide
ranging each respective variable can be.
Table 7: Descriptive Statistics
No. (N) Minimum Median Maximum Mean St. Dev
Days Sales in Inventory 1 461 1.29 42.35 8 811.58 157.57 798.23
Days Sales in Receivables 1 461 13.67 46.61 12 382.63 180.93 1079.26
Days Payables Outstanding 1 461 19.41 55.44 7 169.08 188.32 700.1
Debt to Equity Ratio 1 461 -2.40 0.02 2.47 0.07 0.53
Operating Profit Margin 1 461 -7 601.25 14.95 227.21 -100.35 781.08
Cash Conversion Cycle 1 461 -1 196.87 28.45 13 883.69 150.18 1244.3
Current Ratio 1 461 0.06 1.44 33.86 2.08 3.05
Source: Calculations based on annual reports of firms from 2004-2010
254 South African Firms listed on the JSE, 2004 - 2010: 1,461 Firm Year Observations
38
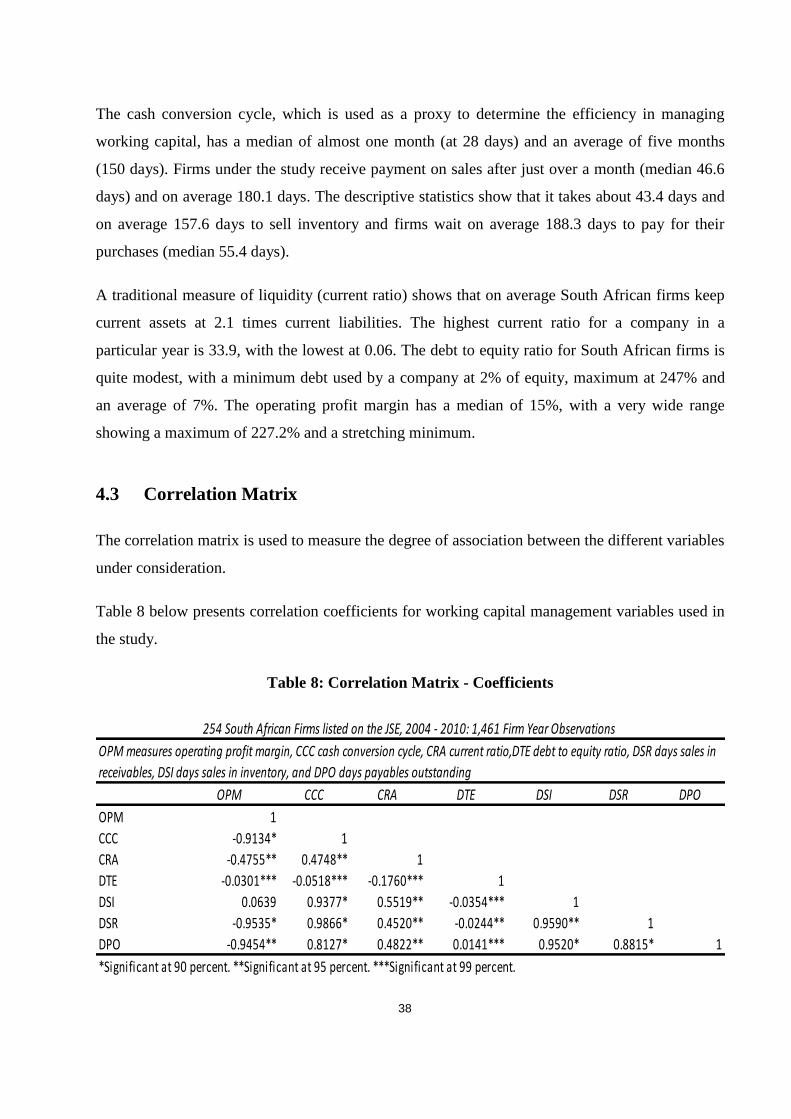
The cash conversion cycle, which is used as a proxy to determine the efficiency in managing
working capital, has a median of almost one month (at 28 days) and an average of five months
(150 days). Firms under the study receive payment on sales after just over a month (median 46.6
days) and on average 180.1 days. The descriptive statistics show that it takes about 43.4 days and
on average 157.6 days to sell inventory and firms wait on average 188.3 days to pay for their
purchases (median 55.4 days).
A traditional measure of liquidity (current ratio) shows that on average South African firms keep
current assets at 2.1 times current liabilities. The highest current ratio for a company in a
particular year is 33.9, with the lowest at 0.06. The debt to equity ratio for South African firms is
quite modest, with a minimum debt used by a company at 2% of equity, maximum at 247% and
an average of 7%. The operating profit margin has a median of 15%, with a very wide range
showing a maximum of 227.2% and a stretching minimum.
4.3 Correlation Matrix
The correlation matrix is used to measure the degree of association between the different variables
under consideration.
Table 8 below presents correlation coefficients for working capital management variables used in
the study.
Table 8: Correlation Matrix - Coefficients
OPM CCC CRA DTE DSI DSR DPO
OPM 1
CCC -0.9134* 1
CRA -0.4755** 0.4748** 1
DTE -0.0301*** -0.0518*** -0.1760*** 1
DSI 0.0639 0.9377* 0.5519** -0.0354*** 1
DSR -0.9535* 0.9866* 0.4520** -0.0244** 0.9590** 1
DPO -0.9454** 0.8127* 0.4822** 0.0141*** 0.9520* 0.8815* 1
*Significant at 90 percent. **Significant at 95 percent. ***Significant at 99 percent.
254 South African Firms listed on the JSE, 2004 - 2010: 1,461 Firm Year Observations
OPM measures operating profit margin, CCC cash conversion cycle, CRA current ratio,DTE debt to equity ratio, DSR days sales in
receivables, DSI days sales in inventory, and DPO days payables outstanding

39
The results in Table 8 above show that there is a negative relationship between profitability
(measured as OPM) and the following measures of working capital management: cash conversion
cycle, days sales in receivables, days payables outstanding, current ratio, and debt to equity. The
negative relationship between profitability and cash conversion cycle is consistent with Deloof‟s
(2003) view that the time lag between the expenditure for purchases of raw materials and the
collection of sales of finished goods can be too long, and that decreasing this time lag increases
profitability.
In the same vein, the negative relationship between profitability and days sales in receivables is
consistent with the view that the less the time taken by a firm‟s customers to pay their bills, the
more cash is available to the firm to replenish the inventory hence leading to more sales which
result to an increase in profitability (Mathuva, 2010). The results also show that there is a negative
relationship between profitability and days payables outstanding. This negative relationship is
consistent with the view that less profitable firms wait longer to pay their bills in which case
profitability affects days payables outstanding policy as opposed to days payables outstanding
policy affecting profitability. An alternative explanation proffered by Deloof (2003) is that a
negative relationship between the number of days payables outstanding and profitability could be
that speeding up payments to suppliers might increase profitability primarily because firms often
receive a substantial discount for prompt payment.
Current ratio has a negative relationship with profitability indicating an inverse relationship
between profitability and liquidity. Also, results in Table 8 indicate that profitability is inversely
proportional to debt. In other words, the larger the debt, the lower the profitability. The positive
relationship between profitability and days sales in inventory can be attributable to having costs of
higher investment in inventory not rising faster than the benefits of holding more inventory,
particularly in an inflationary environment.
The other expected outcome shown in Table 8 is that there is a positive relationship between days
sales in inventory and the cash conversion cycle. This positive relationship means that if a firm
takes an extended period of time to sell inventory, it will result in the cash conversion cycle
increasing.

40
The correlation matrix analyses indicate that in general, there exists an inverse relationship
between profitability of South African firms and the majority of liquidity measures. The results
indicate that excessive levels of working capital result in decreased profitability. The analyses
also indicate that high levels of debt adversely impact on profitability of South African firms.
Although the correlation matrix gives proof of the relationship between variables, its shortcoming,
as spelt out by Deloof (2003), is that it does not identify causes from consequences. For example,
it is hard to say whether a shorter cash conversion cycle leads to higher profitability or a higher
profitability is as a result of the shorter conversion cycle. This therefore means that care must be
exercised when interpreting correlation coefficients because they cannot provide reliable indicator
of association in a manner which controls for additional explanatory variables. This is further
proclaimed by Mathuva (2010) who state that examining a simple correlation in a conventional
correlation matrix does not take into account each variable‟s correlation with all other explanatory
variables. The main analysis will be derived from the regression models estimated using ordinary
least squares, which is subject of the following section.
4.4 Regression Analysis
Following descriptive statistics and correlation matrix presented in sections 4.2 and 4.3
respectively, the regression analysis in this section is used to shed more light on the impact of
working capital management components on firm profitability. Following model specifications
(I), and (II), the study examines the endogenous variable which is profitability (measured by
operating profit margin) against the nine exogenous variables.
Consistent with Garcia-Teruel and Martinez-Solano (2006) and Mathuva (2010), the study
estimates determinants of corporate profitability using pooled ordinary least squares which
explain variations in profitability between firms. The determinants of profitability are investigated
for all the 1,461 firm year observations from 2004 to 2010. Table 9 below presents empirical
results for all the two regression model specifications.

41
Table 9: Regression - Relationship between profitability and working capital
Independent variables Coefficient Standard error P -Values t -stat R Square
Intercept 60.82 10.5833 1.10 x 10-08 5.7470
CCC -0.57 0.0064 0.0000 -90.162
CRA -15.75 2.6089 1.98 x 10-09 -6.0374
DTE -106.17 13.3194 3.15 x 10⁻¹⁵ -7.9712
D -94.71 13.9495 1.64 x 10⁻¹¹ -6.7893
CCC*D^ 1.09 0.0484 6.21 x 10-97 22.5668
Intercept 69.24 4.4344 6.16 x 10-51 15.6146
DSI 0.01 0.0305 0.6726 0.4227
DSR -0.40 0.0145 3.73 x 10-132 -27.2102
DPO -0.53 0.0209 6.62 x 10-118 -25.3721
CCC*D^^ 0.10 0.2191 0.6329 0.4777
Where:
Both regressions were performed at 95 percent confidence levels and are all statistically significant
Model Specification II
95.93%
D^ : denotes dummy variable representing years (economic conditions)
D^^ : denotes dummy variable representing industry
254 South African Firms listed on the JSE, 2004 - 2010: 1,461 Firm Year Observations
Dependent variable = OPM
OPM measures operating profit margin, CCC cash conversion cycle, CRA current ratio, DTE debt to equity ratio,
DSR days sales in receivables, DSI days sales in inventory, and DPO days payables outstanding
Model Specification I
88.68%
4.4.1 Model specification (I)
Model specification (I) regressed profitability against cash conversion cycle, current ratio, debt to
equity ratio, and market condition. In addition, the model regressed profitability against
transformed variable (CCC*D^) wherein dummy still denotes the years under economic boom
and recession. This transformed variable (economic condition) examines the impact of cash
conversion cycle on profitability when economic conditions change from boom to recession (D =
0 represents years under economic boom and D = 1 represents years under economic recession).
Profitability was regressed separate against CCC and other ratios that have ratios making up CCC
so as to avoid problems of multicollinearity and endogeniety.

42
The R square in model specification (I) is high at 88.68%. This high level of R square indicates
that the explanatory variables in the regression, taken together, help explain profitability. With a
significant F of less than 0.05, the variables are significant in explaining profitability at 95%
confidence interval. The relationships between the 5 explanatory variables used in model
specification (I) and profitability are explained below:
(i) Relationship Between Cash Conversion Cycle and Profitability
The coefficient on the cash conversion cycle is negative and statistically significant (p-value <
0.05). This indicates that when the net time interval between actual cash expenditures on a firm‟s
purchase of productive resources and the ultimate recovery of cash receipts from product sales
shortens by a day, operating profit margin of South African firms listed on the JSE increases by
0.57%, holding all other explanatory variables constant. In essence, this negative relationship
suggests that corporate managers can increase profitability of their firms by shortening the time
lag between a firm‟s expenditure for purchases of raw materials and the collection of sales of
finished goods. This finding is consistent with findings by Mathuva (2010) whose explanation for
the negative relationship is that by minimizing investment in current assets, firms boosts their
profits as liquid cash, which has low returns, is not maintained in the business for too long as it is
used to generate profits for the firm.
(ii) Relationship Between Current Ratio and Profitability
Empirical results of the study show that current ratio has a negative relationship with profitability.
The results are statistically significant with a p-value of less than 0.05 at 5% significance level.
This shows that current ratio has explanatory power in explaining variation in profitability. The
current ratio coefficient of -15.75 indicates that an increase in current ratio by 1x leads to a
decrease in operating profit margin by 15.75% holding all other factors constant.
The upshot of this finding is that there exists an inverse relationship between liquidity and
profitability. While empirical results show that reducing current ratio increases profitability of
South African firms, it is to be noted that disregarding liquidity may result in insolvency and
bankruptcy (Nasr and Raheman, 2007). The inference of this trade-off between profit maximising
and liquidity preservation is that corporate managers need to minimise current ratio to the extent
that it maximises profitability without compromising the solvency and bankruptcy of a firm.

43
(iii) Relationship Between Debt to Equity and Profitability
The study uses debt to equity as a proxy for capital structure. The results of the regression show a
negative coefficient which is statistically significant at 95% confidence level. The results indicate
that a 1% increase in debt relative to equity leads to a 1.06% decrease in operating profit margin,
ceteris paribus. This result is in conformity with findings by Salawu (2009) who asserts that the
negative relationship between debt to equity ratio and profitability has implications for financial
stability as the higher ratio makes the corporate sector highly vulnerable to changes in economic
conditions and may result in economy wide impact of a financial crisis.
Furthermore, what this means is that management should strive to identify the optimal capital
structure of the firm and also maintain it since it represents the point where the market value of
the firm is maximized.
(iv) Relationship Between Economic Conditions and Profitability
Hamlin and Heathfield (1991) proclaim that the ability of managers to respond to rapidly
changing economic circumstances is a vital aspect of their companies‟ competitiveness and that
those companies that can react quickly and appropriately to unanticipated events such as raw
material price shocks gain a competitive advantage over their rivals. It is on the back of this
proclamation that this study examines if changes in economic conditions have any impact on
profitability of South African firms and if so, how so.
The coefficient is statistically significant (p-value < 0.05) and negative, as can be seen under
annexure 1. The negative coefficient indicates that when the economy moves from an economic
boom to an economic recession, profitability of companies tend to decrease. Intuitively, this result
makes sense given that economic recession results in slowdown in economic activity which in
turn leads to business contraction and reduction in profitability.
(v) Relationship Between CCC under different Economic Conditions and Profitability
Following research question 4 under section 1.5 in chapter 1 which seeks to examine if there is a
difference in how working capital management, particularly the cash conversion cycle, impacts on
profitability as the economy moves from a boom to a recession, the empirical results of the study
show a positive coefficient of 1.09 on this transformed cash conversion cycle, which is

44
statistically significant at 5% significance level. The positive coefficient on the transformed cash
conversion cycle variable indicates that an increase in the length of the cash (operating) cycle
tends to increase profitability during an economic recession (D = 1) than during an economic
boom. This positive relationship, which is contrary to the negative relationship between normal
cash conversion cycle and profitability, could be attributed to the fact that during an economic
recession, trading conditions and demand for a firm‟s products tends to be subdued to an extent
that a firm adopts a generous trade credit policy in an attempt to attract sales and increase
profitability. The generous trade credit policy essentially increases the time lag between actual
cash expenditures on a firm‟s purchase of productive resources and the ultimate recovery of cash
receipts from product sales, with its net effect being that of increasing profitability.
The other reason for the positive relationship could be that during economic recession, firm‟s
debtors are likely to pay for the products purchased if they are given extended payment period as
their (debtors‟) cash inflows will be spread-out and protracted due to slowdown in trading
conditions. Thus, without the cushioning payment period offered to debtors, they (debtors) are
unlikely to have sufficient cash resources to meet payment obligations. The implication of this is
that, corporate managers need to assess their debtors‟ ability to pay during different economic
conditions and restructure the trade credit policy to ensure it does not adversely impact on
profitability.
4.4.2 Model specification (II)
In model specification (II), profitability is regressed against the rest of the working capital
management components used in the study, namely: days sales in inventory, days sales in
receivables, days payable outstanding, and industry. R square for this model specification is also
high at 95.93% and statistically significant with a significant F of less than 0.05 at 95%
confidence interval.
The relationships between these four explanatory variables used in model specification (II) and
profitability are explained below:
(vi) Relationship Between Days Payables Outstanding and Profitability

45
The coefficient on days payables outstanding is negative and highly significant (p-value < 0.05)
suggesting that a decrease in the number of days accounts payable by one day leads to an increase
in operating profit margin by 0.53%. The positive relationship found in the study is consistent
with findings by Deloof (2003) but contrary to findings by Mathuva (2010) whose explanation for
a positive relationship is that the longer a firm delays its payments to its creditors, the higher the
level of working capital levels it reserves and uses in order to increase profitability. On the
contrary, results of South African firms listed on the JSE show that less profitable firms have high
number of days in accounts payable suggesting that less profitable firms wait longer to pay their
bills.
(vii) Relationship Between Days Sales in Receivables and Profitability
Consistent with Garcia-Teruel and Martinez-Solano (2006) and Nasr and Raheman (2007)
findings, a negative relationship exists between days sales in receivables and profitability of South
African firms (p-value < 0.05). This result implies that an increase in number of days accounts
receivable by one day leads to a decline in operating profit margin by 0.40%, suggesting that
firms can improve their profitability by reducing the number of days accounts receivables are
outstanding. The interpretation of this result is that the less the time it takes for customers to pay
their bills, the more cash is available to replenish inventory hence higher sales realized leading to
higher profitability of the firm. The implication of this finding is that for a firm to improve its
profitability, there needs to be adoption of a more restrictive trade credit policy giving customers
less time to make their payments.
(viii) Relationship Between Days Sales in Inventory and Profitability
The days sales in inventory coefficient is positive but not significantly different from zero (p-
value = 0.67). Although not statistically significant, the positive coefficient from the study is
contrary to findings by Deloof (2003) and Lazaridis and Tryfonidis (2006) but in line with
findings by Mathuva (2010) who asserts that maintaining high levels of inventory reduces the cost
of possible interruptions in the production process and the loss of business due to scarcity of
products. Furthermore, maintaining high levels of inventory helps in reducing the cost of
supplying the products and protects the firm against price fluctuations as a result of
macroeconomic factors.

46
(ix) Relationship Between Industry and Profitability
Model specification (II) further regressed profitability against the transformed variable
(CCC*D^^ - industry) representing industry, wherein the dummy D = 0 denotes companies in the
industrial sector and D = 1 denotes the rest of the companies listed on the JSE. This variable
examines if cash conversion cycle impacts profitability of industrial companies and the rest of the
companies different. Given that the assets of production and manufacturing firms (which are
classified under the industrial sector) are mostly composed of current assets, the research
examines whether or not the direction and extent of the impact of the cash conversion cycle on
profitability changes on the back of considerably disparate working capital levels. The findings of
the study show a positive coefficient on this transformed (industry) cash conversion cycle variable
which could imply that an increase in the length of the cash (operating) cycle tends to increase
profitability of companies in the industrial sector than those in the other sectors. The result is
however not statistically significant with a p-value of 0.63. This indicates that this transformed
industry variable does not have any explanatory power in explaining variation in profitability
between companies in the industrial sector and those in the rest of the other sectors. In essence,
we cannot conclude that working capital management impacts profitability of companies in the
industrial sector and those in the rest of the other sectors different. The implication of this finding
is that strategic working capital management initiatives that enhance profitability of industrial
companies also enhance profitability of companies in the rest of the other sectors.
4.5 Summary
The upshot of the foregoing presentation of empirical results is that there exists statistically
significant relationship between liquidity measures and profitability of South African firms listed
on the JSE. In particular, the results reveal a negative relationship between cash conversion cycle;
a key proxy of working capital management that measures the net time interval between actual
cash expenditures on a firm‟s purchase of productive resources and the ultimate recovery of cash
receipts from product sales, and profitability. This negative relationship suggests that managers
can create value for the shareholders of the firm by reducing the cash conversion cycle to an
extent that it enhances firm profitability.

47
Also, results show that other measures of working capital management used in the study, namely:
days sales in receivables, days payables outstanding, current ratio, and debt to equity ratio have
explanatory power in explaining variation in profitability. These four variables all have negative
relationship with profitability, respectively.
The only measure of working capital management used in the study that shows a positive
relationship with profitability is days sales in inventory. While the coefficient on this variable
(days sales in inventory) is not statistically significant (p-value = 0.67), the explanation for the
positive relationship could be that maintaining high levels of inventory reduces the cost of
possible interruptions in the production process. Also, it could mean that maintaining high levels
of inventory helps in reducing the cost of supplying the products and protects the firm against
price fluctuations as a result of macroeconomic factors.
The interesting outcome of the study is that whereas normal cash conversion cycle is negatively
related with profitability, the transformed cash conversion cycle dummy variable (liquidity under
different economic conditions) used to examine how cash conversion cycle impacts on
profitability when macroeconomic conditions change - from boom to recession - is positively
related with profitability. This positive relationship, which is statistically significant, indicates that
an increase in the length of the cash cycle tends to increase profitability during an economic
recession than during an economic boom, inferring that trading conditions and demand for a
firm‟s products tend to be subdued during a recession to an extent that firms adopt a generous
trade credit policy so as to attract sales and increase profitability. Thus, the generous trade credit
policy leads to an increase in the time lag between actual cash expenditures on a firm‟s purchase
of productive resources and the ultimate recovery of cash receipts from product sales, however, its
net effect is increasing profitability. The implication of the respective relationships, which are
different, between (1) the normal cash conversion cycle and profitability and (2) the transformed
cash conversion cycle variable under different economic conditions and profitability is that
corporate managers need to restructure their trade credit policy and change it accordingly as
macroeconomic environment changes in ensuring that profitability remains at least afloat. The
other notable outcome of the results is that in general, profitability of companies tends to decrease
when the economy moves from an economic boom to an economic recession. This result makes
sense considering the slowdown in economic activity during an economic recession as there is
business contraction which in turn leads to reduction in profitability.

48
5 DISCUSSION AND CONCLUSION
5.1 Introduction
This chapter discusses and compares results of the study with findings by other studies elsewhere
that explored the relationship between working capital management and firm profitability. Section
5.2 highlights linkages between findings of this study and those of previous studies. Furthermore,
the section provides suggestions on what could be the underlying differences between findings of
this study and those of previous studies. Section 5.3 concludes the chapter and is followed by
section 5.4 which suggests further work to be done in congruence with this study.
5.2 Discussion
This study explored the relationship between a number of working capital management
components and profitability of South African firms listed on the JSE given the dilemma that
exists between liquidity preservation and profitability. This dilemma is evident in that while
increasing the length of the cash (operating) cycle might increase firm profitability given that it
leads to higher sales, primarily as a result of generous trade credit policy that allows customers to
assess product quality before paying, as well as a result of a reduction in risk of stock-out, which
reduces the risk of business operations interruption, firm profitability may however decrease as
the length of the cash (operating) cycle elongates particularly in instances where the costs of
higher investment in working capital rise faster than the benefits of holding more inventory and/or
granting more trade credit to customers. Thus, in examining how South African firms are
impacted by working capital management components, corporate managers will be better
equipped in designing policies that ensure enhancement of firm profitability.
Furthermore, knowing how the impact of working capital management components changes as
macroeconomic conditions on the ground change is imperative in that, as proffered by Hamlin and
Heathfield (1991), the ability of managers to respond to rapidly changing economic circumstances
is a vital aspect of their companies‟ competitiveness and that reacting quickly and appropriately to
changing events and shocks gives a firm competitive advantage over its rivals.
49
In line with findings by Deloof (2003), Garcia-Teruel and Martinez-Solano (2006), Lazaridis and
Tryfonidis (2006), Mathuva (2010), Biger et al (2010), empirical results of this study show a
significant negative relationship between accounts receivables (days sales in receivables) and
corporate profitability. This negative relationship indicates that slow collection of accounts
receivables is correlated with low profitability. It suggests that corporate managers can improve
profitability by reducing the credit period granted to their customers.
Contrary to findings by: (1) Biger et al (2010) who did not find a statistically significant
relationship between days payables outstanding and profitability and (2) Mathuva (2010) who
found significant positive relationship between days payables outstanding and profitability, this
study finds that there exists a significant negative relationship between days payables outstanding
and profitability of South African firms. This finding is in line with findings by Deloof (2003)
who analyses the relationship between Belgian firms. The negative relationship can be explained
by that, contrary to Mathuva (2010) who states that profitable companies withhold their payment
to suppliers so as to take advantage of the cash available for their working capital needs, a
decrease in the days payables outstanding leading to an increase in profitability is as a result of
less profitable firms waiting longer to pay their bills. The difference in the relationship as shown
by this study in contrast with findings by Mathuva (2010) and Biger et al (2010) could be
attributable to different characteristics of firms operating in different geographic jurisdictions. For
example, the difference could be as a result of the dissimilarity in different countries‟ costs and
benefits of being granted credit. The costs of being granted credit may rise faster than the benefits
of being granted credit in one country and slower than the benefits of being granted credit in
another.
Although the study finds that there is no statistically significant relationship between days sales in
inventory and profitability, the coefficient on this variable is positive and consistent with findings
by Mathuva (2010) who found a positive coefficient. It is however contrary to the negative
relationship found by Deloof (2003) and Lazaridis and Tryfonidis (2006). Whereas the negative
relationship could suggest that maintaining inventory at high levels may result in substandard
returns, the positive relationship infers that maintaining high levels of inventory reduces the cost
of possible interruptions in the production process. Furthermore, it infers that maintaining high
levels of inventory helps in reducing the cost of supplying the products and protects the firm

50
against price fluctuations particularly in environments with volatile price movements influenced
by volatile exchange rates and/or other macroeconomic factors.
In this paper, the results show that there exists a significant negative relationship between the time
lag from the expenditure for purchases of raw materials and the collection of sales of finished
goods can be too long and profitability. This result is in line with studies by Deloof (2003),
Garcia-Teruel and Martinez-Solano (2006), Lazaridis and Tryfonidis (2006), Mathuva (2010),
Biger et al (2010). It can be explained by that minimizing investment in current assets can help
boost profits as liquid cash is not maintained in the business for too long and that it is used to
generate more profits for the firm.
Unlike other studies conducted on the impact of working capital management on firm profitability
that did not differentiate the impact under different market conditions, this study has remarkable
contribution-enhancing positive features in that it empirically examined how working capital
management components‟ impact changes as the economy moves from a boom to a recession.
The results show that an increase in the length of the cash (operating) cycle tends to increase
profitability during an economic recession than during an economic boom. This could be
attributable to the fact that trading conditions and demand for a firm‟s products tend to be
subdued during an economic recession to an extent that a firm adopts a more generous trade credit
policy so as to attract sales and increase profitability. Thus, the generous trade credit policy leads
to an increase in the time lag between actual cash expenditures on a firm‟s purchase of productive
resources and the ultimate recovery of cash receipts from product sales, with the net effect being
an increase in profitability. The implication of this is that corporate managers need to restructure
their trade credit policy and change it accordingly as macroeconomic environment changes in
ensuring that firm profitability is not adversely impacted by an unfavourable change in the
macroeconomic conditions.
In the same vein, the study reveals that profitability of South African firms tend to decrease as the
economic conditions change from an economic boom to a recession. This can be explained by
inter-linkages between the South African economy and the global economy, which linkages result
in less profit for South African firms as global demand, particularly for mineral resources,
dwindles.

51
Furthermore and in line with findings by Nasr and Raheman (2007), empirical results of the study
show that current ratio has a negative relationship with profitability, showing that there exists an
inverse relationship between liquidity and profitability of South African firms. While the study
shows that reducing current ratio increases profitability of South African firms, it is to be noted
that disregarding liquidity may result in insolvency and bankruptcy. Thus, given the trade-off
between profit maximization and liquidity preservation, corporate managers need to minimize
current ratio to the extent that it maximizes profits without adversely affecting firm solvency.
The study examined the impact of capital structure on firm profitability wherein debt to equity
ratio was used as a proxy for capital structure. Contrary to findings by Brabete and Nimalathasan
(2010) and in line with findings by Salawu (2009), the study finds that there exists a negative
association between profitability and debt to equity. This negative association between debt to
equity ratio and profitability has implications for financial stability as the higher debt to equity
ratio makes the corporate sector highly vulnerable to changes in economic conditions and may
result in economy wide impact of a financial crisis. Furthermore, what this means is that
management should strive to identify the optimal capital structure of the firm and also maintain it
since it represents the point where the market value of the firm is maximized.
Lastly, the study examined if there is a difference in the impact of working capital management
components on profitability between companies in the industrial sector and those in the rest of the
other sectors. Results of the study show that there is no significant difference in the impact. The
implication of this finding is that working capital management strategies that enhance profitability
of companies in the industrial sector are also applicable for companies in the rest of the other
sectors.
5.3 Conclusion
Based on the key findings of the study, the following conclusions can be held: (1) that
management of a firm can create value for the shareholders by reducing: (a) the net time interval
between actual cash expenditures on a firm‟s purchase of productive resources and the ultimate
recovery of cash receipts from product sales, (b) the number of days accounts receivable, (c) the
debt to equity ratio to the extent that it increases firm profitability, (d) the current ratio to the
extent that it does not adversely impact on the solvency of the firm, and (e) the days payables
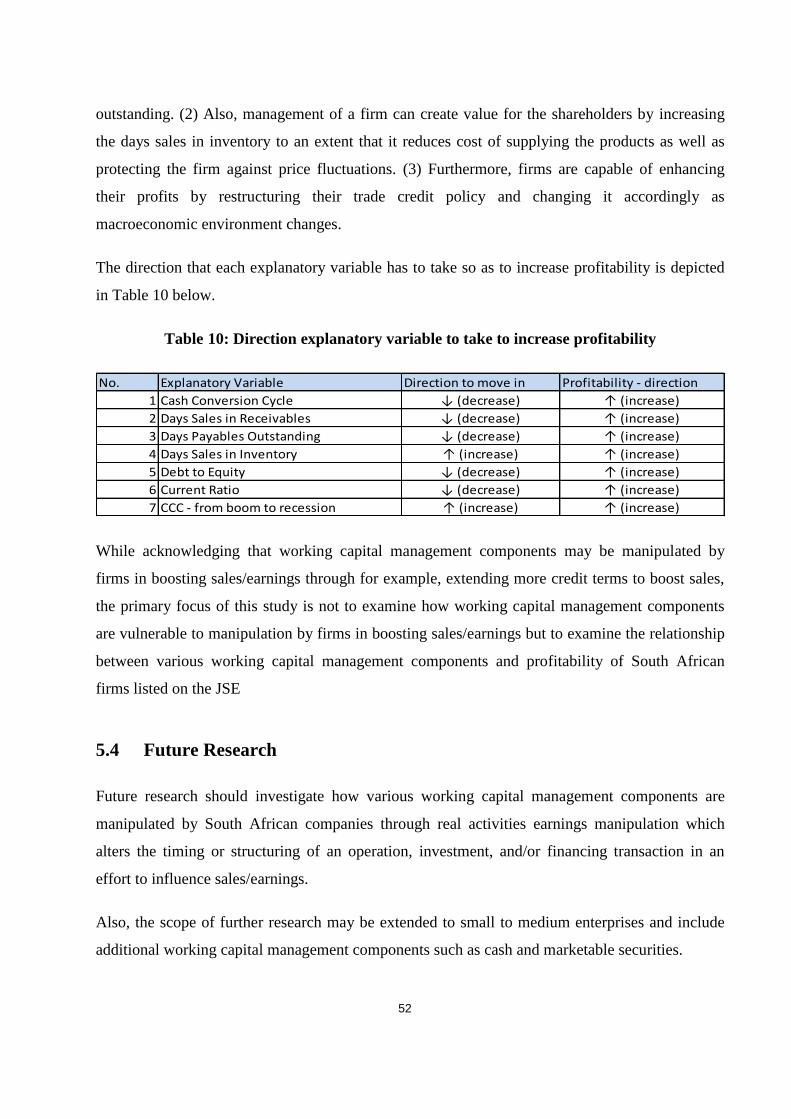
52
outstanding. (2) Also, management of a firm can create value for the shareholders by increasing
the days sales in inventory to an extent that it reduces cost of supplying the products as well as
protecting the firm against price fluctuations. (3) Furthermore, firms are capable of enhancing
their profits by restructuring their trade credit policy and changing it accordingly as
macroeconomic environment changes.
The direction that each explanatory variable has to take so as to increase profitability is depicted
in Table 10 below.
Table 10: Direction explanatory variable to take to increase profitability
No. Explanatory Variable Direction to move in Profitability - direction
1 Cash Conversion Cycle ↓ (decrease) ↑ (increase)
2 Days Sales in Receivables ↓ (decrease) ↑ (increase)
3 Days Payables Outstanding ↓ (decrease) ↑ (increase)
4 Days Sales in Inventory ↑ (increase) ↑ (increase)
5 Debt to Equity ↓ (decrease) ↑ (increase)
6 Current Ratio ↓ (decrease) ↑ (increase)
7 CCC - from boom to recession ↑ (increase) ↑ (increase)
While acknowledging that working capital management components may be manipulated by
firms in boosting sales/earnings through for example, extending more credit terms to boost sales,
the primary focus of this study is not to examine how working capital management components
are vulnerable to manipulation by firms in boosting sales/earnings but to examine the relationship
between various working capital management components and profitability of South African
firms listed on the JSE
5.4 Future Research
Future research should investigate how various working capital management components are
manipulated by South African companies through real activities earnings manipulation which
alters the timing or structuring of an operation, investment, and/or financing transaction in an
effort to influence sales/earnings.
Also, the scope of further research may be extended to small to medium enterprises and include
additional working capital management components such as cash and marketable securities.

53
REFERENCES
Bhole, L.M., Mahakud, J. (2004). “Behaviour of trade Credit: Time Series and Panel Data
Analysis”. Economic and Political Weekly, 39:12, pp 1277-1278.
Biger, N., Gill, A., Mathur, N. (2010). “The Relationship Between Working Capital Management
and profitability: Evidence from the United States”. Business and Economics Journal. pp BEJ-10.
Blanchard, O. (2010). “Macroeconomics”. Fifth Edition. Pearson Education, Inc., ISBN – 10:0-
13-03877-1, pp 22-24.
Brabete, V., Nimalathasan, B. (2010). “Capital Structure and its impact on Profitability: A study
of listed manufacturing companies in Sri Lanka”. Young Economists Journal, 8:15, pp 7-16.
De Angelo, H., Masulis, R. (1980). “Optimal Capital Structure under Corporate and Personal
Taxation”. Journal of Financial Economics, 8:1, pp 3-29.
Dechow, P., Skinner, D.J. (2000). “Earnings Management: Reconciling the views of Accounting
Academics, Practitioners, and Regulators”. Accounting Horizons, 14:2, pp 50-235.
Deloof, M. (2003). “Does Working Capital Management Affect Profitability of Belgian Firms”?
Journal of Business Finance & Accounting, 30: 3&4, pp 573-587.
Dermirgunes, K., Samiloglu, F. (2008). “The Effect of Working Capital Management on Firm
Profitability: Evidence from Turkey”. The International Journal of Applied Economics and
Finance, 2:1, pp 44-50.
Firer, C., Jordan, B.D., Ross, S.A. Westerfield, R.W. (2008). “Fundamentals of Corporate
Finance”. 4th
Edn. The McGraw-Hill, New York, NY, ISBN: 10- 0077114787, pp 4-9.
Fried, D., Sondhi, A.C., White, G.I. (2003). “The Analysis and Use of Financial Statements”. 3rd
Edn. John Wiley & Sons, ISBN 978-0471-37594-4, pp 124.
Garcia-Teruel, P.J., Martinez-Solano, P. (2006). “Effects of Working Capital Management on
SME Profitability”. International Journal of Finance, 3, pp 164-177.

54
Gunny, K.A. (2010). “The Relation Between Earnings Management Using Real Activities
Manipulation and Future Performance: Evidence from Meeting Earnings Benchmarks”.
Contemporary Accounting Research, 3, pp 855-888.
Hamlin, A.P., Heathfield, D.F. (1991). “Competitive Management and Working Capital”.
Managerial and Decision Economics, 12:3, pp 207-217.
International Monetary Fund (IMF). (2009). “International Financial Statistics”; Haver Analytics.
Jordan, B.D., Ross, S.A., Westerfield, R.W. (2003). “Fundamentals of Corporate Finance”.
6th
Edn. McGraw-Hill Irwin Publications, New York, ISBN: 0-07-246974-9, pp 167.
Kaveri, V.S. (1985) “Financing of Working Capital in Indian Industry”. Economic and Political
Weekly, 20:35, pp 123-128.
Koop, G. (2006). “Analysis of Financial Data”. John Wiley & Sons Ltd, ISBN-13 978-0-470-
01321-2, pp 102.
Laughlin, E.J., Richards, V.D. (1980). “A Cash Conversion Cycle Approach to Liquidity
Analysis”. Financial Management Association International, 9:1, pp 32-38.
Lazaridis, I., Tryfonidis, D. (2006). “Relationship Between Working Capital Management and
Profitability of listed companies in the Athens Stock Exchange”. Journal of Financial
Management and Analysis, 19: 1, pp 26-35.
Lemke, K.W. (1970). “The Evaluation of Liquidity: An Analytical Study”. Journal of Accounting
Research, 8:1, pp 47-77.
Mathuva, D. (2010). “The Influence of Working Capital Management Components on Corporate
Profitability: A Survey on Kenyan Listed Firms”. Research Journal of Business Management, 4:1,
pp 1-11.
Modigliani, F., Miller, M.H. (1958). “The Cost of Capital, Corporation Finance and the Theory of
Investment”. American Economic Review, 48, pp 261-277.

55
Modigliani, F., Miller, M.H. (1963). “Corporate Income Taxes and the Cost of Capital: A
correction”. American Economic Review, 53, pp 433-443.
Montgomery, D., Peck, A., Vining, G. (2007). “Introduction to Linear Regression Analysis”. 4th
Edn., John Wiley, New York, ISBN: 978-0-470-12506-9, pp:34-38.
Nasr, M., Raheman, A. (2007). “Working Capital Management and Profitability – Case of
Pakistani Firms”. International Review of Business Research Papers, 3:1, pp 279-300.
Schipper, K. (1989). “Earnings Management”. Accounting Horizons, 3:1, pp 91-102.
Salawu, R. O. (2009). “The effect of Capital Structure on Profitability: An empirical analysis of
listed firms in Nigeria”. The International Journal of Business and Finance, 3:2, pp 121-129.
Statistics South Africa. (2011). “Gross Domestic Product – First Quarter 2011”.
www.statssa.gov.za.
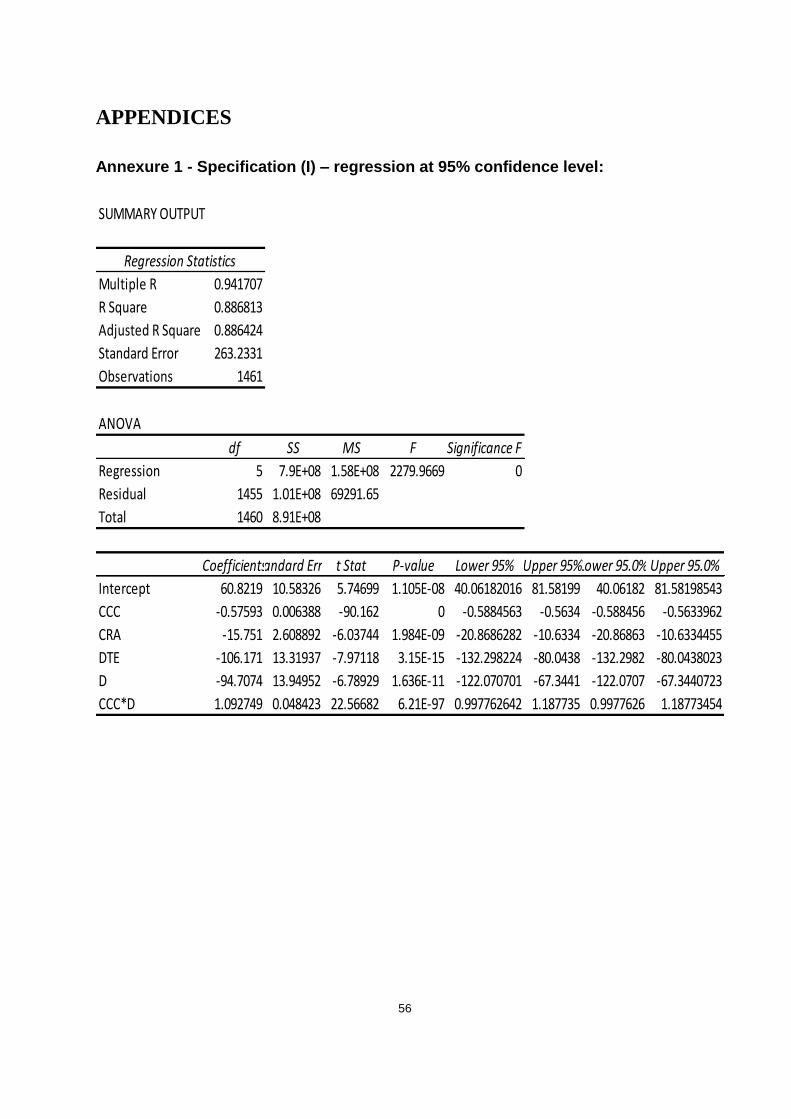
56
APPENDICES
Annexure 1 - Specification (I) – regression at 95% confidence level:
SUMMARY OUTPUT
Regression Statistics
Multiple R 0.941707
R Square 0.886813
Adjusted R Square 0.886424
Standard Error 263.2331
Observations 1461
ANOVA
df SS MS F Significance F
Regression 5 7.9E+08 1.58E+08 2279.9669 0
Residual 1455 1.01E+08 69291.65
Total 1460 8.91E+08
CoefficientsStandard Error t Stat P-value Lower 95% Upper 95%Lower 95.0% Upper 95.0%
Intercept 60.8219 10.58326 5.74699 1.105E-08 40.06182016 81.58199 40.06182 81.58198543
CCC -0.57593 0.006388 -90.162 0 -0.5884563 -0.5634 -0.588456 -0.5633962
CRA -15.751 2.608892 -6.03744 1.984E-09 -20.8686282 -10.6334 -20.86863 -10.6334455
DTE -106.171 13.31937 -7.97118 3.15E-15 -132.298224 -80.0438 -132.2982 -80.0438023
D -94.7074 13.94952 -6.78929 1.636E-11 -122.070701 -67.3441 -122.0707 -67.3440723
CCC*D 1.092749 0.048423 22.56682 6.21E-97 0.997762642 1.187735 0.9977626 1.18773454

57
Annexure 2 - Specification (I) – regression at 90% confidence level:
SUMMARY OUTPUT
Regression Statistics
Multiple R 0.941707497
R Square 0.88681301
Adjusted R Square 0.886424052
Standard Error 263.2330737
Observations 1461
ANOVA
df SS MS F Significance F
Regression 5 789913342.3 157982668.5 2279.966865 0
Residual 1455 100819352.3 69291.65107
Total 1460 890732694.7
Coefficients Standard Error t Stat P-value Lower 95% Upper 95% Lower 90.0% Upper 90.0%
Intercept 60.8219028 10.58326247 5.746989926 1.10486E-08 40.06182016 81.58198543 43.40289457 78.24091103
CCC -0.575926254 0.006387682 -90.16200745 0 -0.588456305 -0.563396204 -0.586439751 -0.565412758
CRA -15.75103686 2.608891956 -6.037443145 1.98406E-09 -20.86862822 -10.6334455 -20.04501621 -11.45705751
DTE -106.171013 13.31936551 -7.971176474 3.15036E-15 -132.2982237 -80.0438023 -128.0933775 -84.24864852
D -94.70738647 13.94951747 -6.789294803 1.63623E-11 -122.0707006 -67.34407235 -117.6669191 -71.74785387
CCC*D^ 1.092748591 0.048422795 22.5668219 6.20951E-97 0.997762642 1.18773454 1.013049437 1.172447745

58
Annexure 3 - Specification (I) – regression at 99% confidence level:
SUMMARY OUTPUT
Regression Statistics
Multiple R 0.941707497
R Square 0.88681301
Adjusted R Square 0.886424052
Standard Error 263.2330737
Observations 1461
ANOVA
df SS MS F Significance F
Regression 5 789913342.3 157982668.5 2279.966865 0
Residual 1455 100819352.3 69291.65107
Total 1460 890732694.7
Coefficients Standard Error t Stat P-value Lower 95% Upper 95% Lower 99.0% Upper 99.0%
Intercept 60.8219028 10.58326247 5.746989926 1.10486E-08 40.06182016 81.58198543 33.5254194 88.11838619
CCC -0.575926254 0.006387682 -90.16200745 0 -0.588456305 -0.563396204 -0.592401445 -0.559451064
CRA -15.75103686 2.608891956 -6.037443145 1.98406E-09 -20.86862822 -10.6334455 -22.47992374 -9.02214998
DTE -106.171013 13.31936551 -7.971176474 3.15036E-15 -132.2982237 -80.0438023 -140.5244877 -71.81753832
D -94.70738647 13.94951747 -6.789294803 1.63623E-11 -122.0707006 -67.34407235 -130.686157 -58.72861592
CCC*D^ 1.092748591 0.048422795 22.5668219 6.20951E-97 0.997762642 1.18773454 0.96785591 1.217641272

59
Annexure 4 - Specification II – regression at 95% confidence level:
SUMMARY OUTPUT
Regression Statistics
Multiple R 0.979420452
R Square 0.959264421
Adjusted R Square 0.95915251
Standard Error 157.7304046
Observations 1461
ANOVA
df SS MS F Significance F
Regression 4 853014972.6 213253743.2 8571.677604 0
Residual 1456 36223650.07 24878.88054
Total 1460 889238622.7
Coefficients Standard Error t Stat P-value Lower 95% Upper 95% Lower 95.0% Upper 95.0%
Intercept 69.24197934 4.43444353 15.61458137 6.15518E-51 60.54339875 77.94055992 60.54339875 77.94055992
DSI 0.01288558 0.030487289 0.422654162 0.672610013 -0.04691812 0.072689282 -0.046918123 0.072689282
DSR -0.395471702 0.014533924 -27.21024903 3.7301E-132 -0.42398137 -0.366962034 -0.42398137 -0.366962034
DPO -0.53098083 0.020927719 -25.3721316 6.6154E-118 -0.57203253 -0.48992913 -0.57203253 -0.48992913
CCC*D 0.104644973 0.21906411 0.477691087 0.632941792 -0.32507001 0.534359954 -0.325070008 0.534359954

60
Annexure 5 - Specification II – regression at 90% confidence level:
SUMMARY OUTPUT
Regression Statistics
Multiple R 0.979420452
R Square 0.959264421
Adjusted R Square 0.95915251
Standard Error 157.7304046
Observations 1461
ANOVA
df SS MS F Significance F
Regression 4 853014972.6 213253743.2 8571.677604 0
Residual 1456 36223650.07 24878.88054
Total 1460 889238622.7
Coefficients Standard Error t Stat P-value Lower 95% Upper 95% Lower 90.0% Upper 90.0%
Intercept 69.24197934 4.43444353 15.61458137 6.15518E-51 60.54339875 77.94055992 61.943325 76.54063368
DSI 0.01288558 0.030487289 0.422654162 0.672610013 -0.046918123 0.072689282 -0.037293475 0.063064634
DSR -0.395471702 0.014533924 -27.21024903 3.7301E-132 -0.42398137 -0.366962034 -0.4193931 -0.371550304
DPO -0.53098083 0.020927719 -25.3721316 6.6154E-118 -0.57203253 -0.48992913 -0.56542578 -0.49653588
CCC*D 0.104644973 0.21906411 0.477691087 0.632941792 -0.325070008 0.534359954 -0.255912831 0.465202777

61
Annexure 6 - Specification II – regression at 99% confidence level:
SUMMARY OUTPUT
Regression Statistics
Multiple R 0.979420452
R Square 0.959264421
Adjusted R Square 0.95915251
Standard Error 157.7304046
Observations 1461
ANOVA
df SS MS F Significance F
Regression 4 853014972.6 213253743.2 8571.677604 0
Residual 1456 36223650.07 24878.88054
Total 1460 889238622.7
Coefficients Standard Error t Stat P-value Lower 95% Upper 95% Lower 99.0% Upper 99.0%
Intercept 69.24197934 4.43444353 15.61458137 6.15518E-51 60.54339875 77.94055992 57.80461724 80.67934143
DSI 0.01288558 0.030487289 0.422654162 0.672610013 -0.046918123 0.072689282 -0.065747548 0.091518707
DSR -0.395471702 0.014533924 -27.21024903 3.7301E-132 -0.42398137 -0.366962034 -0.432957748 -0.357985656
DPO -0.53098083 0.020927719 -25.3721316 6.6154E-118 -0.57203253 -0.48992913 -0.584957816 -0.477003844
CCC*D 0.104644973 0.21906411 0.477691087 0.632941792 -0.325070008 0.534359954 -0.46036742 0.669657366

62
Annexure 7 – Expanded Descriptive Statistics:
OPM CCC CRA DTE D CCC*D DSI DSR DPO
Mean -100.347 Mean 150.1789 Mean 2.080957 Mean -7.4E-05 Mean 0.466119 Mean 2.047281 Mean 157.5734 Mean 180.9252 Mean 188.3197
Standard Error20.43488 Standard Error32.55354 Standard Error0.07989 Standard Error0.013834 Standard Error0.013056 Standard Error3.765107 Standard Error20.88359 Standard Error28.23572 Standard Error18.31608
Median 14.95 Median 28.44764 Median 1.435581 Median -0.00245 Median 0 Median 0 Median 42.34736 Median 46.60767 Median 55.43664
Mode 0 Mode 37.76241 Mode 1.394393 Mode 0.106838 Mode 0 Mode 0 Mode 45.78438 Mode 40.52148 Mode 27.49924
Standard Deviation781.0831 Standard Deviation1244.295 Standard Deviation3.053619 Standard Deviation0.528783 Standard Deviation0.499022 Standard Deviation143.9138 Standard Deviation798.234 Standard Deviation1079.255 Standard Deviation700.0962
Sample Variance610090.9 Sample Variance1548270 Sample Variance9.324588 Sample Variance0.279612 Sample Variance0.249023 Sample Variance20711.18 Sample Variance637177.5 Sample Variance1164791 Sample Variance490134.6
Kurtosis 78.08799 Kurtosis 97.84931 Kurtosis 65.48347 Kurtosis 6.707554 Kurtosis -1.98423 Kurtosis 46.70719 Kurtosis 90.808 Kurtosis 102.4523 Kurtosis 64.28036
Skewness -8.65807 Skewness 9.785816 Skewness 7.270836 Skewness 0.284474 Skewness 0.135975 Skewness -3.63756 Skewness 9.331919 Skewness 10.04635 Skewness 7.667783
Range 7828.46 Range 15080.56 Range 33.80734 Range 4.870958 Range 1 Range 2154.359 Range 8810.282 Range 12368.96 Range 7149.663
Minimum -7601.25 Minimum -1196.87 Minimum 0.056981 Minimum -2.40456 Minimum 0 Minimum -1196.87 Minimum 1.293939 Minimum 13.66686 Minimum 19.4133
Maximum 227.21 Maximum 13883.69 Maximum 33.86432 Maximum 2.466399 Maximum 1 Maximum 957.4884 Maximum 8811.576 Maximum 12382.63 Maximum 7169.076
Sum -146607 Sum 219411.4 Sum 3040.278 Sum -0.10821 Sum 681 Sum 2991.077 Sum 230214.7 Sum 264331.8 Sum 275135.1
Count 1461 Count 1461 Count 1461 Count 1461 Count 1461 Count 1461 Count 1461 Count 1461 Count 1461
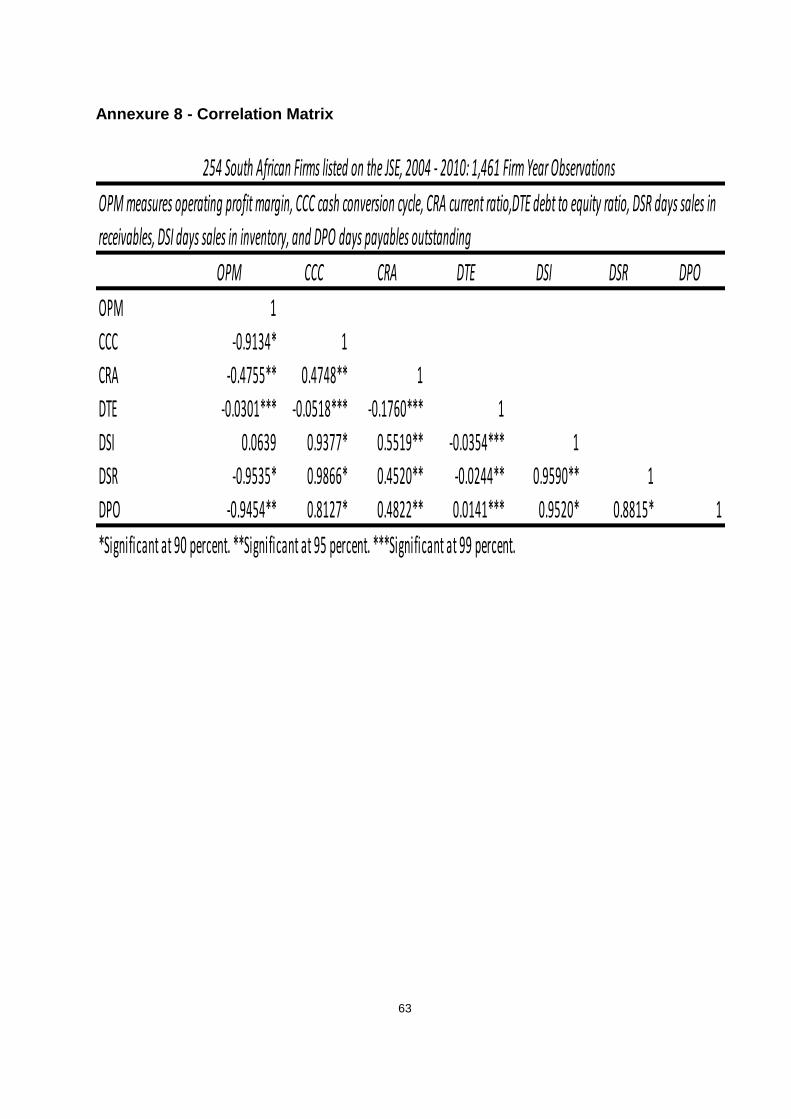
63
Annexure 8 - Correlation Matrix
OPM CCC CRA DTE DSI DSR DPO
OPM 1
CCC -0.9134* 1
CRA -0.4755** 0.4748** 1
DTE -0.0301*** -0.0518*** -0.1760*** 1
DSI 0.0639 0.9377* 0.5519** -0.0354*** 1
DSR -0.9535* 0.9866* 0.4520** -0.0244** 0.9590** 1
DPO -0.9454** 0.8127* 0.4822** 0.0141*** 0.9520* 0.8815* 1
*Significant at 90 percent. **Significant at 95 percent. ***Significant at 99 percent.
254 South African Firms listed on the JSE, 2004 - 2010: 1,461 Firm Year Observations
OPM measures operating profit margin, CCC cash conversion cycle, CRA current ratio,DTE debt to equity ratio, DSR days sales in
receivables, DSI days sales in inventory, and DPO days payables outstanding