ml ilipp+stock market_popularretirementchoice2
TRANSCRIPT
Copyright 2013, 2015 - All Rights Reserved
Stock Market is a Popular Choice for Retirement Savings
But the Outcome is Never Certain!
Sponsored by MarketLinking.comPublished by Capital Strategies Press

But the Stock Market Goes Down as Well as Up
The graph shows the annual price changes of the S&P 500 Common Stock Index, which is often said to mimic the performance of the entire stock market. Annual price changes are measured month-end to month-end one year later and includes every month-end from Jan 1970 to Dec 2012 (504 one year periods). Historically, the market has yielded substantial gains, but it has also generated significant losses.
Copyright 2013, 2015 - All Rights Reserved

Stock Market MathStock % ReturnMarket Needed to Loss Break-even 10% 11% 20% 33% 35% 55% 50% 100% 75% 300%
The problem with losses is that it reduces your working assets. Whatever capital remains has to work even harder, just to get you back to even. Large losses are not uncommon for the stock market as a whole, and even more frequent for individual stocks.
Copyright 2013, 2015 - All Rights Reserved

Selected Stock Market Declines
There have been other substantial declines not listed above. These are some of the most recent. No stock market drop has ever been predicted with any degree of accuracy. Stock market declines occur suddenly and without warning! (Data above reflects S&P 500 Stock Index)
% of Stock Market Period Market Decline 1968-1970 33%1972-1974 48%1987-1987 34%2000-2003 47%2007-2009 56%
Copyright 2013, 2015 - All Rights Reserved
Riding Out the Market
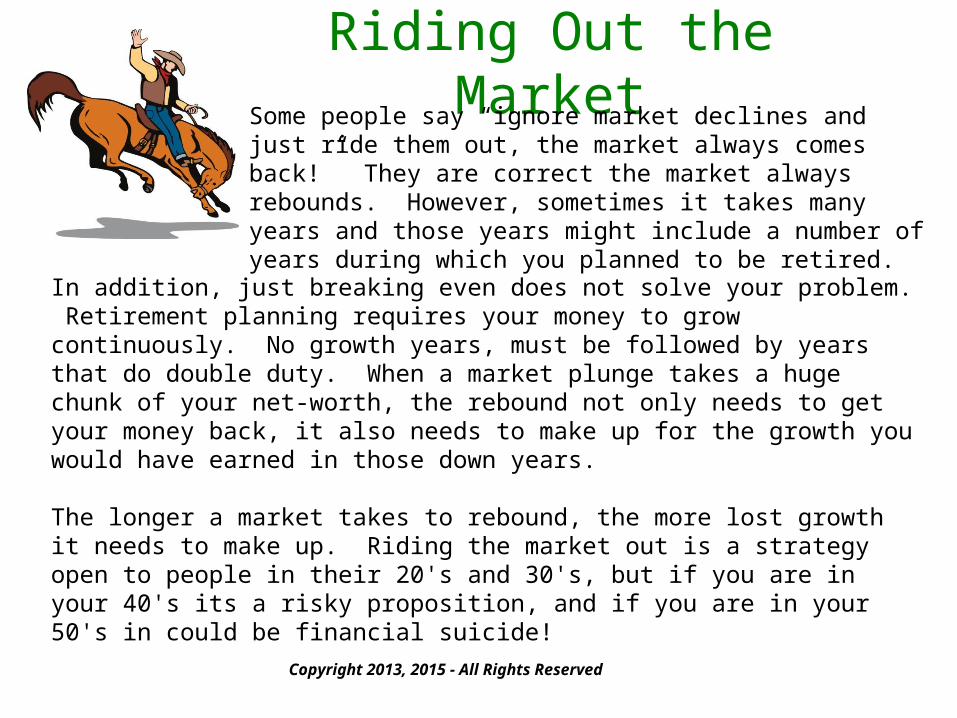
In addition, just breaking even does not solve your problem. Retirement planning requires your money to grow continuously. No growth years, must be followed by years that do double duty. When a market plunge takes a huge chunk of your net-worth, the rebound not only needs to get your money back, it also needs to make up for the growth you would have earned in those down years.
The longer a market takes to rebound, the more lost growth it needs to make up. Riding the market out is a strategy open to people in their 20's and 30's, but if you are in your 40's its a risky proposition, and if you are in your 50's in could be financial suicide!
Some people say “ignore market declines and just ride them out, the market always comes back!” They are correct the market always rebounds. However, sometimes it takes many years and those years might include a number of years during which you planned to be retired.
Copyright 2013, 2015 - All Rights Reserved
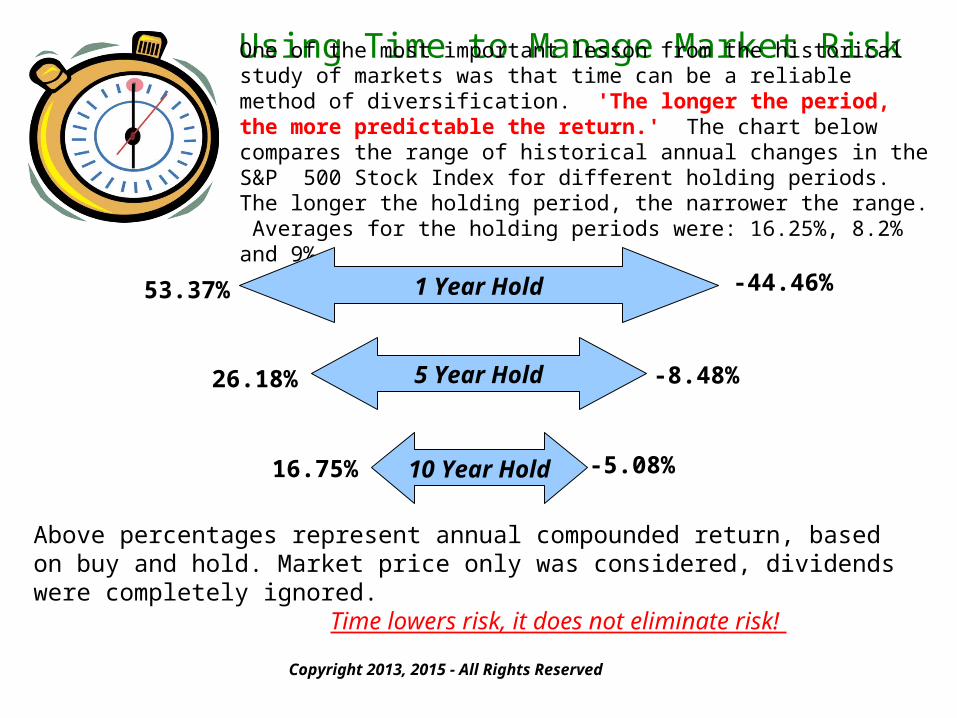
Using Time to Manage Market RiskOne of the most important lesson from the historical study of markets was that time can be a reliable method of diversification. 'The longer the period, the more predictable the return.' The chart below compares the range of historical annual changes in the S&P 500 Stock Index for different holding periods. The longer the holding period, the narrower the range. Averages for the holding periods were: 16.25%, 8.2% and 9%,
-44.46%53.37% 1 Year Hold
5 Year Hold
10 Year Hold
26.18%
16.75%
-8.48%
-5.08%
Above percentages represent annual compounded return, based on buy and hold. Market price only was considered, dividends were completely ignored.
Time lowers risk, it does not eliminate risk!
Copyright 2013, 2015 - All Rights Reserved
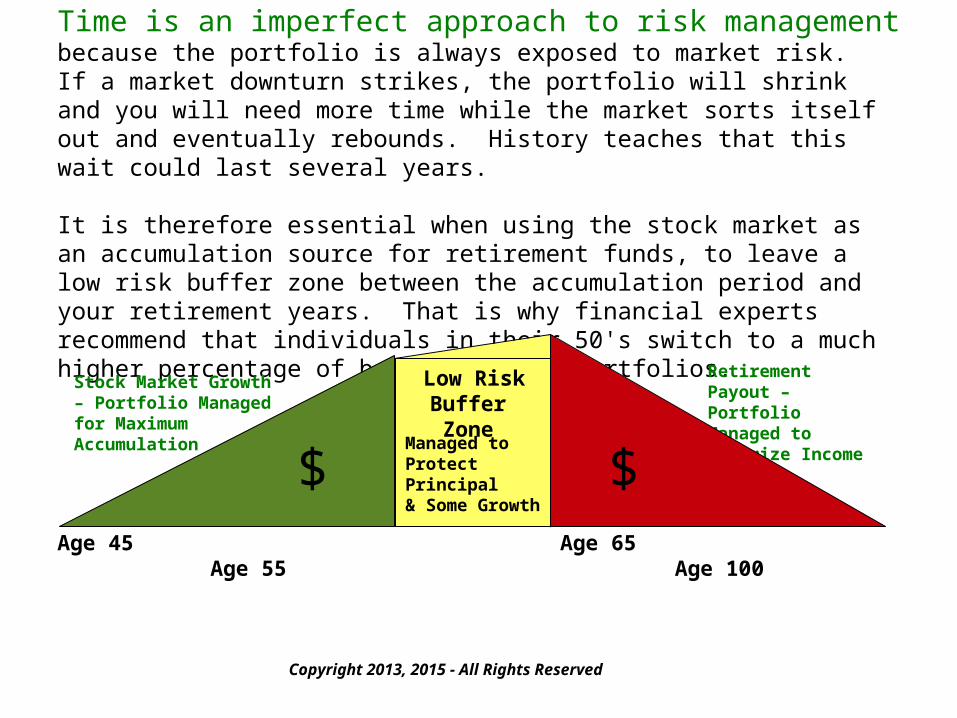
Time is an imperfect approach to risk managementbecause the portfolio is always exposed to market risk. If a market downturn strikes, the portfolio will shrink and you will need more time while the market sorts itself out and eventually rebounds. History teaches that this wait could last several years.
It is therefore essential when using the stock market as an accumulation source for retirement funds, to leave a low risk buffer zone between the accumulation period and your retirement years. That is why financial experts recommend that individuals in their 50's switch to a much higher percentage of bonds in their portfolios.
Age 45 Age 55
Retirement Payout – Portfolio Managed to Maximize Income
$Age 65 Age 100
$Stock Market Growth – Portfolio Managedfor Maximum Accumulation Managed to Protect
Principal& Some Growth
Low RiskBuffer Zone
Copyright 2013, 2015 - All Rights Reserved
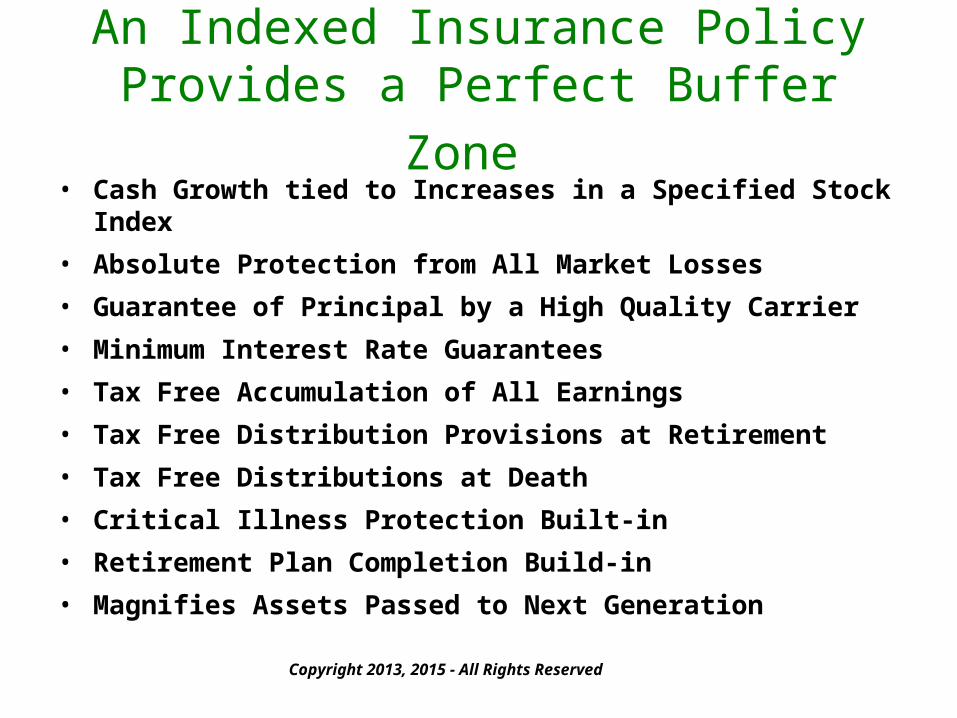
An Indexed Insurance Policy Provides a Perfect Buffer Zone
• Cash Growth tied to Increases in a Specified Stock Index• Absolute Protection from All Market Losses• Guarantee of Principal by a High Quality Carrier• Minimum Interest Rate Guarantees• Tax Free Accumulation of All Earnings• Tax Free Distribution Provisions at Retirement• Tax Free Distributions at Death• Critical Illness Protection Built-in• Retirement Plan Completion Build-in• Magnifies Assets Passed to Next Generation
Copyright 2013, 2015 - All Rights Reserved

Indexing is a portfolio management technique that protects the principal from market downturns, while simultaneously offering the opportunity to profit from market upswings.
In the indexing approach, the principal is invested in high grade bonds and the interest there from is used to purchase stock market hedges. If the market moves up and the stock index increases, the profit (market value of the index less the cost of the hedge) is credited to the portfolio and becomes new principal. If the market is flat or plunges, the hedge expires and the interest used for its purchase is lost. A one or two percent interest rate is normally retained in order to guarantee minimal portfolio growth regardless of market performance.
The indexing method protects the principal at all times and only risks interest earnings. The portfolio is never exposed to stock market risk and is always safe from market declines. In some years the annual interest is lost, but in others the stock index gains can be substantial. Indexing essentially trades some market gains for total protection from all market losses.
When indexing is combined with the tax favored structure of a life insurance policy, it makes a perfect retirement accumulation resource.
Copyright 2013, 2015 - All Rights Reserved
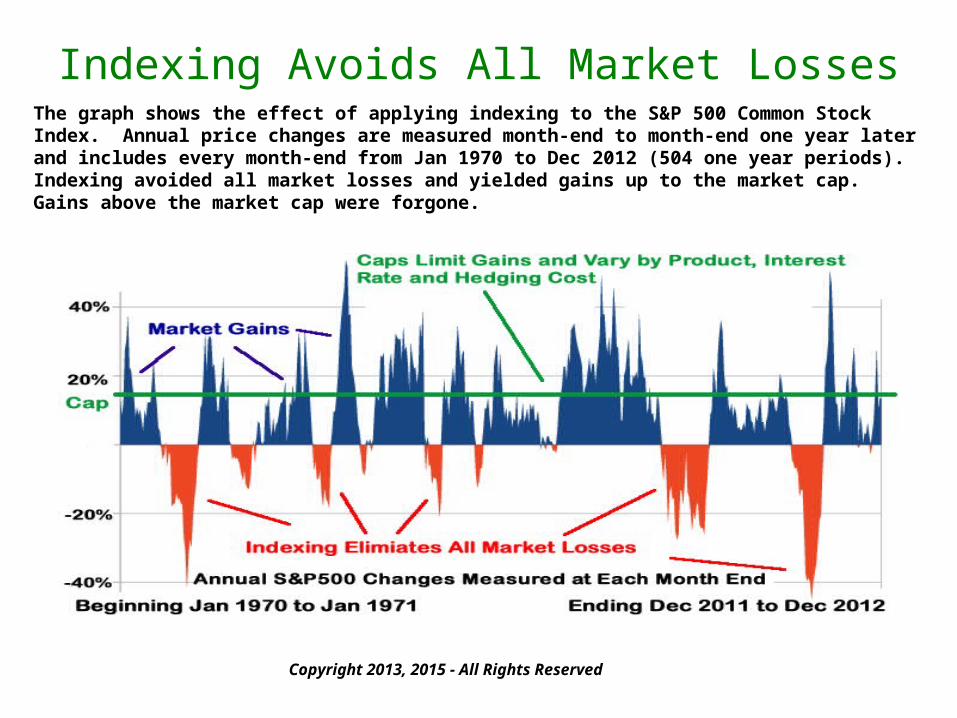
Indexing Avoids All Market LossesThe graph shows the effect of applying indexing to the S&P 500 Common Stock Index. Annual price changes are measured month-end to month-end one year later and includes every month-end from Jan 1970 to Dec 2012 (504 one year periods). Indexing avoided all market losses and yielded gains up to the market cap. Gains above the market cap were forgone.
Copyright 2013, 2015 - All Rights Reserved

S&P 500 Compared to Indexing2010 2011 2012 2013 2014 Net
S&P 500 11.64% 0.00% 13.41% 29.6% 11.4% 83.1%
12% Cap 11.64% 0.00% 12.00% 12.0% 11.4% 56.3%
2009 2010 2011 2012 2013 Net
S&P 500 24.71% 11.64% 0.00% 13.41% 29.6% 104.6%
12% Cap 12.00% 11.64% 0.00% 12.00% 12.0% 56.9%
The table above show the results from buying and holding the S&P 500 Stock Index for each of the last fourteen calendar years and their cumulative five year results. Dividends were completely ignored. It also shows the results of indexing the S&P with a 12% cap (gains limited to 12% annually).
Notice that the indexing account avoided all market downturns and despite the cap, registered consistent and impressive gains. Additional years are compared on the following pages. In only three of the ten the five year periods, did the stock market outperform the indexing account.
Total growth from Jan 1, 2001 to Dec 31, 2014 was 56% for the S&P500 (with out dividends included), but 154% if the S&P500 was indexed with a 12% cap. The safer account made more money during this specific period.
Copyright 2013, 2015 - All Rights Reserved

S&P 500 & Indexing Compared
2005 2006 2007 2008 2009 Net
S&P 500 3.00% 13.62% 3.53% -38.49% 24.71% -7.06%
12% Cap 3.00% 12.00% 3.53% 0.00% 12.00% 33.76%
2006 2007 2008 2009 2010 Net
S&P 500 13.62% 3.53% -38.49% 24.71% 11.64% 0.74%
12% Cap 12.00% 3.53% 0.00% 12.00% 11.64% 44.98%
Copyright 2013, 2015 - All Rights Reserved
2008 2009 2010 2011 2012 Net
S&P 500 -38.49% 24.71% 11.64% 0.00% 13.41% -2.88%
12% Cap 0.00% 12.00% 11.64% 0.00% 12.00% 40.04%
2007 2008 2009 2010 2011 Net
S&P 500 3.53% -38.49% 24.71% 11.64% 0.00% -11.34%
12% Cap 3.53% 0.00% 12.00% 11.64% 0.00% 29.45%

S&P 500 & Indexing Compared
2001 2002 2003 2004 2005 Net
S&P 500 -13.04% -23.37% 26.38% 8.99% 3.00% -5.46%
12% Cap 0.00% 0.00% 12.00% 8.99% 3.00% 25.73%
2002 2003 2004 2005 2006 Net
S&P 500 -23.37% 26.38% 8.99% 3.00% 13.62% 23.53%
12% Cap 0.00% 12.00% 8.99% 3.00% 12.00% 40.82%
Copyright 2013, 2015 - All Rights Reserved
2003 2004 2005 2006 2007 Net
S&P 500 26.38% 8.99% 3.00% 13.62% 3.53% 66.89%
12% Cap 12.00% 8.99% 3.00% 12.00% 3.53% 45.79%
2004 2005 2006 2007 2008 Net
S&P 500 8.99% 3.00% 13.62% 3.53% -38.49% -18.77%
12% Cap 8.99% 3.00% 12.00% 3.53% 12.00% 30.17%

An ILIPP (Indexed Life Insurance Private Pension) is a personal retirement plan that merges the best features of an indexed portfolio and the tax favored provisions of life insurance policy. These policies intentionally over funded to maximize cash growth and minimize mortality expenses. Property designed they offer a compelling and risk free alternative to traditional stock market based retirement plans.
Copyright 2013, 2015 - All Rights Reserved
**Life insurance policies are purchased through licensed insurance agents. The purchaser must receive a NAIC compliant illustration on any and all policies considered. Not all agents are familiar with this concept. For best results choose your insurance agent wisely. - See the important notices on the following pages.
For additional information on this financial concept please visit MarketLinking.com

Links to Impartial Providers of Historical Asset Class Performance
Copyright 2013, 2015 - All Rights Reserved
Federal Reserve Board posts returns from a variety of fixed income asset classes, some of which extend as far back as the early 1900’s. Please visit: http://www.federalreserve.gov/releases/h15/data.htm
Ibbotson, owned by Morningstar, compiles an extensive list of asset returns and focuses on stock market based asset returns. http://corporate.morningstar.com/ib/asp/subject.aspx?xmlfile=1414.xml
Capital Strategies Press publishes an annual summary of indexed performance. Their numbers are independent of the projections made by the insurance carriers. http://CapitalStrategiesPress.com
Yahoo financial database: http://finance.yahoo.com/market-overview/
MarketLinking.com offers a public access database on a variety of market linked and indexed returns. Visit http://MarketLinking.com
Important Notes and Disclaimers (Please Read)
Copyright 2013, 2015 - All Rights Reserved
The performance comparisons used in this presentation make assumptions about future rates of return. These assumptions may or may not be valid. No one knows the future. Our only guide is the past and the future returns from various asset classes may not reflect their historical averages or ranges. The comparisons used herein are solely for the illustrative purposed.
Knowledge is power and when making financial decision knowledge is essential. Every consumer, whether making investment, savings or insurance decisions should carefully study the past performance of every asset class under consideration in order to make an informed decision about their expectations of the future performance of that asset class. There are a number of independent third party sources of asset returns. All consumers should consult one or more of these sources or other impartial third parties that maintain similar databases and/or analysis.
Meaningful financial planning requires unbiased information. Financial decisions about retirement funding, future retirement income, building a family nest egg, and purchasing insurance to provide financial protection for life’s unexpected events all require making assumptions about future performance. Unless these assumptions are based on expectations that have a reasonable probability of being close to future results, you are not planning, you are guessing.
Please discuss asset class returns with a competent financial professional before making a final decision about how to allocate your financial resources. This should be more than a cursory discussion. If the financial professional you have chosen to trust seems uniformed in any way on the subject of asset class performances, you should seriously consider replacing them and finding a more knowledgeable professional.
Please, please, please take the time to build your personal knowledge of the various financial products and the performance and liquidity characteristics of the asset classes available to you.
Important Notes and Disclaimers (continued)
Copyright 2013, 2015 - All Rights Reserved
The National Association of Insurance Commissioners (NAIC) has formulated guidelines for illustrations that must be presented to each potential purchaser of cash value life insurance. These multi-page illustrations are carrier, product and insured specific and contain substantial disclaimers, warnings and clarifications. The summary presented herein is taken from one set of annual yield assumptions and premium inputs. Alternate assumptions can produce radically different policy performance, including early lapse of the policy. The age and health status of the insured is likewise a key assumption that when changed, can lead to policy performance much less favorable to the policy owner. These types of life insurance policies can only be purchased through the services of a life insurance agent licensed in your state of residence. If you are interested in learning more about the retirement cash flow features of cash value life insurance, please confer with a licensed agent and have her/him prepare NAIC compliant illustrations using reasonable assumptions. We strongly advise that consumers never rely on the carrier’s highest historical return. A lower return assumption will make the outcome more likely. We also strongly advise that the interest rate spread assumed on any variable loan be reasonable in light of historical performance data. The spread is the difference between the assumed policy crediting rate and the rate charged on policy loans. Example: the policy yields an annual return of 8.3% and a loan charge of 5.5%, then the spread is 2.8%. A 2.8% spread is unreasonable and will create an internal compounding during the loan period that will inflate the available retirement funds substantially. Since a 2.8% spread has never been sustained during any past economic period, the results illustrated will be an illusion and will never occur. The variable loan rate of an indexed policy is tied to the commercial bond rate. Universal life insurance carriers invest policy cash values funds in the commercial bond market. If the insurance carrier charges the policy holder less than its bond earnings, the carrier will lose money. A history of commercial bond rates are published by the Federal Reserve and can be found on the Internet The spread is a critical element of all indexed universal life illustrations that employ the universal loan. If your agent glosses over the importance of the spread or seems fuzzy on its criticality, get a new agent, because you are not working with a true professional.