mmi a nalytics & i nsights 4 th quarter holidays!
TRANSCRIPT

INTRODUCTION SEASONALITY
2
This report will focus on what category/types that have the highest seasonality across Halloween, Thanksgiving and Christmas/New Years periods.
Seasonality is computed by taking the week’s dollar sales and dividing it by the 52 week average. Items greater than 125 would have some seasonality.
We will focus on those categories that may fall under the “holiday radar” that should be planned for.
All data is for the 2014 holiday season, total US MULO stores, with categories as defined by IRI.
3
Halloween
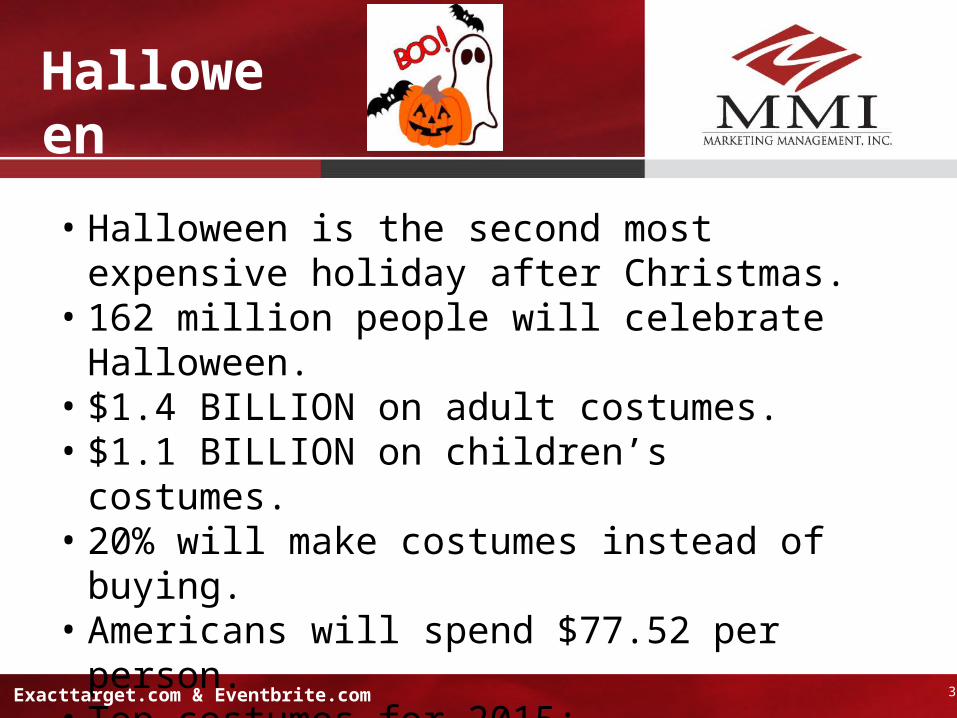
• Halloween is the second most expensive holiday after Christmas.
• 162 million people will celebrate Halloween.• $1.4 BILLION on adult costumes.• $1.1 BILLION on children’s costumes.• 20% will make costumes instead of buying.• Americans will spend $77.52 per person.• Top costumes for 2015: Superheroes, Military,
Zombies, Disney and Animal Heads (bestofhalloween.com)
Exacttarget.com & Eventbrite.com
4
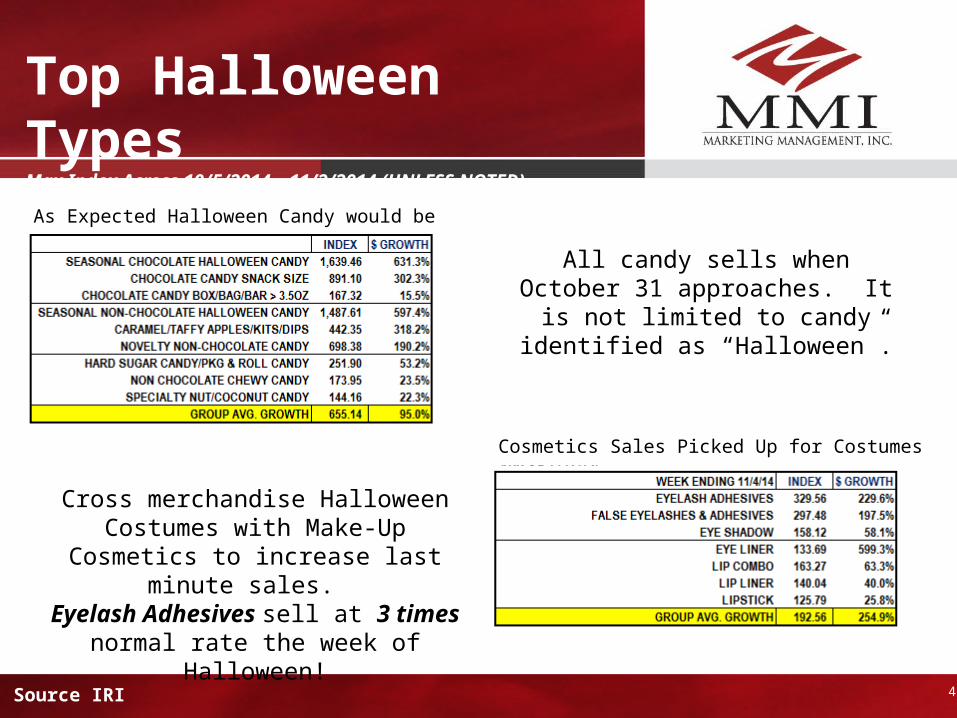
Top Halloween TypesMax Index Across 10/5/2014 – 11/2/2014 (UNLESS NOTED)
As Expected Halloween Candy would be seasonal.
Cosmetics Sales Picked Up for Costumes (WK OF 11/4/14).
Cross merchandise Halloween Costumes with Make-Up Cosmetics to increase last
minute sales. Eyelash Adhesives sell at 3 times normal
rate the week of Halloween!
All candy sells when October 31 approaches. It is not limited to candy
identified as “Halloween”.
Source IRI
5
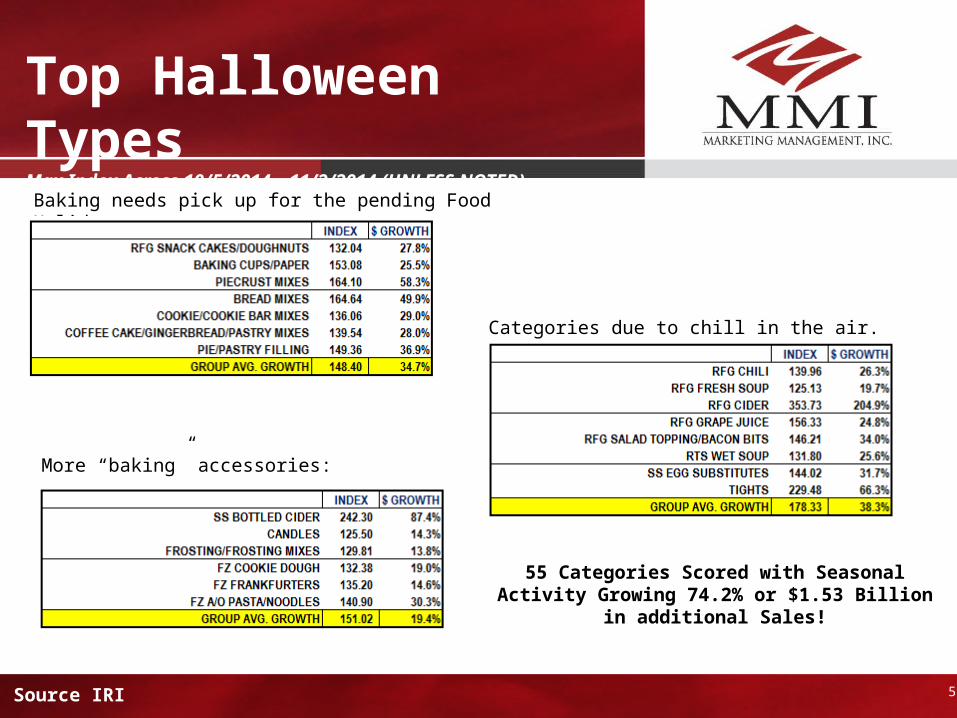
Top Halloween TypesMax Index Across 10/5/2014 – 11/2/2014 (UNLESS NOTED)
Baking needs pick up for the pending Food Holidays.
Categories due to chill in the air.
More “baking” accessories:
55 Categories Scored with Seasonal Activity Growing 74.2% or $1.53 Billion in additional Sales!
Source IRI
6
Thanksgiving
• Thanksgiving dinner for 10 people is expected to rise slightly this year to $49.41 (2014).
• Turkey production is at its lowest level in nearly three decades (due to bird flu).
• $2.4 billion spent on Thanksgiving feasts alone.• 51 million turkeys will be consumed in the U.S. • The average American may consume more than 4,500
calories and a whopping 229 grams of fat during a typical holiday gathering from snacking and eating a traditional Thanksgiving dinner with turkey and all the trimmings. (caloriecontrol.org)
USNews.com & Agweb.com
7
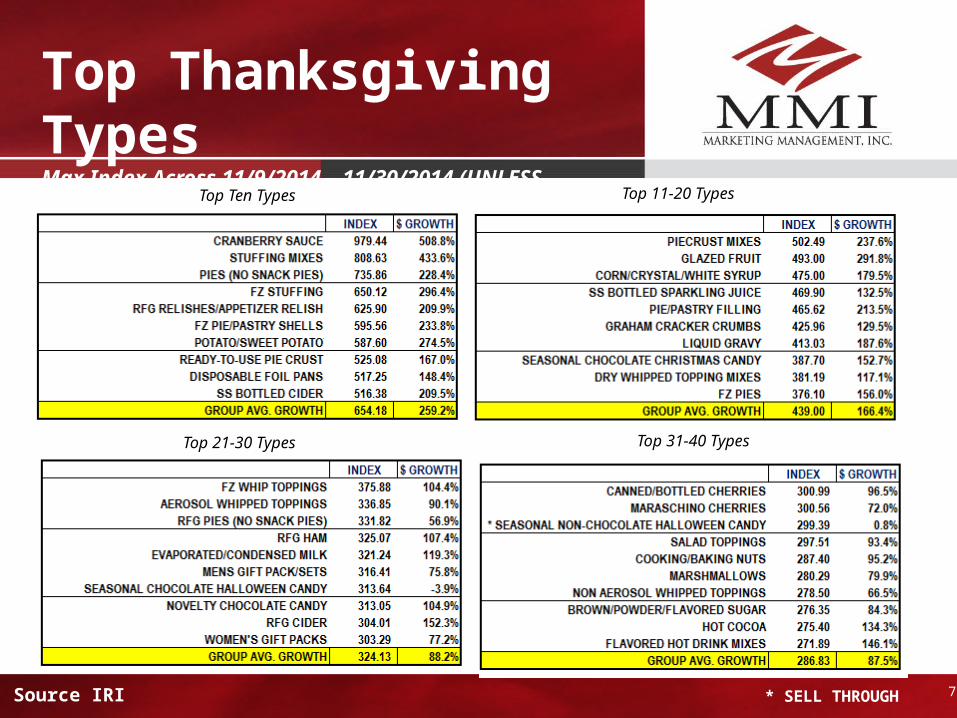
Top Thanksgiving TypesMax Index Across 11/9/2014 – 11/30/2014 (UNLESS NOTED)
Source IRI
Top Ten Types Top 11-20 Types
Top 21-30 Types Top 31-40 Types
* SELL THROUGH
8
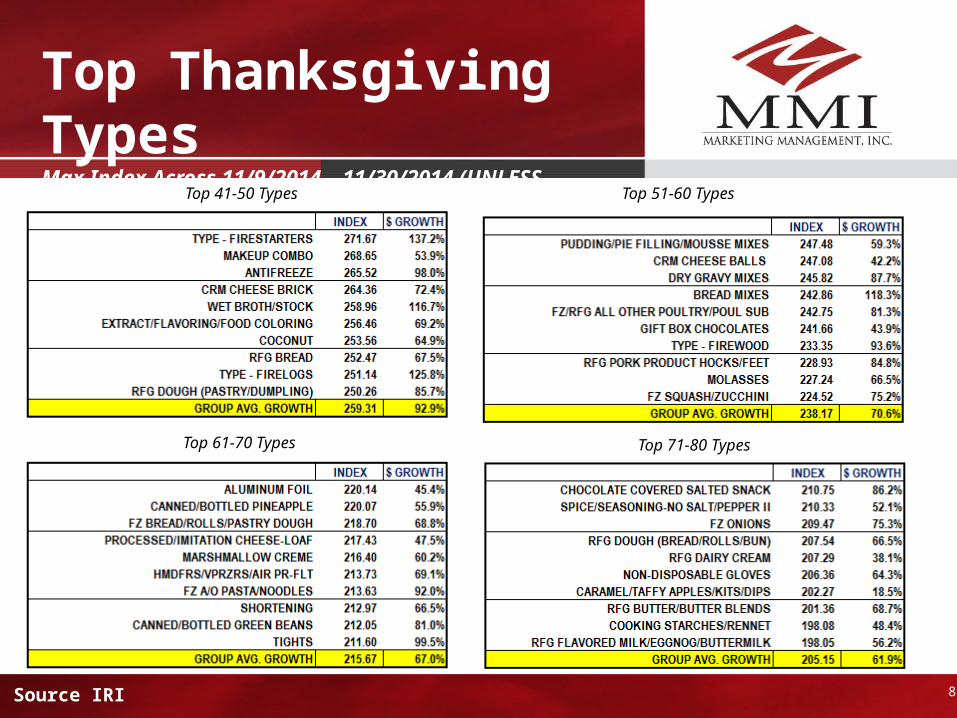
Top Thanksgiving TypesMax Index Across 11/9/2014 – 11/30/2014 (UNLESS NOTED)
Source IRI
Top 51-60 Types
Top 61-70 Types Top 71-80 Types
Top 41-50 Types
9
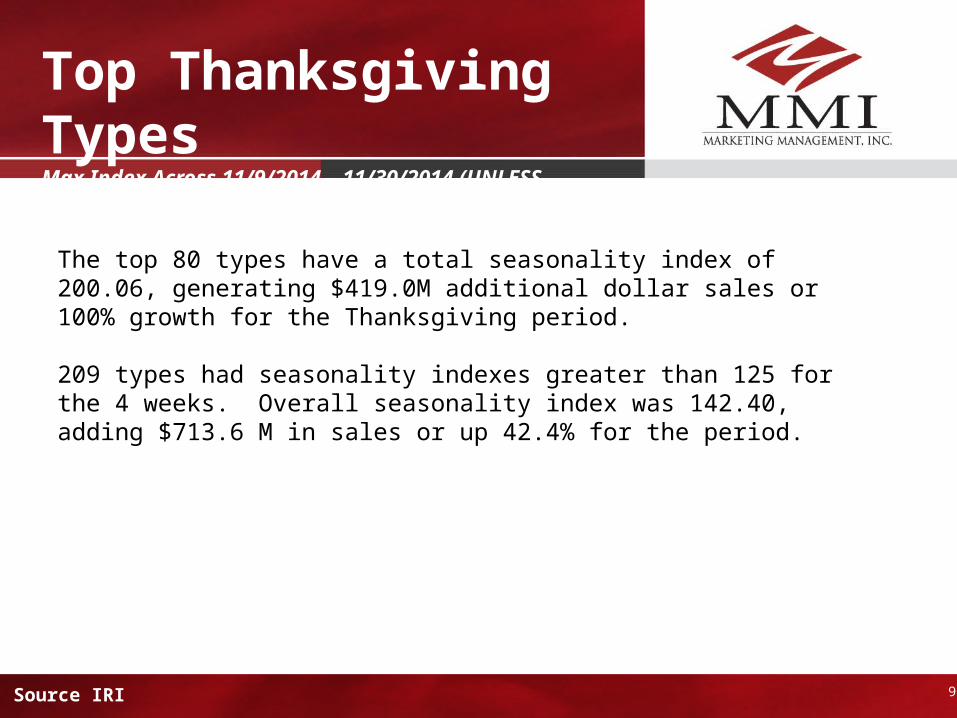
Top Thanksgiving TypesMax Index Across 11/9/2014 – 11/30/2014 (UNLESS NOTED)
Source IRI
The top 80 types have a total seasonality index of 200.06, generating $419.0M additional dollar sales or 100% growth for the Thanksgiving period.
209 types had seasonality indexes greater than 125 for the 4 weeks. Overall seasonality index was 142.40, adding $713.6 M in sales or up 42.4% for the period.
10
Christmas / New Year
• $116,273 (2014) is the cost of providing all twelve gifts in English Christmas carol: “12 days of Christmas”.
• Europeans baked fruitcake with nuts at the end of the nut season and saved them for one year, to be eaten at the beginning of the next harvest for good luck.
• According to QuickMoneyAnswers.com, every year it costs $188,906,668.97 to feed Santa and his reindeer cookies, milk and carrots on Christmas night.
• Gingerbread dates back to Greece in 2400 B.C.E.
• Eggnog, a favorite holiday treat, derives from the British aristocracy, is warmed milk and egg beverages laced with expensive spices and brandy or sherry to keep it from spoiling
• Average Christmas Dinner has 956 Calories and 48 grams of Fat.
TheDailyMeal.com – Kitchendaily.com
11
Christmas / New Year
• Thirty-eight percent of us gifted with fruitcakes give them to someone else, possibly making them the most popular “re-gifted” item ever.
• Twenty-two million people in the United States have turkey for Christmas dinner.
• Animal Crackers made their debut in 1902 at Christmas. The string on the box was created so the box could be hung on a Christmas tree.
• Food Network UK found that it takes 47 years for us to cook Christmas dinner without any mistakes. The study found 1/3 of us never get it right. - (where is the store dietitians?)
• The average person gains less than a pound during the holiday stretch beginning with Thanksgiving and ending at the new year, according to a study reported in the New England Journal of Medicine.
thesouthinmymouth.com
12
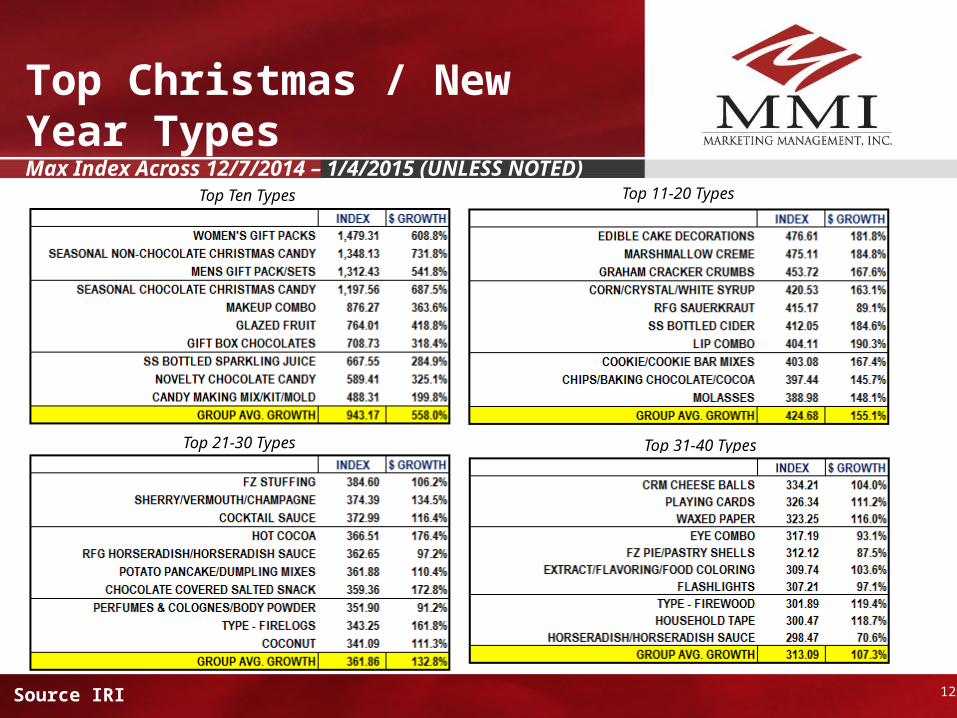
Top Christmas / New Year TypesMax Index Across 12/7/2014 – 1/4/2015 (UNLESS NOTED)
Top Ten Types Top 11-20 Types
Top 21-30 Types Top 31-40 Types
Source IRI
13
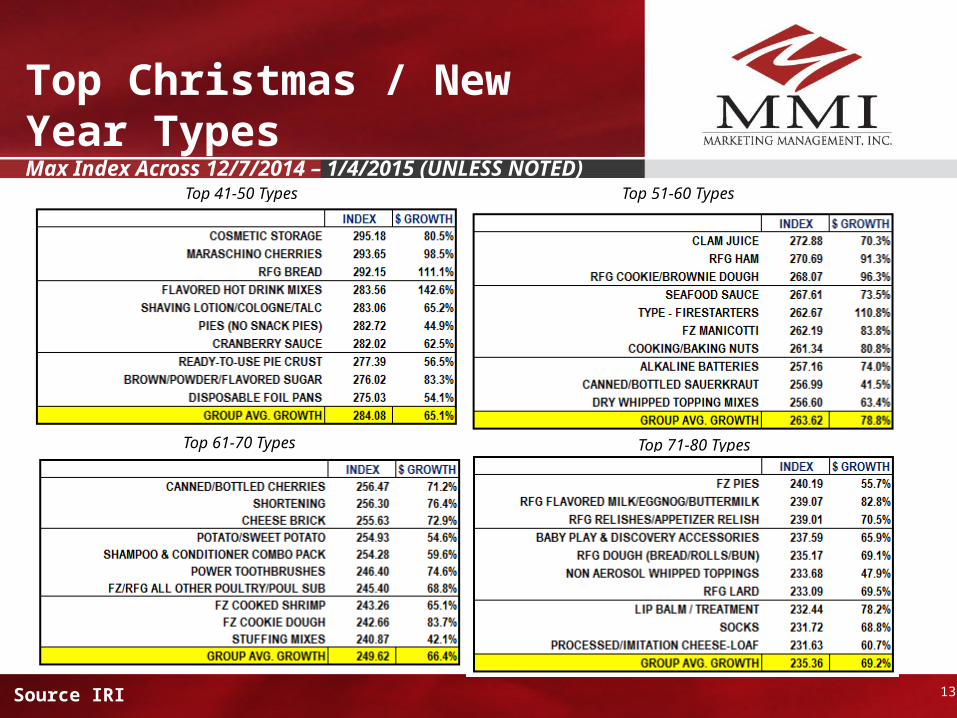
Top Christmas / New Year TypesMax Index Across 12/7/2014 – 1/4/2015 (UNLESS NOTED)
Top 51-60 Types
Top 61-70 Types Top 71-80 Types
Top 41-50 Types
Source IRI
14
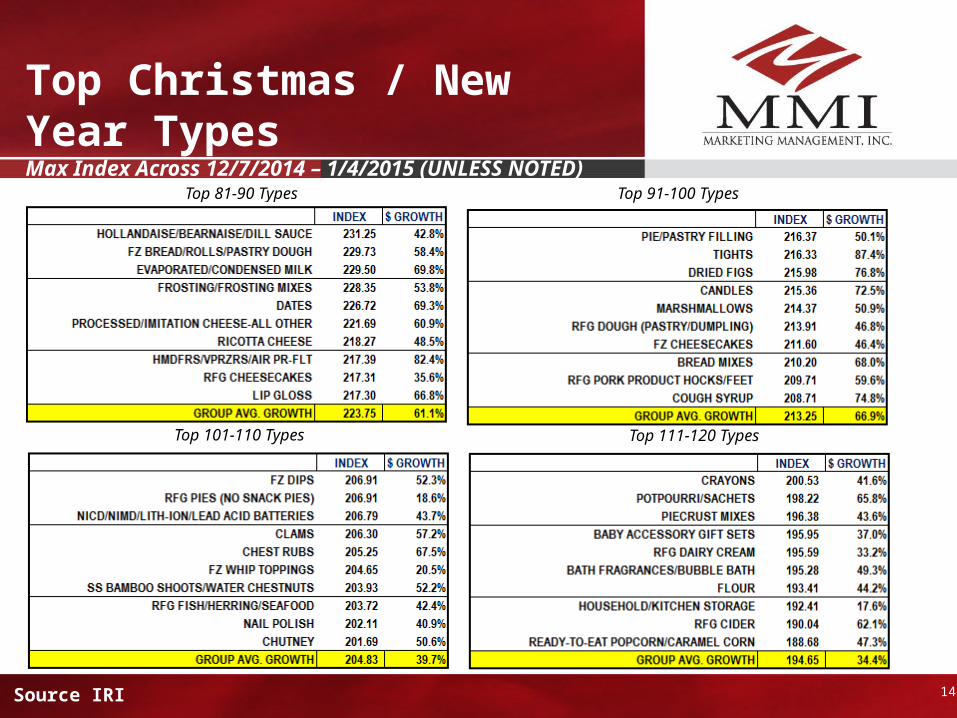
Top Christmas / New Year TypesMax Index Across 12/7/2014 – 1/4/2015 (UNLESS NOTED)
Top 91-100 Types
Top 101-110 Types Top 111-120 Types
Top 81-90 Types
Source IRI
15
Top Christmas / New Year TypesMax Index Across 12/7/2014 – 1/4/2015 (UNLESS NOTED)
Christmas/New Years weeks had 308 types indexing high (over 125). Overall index average was 217.14 for the period. Added $1.111 Trillion in sales or 39.3% increase.Total sales for the group was $3.9 Trillion.
Top 100 types had an average index of 351.25, selling $1.175 Trillion, up $629M or 115.2%.

For more information about MMI Analytics and Insights, please contact:
Analytics & Insights
CONTACT US
16