mmoon ni iit ttooorrriinnggg rrre eep ppoorrtt oonn iiim ...mdm.nic.in/files/mi reports/half yearly...
TRANSCRIPT

1 | P a g e
MMMooonnniiitttooorrriiinnnggg RRReeepppooorrrttt ooonnn IIImmmpppllleeemmmeeennntttaaatttiiiooonnn ooofff MMMDDDMMM iiinnn ttthhheee UUUTTT ooofff DDDaaammmaaannn &&& DDDiiiuuu fffooorrr
ttthhheee ppp eeerrriiioooddd ooofff 111sss ttt AAAppprrriiilll 222000111111 tttooo 333000 ttthhh SSSeeepppttteeemmmbbbeeerrr 222000111111 (District covered: Daman)
Dr. R. C. Patel Sandhya S. Das
Nodal Officer Research Associate
Department of Education [CASE]
Faculty of Education and Psychology
The Maharaja Sayajirao University of Baroda
Vadodara 390 002

2 | P a g e
September, 2011
1. General Information
No. Information Details
1. Name of the monitoring institute The M. S. University of Baroda
2. Period of the report 1st April to 30
th September 2011
3. Fund Released for the period -
4. No. of Districts allotted 1
5. Districts’ name Daman
6. Date of visit to the Districts / Schools
13th
to 25th
June, 2011
The Nodal Officer visited during 8th
to 9th
August.
7.
Total number of elementary schools (primary and
upper primary to be counted separately) in the
Districts
Primary: 34 Schools
Upper Primary: 24 Schools
8.
Number of elementary schools monitored
(primary and upper primary to be counted
separately)
Primary: 19 Schools
Upper Primary: 21 Schools
9. Types of school visited
Out of total 40 visited schools there were
4 schools coming under the category of
higher gender gap, 3 under the category
of school with minimum 3 CWSN, 6
under civil work, 5 schools coming under
the category of schools with drop out
children, 4 schools coming under the
category of schools having sizeable
number of OoSC and which witness in-
bound and out-bound seasonal migration,
while all 21 middle schools were coming
under the category of CAL schools.
a) Special training centers (Residential) N. A.
b) Special training centers (Non Residential) N. A.
c) Schools in Urban Areas N. A.
d) School sanctioned with Civil Works 3
e) School from NPEGEL Blocks N. A.
f) Schools having CWSN 12 (3 schools with criterion)

3 | P a g e
g) School covered under CAL programme All 21 Middle schools
h) KGBVs Nil
10. Number of schools visited by Nodal Officer of
the Monitoring Institute
10
11. Whether the draft report has been shared with the
SPO : YES / NO
Yes
12.
After submission of the draft report to the SPO
whether the MI has received any comments from
the SPO: YES / NO
13. Before sending the reports to the GOI whether
the MI has shared the report with SPO: YES / NO
Yes

4 | P a g e
Introduction:
In accordance with the constitutional commitment to ensure free and compulsory education
for all children up to the age of 14 years, provision of universal elementary education has
been a salient feature of national policy since independence. This resolve has been spelt out
emphatically in the National Policy of Education (NPE), and the Programme of Action
(POA) 1992. A number of schemes and programmes were launched in pursuance of the
emphasis embodied in the NPE and the POA. These included the scheme of Operation
Blackboard (OB); Non Formal Education (NFE); Teacher Education (TE); Mahila Samakhya
(MS); State specific Basic Education Projects like the Andhra Pradesh Primary Education
Project (APPEP), Bihar Education Project (BEP), Lok Jumbish (LJP) in Rajasthan, Education
For All Project in Uttar Pradesh; Shiksha Karmi Project (SKP) in Rajasthan; National
Programme of Nutritional Support to Primary Education (MDM); District Primary Education
Programme (DPEP).
The Scheme of SSA a national flagship programme, is being implemented in all districts of the
country. The aim of SSA is to provide useful and relevant elementary education for all children
in the 6-14 age groups by 2010. The scheme of SSA was launched in 2001. The goals of SSA are
as follows:
All 6-14 age children in school/EGS centre/Bridge Course by 2005.
Bridge all gender and social category gaps at primary stage by 2007 and at elementary
education level by 2010.
Universal retention by 2010.
Focus on elementary education for satisfactory quality with emphasis on education for
life.
The programme covers the entire country with special focus on educational needs of girls,
SCs/STs and other children in difficult circumstances. The programme seeks to open new
schools in those places which do not have schooling facilities and strengthen existing school
infrastructure through provision of additional class rooms, toilets, drinking water,
maintenance grant and school improvement grant. A number of initiatives, including
distribution of free textbooks, target these children under the programme. The SSA also seeks
to provide computer education even in the rural areas.
Monitoring Institution:
Since quality is a major concern under the Sarva Shiksha Abhiyan, its monitoring is a
priority. 41 Social Science Institutes of national stature have been given the work of
Monitoring of Implementation of Sarva Shiksha Abhiyan (SSA) in States & UTs. In larger
5 | P a g e
States; more than one Institute have been assigned the task of Monitoring. These Monitoring
Institutes (MIs) are required to make field visit and report on progress of SSA at the ground
level every six months.
The MI is expected to cover 40 schools (Schools, STP centers, NPEGEL, KGBV) of the
Districts allotted to them in a period of six months so that all districts are covered in a two-
year period.
Methodology:
Research Method: Survey method of research was followed.
Population: All the government schools (there were 34 Primary and 24 Upper Primary
(Middle) schools in the district), STP centers, KGBVs, and NPEGELs.
Sample: 40 government schools as per given criteria were visited. 19 Primary and 21 Middle
schools visited. Out of total 40 visited schools there were 4 schools coming under the
category of higher gender gap, 3 under the category of school with minimum 3 CWSN, 5
schools coming under the category of schools with drop out children, 4 schools coming under
the category of schools having sizeable number of OoSC and which witness in-bound and
out-bound seasonal migration, while all 21 middle schools were coming under the category of
CAL schools.
Data Collection: Data was personally collected by MI by visiting each school. Best effort
was made to make a surprise visit without informing the school authorities. All the
information required in the tool was collected by checking the records, through critical
observation, discussing with the teachers, asking children, parents if they were available.
Data was also collected from the CRCCs and BRCCs, DPO and SPO. Continuous follow up
was done to collect data from the DPO and SPO.
Data Analysis: The collected data was compiled and analyzed quantitatively and content
analysis was done wherever required. Frequency and percentage was calculated. Data was
also described wherever required.
Schedule:
1st June to 12
th June: Staff members were called up for training.
12th
June: 7 Field Investigators and the Research Associate left for Daman district.
13th
to 15th
June: Field Investigators were sent to different schools of Daman district for pilot
study as a part of training.
16th
to 25th
June: Monitoring of Daman district was in progress.
26th
to 27th
June: Compilation work was completed.
8th
to 9th
August the Nodal Officer visited 10 schools in Daman district.

6 | P a g e
Introduction:
Daman was discovered in 1523 by Diogo-de-Melo, who was heading towards Ormuz but was
caught in a violent storm and his boat was blown towards the coast of Daman. Soon after it
was settled as a Portuguese colony and remained so for over 400 years. Daman was occupied
by the Portuguese in 1531, and was formally ceded to Portugal in 1539 by the Sultan of
Gujarat. It remained a Portuguese colonial possession until it was annexed by Indian forces
on 19 December 1961. From 1961-87, it was a part of the union territory of Goa, Daman and
Diu. In 1987, it became a part of the newly formed union territory of Daman and Diu. Daman
district is one of the two districts of the union territory of Daman and Diu on the western
coast of India, surrounded by Valsad District of Gujarat state on the north, east and south and
the Arabian Sea to the west. Daman lies at the mouth of the Daman Ganga River. The
Damanganga river divides the town into the Moti Daman in the south and the Nani Daman in
the north rises from the Sahyadri hills. A larger fort was built in Motidaman in the 16th
century to guard against the Mughals who ruled the area until the Portuguese arrived. It still
stands today, most of it preserved in its original form. Daman, along with
neighboring Vapi, Bilimora and Silvassa form an important manufacturing hub. A variety of
products like pesticides, chemicals, fertilizers, toys, electronics, dyes, printing ink, windmills,
plastics, etc. are manufactured here. People enjoy a modest quality of life here as Daman has
a number of reputed hospitals, schools and other public institutions. Educated and well
qualified people from all over India migrate here in search of work. Daman is well-connected
to other parts of India primarily though NH-8. The neighboring city Vapi (located
12 kilometres (7.5 mi) from Daman) is connected to the Indian rail network.

7 | P a g e
The district has an area of 72 km², and a population of 113,949 (2001 census), which
increased 83% between 1991 and 2001.
As of 2001 India census, Daman had a population of 35,743. Males constitute 53% of the
population and females 47%. Daman has an average literacy rate of 76%, higher than the
national average of 64.84%: male literacy is 81% and female literacy is 70%. In Daman, 12%
of the population is under 6 years of age.
Most of the population in Daman consists of skilled and educated migrant workers (from all
over India) who reside in Daman for a period of around 4 to 5 years. The local population
consists of mostly fishermen called Tandels in Gujarati. The major part of the population is a
mixture of Hindus, Muslims and Christians, with Hindus being dominant in number. There
has never been any communal violence reported in this area.

8 | P a g e
3. District Level Half Yearly Monitoring Report on MDM
3.1 Name of the District Daman
3.2 Date of visit to the
District/EGS/Schools
Visit made by the Research Associate & Field Investigators during
15th
to 25th
June.
Visit made by the Nodal Officer to 10 schools during 8th
to 9th
August.
3.3 Number of Schools
Visited
There were total 58 schools in Daman district from which 40
were visited.
1. Regularity in supply of hot cooked meal:
a) Regularity in
Serving MDM
i. Percentage of
Schools serving
hot cooked meal
regularly.
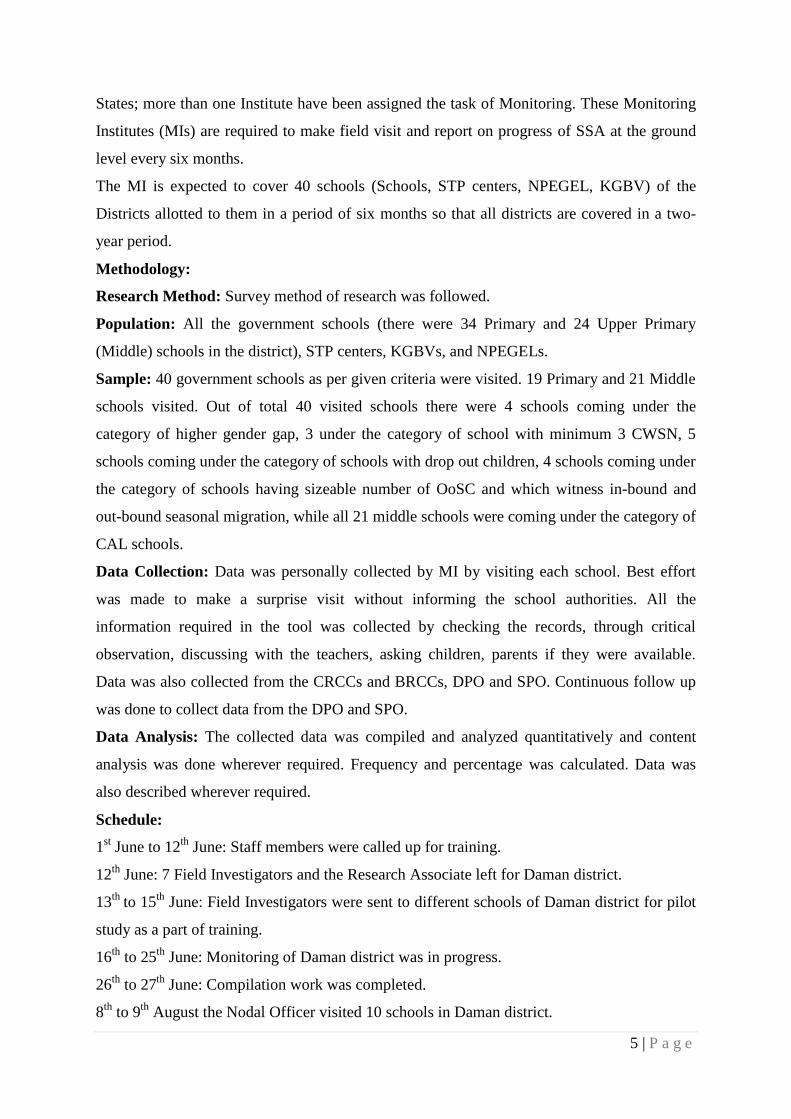
The MDM was prepared in the school. Hot MDM was served in all the
40 schools on both the days of visit.
The MDM was served on time in all the schools.
As reported by the teachers nutri candy was not given to children.
Good quality MDM served
ii. If hot cooked meal is not served regularly,
reasons thereof.
N.A.
iii. Is there any prescribed norm for consideration
for irregularity -in serving MDM
N.A.
iv. Quality and quantity of meal in the opinion
of teachers, students or SMC members and
any problems to children in serving MDM.
The quality of MDM was good in all the
school. All the students were served the meal
as many times they wished to have. However;
there was problem of space in most schools.
The children used to stand and have, or take
meal in the classroom.
9 | P a g e
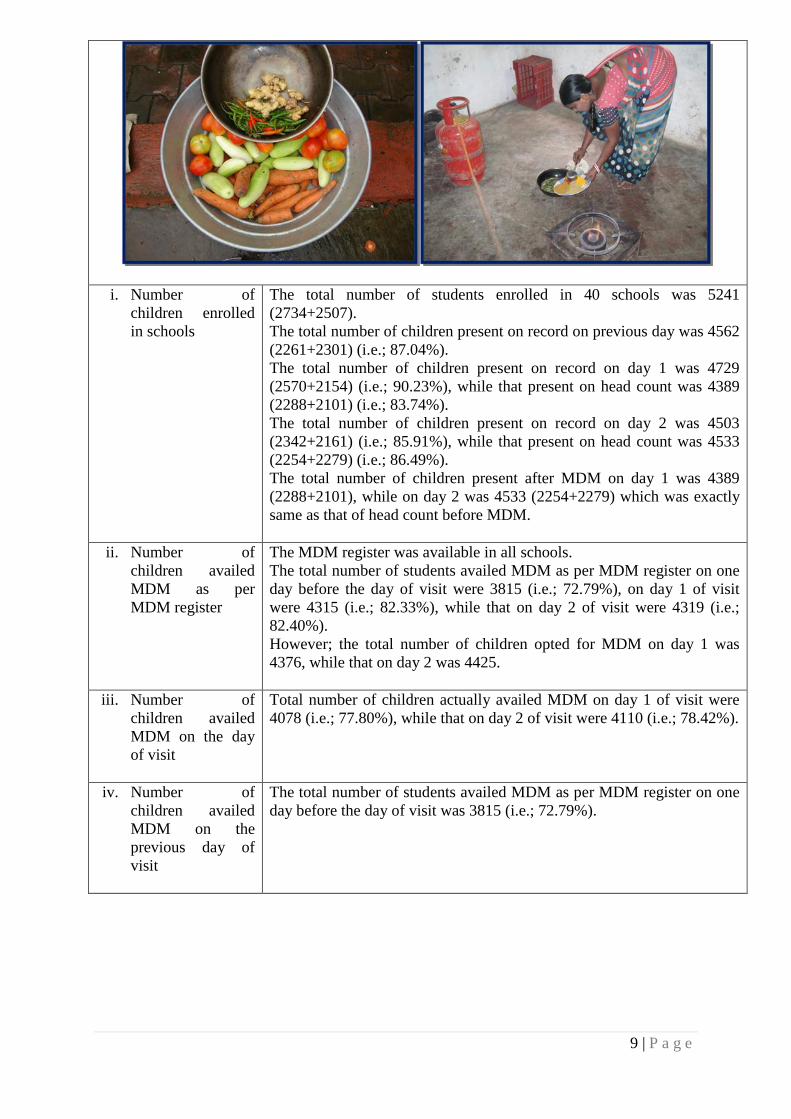
i. Number of
children enrolled
in schools
The total number of students enrolled in 40 schools was 5241
(2734+2507).
The total number of children present on record on previous day was 4562
(2261+2301) (i.e.; 87.04%).
The total number of children present on record on day 1 was 4729
(2570+2154) (i.e.; 90.23%), while that present on head count was 4389
(2288+2101) (i.e.; 83.74%).
The total number of children present on record on day 2 was 4503
(2342+2161) (i.e.; 85.91%), while that present on head count was 4533
(2254+2279) (i.e.; 86.49%).
The total number of children present after MDM on day 1 was 4389
(2288+2101), while on day 2 was 4533 (2254+2279) which was exactly
same as that of head count before MDM.
ii. Number of
children availed
MDM as per
MDM register
The MDM register was available in all schools.
The total number of students availed MDM as per MDM register on one
day before the day of visit were 3815 (i.e.; 72.79%), on day 1 of visit
were 4315 (i.e.; 82.33%), while that on day 2 of visit were 4319 (i.e.;
82.40%).
However; the total number of children opted for MDM on day 1 was
4376, while that on day 2 was 4425.
iii. Number of
children availed
MDM on the day
of visit
Total number of children actually availed MDM on day 1 of visit were
4078 (i.e.; 77.80%), while that on day 2 of visit were 4110 (i.e.; 78.42%).
iv. Number of
children availed
MDM on the
previous day of
visit
The total number of students availed MDM as per MDM register on one
day before the day of visit was 3815 (i.e.; 72.79%).

10 | P a g e
2. Regularity in supply of Food grain:
(i) Is school/implementing agency
receiving food grain regularly? If
there is delay in delivering food
grains, what is the extent of delay
and reasons for the same?
All schools received food grain regularly.
For the current month it was yet to be distributed, as the
schools had just re-opened after the summer vacation.
However; previous year’s stock was maintained in the
schools.
ii. Is the quality of food grain FAQ? The quality of food grains was good in all the schools.
Good quality of food grains, pulses, condiments and fruits

11 | P a g e
iii. Is buffer stock of one-month’s
requirement maintained?
Buffer stock of one-month’s requirement was
maintained in all schools.
Stock for MDM
iv. Is the food grains delivered at the
school?
The food grains were delivered at all the schools.
The vegetables and fruits were also delivered daily in all
the schools.
Fruits delivered at the schools

12 | P a g e
3. Payment of Cost of food grain to FCI:
The cooking materials were provided at the schools.
a) Enabling conditions: -
i. Is payment of cost of food grain to FCI made monthly? Which the stipulated time? -
ii. Has payment of cost of food grain to FCI made for the previous month? -
iii. Reasons for irregular payment, if any N.A.
4. Regularity in Delivering Cooking Cost at the school level:
The cooking materials were provided at the schools.
i. Number of schools /implementing agency
receiving cooking cost in advance regularly?
-
ii. If there is delay in delivering cooking cost
what is the extent of delay and reasons for it?
There was a delay in delivering the cooking
materials for two weeks as the schools had just re
open after the summer vacation
iii. In case of delay, how school/ implementing
agency manages to ensure that there is no
disruption in the feeding programme?
The schools managed with the available stock of
rice, beans and pulses.
iv. Is cooking cost paid by Cash or through
banking channel?
N. A.
5. Social Equity:
a) In the classroom:
i. Sitting arrangement for the children during serving of MDM.
The seating arrangement was as per the grades, boys and girls in separate queue, as per their wish, all
together, in small groups.
The seating arrangement was inclusive in nature.

13 | P a g e
Seating and Serving arrangement
ii. Did you observe any gender or caste or community discrimination in cooking or serving or seating arrangements? No.
6. Menu:
i. Number of schools where menu
is displayed on the wall and
noticeable
The menu was available in all the schools. The menu was
displayed in 34 schools. In 24 schools the MDM was
prepared as per the menu.

14 | P a g e
ii. Who decides the menu The menu was decided by the MDM Collector.
iii. Does daily menu includes
rice/wheat, pulses (dal) and
vegetable
Yes, the daily menu included rice/wheat, pulses (dal) and
green vegetable. The daily menu also included seasonal
fruits like; banana. During the period of monitoring banana
was served on alternate days.
Following table depicts the weekly menu:
Menu displayed on the notice board. MDM served as per the menu. Fruits served in the MDM.
iv. Number of schools where
variety of foods is served daily
In all schools there was variety in the served meal.
Green vegetables in MDM. Salad served in MDM
v. Number of schools where
same food is served daily
No

15 | P a g e
7. Community Mobilization:
i. Familiarity level of the SMC members
with their roles and responsibilities
and eligibility and entitlement of
children as notified by the State
Government.
-
ii. Number of schools where there is a
roaster of parents for daily monitoring
and supervision of MDMS
In 14 schools the roaster was maintained for
monitoring and supervision of MDM by the parents.
iii. Number of members received training
regarding MDMS and its monitoring
No
iv. Frequency of SMCs meetings held and
issues related to MDMS discussed.
During the previous year; in 4 schools (School no.
12, 13, 29, 30; i.e.; GPS and GMS Bharwadfalia,
GPS Khariwadi and GPS Kharawad) it was reported
that the SMC meetings were held to discuss about
MDM.
v. Frequency monitoring and cooking
and serving MDMS by SMC members
For the previous academic year; in 2 schools (School
no. 12, 30) it was reported that the meetings were
held once in a year, while in 2 schools (School no.
13, 29) it was held once in 2 months.
It was reported by the SMC members that meetings
were held on stock and quality of MDM.
vi. Contribution made by the community
for MDMS
-
vi. Extent of participation by
SMC/PTA/MTA/PRI/Urban local bodies
The extent of participation by SMC was reported to
be good in these schools.
8. MIS
i. Number of schools where MDM register is in place and
maintained
MDM register was maintained
in all 40 schools.
ii. Whether any training on maintaining MDM information is
imparted to the teacher/head teacher?
No
iii. What is Mechanism of flow of Information from school to
district and onwards
-
iv. What is the prevalent MIS System? -
v. What is the interval of furnishing information from School to
Block and onwards?
-
9. Financial Management:
It was managed by the district.
i. Nature of financial records and registers maintained at the implementing agency
level.
N. A.
ii. Mode of transfer of fund to the implementing agency level from the state or district
levels.
N. A.
iii. Type of account maintained and System for the withdrawal of fund from the
SMC/VEC account.
N. A.
iv. If the proposals for expenditure and expenditure statements are shared with the
community. If yes, is there any instance of community expressing
objection/reservation about any transaction?
N. A.
10. School Health Programme

16 | P a g e
i. Who Number of schools where
school Health Card maintained for
each child? administers these
medicines and at what frequency
where MDM register is in place
and maintained
The school health cards were maintained for each child
in all schools.
ii. What is the frequency of health
check-up?
As reported by the school authorities; in 20 schools the
medicines were administered twice in a year, in 9
schools it was administered once in a year, in 4 schools
it was reported that it was administered thrice in a year,
in 3 schools it was reported that the frequency of health
check up was four times in a year, in 2 schools it was 2
times in a month, in 1 school it was 3-4 times in a
month, while in 1 school it was reported that it was not
certain.
iii. Number of children given Vitamin
A
In 33 schools it was reported that the children were
given micro nutrients.
iv. Number of children given IFA
Tablets
In 33 schools it was reported that the children were
given micro nutrients.
v. Number of children given de-
worming tablets.
In 33 schools it was reported that the children were
given micro nutrients.
vi. Who administers these medicines? The nearby PHC and the medical team send by SSA
used to administer the medicines.
vii. Number of school where iodized
salt is used
viii. Number of schools where children
wash their hand before and after
eating
In 36 schools [except in School no. 16, 17, 25, 30; i.e.;
GPS and GMS Kathiria, GMS Nani Daman (E), GPS
Kharawad] the children washed their hands before and
after having meal.
Students washing hands befor and after MDM.

17 | P a g e
11. Status of Cook cum Helpers
i. Number of school where cook cum
helpers are engaged as per the norm
of GOI or State Govt.
Yes
ii. Who engages cook cum helpers in
these schools
The cooks cum helpers were appointed by the District
Project Office.
iii. Number of schools served by
centralized kitchen
No.
iv. Number of schools where SHG is
involved
No
v. What is remuneration paid to Cook
cum helpers, mode of payment and
intervals of payment?
It was 1000 rupees fixed remuneration. The
remuneration was not paid regularly. During interaction
with the cook cum helpers, they all complained about
the remuneration which was unsatisfactory, paid in
installment and irregular in payment. The mode of the
payment was through bank.
vi. Social Composition of cooks cum
helpers?
(SC/ST/OBC/Minority/others)
There were total 87 cook cum helper in 40 schools. 24
belonged to ST caste, 2 to general category, while 61
were OBC.
The cook cum helpers. The Nodal interacting with the cook cum helpers in GMS Kathiria
12. Infrastructure

18 | P a g e
i. Number of
school where
pucca Kitchen
cum Stores is
available and in
use
In 35 schools the pucca kitchen shed was available and in use. In rest 5
schools the MDM was cooked in other spare classrooms. Out of these 5
schools; in 2 schools (Dhabel GPS & GMS running in same building at
different shifts) there was a MDM shed but it was not utilized since many
years due to the improper location of it. In 1 school (School no. 37, Dunetha
GMS) the kitchen shed was in use however; it needed repair as the roof and
the floor both were in wrecked condition.
The food grains were stored in kitchen shed, spare classrooms and
headmaster’s office.
ii. Number of schools where pucca kitchen cum store is not available No
Other facilities like mixer grinder, and storage utensils.
19 | P a g e
13. Staffing
i. Number of staff engaged at district level for management and monitoring of MDMS -
ii. Number of staff engaged at block level for management and monitoring of MDMS -
iii. Is there any district level task force constituted -
14. Monitoring
i. How many district level steering cum monitoring
committee meeting held in current financial year
Yes. The monitoring was regular it
varied from schools to schools. It was
1-8 times in a year.
ii. How many state level steering cum monitoring
committee meeting held in the current financial year
By DPO and the ADEI.
Positive points:
1. All children had the meal and liked the taste.
2. Both quality and quantity of MDM was good.
3. Seasonal fruits served to children.
4. Children usually not involved in serving the meal.
5. There was active involvement of teachers in monitoring the MDM programme
especially observed in Primary schools.