mmwave demo visualizer - ti.com
TRANSCRIPT
1SWRU529C–May 2017–Revised April 2020Submit Documentation Feedback
Copyright © 2017–2020, Texas Instruments Incorporated
mmWave Demo Visualizer
User's GuideSWRU529C–May 2017–Revised April 2020
mmWave Demo Visualizer
This user's guide presents the TI Gallery app – mmWave Demo Visualizer – for configuring mmWavesensors and visualizing point cloud objects generated by the mmWave SDK demo. The mmWave DemoVisualizer app is meant to be used in conjunction with the mmWave SDK demo running on the TI EVM formmWave devices. The app can also be reached at the TI Gallery website – search formmWave_Demo_Visualizer. The mmWave Demo Visualizer app is browser-based and can be run on anyPC operating system (Windows®, Linux®, or macOS®), and TI recommends running the app using theChrome® browser for the best plotting performance.
Contents1 Setup Instructions............................................................................................................ 3
1.1 Browser Setup (First Time Only).................................................................................. 31.2 mmWave Device Setup ............................................................................................ 31.3 Serial Port Setup.................................................................................................... 3
2 CONFIGURE Tab............................................................................................................ 52.1 Platform .............................................................................................................. 52.2 SDK Version......................................................................................................... 52.3 Antenna Config (Azimuth Resolution - Degrees) ............................................................... 52.4 Desirable Configuration ............................................................................................ 52.5 Frequency Band (GHz) ............................................................................................ 52.6 Scene Selection – Best Range Resolution ...................................................................... 62.7 Scene Selection – Best Velocity Resolution .................................................................... 72.8 Scene Selection – Best Range ................................................................................... 82.9 Plot Selection........................................................................................................ 92.10 User Selected Configuration ..................................................................................... 10
3 PLOTS Tab ................................................................................................................. 123.1 X-Y Scatter Plot ................................................................................................... 123.2 Doppler Range Plot ............................................................................................... 133.3 Range Profile ...................................................................................................... 143.4 CPU Load .......................................................................................................... 153.5 Range-Doppler Heatmap......................................................................................... 163.6 Range-Azimuth Heatmap ........................................................................................ 173.7 3-D Scatter Plot.................................................................................................... 183.8 Display Parameters ............................................................................................... 183.9 Real-Time Tuning ................................................................................................. 203.10 Advanced Commands ........................................................................................... 213.11 Plot Settings ....................................................................................................... 22
4 Advanced Options.......................................................................................................... 224.1 Load Configuration From PC .................................................................................... 224.2 Getting the Version................................................................................................ 224.3 RCS ................................................................................................................. 234.4 Concurrent Recording of Processed Stream From mmWave Device ...................................... 23
5 Troubleshooting ............................................................................................................ 245.1 Console Message: Errors Returned by Device................................................................ 245.2 Serial Port Status Message: Not Switching to Hardware Connected or Both Ports Are Not
Showing Up ........................................................................................................ 245.3 Console Message: sensorStart Message Not Sent to Host ................................................. 245.4 Warning for Plots and Frame Rate.............................................................................. 25
www.ti.com
2 SWRU529C–May 2017–Revised April 2020Submit Documentation Feedback
Copyright © 2017–2020, Texas Instruments Incorporated
mmWave Demo Visualizer
5.5 Configuration Successful, but Plots Not Updating ............................................................ 256 Customizing the mmWave Demo Visualizer............................................................................ 257 Offline Version of the Visualizer .......................................................................................... 26
List of Figures
1 TI Cloud Agent Installation (First Time Setup) ........................................................................... 32 Device Manager Ports ...................................................................................................... 33 Serial Port Configuration in App ........................................................................................... 44 COM Port Status When Correct Ports Are Configured ................................................................. 45 COM Port Status When Ports Are Not Connected ...................................................................... 46 Valid Configuration ......................................................................................................... 117 X-Y Scatter Plot for Detected Objects ................................................................................... 128 Doppler Range Plot for Detected Objects .............................................................................. 139 Range Profile in Linear Scale............................................................................................. 1410 Range Profile in Log Scale ............................................................................................... 1411 Range and Noise Profile in Log Scale .................................................................................. 1512 CPU Load for Frame Rate = 30 fps (Example) ........................................................................ 1513 Doppler Range Heatmap.................................................................................................. 1614 Azimuth-Range Heatmap (Example) .................................................................................... 1715 3-D Scatter Plot............................................................................................................. 1816 Display Parameters – Profiling ........................................................................................... 1917 Display Parameters – Scene ............................................................................................. 1918 Display Parameters - Chirp/Frame....................................................................................... 2019 Range Peak Grouping Disabled (Left) and Enabled (Right).......................................................... 2120 Download Icon.............................................................................................................. 2621 Screen Pop-Up for Download Options .................................................................................. 26
TrademarksCode Composer Studio is a trademark of Texas Instruments.macOS is a registered trademark of Apple, Inc.Cortex is a registered trademark of Arm Limited.Chrome is a registered trademark of Google, Inc.Linux is a registered trademark of Linus Torvalds.Windows is a registered trademark of Microsoft Corporation.All other trademarks are the property of their respective owners.
www.ti.com Setup Instructions
3SWRU529C–May 2017–Revised April 2020Submit Documentation Feedback
Copyright © 2017–2020, Texas Instruments Incorporated
mmWave Demo Visualizer
1 Setup Instructions
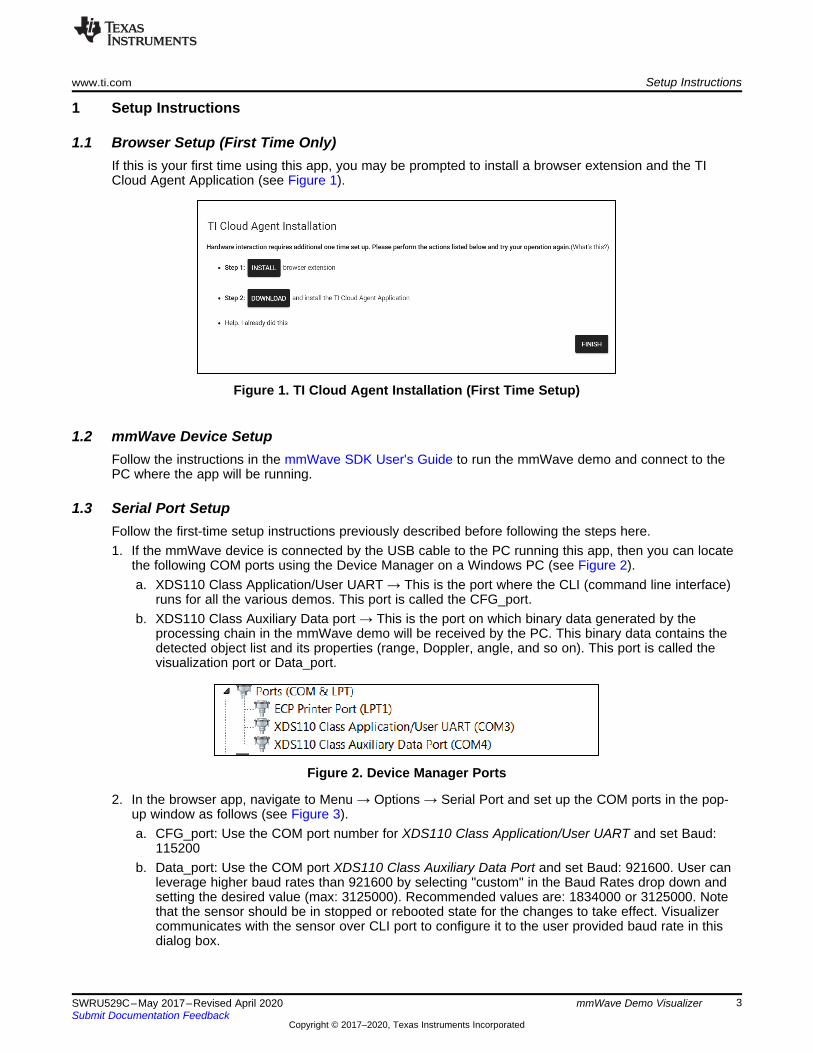
1.1 Browser Setup (First Time Only)If this is your first time using this app, you may be prompted to install a browser extension and the TICloud Agent Application (see Figure 1).
Figure 1. TI Cloud Agent Installation (First Time Setup)
1.2 mmWave Device SetupFollow the instructions in the mmWave SDK User's Guide to run the mmWave demo and connect to thePC where the app will be running.
1.3 Serial Port SetupFollow the first-time setup instructions previously described before following the steps here.1. If the mmWave device is connected by the USB cable to the PC running this app, then you can locate
the following COM ports using the Device Manager on a Windows PC (see Figure 2).a. XDS110 Class Application/User UART → This is the port where the CLI (command line interface)
runs for all the various demos. This port is called the CFG_port.b. XDS110 Class Auxiliary Data port → This is the port on which binary data generated by the
processing chain in the mmWave demo will be received by the PC. This binary data contains thedetected object list and its properties (range, Doppler, angle, and so on). This port is called thevisualization port or Data_port.
Figure 2. Device Manager Ports
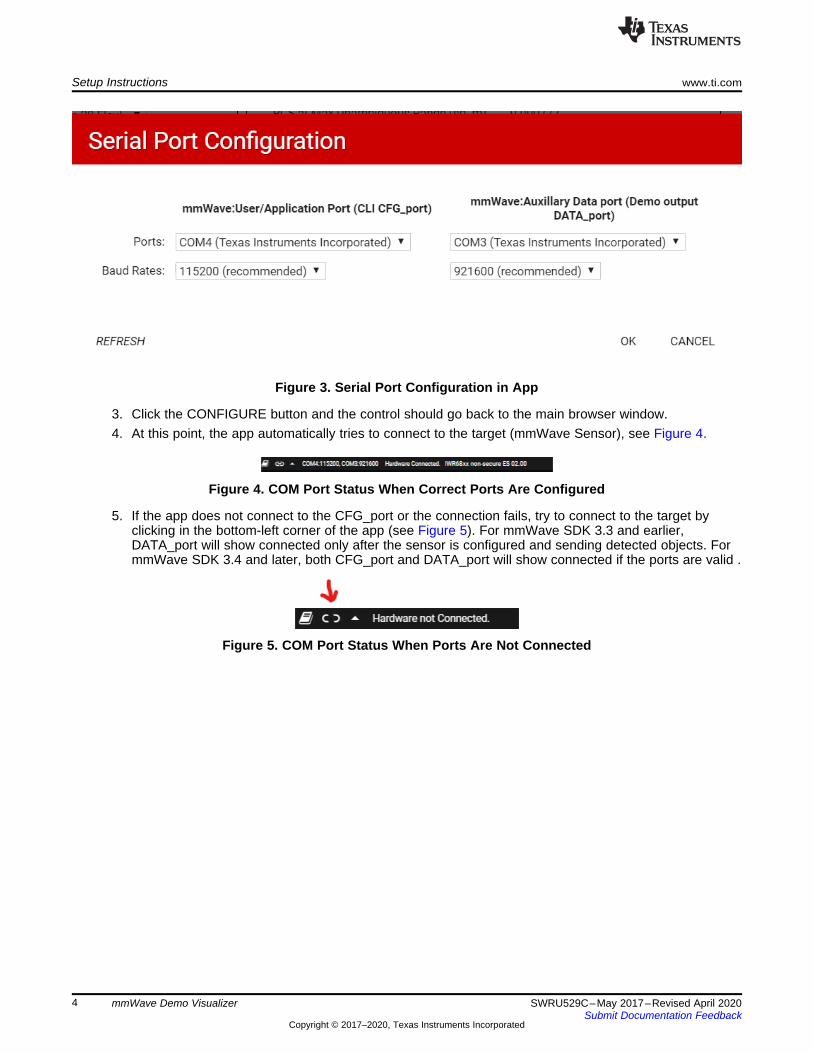
2. In the browser app, navigate to Menu → Options → Serial Port and set up the COM ports in the pop-up window as follows (see Figure 3).a. CFG_port: Use the COM port number for XDS110 Class Application/User UART and set Baud:
115200b. Data_port: Use the COM port XDS110 Class Auxiliary Data Port and set Baud: 921600. User can
leverage higher baud rates than 921600 by selecting "custom" in the Baud Rates drop down andsetting the desired value (max: 3125000). Recommended values are: 1834000 or 3125000. Notethat the sensor should be in stopped or rebooted state for the changes to take effect. Visualizercommunicates with the sensor over CLI port to configure it to the user provided baud rate in thisdialog box.
Setup Instructions www.ti.com
4 SWRU529C–May 2017–Revised April 2020Submit Documentation Feedback
Copyright © 2017–2020, Texas Instruments Incorporated
mmWave Demo Visualizer
Figure 3. Serial Port Configuration in App
3. Click the CONFIGURE button and the control should go back to the main browser window.4. At this point, the app automatically tries to connect to the target (mmWave Sensor), see Figure 4.
Figure 4. COM Port Status When Correct Ports Are Configured
5. If the app does not connect to the CFG_port or the connection fails, try to connect to the target byclicking in the bottom-left corner of the app (see Figure 5). For mmWave SDK 3.3 and earlier,DATA_port will show connected only after the sensor is configured and sending detected objects. FormmWave SDK 3.4 and later, both CFG_port and DATA_port will show connected if the ports are valid .
Figure 5. COM Port Status When Ports Are Not Connected
www.ti.com CONFIGURE Tab
5SWRU529C–May 2017–Revised April 2020Submit Documentation Feedback
Copyright © 2017–2020, Texas Instruments Incorporated
mmWave Demo Visualizer
2 CONFIGURE TabThis tab allows users select the parameters for configuring the mmWave device. In this document, thesubsection numbers dictate a certain sequence of programming so that precedent parameters are set firstfollowed by dependent parameters. Users can follow any sequence in configuring the settings, but notethat certain knobs, sliders, and drop-downs influence the values of other dependent parameters, and youmay have to readjust dependent parameters to obtain the desired selection.
2.1 PlatformThis is a drop-down menu that prompts users to select the correct mmWave device to which the app isconnected to through the serial port. If you are trying to just save config to PC, then select the mmWavedevice for which the desired configuration must generate.
2.2 SDK VersionThis is a drop-down menu that prompts users to select the matching SDK version as the one running onthe mmWave device. If the version does not match, then the GUI prompts an error when using the SendConfig to mmWave Device button or Load config from PC and send button. However, there is no suchcheck done when using the Save config to PC button, and users can choose the SDK version for whichthe compatible configuration should be generated.
2.3 Antenna Config (Azimuth Resolution - Degrees)This is a drop-down menu that prompts users to select the azimuth resolution and elevation configurationfor TI mmWave EVMs. The options for setting the azimuth resolution depends on the antenna layout onthe EVMs
Effects on other user knobs:• Affects the possible minimum and maximum values for all sliders in the scene selection.• When elevation is selected, the Scatter Plot selection results in a 3D plot in the plots tab.
CLI command details: defines RX and TX antenna mask in the channelCfg command and creates thechirpCfgs.
NOTE: Users must reboot the mmWave device when switching between options in this menu.
2.4 Desirable ConfigurationThis is a drop-down menu that prompts users to select the parameter that they are most concerned about,to tune the system resources towards that configuration. For more details, see Section 2.6. When the userselects a value in this menu, all the sliders, text boxes, checkboxes, and drop-downs (except for Platform)get reset to their default values (equivalent to pressing a Reset Selection button).
2.5 Frequency Band (GHz)This is a drop-down menu that prompts users to select the frequency band of operation. The mmWavesensors support two choices: wide band (4 GHz spanning 77 to 81 GHz/60 to 64 GHz) and narrow band(1 GHz spanning 76 to 77 GHz).
CLI command details: defines the start frequency in GHz in the profileCfg command.
CONFIGURE Tab www.ti.com
6 SWRU529C–May 2017–Revised April 2020Submit Documentation Feedback
Copyright © 2017–2020, Texas Instruments Incorporated
mmWave Demo Visualizer
2.6 Scene Selection – Best Range ResolutionThis section guides users through the sequence of selections they should follow when Best RangeResolution is selected under the Desirable Configuration menu.
2.6.1 Frame Rate (fps)This is a slider that prompts users to select the rate at which the measurement data must be shipped outof the mmWave device.
Effects on other user knobs:• Controls the minimum value on the Maximum Radial Velocity slider.• Faster rates limit the number of plots and measurement data that can be captured from the mmWave
device. For more details, see Section 2.9.
CLI command details: defines frame duration (frame periodicity in ms) in the frameCfg command.
2.6.2 Range Resolution (m)This is a slider that prompts users to select the desired range resolution in meters. Select the value basedon the minimum amount of separation you expect between the detected objects or points in the pointcloud. Because this is the Best Range Resolution configuration, the slider presents options only for thebest possible range resolution for the user-selected frequency band.
Effects on other user knobs:• Relatively lower or finer Range Resolution selected by this slider provides options for longer Max
Unambiguous Range but lower values for Maximum Radial Velocity.• Relatively higher or coarser Range Resolution selected by this slider provides options for shorter Max
Unambiguous Range but higher values for Maximum Radial Velocity.
This slider allows for minor tweaking in the centimeter units, to help users attain desired fine tuning ofconfiguration for the Max Unambiguous Range and Maximum Radial Velocity.
CLI command details: defines frequency slope constant and Ramp end time in µs in the profileCfg.
2.6.3 Maximum Unambiguous Range (m)This is a slider that prompts users to select the desired Maximum Unambiguous Range in meters. Selectthe value based on the farthest distance you expect to see objects detected. To understand the Radarcross section and the actual range at which objects equal to the radar cross section can be theoreticallydetected by mmWave technology, see Section 4.3.
Effects on other user knobs:• Setting this slider to lower values provides more options for the Radial Velocity Resolution, versus
setting this slider to higher values providing less options for the Radial Velocity Resolution.
CLI command details: defines number of ADC samples and ADC sampling frequency in ksps in theprofileCfg command.
2.6.4 Maximum Radial Velocity (m/s)This is a slider that prompts users to select the desired Maximum Radial Velocity in meters/second. Selectthe value based on the maximum radial velocity you expect targets to be moving in within the radar field ofview.
Effects on other user knobs:• Radial Velocity Resolution is directly proportional to the Maximum Radial Velocity setting. Setting this
slider to lower values provides finer Radial Velocity Resolution versus setting this slider to higher endof values provides coarser Radial Velocity Resolution.
CLI command details: defines idle time in µs in the profileCfg command.
www.ti.com CONFIGURE Tab
7SWRU529C–May 2017–Revised April 2020Submit Documentation Feedback
Copyright © 2017–2020, Texas Instruments Incorporated
mmWave Demo Visualizer
2.6.5 Radial Velocity Resolution (m/s)This is a drop-down menu that prompts users to select the desired Radial Velocity Resolution inmeters/second.
Effects on other user knobs:• This knob is the lowest dependent parameter in this configuration and gets constrained by all the
preceding parameters.
CLI command details: defines number of loops in the frameCfg command
2.7 Scene Selection – Best Velocity Resolution
2.7.1 Frame Rate (fps)This is a slider that prompts users to select the rate at which measurement data must be shipped out ofthe mmWave device.
Effects on other user knobs:• As the Best Velocity Resolution configuration, it controls the Radial Velocity Resolution, and sets it to
the best possible value for the chosen frame rate.• Controls the minimum value on the Maximum Radial Velocity slider.• Faster rates limit the number of plots and measurement data that can be captured from the mmWave
device. For more details, see Section 2.9.
CLI command details: defines frame duration (for example, frame periodicity in ms) in the frameCfgcommand.
2.7.2 Radial Velocity Resolution (m/s)As a Best Velocity Resolution configuration, the Radial Velocity Resolution is set to the best possiblevalue for the chosen frame rate.
2.7.3 Maximum Radial Velocity (m/s)This is a slider that prompts users to select the desired Maximum Radial Velocity in meters/second. Selectthe value based on the maximum radial velocity you expect the targets to be moving in within the radarfield of view.
Effects on other user knobs:Based on the system resources diverted to fulfill the user-selected value for Maximum Radial Velocity,options for Range Resolution are affected in this configuration.• Higher values for Maximum Radial Velocity selected by this slider provides only coarser options for
Range Resolution and short-range options for Max Unambiguous Range.• Lower values for Maximum Radial Velocity selected by this slider provides more finer options for
Range Resolution and long-range options for Max Unambiguous Range.
CLI command details: defines the number of loops in the frameCfg command.
2.7.4 Range Resolution (m)This is a slider that prompts users to select the desired range resolution in meters. Select the value basedon the minimum separation you expect between the detected objects or points in the point cloud.
Effects on other user knobs:• Relatively lower or finer Range Resolution selected by this slider provides options for shorter Max
Unambiguous Range.• Relatively higher or coarser Range Resolution selected by this slider provides options for longer Max
Unambiguous Range.

CONFIGURE Tab www.ti.com
8 SWRU529C–May 2017–Revised April 2020Submit Documentation Feedback
Copyright © 2017–2020, Texas Instruments Incorporated
mmWave Demo Visualizer
CLI command details: Range Resolution and Max Unambiguous Range define the number of ADCsamples, frequency slope constant, Ramp end time in µs, idle time in µs, and ADC sampling frequency inksps in the profileCfg command.
2.7.5 Maximum Unambiguous Range (m)This is a slider that prompts users to select the desired Maximum Unambiguous Range in meters. Selectthe value based on the farthest distance you expect to see objects detected. To understand the radarcross section and the actual range at which objects equal to the radar cross section can be theoreticallydetected by mmWave technology, see Section 4.3.
Effects on other user knobs:• Moving this slider fine-tunes the user-selected Range Resolution value.
CLI command details: Range Resolution and Max Unambiguous Range define the number of ADCsamples, frequency slope constant, Ramp end time in µs, idle time in µs, and ADC sampling frequency inksps in the profileCfg command.
2.8 Scene Selection – Best Range
2.8.1 Frame Rate (fps)This is a slider that prompts users to select the rate at which measurement data must be shipped out ofthe mmWave device.
Effects on other user knobs:• Controls the minimum value on the Maximum Radial Velocity slider.• Faster rates limit the number of plots and measurement data that can be captured from the mmWave
device. For more details, see Section 2.9.
CLI command details: defines the frame duration (for example, frame periodicity in ms) in the frameCfgcommand.
2.8.2 Maximum Unambiguous Range (m)This is a slider that prompts users to select the desired Maximum Unambiguous Range in steps of 5meters. Select the value based on the farthest distance you expect to see objects detected. SeeSection 4.3 to understand the radar cross section and the actual range at which objects equal to the radarcross section can be theoretically detected by mmWave technology.
Effects on other user knobs:• Setting this slider to lower values provides less but finer options for Range Resolution, versus setting
this slider to higher values providing more but coarser options for the Range Resolution.
CLI command details: defines the frequency slope constant in the profileCfg command.
2.8.3 Range Resolution (m)This is a slider that prompts users to select the desired range resolution in meters. Select the value basedon the minimum amount of separation you expect between the detected objects or points in the pointcloud.
Effects on other user knobs:• Coarser values for Range Resolution selected by this slider provides more options and higher values
for Maximum Radial Velocity.• Finer values for Range Resolution selected by this slider provides less options and lower values for
Maximum Radial Velocity.
Based on the system resources diverted to fulfill the user-selected value for Range Resolution, options forMaximum Radial Velocity are affected in this configuration.
www.ti.com CONFIGURE Tab
9SWRU529C–May 2017–Revised April 2020Submit Documentation Feedback
Copyright © 2017–2020, Texas Instruments Incorporated
mmWave Demo Visualizer
CLI command details: defines the number of ADC samples, Ramp end time in µs, and ADC samplingfrequency in ksps in the profileCfg command.
2.8.4 Maximum Radial Velocity (m/s)This is a slider that prompts users to select the desired Maximum Radial Velocity in meters/second. Selectthe value based on the maximum radial velocity you expect the targets to be moving in within the radarfield of view.
Effects on other user knobs:Radial Velocity Resolution is directly proportional to the Maximum Radial Velocity setting. Setting thisslider to lower values provides finer Radial Velocity Resolution, versus setting this slider to higher valuesproviding coarser Radial Velocity Resolution.
CLI command details: defines the idle time in µs in the profileCfg command.
2.9 Plot SelectionThis section prompts users to select the plots they want to see on the Plots tab. For the best performance,depending on the scene parameters that are selected by the user, selecting more than two plots mayrequire a frame rate around 10 fps. Selecting heatmaps requires the frame rate to be 1-3 fps, otherwisethe target (mmWave sensor) will not have enough frame duration to ship out data every frame over theUART.
2.9.1 Scatter PlotThis lets users enable the detected objects list to be sent out by the target (mmWave sensor) device anddisplay it on the Scatter plot and Doppler-Range plot on the plots tab.
CLI command details: defines the detected-objects parameter in the guiMonitor command.
2.9.2 Range ProfileThis lets users enable the log-magnitude range profile data at zero Doppler to be sent out by the target(mmWave sensor) device and display it on the Range Profile plot on the plots tab.
CLI command details: defines the log-magnitude range parameter in the guiMonitor command.
2.9.3 Noise ProfileThis lets users enable the log magnitude noise profile data to be sent out by target (mmWave sensor)device and display it on the Noise profile graph (green color) in the same Range Profile plot window onthe plots tab.
CLI command details: defines the noise profile parameter in the guiMonitor command.
2.9.4 Range Azimuth Heat MapThis lets users enable the zero Doppler radar cube matrix for all range bins and all antennas to be sentout by the target (mmWave sensor) device and display it on the Range azimuth heatmap plot on the plotstab. This requires the frame rate to be 1 fps otherwise the target (mmWave sensor) will not have enoughframe duration to ship out data every frame over the UART.
CLI command details: defines the range-azimuth heat map parameter in the guiMonitor command.
2.9.5 Range Doppler Heat MapThis lets users enable the entire detection matrix to be sent out by the target (mmWave sensor) deviceand display it on the range-doppler heatmap plot on the plots tab. This requires the frame rate to be 1 fpsotherwise the target (mmWave sensor) will not have enough frame duration to ship out data every frameover the UART.
CLI command details: defines the range-doppler heat map parameter in the guiMonitor command.
CONFIGURE Tab www.ti.com
10 SWRU529C–May 2017–Revised April 2020Submit Documentation Feedback
Copyright © 2017–2020, Texas Instruments Incorporated
mmWave Demo Visualizer
2.9.6 StatisticsThis lets users enable the statistics information to be sent out by the target (mmWave sensor) device andto show the CPU load plot on the plots tab.
CLI command details: defines the statistics parameter in the guiMonitor command.
2.10 User Selected ConfigurationWhen the user has selected the parameters in the previous section, they can now take the followingactions.
2.10.1 Send Configuration to mmWave DeviceThis lets users send the generated configuration (CLI) commands to be sent to the target (mmWavesensor) device. This command operates successfully only if the following are met:• Valid serial ports have been configured as shown in the setup section.• Target (mmWave sensor) device is booted up and running the mmWave demo from the same SDK
version as selected in the SDK version drop down menu.
Users can see the commands echoed back on the Console Messages display with the feedback that isreceived from the target for every line of commands sent. These console messages are a great help whendebugging issues or getting familiar with the CLI commands. A successful execution of this button resultsin the last command sensorStart to be sent to the device and a response Done to be received from thedevice.
www.ti.com CONFIGURE Tab
11SWRU529C–May 2017–Revised April 2020Submit Documentation Feedback
Copyright © 2017–2020, Texas Instruments Incorporated
mmWave Demo Visualizer
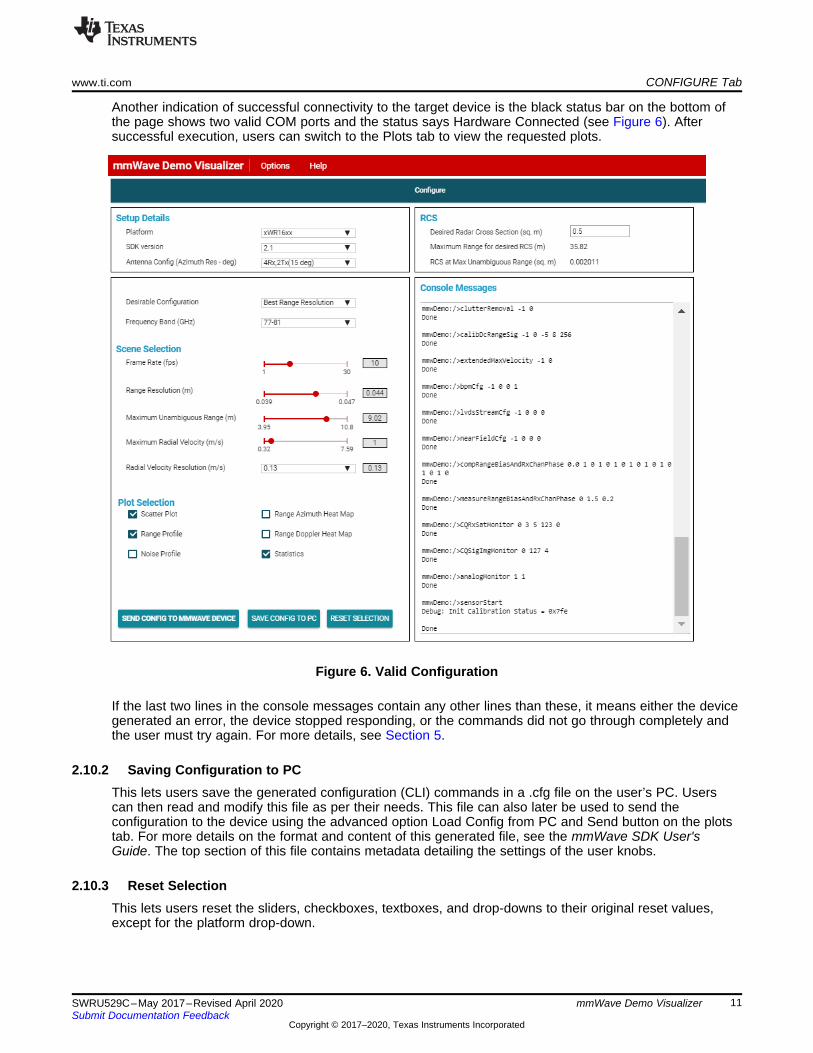
Another indication of successful connectivity to the target device is the black status bar on the bottom ofthe page shows two valid COM ports and the status says Hardware Connected (see Figure 6). Aftersuccessful execution, users can switch to the Plots tab to view the requested plots.
Figure 6. Valid Configuration
If the last two lines in the console messages contain any other lines than these, it means either the devicegenerated an error, the device stopped responding, or the commands did not go through completely andthe user must try again. For more details, see Section 5.
2.10.2 Saving Configuration to PCThis lets users save the generated configuration (CLI) commands in a .cfg file on the user’s PC. Userscan then read and modify this file as per their needs. This file can also later be used to send theconfiguration to the device using the advanced option Load Config from PC and Send button on the plotstab. For more details on the format and content of this generated file, see the mmWave SDK User'sGuide. The top section of this file contains metadata detailing the settings of the user knobs.
2.10.3 Reset SelectionThis lets users reset the sliders, checkboxes, textboxes, and drop-downs to their original reset values,except for the platform drop-down.
PLOTS Tab www.ti.com
12 SWRU529C–May 2017–Revised April 2020Submit Documentation Feedback
Copyright © 2017–2020, Texas Instruments Incorporated
mmWave Demo Visualizer
3 PLOTS TabWhen users have successfully configured the device using either the Send Config to mmWave Device orLoad Config from PC and Send button, they can begin to see data being plotted on the requested plots. Ifno data is shown on the plots. For more details, see Section 5.
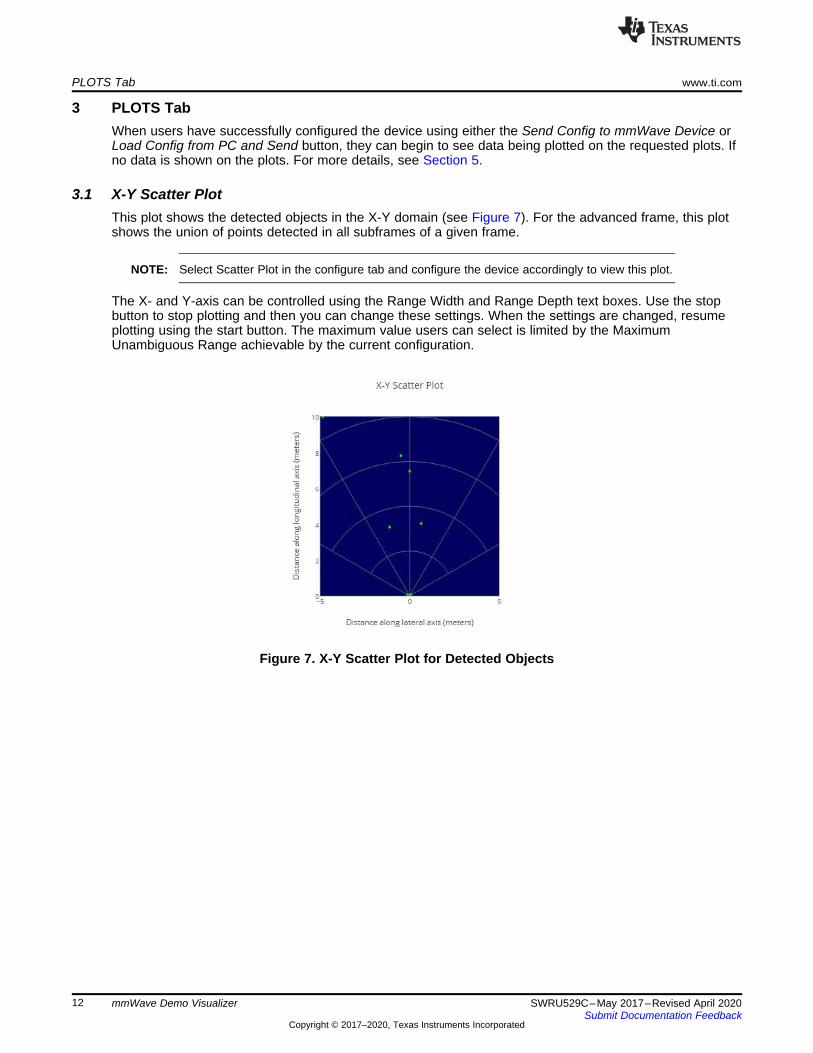
3.1 X-Y Scatter PlotThis plot shows the detected objects in the X-Y domain (see Figure 7). For the advanced frame, this plotshows the union of points detected in all subframes of a given frame.
NOTE: Select Scatter Plot in the configure tab and configure the device accordingly to view this plot.
The X- and Y-axis can be controlled using the Range Width and Range Depth text boxes. Use the stopbutton to stop plotting and then you can change these settings. When the settings are changed, resumeplotting using the start button. The maximum value users can select is limited by the MaximumUnambiguous Range achievable by the current configuration.
Figure 7. X-Y Scatter Plot for Detected Objects
www.ti.com PLOTS Tab
13SWRU529C–May 2017–Revised April 2020Submit Documentation Feedback
Copyright © 2017–2020, Texas Instruments Incorporated
mmWave Demo Visualizer
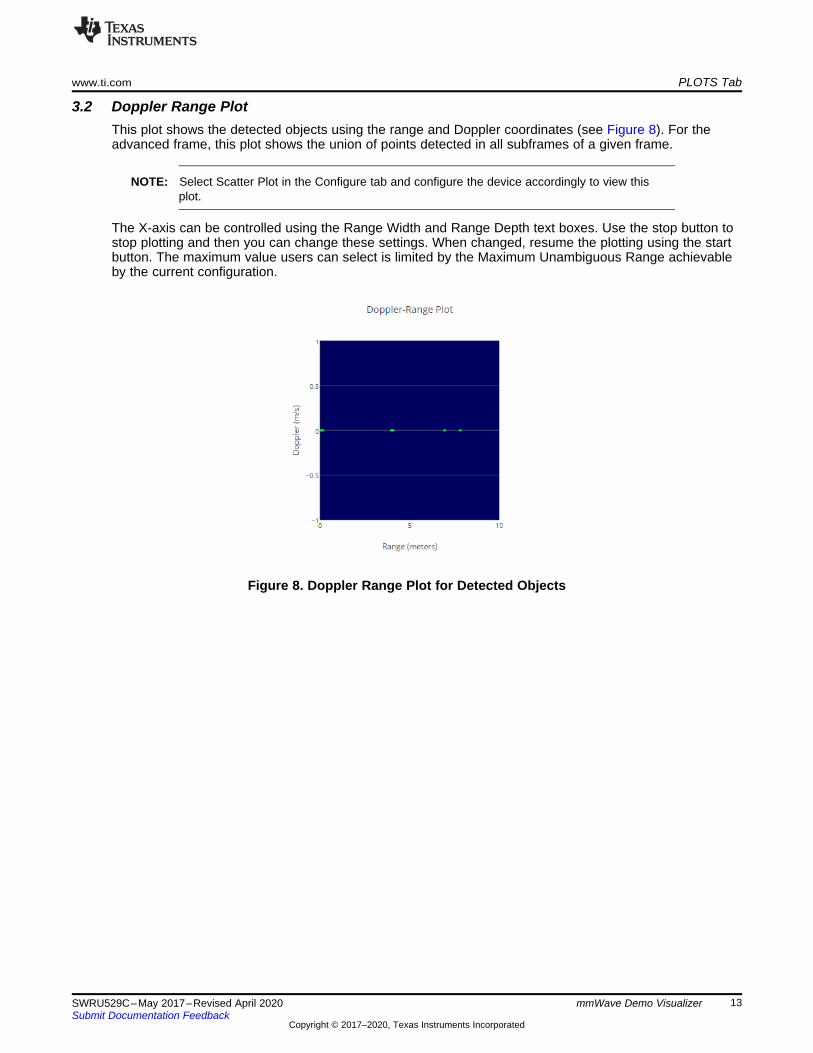
3.2 Doppler Range PlotThis plot shows the detected objects using the range and Doppler coordinates (see Figure 8). For theadvanced frame, this plot shows the union of points detected in all subframes of a given frame.
NOTE: Select Scatter Plot in the Configure tab and configure the device accordingly to view thisplot.
The X-axis can be controlled using the Range Width and Range Depth text boxes. Use the stop button tostop plotting and then you can change these settings. When changed, resume the plotting using the startbutton. The maximum value users can select is limited by the Maximum Unambiguous Range achievableby the current configuration.
Figure 8. Doppler Range Plot for Detected Objects
PLOTS Tab www.ti.com
14 SWRU529C–May 2017–Revised April 2020Submit Documentation Feedback
Copyright © 2017–2020, Texas Instruments Incorporated
mmWave Demo Visualizer
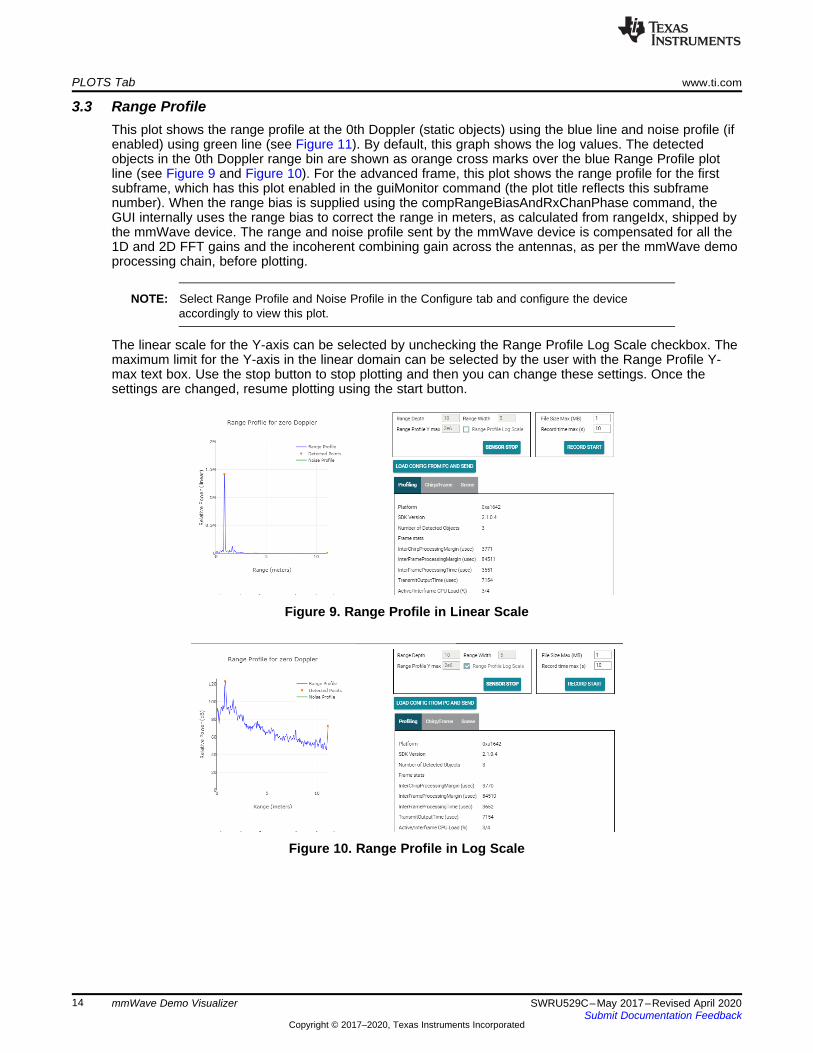
3.3 Range ProfileThis plot shows the range profile at the 0th Doppler (static objects) using the blue line and noise profile (ifenabled) using green line (see Figure 11). By default, this graph shows the log values. The detectedobjects in the 0th Doppler range bin are shown as orange cross marks over the blue Range Profile plotline (see Figure 9 and Figure 10). For the advanced frame, this plot shows the range profile for the firstsubframe, which has this plot enabled in the guiMonitor command (the plot title reflects this subframenumber). When the range bias is supplied using the compRangeBiasAndRxChanPhase command, theGUI internally uses the range bias to correct the range in meters, as calculated from rangeIdx, shipped bythe mmWave device. The range and noise profile sent by the mmWave device is compensated for all the1D and 2D FFT gains and the incoherent combining gain across the antennas, as per the mmWave demoprocessing chain, before plotting.
NOTE: Select Range Profile and Noise Profile in the Configure tab and configure the deviceaccordingly to view this plot.
The linear scale for the Y-axis can be selected by unchecking the Range Profile Log Scale checkbox. Themaximum limit for the Y-axis in the linear domain can be selected by the user with the Range Profile Y-max text box. Use the stop button to stop plotting and then you can change these settings. Once thesettings are changed, resume plotting using the start button.
Figure 9. Range Profile in Linear Scale
Figure 10. Range Profile in Log Scale
www.ti.com PLOTS Tab
15SWRU529C–May 2017–Revised April 2020Submit Documentation Feedback
Copyright © 2017–2020, Texas Instruments Incorporated
mmWave Demo Visualizer
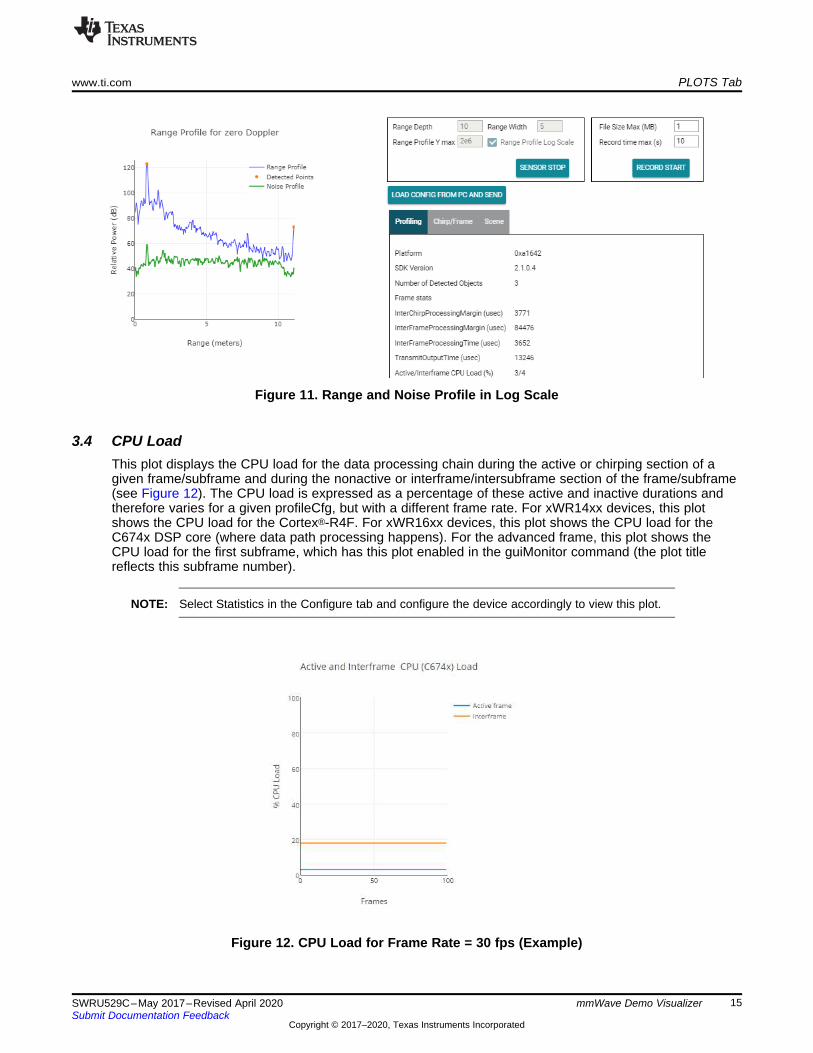
Figure 11. Range and Noise Profile in Log Scale
3.4 CPU LoadThis plot displays the CPU load for the data processing chain during the active or chirping section of agiven frame/subframe and during the nonactive or interframe/intersubframe section of the frame/subframe(see Figure 12). The CPU load is expressed as a percentage of these active and inactive durations andtherefore varies for a given profileCfg, but with a different frame rate. For xWR14xx devices, this plotshows the CPU load for the Cortex®-R4F. For xWR16xx devices, this plot shows the CPU load for theC674x DSP core (where data path processing happens). For the advanced frame, this plot shows theCPU load for the first subframe, which has this plot enabled in the guiMonitor command (the plot titlereflects this subframe number).
NOTE: Select Statistics in the Configure tab and configure the device accordingly to view this plot.
Figure 12. CPU Load for Frame Rate = 30 fps (Example)
PLOTS Tab www.ti.com
16 SWRU529C–May 2017–Revised April 2020Submit Documentation Feedback
Copyright © 2017–2020, Texas Instruments Incorporated
mmWave Demo Visualizer
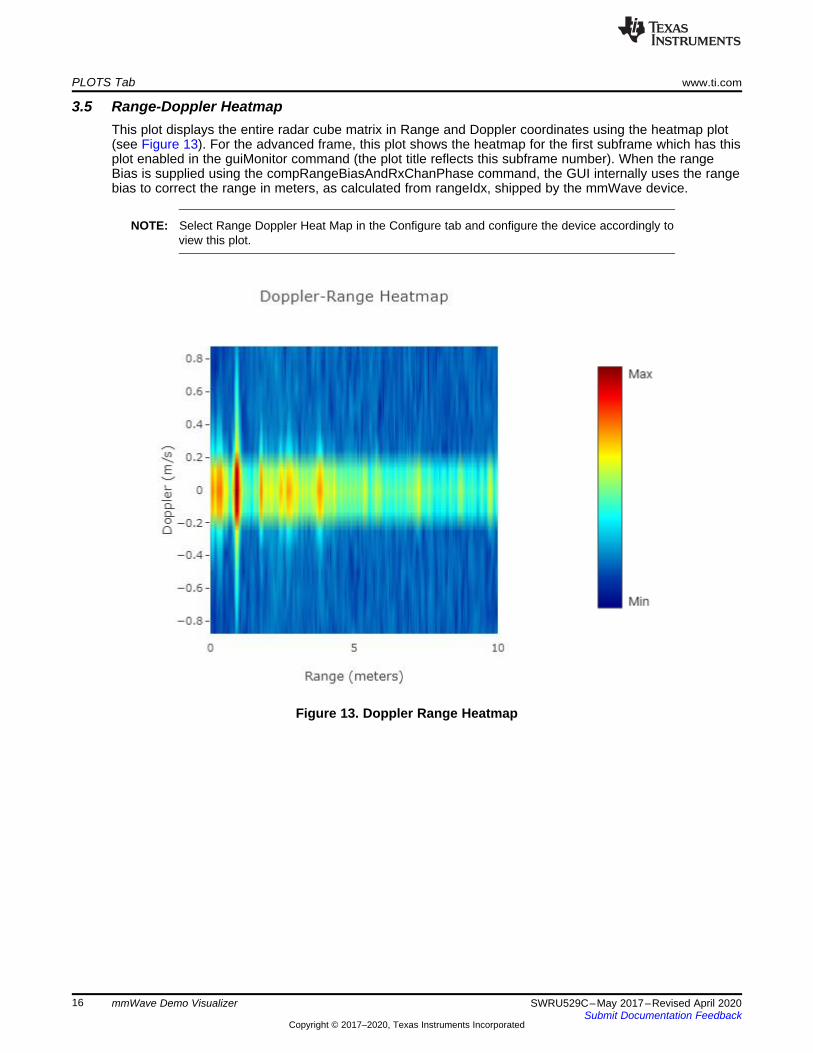
3.5 Range-Doppler HeatmapThis plot displays the entire radar cube matrix in Range and Doppler coordinates using the heatmap plot(see Figure 13). For the advanced frame, this plot shows the heatmap for the first subframe which has thisplot enabled in the guiMonitor command (the plot title reflects this subframe number). When the rangeBias is supplied using the compRangeBiasAndRxChanPhase command, the GUI internally uses the rangebias to correct the range in meters, as calculated from rangeIdx, shipped by the mmWave device.
NOTE: Select Range Doppler Heat Map in the Configure tab and configure the device accordingly toview this plot.
Figure 13. Doppler Range Heatmap
www.ti.com PLOTS Tab
17SWRU529C–May 2017–Revised April 2020Submit Documentation Feedback
Copyright © 2017–2020, Texas Instruments Incorporated
mmWave Demo Visualizer
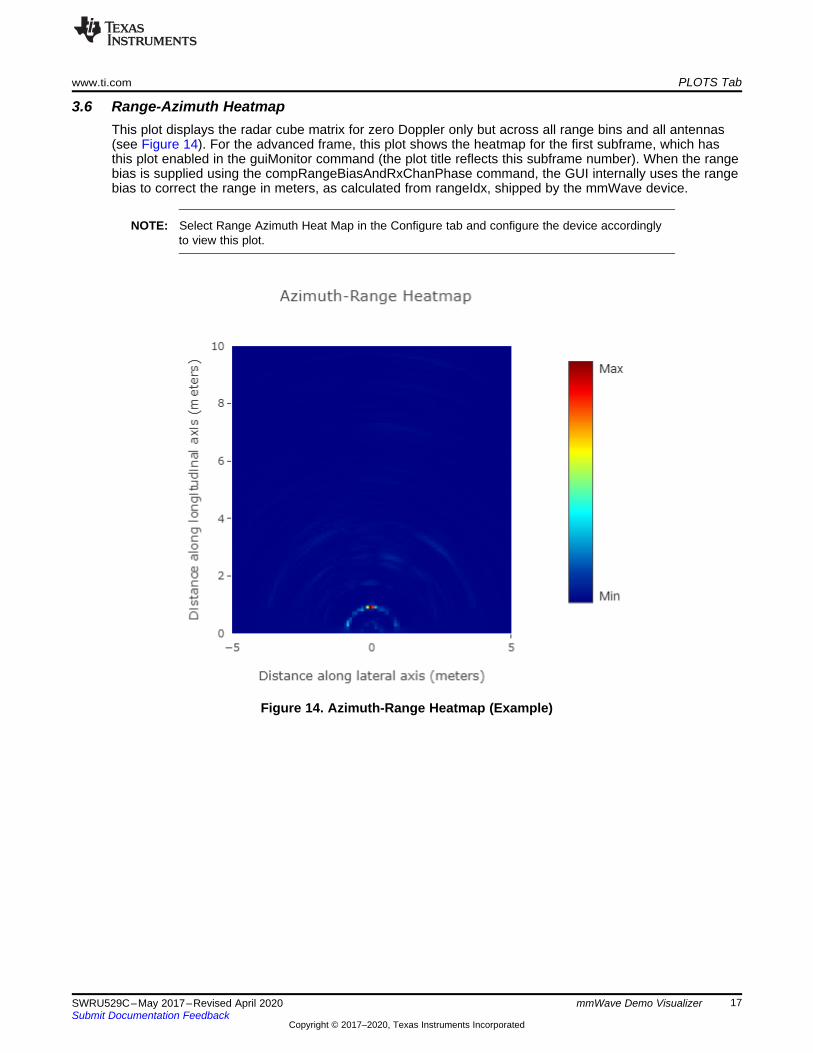
3.6 Range-Azimuth HeatmapThis plot displays the radar cube matrix for zero Doppler only but across all range bins and all antennas(see Figure 14). For the advanced frame, this plot shows the heatmap for the first subframe, which hasthis plot enabled in the guiMonitor command (the plot title reflects this subframe number). When the rangebias is supplied using the compRangeBiasAndRxChanPhase command, the GUI internally uses the rangebias to correct the range in meters, as calculated from rangeIdx, shipped by the mmWave device.
NOTE: Select Range Azimuth Heat Map in the Configure tab and configure the device accordinglyto view this plot.
Figure 14. Azimuth-Range Heatmap (Example)
X in metersY in meters
Z
1
0
0
-1
-5
5
10 5
0
3-D Scatter Plot
PLOTS Tab www.ti.com
18 SWRU529C–May 2017–Revised April 2020Submit Documentation Feedback
Copyright © 2017–2020, Texas Instruments Incorporated
mmWave Demo Visualizer
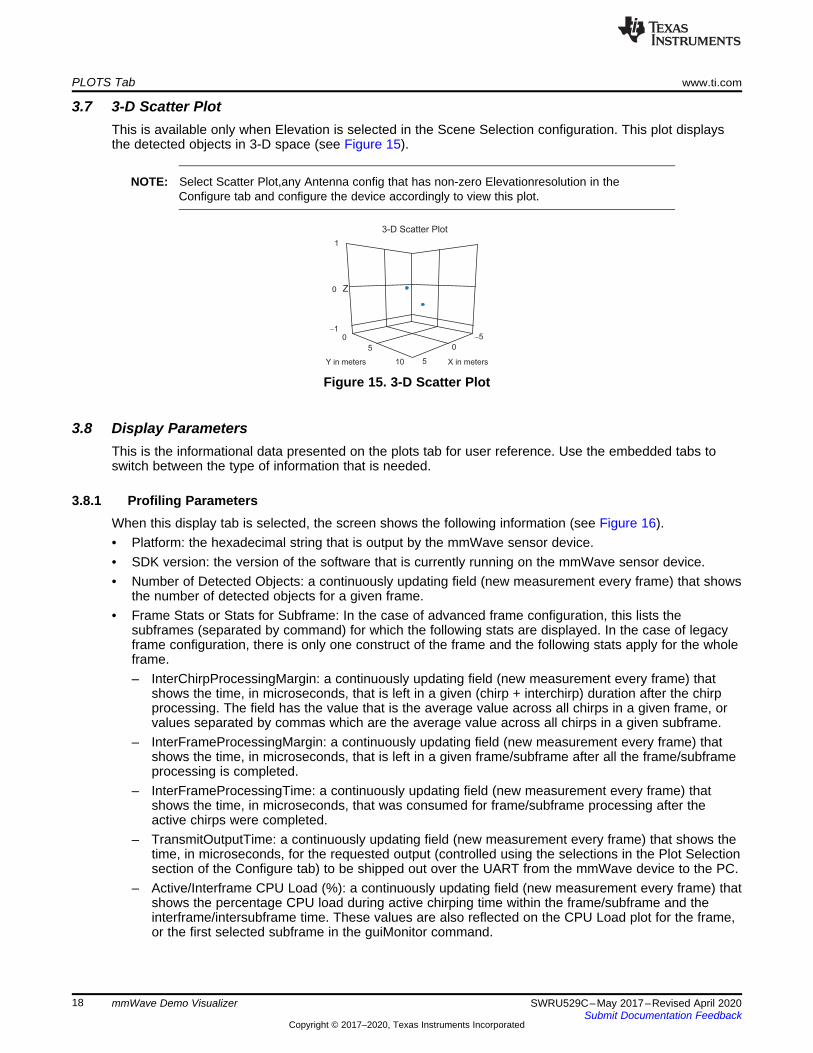
3.7 3-D Scatter PlotThis is available only when Elevation is selected in the Scene Selection configuration. This plot displaysthe detected objects in 3-D space (see Figure 15).
NOTE: Select Scatter Plot,any Antenna config that has non-zero Elevationresolution in theConfigure tab and configure the device accordingly to view this plot.
Figure 15. 3-D Scatter Plot
3.8 Display ParametersThis is the informational data presented on the plots tab for user reference. Use the embedded tabs toswitch between the type of information that is needed.
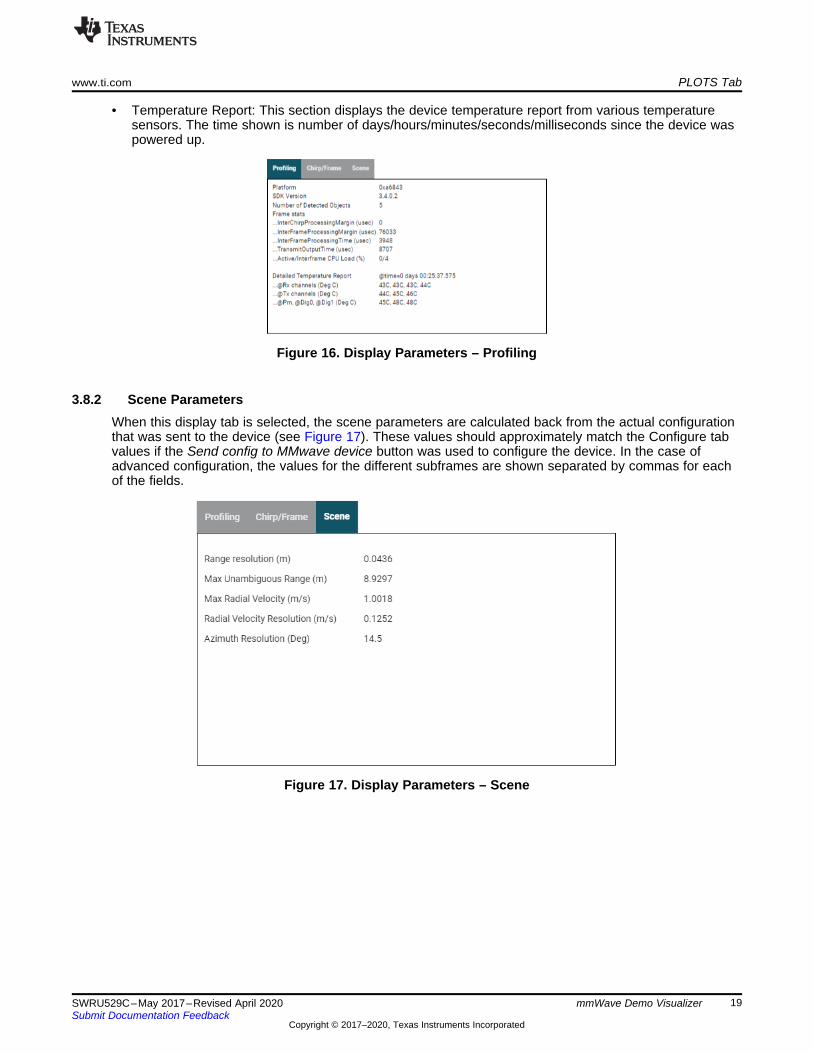
3.8.1 Profiling ParametersWhen this display tab is selected, the screen shows the following information (see Figure 16).• Platform: the hexadecimal string that is output by the mmWave sensor device.• SDK version: the version of the software that is currently running on the mmWave sensor device.• Number of Detected Objects: a continuously updating field (new measurement every frame) that shows
the number of detected objects for a given frame.• Frame Stats or Stats for Subframe: In the case of advanced frame configuration, this lists the
subframes (separated by command) for which the following stats are displayed. In the case of legacyframe configuration, there is only one construct of the frame and the following stats apply for the wholeframe.– InterChirpProcessingMargin: a continuously updating field (new measurement every frame) that
shows the time, in microseconds, that is left in a given (chirp + interchirp) duration after the chirpprocessing. The field has the value that is the average value across all chirps in a given frame, orvalues separated by commas which are the average value across all chirps in a given subframe.
– InterFrameProcessingMargin: a continuously updating field (new measurement every frame) thatshows the time, in microseconds, that is left in a given frame/subframe after all the frame/subframeprocessing is completed.
– InterFrameProcessingTime: a continuously updating field (new measurement every frame) thatshows the time, in microseconds, that was consumed for frame/subframe processing after theactive chirps were completed.
– TransmitOutputTime: a continuously updating field (new measurement every frame) that shows thetime, in microseconds, for the requested output (controlled using the selections in the Plot Selectionsection of the Configure tab) to be shipped out over the UART from the mmWave device to the PC.
– Active/Interframe CPU Load (%): a continuously updating field (new measurement every frame) thatshows the percentage CPU load during active chirping time within the frame/subframe and theinterframe/intersubframe time. These values are also reflected on the CPU Load plot for the frame,or the first selected subframe in the guiMonitor command.
www.ti.com PLOTS Tab
19SWRU529C–May 2017–Revised April 2020Submit Documentation Feedback
Copyright © 2017–2020, Texas Instruments Incorporated
mmWave Demo Visualizer
• Temperature Report: This section displays the device temperature report from various temperaturesensors. The time shown is number of days/hours/minutes/seconds/milliseconds since the device waspowered up.
Figure 16. Display Parameters – Profiling
3.8.2 Scene ParametersWhen this display tab is selected, the scene parameters are calculated back from the actual configurationthat was sent to the device (see Figure 17). These values should approximately match the Configure tabvalues if the Send config to MMwave device button was used to configure the device. In the case ofadvanced configuration, the values for the different subframes are shown separated by commas for eachof the fields.
Figure 17. Display Parameters – Scene
PLOTS Tab www.ti.com
20 SWRU529C–May 2017–Revised April 2020Submit Documentation Feedback
Copyright © 2017–2020, Texas Instruments Incorporated
mmWave Demo Visualizer
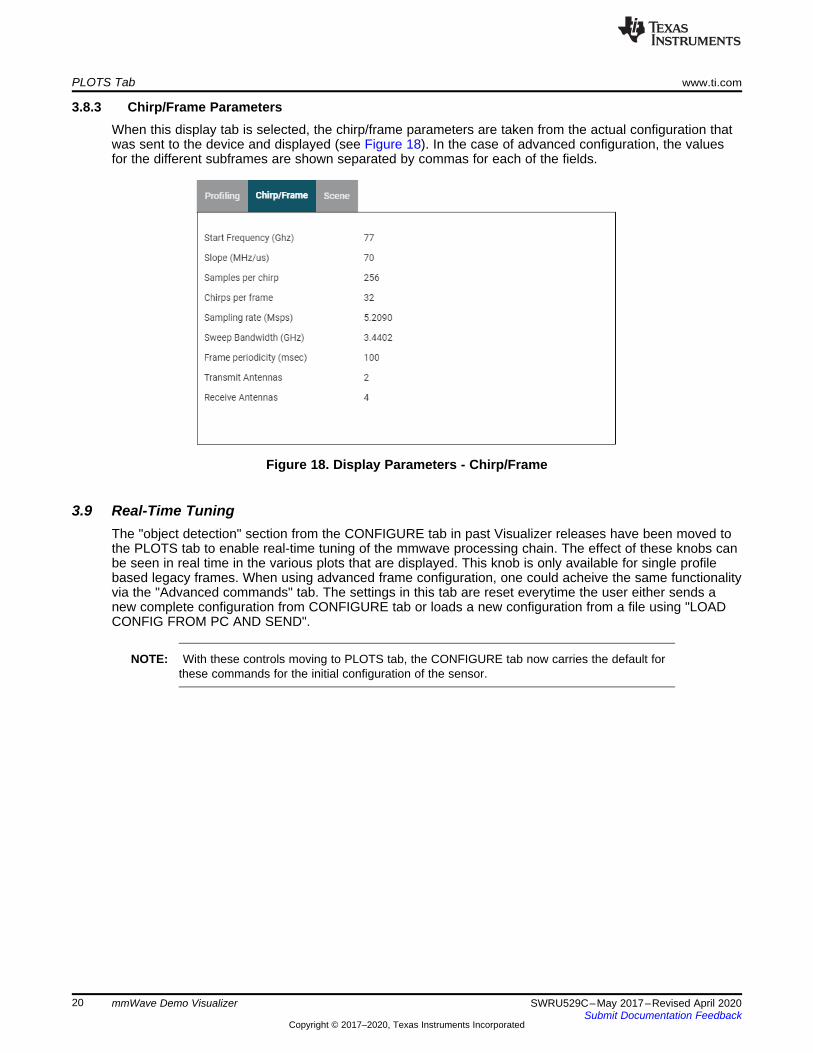
3.8.3 Chirp/Frame ParametersWhen this display tab is selected, the chirp/frame parameters are taken from the actual configuration thatwas sent to the device and displayed (see Figure 18). In the case of advanced configuration, the valuesfor the different subframes are shown separated by commas for each of the fields.
Figure 18. Display Parameters - Chirp/Frame
3.9 Real-Time TuningThe "object detection" section from the CONFIGURE tab in past Visualizer releases have been moved tothe PLOTS tab to enable real-time tuning of the mmwave processing chain. The effect of these knobs canbe seen in real time in the various plots that are displayed. This knob is only available for single profilebased legacy frames. When using advanced frame configuration, one could acheive the same functionalityvia the "Advanced commands" tab. The settings in this tab are reset everytime the user either sends anew complete configuration from CONFIGURE tab or loads a new configuration from a file using "LOADCONFIG FROM PC AND SEND".
NOTE: With these controls moving to PLOTS tab, the CONFIGURE tab now carries the default forthese commands for the initial configuration of the sensor.
www.ti.com PLOTS Tab
21SWRU529C–May 2017–Revised April 2020Submit Documentation Feedback
Copyright © 2017–2020, Texas Instruments Incorporated
mmWave Demo Visualizer
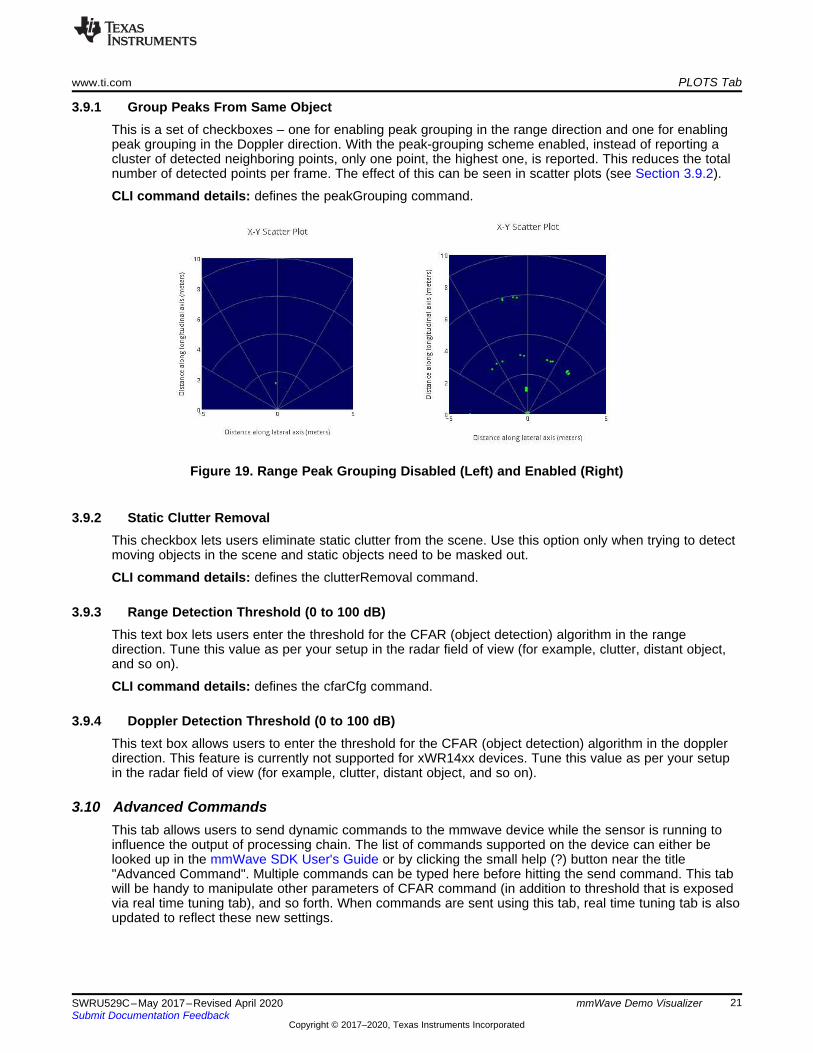
3.9.1 Group Peaks From Same ObjectThis is a set of checkboxes – one for enabling peak grouping in the range direction and one for enablingpeak grouping in the Doppler direction. With the peak-grouping scheme enabled, instead of reporting acluster of detected neighboring points, only one point, the highest one, is reported. This reduces the totalnumber of detected points per frame. The effect of this can be seen in scatter plots (see Section 3.9.2).
CLI command details: defines the peakGrouping command.
Figure 19. Range Peak Grouping Disabled (Left) and Enabled (Right)
3.9.2 Static Clutter RemovalThis checkbox lets users eliminate static clutter from the scene. Use this option only when trying to detectmoving objects in the scene and static objects need to be masked out.
CLI command details: defines the clutterRemoval command.
3.9.3 Range Detection Threshold (0 to 100 dB)This text box lets users enter the threshold for the CFAR (object detection) algorithm in the rangedirection. Tune this value as per your setup in the radar field of view (for example, clutter, distant object,and so on).
CLI command details: defines the cfarCfg command.
3.9.4 Doppler Detection Threshold (0 to 100 dB)This text box allows users to enter the threshold for the CFAR (object detection) algorithm in the dopplerdirection. This feature is currently not supported for xWR14xx devices. Tune this value as per your setupin the radar field of view (for example, clutter, distant object, and so on).
3.10 Advanced CommandsThis tab allows users to send dynamic commands to the mmwave device while the sensor is running toinfluence the output of processing chain. The list of commands supported on the device can either belooked up in the mmWave SDK User's Guide or by clicking the small help (?) button near the title"Advanced Command". Multiple commands can be typed here before hitting the send command. This tabwill be handy to manipulate other parameters of CFAR command (in addition to threshold that is exposedvia real time tuning tab), and so forth. When commands are sent using this tab, real time tuning tab is alsoupdated to reflect these new settings.
PLOTS Tab www.ti.com
22 SWRU529C–May 2017–Revised April 2020Submit Documentation Feedback
Copyright © 2017–2020, Texas Instruments Incorporated
mmWave Demo Visualizer
3.10.1 Special Note About Range and Angle Bias Compensation ConfigurationThis tab lets users enter the command for the range and angle bias compensation as well. For moreinformation on how to obtain the values for this field, see the mmWave SDK User's Guide. On receivingthis command, the mmWave device corrects the x and y values with the user-supplied bias, but rangeIdx(which is the FFT index) is not corrected. In our case, the visualizer GUI handles adjusting the value whenrangeIdx is converted into the corresponding value in meters for the range profile plot and otherheatmaps. If this functionality is not desired, then the command must be given with Range Bias = 0, Rxphase bias set with Real = 0, and Imaginary = 1, for all the applicable virtual antennas (this is also thedefault from the CONFIGURE tab).
3.11 Plot SettingsThis tab allows users to tune the X-Y Scatter plot and Doppler-Range Plot settings.
Scatter Plot Display Time: User can choose to aggregate detected points for multiple consecutiveframes (sliding window principle) while displaying on the scatter plot. The time selected by the user in thiscontrol (in conjunction with the frame rate) selects number of frames that are aggregated in the slidingwindow. This setting applies to 2D and 3D scatter plot only. This setting is not valid for advanced frame.
Scatter Plot Colormap: User can set the Colormap for the above two plots based on intensity (SNR) ofdetected points or the observed doppler of detected points or observed elevation of detected points.
4 Advanced Options
4.1 Load Configuration From PCUsers can configure the device from their own configuration file or the saved app-generated configurationfile (see Section 2.10.2) by using the LOAD CONFIG FROM PC AND SEND button on the PLOTS tab.Ensure the first two commands in this config file are sensorStop followed by flushCfg.
When loading the configuration, using this button will not change the user input knobs in the CONFIGUREtab. If the user wishes to change the configuration loaded using this option, then the user must hand editthe config file while referencing to the CLI Command documentation in the mmWave SDK User's Guide.
The console messages window on the CONFIGURE tab continues to show the progress and feedback ofthe commands and device interaction even when this option is selected. The description and behavior ofthe PLOTS tab is similar to what is described in the previous section.
NOTE: The advanced frame configuration or the range/angle bias measurement procedure can beinitiated only by using this button. The configure tab does not provide these capabilities.
4.2 Getting the VersionUsers can navigate to Help → About to get the app version that is currently running on the browser andthe SDK version that is running on the connected mmWave sensor device (see below).******************************Connected device******************************Platform : xWR16xxmmWave SDK Version : 02.01.00.04Device Info : AWR16xx non-secure ES 02.00RF H/W Version : 02.00.00.01.17.10.05RF F/W Version : 01.01.06.07.18.08.01mmWaveLink Version : 01.02.00.00Lot number : 7540002Wafer number : 1Die coordinates in wafer : X = 11, Y = 45**********************
www.ti.com Advanced Options
23SWRU529C–May 2017–Revised April 2020Submit Documentation Feedback
Copyright © 2017–2020, Texas Instruments Incorporated
mmWave Demo Visualizer
The SDK version is shown only when the mmWave sensor device is properly connected to this app usingthe serial/COM port and a functional demo is running on the target. Checking the version is a goodtroubleshooting mechanism to determine whether the mmWave device is up and running (see below).******************************Connected device******************************Retreiving version information ...Please connect hardware**********************
4.3 RCSThis is the small section in the CONFIGURE tab used for calculations and informative purposes.
4.3.1 Desired Radar Cross Section (sq. m)This text box prompts users to select the desired RCS for getting the Maximum Range at which an objectof this RCS is likely to be detected, based on the scene and object detection parameters selected on theleft-hand side. Hints for approximate values follow:• Truck → 100 sq. m• Car → 10 sq. m• Motorcycle → 3.2 sq. m• Adult → 1 sq. m• Child → 0.5 sq. m
The value for Maximum Range calculated based on this input is shown in the Maximum Range for desiredRCS (m) display box.
4.3.2 Maximum Range for Desired RCS (m)This is for information purposes only to guide users in setting the slider value for Maximum UnambiguousRange accordingly. This value is calculated based on the user input in the Desired Radar Cross Section(sq. m) and the scene and object detection parameters selected on the left-hand side.
4.3.3 RCS at Maximum Unambiguous Range (sq. m)This is for information purposes only to guide users in setting the slider value for Maximum UnambiguousRange accordingly. This value is calculated based on the user input selected in the MaximumUnambiguous Range and other scene and object detection parameters selected on the left-hand side.
4.4 Concurrent Recording of Processed Stream From mmWave DeviceIf users want to save the incoming processed stream from the mmWave device for some offline analysiswhile its getting plotted, they can use the Record Start button in the plots tab. The recording can bestarted while the device is in stopped state and unconfigured (for example, after a fresh reboot and/or thesensor is stopped using the Sensor Stop button), or while the device is running and actively outputtingdata. The data is saved to a timestamped file in binary format on the device. The data keeps accumulatingin the file until one of the following conditions are met:• User presses the Record Stop button• File size exceeds the limit set in the user-configurable field, File Size Max (MB).• File accumulated data for at least the time set in the user-configurable field, Record time max(s).
The data saved in this file is the exact same data and format that is transmitted out of the mmWavedevice over the DATA_port. Users should see the mmWave demo doxygen in the mmWave SDK packageto understand the format of the data and how to parse it.
NOTE: This feature requires the browser version to be at least as mentioned here:ti-widget-streamsaver.
Troubleshooting www.ti.com
24 SWRU529C–May 2017–Revised April 2020Submit Documentation Feedback
Copyright © 2017–2020, Texas Instruments Incorporated
mmWave Demo Visualizer
5 Troubleshooting
5.1 Console Message: Errors Returned by DeviceIf the user selected invalid parameters in the user generated configuration file or the sliders in theCONFIGURE tab generate an invalid configuration, then the mmWave sensor device reports back anerror. This error can be seen as Error -1 in the Console Messages or as a red error message above theSEND CONFIG TO MMWAVE DEVICE button. Users must correct the source of the error (fix the user-generated config file, move the sliders, and so on) and try again. Additionally, if the mmWave deviceencounters fatal conditions during configuration or realtime, then it communicates back to the user throughasserts, and those messages (file and line numbers) are also displayed in the Console Messages window.Because these are fatal conditions, user must browse to that file and line number to understand the causefor the error. To recover from this, users must reboot the mmWave device, connect the ports using theVisualizer, and perform reconfiguration.
5.2 Serial Port Status Message: Not Switching to Hardware Connected or Both Ports AreNot Showing UpA successful connection results in two COM ports displaying in the bottom status bar, and a HardwareConnected (mmWave SDK 3.4 or later) or "Waiting for Data.." message for the DATA_port (mmWaveSDK 3.3 or earlier) .
If the user does not see the previous message, then the following common errors could be the root cause:• The mmWave device is not powered on and running the demo• Incorrect COM port numbers were selected in Options → Serial port.• Another application (for example, Tera Term) has those COM ports open and the app is unable access
to these ports.• The device was just rebooted while the app was running.
Once previously mentioned errors are corrected, use the small icon (a broken link or exclamation icon) atthe bottom of the screen to disconnect and connect the ports again.
5.3 Console Message: sensorStart Message Not Sent to HostIf the user sees some messages appear in the console messages, but not all of them and the lastmessage is not sensorStart, then the following common errors could be the root cause:• Commands sent earlier generated an error. User must correct the source of error (fix the user-
generated configuration file, move the sliders, and so on) and try again.• Commands sent earlier caused the software running on the device to crash and an assert or exception
message is displayed. Users can connect the Code Composer Studio™ (CCS) debugger to the targetdevice to debug this situation further. In the absence of CCS, reboot the device and start again. If thedevice still does not work for a given config, check the config against the mmWave SDK user's guide.– One reason could be that the number of plots selected caused the shipment of the output data to
exceed one frame duration.• Sometimes the UART on the target device does not receive all the characters or messages (for
example, the PC sends configuration data over the UART faster than the device can process). Justrepeat the action (Send Config.. or Load Config..) and try again.
www.ti.com Troubleshooting
25SWRU529C–May 2017–Revised April 2020Submit Documentation Feedback
Copyright © 2017–2020, Texas Instruments Incorporated
mmWave Demo Visualizer
5.4 Warning for Plots and Frame RateThe following are some guidelines for selecting the plots and frame rate:• If heatmap is selected, reduce the frame rate to less than 5 fps. (If this suggestion is not followed, then
the target mmWave device intentionally halts and the user must reboot the device).• If heatmap is not selected but all other plots are selected, then depending on the scene parameters
selected, the GUI performance can be sluggish and the user should ideally select 10 fps as the framerate.
Alternatively, user can select higher baud rates for DATA_port in the "Serial port" dialog using customvalues when using mmW demo from mmWave SDK 3.4 or later. Recommended custom values are1834000 or 3125000.
5.5 Configuration Successful, but Plots Not UpdatingOne of the commands sent caused the software running on the device to crash and an assert or exceptionmessage is displayed in the console messages. Users can connect the CCS debugger to the target deviceto debug this situation further. In the absence of CCS, reboot the device and start again. If the device stilldoes not work for a given config, check the config against the mmWave SDK user's guide. One reasoncould be that the number of plots selected caused the shipment of the output data to exceed one frameduration.
Another reason could be the mismatch between the baud rate selected for DATA_port in the Visualizerversus the rate at which device is transmitting (mmWave SDK 3.4 and later). To address this, reboot thesensor or stop the sensor, re-connect the serial ports from Visualizer GUI with desired baud rate andreconfig the sensor.
6 Customizing the mmWave Demo VisualizerUsers can login to the gallery, locate the Visualizer app tile, and click the Import to the GUI composericon, to import the application in their GC workspace. Beyond this, users have access to GUI composerresources to customize the demo according to their needs. A quick overview of the mmWave DemoVisualizer specific files follows:• mmWave.js: Main file that communicates with the GUI composer framework, communicates to the
mmWave device using the configured COM ports, processes GUI-generated actions, and plots thedata generated by the mmWave device
• input_validations.js: validates the CLI configuration before it is sent to the mmWave device• dynamic_tuning.js: implementation of "real time tuning" tab and "advanced commands" tab• input.js: Handles all the backend computations behind the CONFIGURE tab• Index.gui: Auto-generated file that handles the layout of the Visualizer app• Helper utilities: Delaunay.js, fft.js, math.js, math_griddata.js, and myutil.js
Useful references follow:• GUI Composer Getting Started• GUI Composer User's Guide
Offline Version of the Visualizer www.ti.com
26 SWRU529C–May 2017–Revised April 2020Submit Documentation Feedback
Copyright © 2017–2020, Texas Instruments Incorporated
mmWave Demo Visualizer
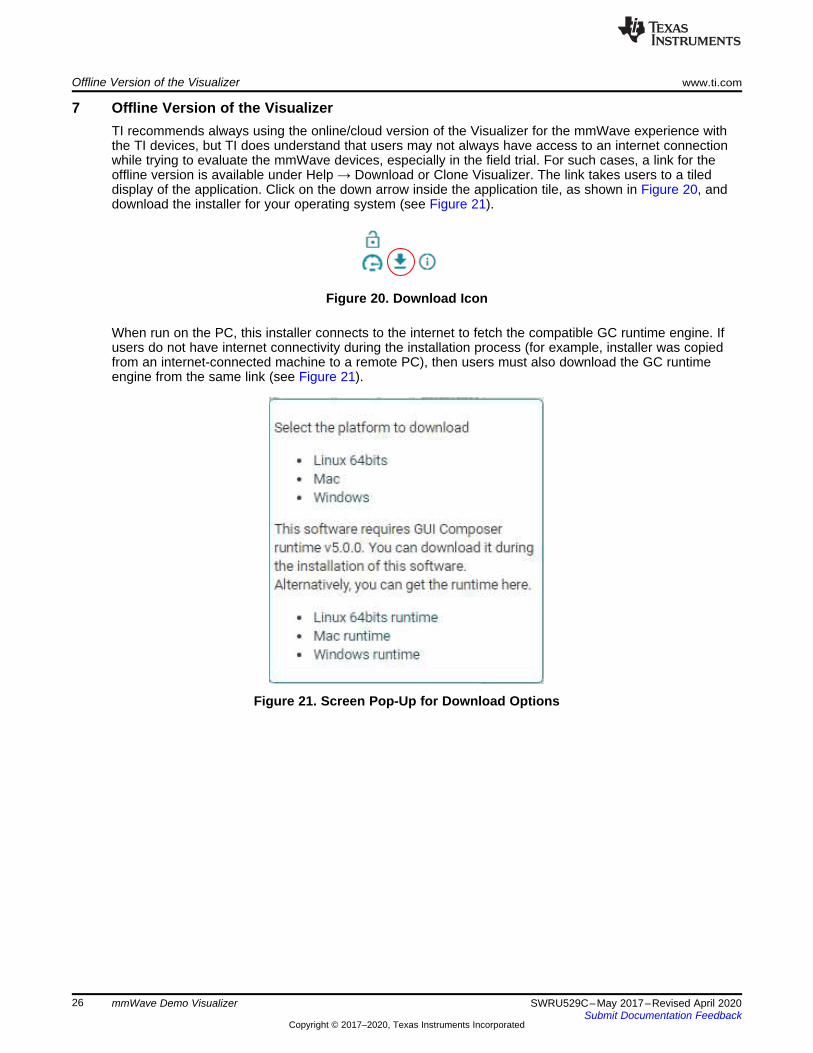
7 Offline Version of the VisualizerTI recommends always using the online/cloud version of the Visualizer for the mmWave experience withthe TI devices, but TI does understand that users may not always have access to an internet connectionwhile trying to evaluate the mmWave devices, especially in the field trial. For such cases, a link for theoffline version is available under Help → Download or Clone Visualizer. The link takes users to a tileddisplay of the application. Click on the down arrow inside the application tile, as shown in Figure 20, anddownload the installer for your operating system (see Figure 21).
Figure 20. Download Icon
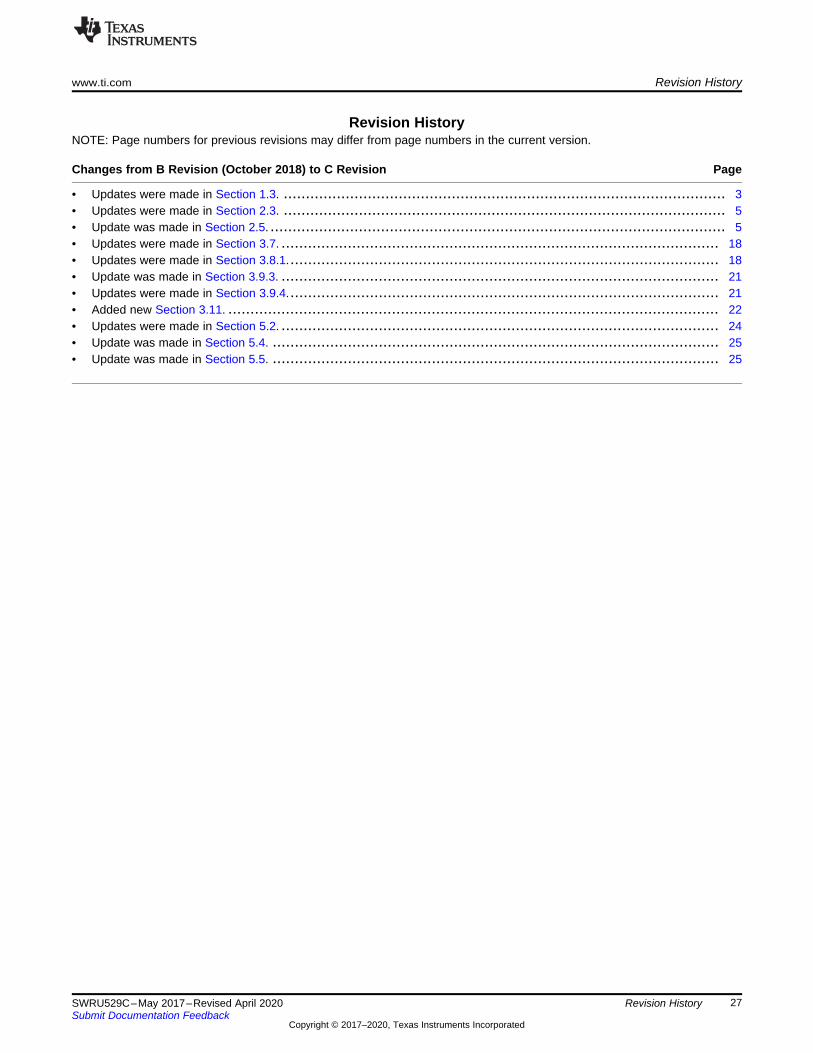
When run on the PC, this installer connects to the internet to fetch the compatible GC runtime engine. Ifusers do not have internet connectivity during the installation process (for example, installer was copiedfrom an internet-connected machine to a remote PC), then users must also download the GC runtimeengine from the same link (see Figure 21).
Figure 21. Screen Pop-Up for Download Options
www.ti.com Revision History
27SWRU529C–May 2017–Revised April 2020Submit Documentation Feedback
Copyright © 2017–2020, Texas Instruments Incorporated
Revision History
Revision HistoryNOTE: Page numbers for previous revisions may differ from page numbers in the current version.
Changes from B Revision (October 2018) to C Revision ............................................................................................... Page
• Updates were made in Section 1.3. .................................................................................................... 3• Updates were made in Section 2.3. .................................................................................................... 5• Update was made in Section 2.5. ....................................................................................................... 5• Updates were made in Section 3.7. ................................................................................................... 18• Updates were made in Section 3.8.1.................................................................................................. 18• Update was made in Section 3.9.3. ................................................................................................... 21• Updates were made in Section 3.9.4.................................................................................................. 21• Added new Section 3.11. ............................................................................................................... 22• Updates were made in Section 5.2. ................................................................................................... 24• Update was made in Section 5.4. ..................................................................................................... 25• Update was made in Section 5.5. ..................................................................................................... 25

IMPORTANT NOTICE AND DISCLAIMER
TI PROVIDES TECHNICAL AND RELIABILITY DATA (INCLUDING DATASHEETS), DESIGN RESOURCES (INCLUDING REFERENCE DESIGNS), APPLICATION OR OTHER DESIGN ADVICE, WEB TOOLS, SAFETY INFORMATION, AND OTHER RESOURCES “AS IS” AND WITH ALL FAULTS, AND DISCLAIMS ALL WARRANTIES, EXPRESS AND IMPLIED, INCLUDING WITHOUT LIMITATION ANY IMPLIED WARRANTIES OF MERCHANTABILITY, FITNESS FOR A PARTICULAR PURPOSE OR NON-INFRINGEMENT OF THIRD PARTY INTELLECTUAL PROPERTY RIGHTS.These resources are intended for skilled developers designing with TI products. You are solely responsible for (1) selecting the appropriate TI products for your application, (2) designing, validating and testing your application, and (3) ensuring your application meets applicable standards, and any other safety, security, or other requirements. These resources are subject to change without notice. TI grants you permission to use these resources only for development of an application that uses the TI products described in the resource. Other reproduction and display of these resources is prohibited. No license is granted to any other TI intellectual property right or to any third party intellectual property right. TI disclaims responsibility for, and you will fully indemnify TI and its representatives against, any claims, damages, costs, losses, and liabilities arising out of your use of these resources.TI’s products are provided subject to TI’s Terms of Sale (www.ti.com/legal/termsofsale.html) or other applicable terms available either on ti.com or provided in conjunction with such TI products. TI’s provision of these resources does not expand or otherwise alter TI’s applicable warranties or warranty disclaimers for TI products.
Mailing Address: Texas Instruments, Post Office Box 655303, Dallas, Texas 75265Copyright © 2020, Texas Instruments Incorporated