mndept iof tr nsportation
TRANSCRIPT

MNDEPT OIF TR NSPORTATION3 0314 00023 7239
4SPORTATION
*
*0
00
00
00
00
00
00
00
00
00
00
00
00
00
00
00
00
00
CTSTG325.6.S428
**
p
S0
00
00
S0
S0
0
6 ·* e *00***************************o0**

The financial support of oil overcharge fundsdistributed through the Minnesota Department ofAdministration is acknowledged, but the authors assumecomplete responsibility for the contents herein.
Effect of Creep and Coldness-Induced Shrinkage
on the Performance of
Laminated Timber Bridge Decks
Robert T. Seavey
Robert W. Erickson
Acknowledgement: The authors wish to recognize the considerable effort and insights ofDr. Bruno M. Franck and Dr. Vern Guyer on the project.

Introduction
The purpose of this research has been to analyze the effect of creep on stress
laminated timber bridges where creep refers to the time-dependent deformational
behavior of the wood. Of particular interest has been the cause of stress loss in stress-
laminated bridges.
There are two types of creep that are important to timber bridges. These are
perpendicular to grain creep due to the rod stressing and flexural creep from the dead
weight load of the bridge. Creep can occur within each of the bridge laminae due to the
compressive force that is acting perpendicular to the grain. The amount of perpendicular-
to-grain creep that takes place will affect the level of rod stress. Ideally the level of creep
will be very small and the effect on prestress levels will be inconsequential.
Unfortunately this parameter of bridge design is not well understood and it is difficult to
predict how creep perpendicular to the grain will affect bridge prestress levels.
Another factor which affects bridge performance is flexural creep due to the dead
weight load of the bridge. Stress-laminated bridge design allows for longer spans to be
used with lumber that has less depth. The older nail-laminated designs used shorter spans
where the effects of creep were less apparent. Flexural creep will be due to the effect of
the dead weight load of the bridge, which is derived from the weight of the lumber and
the bituminous surface. One significant problem that may result from flexural creep is
the reduction or reversal of bridge camber. Commonly bridges are designed with a small
positive camber which increases the load bearing characteristics of the bridge and thereby
improves the service characteristics or service life of the bridge. In one instance the
positive camber that had been placed into the bridge was lost over the space of one year
(Gunflint Trail Bridge) and the bridge actually exhibited reverse camber. While a

2
number of factors can contribute to this problem, flexural creep is certainly an issue that
must be considered with bridge design.
During the course of this research, another important factor which affects the level
of rod stress in timber bridges was discovered: coldness-induced shrinkage of wood.
After the construction of a stress-laminated bridge in northern Minnesota in October,
1988, a significant reduction in rod stresses was noted during a particularly cold period in
December of that year. Proper rod stresses are needed for a stress-laminated bridge to
perform as an orthotropic plate whereby there is a high degree of load sharing between
adjacent laminae. It has been determined that the interlaminae pressure must be at least
40 psi (Ritter 1990) for proper load sharing between laminae. An abrupt reduction in rod
stress due to external temperatures poses an important design and service issue for timber
bridges.
Background on Creep in Wood
Creep has been described as a time-dependent deformation due to a load (force)
that is applied to a material. All materials are subject to creep, and therefore creep is a
design factor that must be considered. Boyd (1982) has noted that while structural design
specifications for wood products allow for increased deflection due to creep effects, these
provisions for creep are crude and may be economically inefficient. The chemical
structure of wood and the wood/water interaction make it very important to better
understand and control the rate and amount of creep within a structural member.
The mechanical and physical behavior of wood is strongly influenced by the cell
wall structure, especially the structure of the secondary cell wall. Within this layer of cell
wall there are microfibrils which consist primarily of parallel cellulose chains. The

orientation of the microfibrils is critical to the physical properties of wood related to its
interaction with water.
The S2 layer of the secondary cell wall is the thickest layer of the cell. Its
structure strongly influences the properties of the wood. The microfibrils in the S2 layer
run nearly parallel to the long axis of the cell. Moisture is desorbed and adsorbed from
between the microfibrils, not from within their length. Therefore, wood has much greater
dimensional stability in the longitudinal direction than in the transverse direction. The
cellular orientation within a block of wood is also in the longitudinal direction since the
cells are many times greater in length than width. A block of wood, therefore, can be
visualized as a cube made up of soda straws. The strength is much greater along its
length or longitudinal orientation than its width.
Background on Moisture and Creep of Wood
It has been shown that changing the moisture content greatly increases the rate
and total amount of creep. Hearmon and Paton (1964) performed creep experiments
using miniature wood beams. They observed that changing the relative humidity resulted
in creep deformation that was accelerated whether the moisture content increased or
decreased. Wood is a very hygroscopic material and changes in the humidity and
temperature of the environment affect its moisture content. The amount of creep is due
not only to the effect of moisture content on the mechanical properties, but also to the
forming and breaking of hydrogen bonds between the water and cellulose molecules.
Boyd (1982) notes that the structural responses of the fiber wall are determined by the
framework of the crystalline cellulosic microfibrils and the interpenetrating non-
crystalline substances. The space between microfibrils is filled with hemicellulose and
lignin. This space may be described as a hydrophilic gel which is characterized by its
high swelling capacity and its plastic deformity. Therefore, as stresses are imposed on a
4
wood specimen, the configuration of the cell wall may change with increases and
decreases in the amount of moisture within the amorphous regions of the cell wall.
Prestressing Bridge Decks: Compression Perpendicular to the Grain
During the prestressing process, a significant compression stress perpendicular to
the grain is placed on the wood. Where this stress exceeds the crushing strength of the
wood, there may be some localized crushing around the plates. However, creep
perpendicular to the grain is another important result of the prestressing since
undoubtedly some creep in compression perpendicular to the grain will take place. The
issue is to determine how much creep will take place and how this will affect the long-
term performance of the bridge. The factors which affect this situations are: the specific
gravity of the wood (and closely related, the crushing strength perpendicular to the grain),
the plate size, the level of prestressing, the moisture content of the wood and the
fluctuations in moisture content.
Flexural Creep in Wood
When a wood beam is subjected to a bending moment, the fiber stresses will be
greatest at the top and the bottom of the beam. The wood at the top surface of the beam
is stressed in maximum compression while that at the bottom surface is stressed in
maximum tension. Therefore, when dealing with flexural creep, the wood that is directly
exposed to the surrounding air environment is also the wood that is under the greatest
fiber stress.
Stress laminated bridge design allows for longer spans and the use of species that
are less dense. In addition the depth of the supporting laminae may be reduced in the
bridge design. The advantages of this system are obvious; more efficient use of the wood

5
is possible and previously underutilized species may now be used for bridge construction.
One drawback to this design is that there is more likelihood for flexural creep since the
deadload per span is now greater. Therefore, there is a need to research and examine the
fundamental mechanism of creep due to cyclical moisture movement at the tension and
compression surfaces of the beam.
Background on Stress Laminated Timber Bridge Design
Stress-laminated timber bridge design was developed in Ontario in the 1970's
(Taylor, 1981; Taylor et al., 1983). Originally the system was used to strengthen older
nail-laminated bridges. The system used a rod that was passed through holes drilled in
the laminae near the center-line of the deck. A steel plate with a centrally located hole
was then slipped over each end of the rod and brought in contact with the deck. Nuts
were applied to the threaded ends of the rod and highly torqued so that pressure was
applied by the plates to the laminations. This system pushed back together the nails that
had been pulling out. Furthermore, in addition to the dowel connections provided by the
nails, the pressure from the plates created friction between the laminations. This process
created significant improvements in the transverse stress distribution. Previously, e.g. the
weight of tandem wheels was supported primarily by the laminae immediately under and
adjacent to the wheels. With stress-laminated decks the supporting area was considerably
greater than for the nail-laminated decks and therefore the older bridges which were
strengthened by the tensioned rods and plates were stiffer than when originally built.
The early research on stress-laminated bridges in the United States was conducted
by the USDA Forest Service Forest Products Laboratory (FPL). In 1988 the FPL
initiated a nationwide bridge monitoring program. The results of this program were to
be used to develop, confirm, or improve methods of design, fabrication, and construction.
In addition to the monitoring program, the FPL in conjunction with the University of

6
Wisconsin, Madison, conducted a laboratory study of stress-laminated bridges (Oliva et
al., 1990). The primarily objective was to compare the behavior of bridge decks under
simulated truck loadings to those obtained in the field in earlier Ontario studies. The
secondary objective was to develop an analytical modeling technique for predicting the
behavior of stress-laminated decks and for identifying new stressing and anchorage
systems that could economically replace methods used in Ontario. The study concluded
that transverse prestressing considerably improves the load distribution characteristics
over those of a nail-laminated lumber deck.
Results and Discussion
Flexural Creep
The fundamental approach to this area of research considered the question about
the basic nature of creep in wood. It was especially important to address the effect of the
direction of moisture diffusion on the beam deflection. Therefore, aluminum foil was
used to obtain the desired "directed diffusion." For example, with all surfaces of the
beam except one wide surface covered with foil, the sorption was directed through the
open face. If the open face was oriented upward, then the diffusion was directed through
the face stressed in compression. If it was oriented downward, sorption had to occur
through the face stressed in tension. Some beams, in addition to the external wrapping,
also had a continuous foil barrier bonded at the neutral axis. This was accomplished by
first sawing the beam along the neutral axis and then using isocyenate adhesive to bond
the foil at the neutral axis.
The quartersawn beams, each 1/2" deep x 1.0" wide x 20" long were prepared
from straight-grained, knot-free, kiln-dried, ponderosa pine. Following all of the required
preparation, they were placed in the walk-in testing room maintained at an equilibrium

7
moisture content (EMC) condition of about 17% (DBT 91*F and WBT 87"F) and were
weighed periodically to determine MC equilibrium. The equilibrated beams were then 2-
point loaded at the desired stress level and deflections were obtained while the room
EMC was maintained at 17%. After the initial elastic deflections of the beams, there
were delayed elastic deflections which gradually leveled out to a near constant deflection.
Once the "constant" deflections were established, the settings were set to maintain the
room air at an EMC condition of about 7%. Deflections were then determined during this
desorption period until the control beams had attained what appeared to be constant
deflection. The room EMC was then changed back to 17% and kept there until constant
deflections for the controls were again obtained. The cycle of desorption / adsorption
was repeated several times. Unstressed MC samples were weighed each time deflections
were determined.
Flexural Testing at 400, 800 and 1000 psi
Two beam types were tested. The controls were allowed to dry through all four
surfaces while the second type had aluminum foil covering all surfaces except the tension
face. Three beams were tested at each stress level and MC samples (beams) representing
each type were weighed when deflections were determined for the stressed beams.
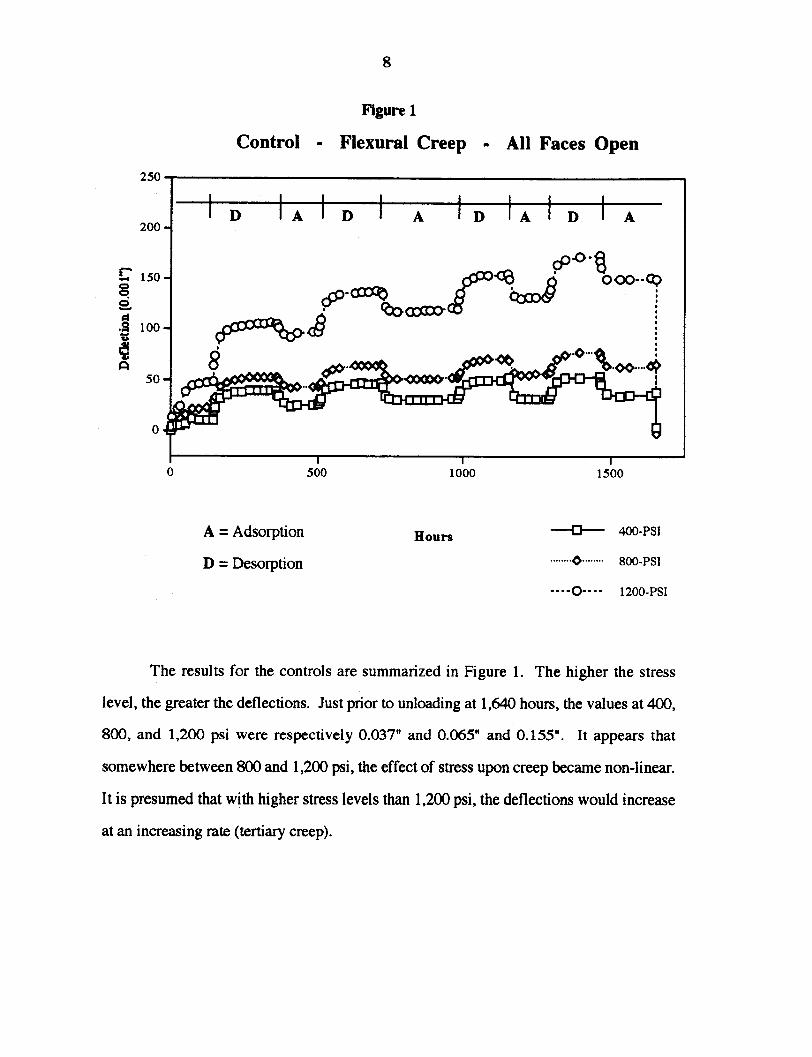
Figure 1
Control - Flexural Creep - All Faces Open
000w
A = Adsorption
D = Desorption
Hours -- -- 400-PSI
...... 0 .. 800-PSI
- --- 0--- 1200-PSI
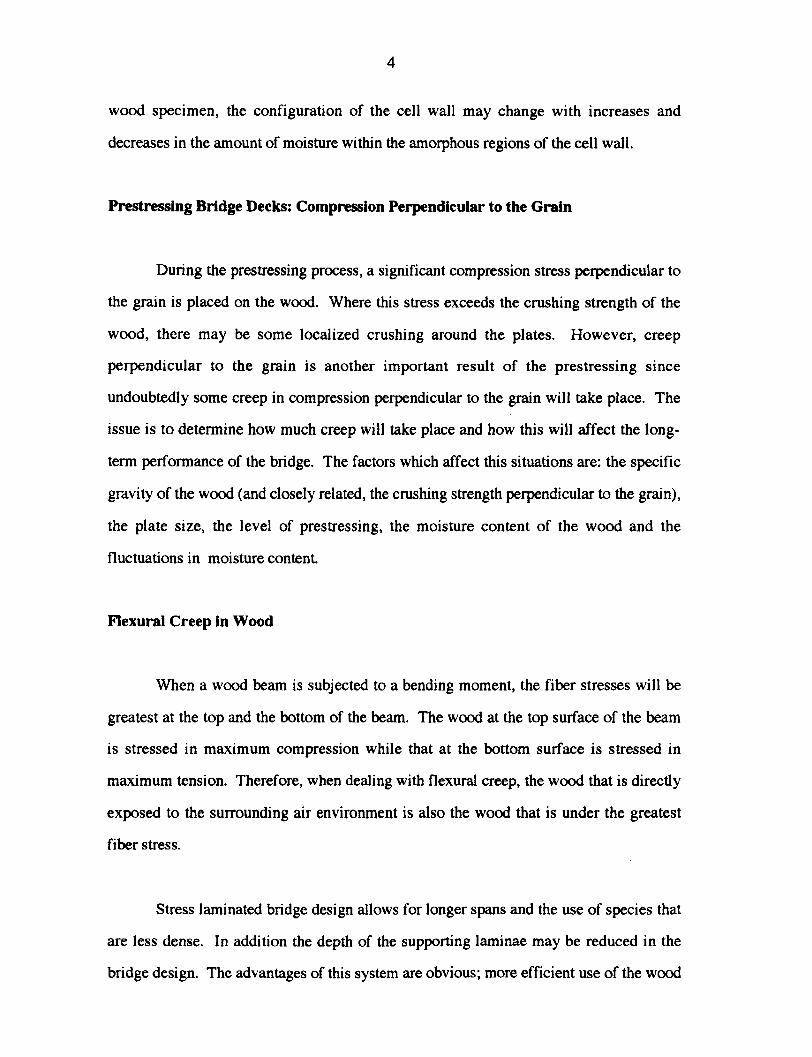
The results for the controls are summarized in Figure 1. The higher the stress
level, the greater the deflections. Just prior to unloading at 1,640 hours, the values at 400,
800, and 1,200 psi were respectively 0.037" and 0.065" and 0.155". It appears that
somewhere between 800 and 1,200 psi, the effect of stress upon creep became non-linear.
It is presumed that with higher stress levels than 1,200 psi, the deflections would increase
at an increasing rate (tertiary creep).
ow zn

9
Figure 2
Flexural Creep - Tension Face Open
0 500 1000 1500
Hours
A = Adsorption
D = Desorption
-- -- 400 PSI
........ ........ 800-PSI
- --. 0---- 1200-PSI
Figure 2 summarizes the data for the tension-face-open (TFO) beams. For the 400
and 800 psi beams, the final deflection values for the two TFO and controls appear nearly
identical. This is surprising since the direction of moisture movement is very different
for the two types. The TFO beams, during the initial stage of each desorption, underwent
a large recovery of deflection due to shrinkage of the bottom surface of the beam. The
shrinkage caused the beam to bow up and thus recover some of its deflection. However,
as drying progressed, this recovery was dissipated as the deflection steadily increased. At
the end of each desorption step, the deflection was essentially equal to that for the
CD
0Is
§
g.
o
^ -W^•

10
conventional beams. During adsorption, the reverse was true. The TFO beams
experienced a large deflection which was then recovered as the drying progressed.
At the end of each desorption and adsorption, the conventional and TFO beams
had nearly the same deflections. It appears that as long as the amount of desorption or
adsorption was the same for both types, they attained equal deflections.
The deflection curves for the conventional beams are of the type found in the
literature. During desorption, the deflection increases at a decreasing rate and becomes
constant. During adsorption, the deflection decreases at a decreasing rate and than
becomes constant.
It is very instructive to compare the beam deflections at the end of the first and
fourth desorptions for each stress level. This is perhaps easiest to do for the control
beams in Figure 1. At the end of the first desorption, the deflections for 400, 800 and
1200 psi are respectively about .039", .055" and .105". After the fourth desorption, the
analogous deflections are .055", .077", and .173". For each stress level, the deflection at
the end of the first desorption is in the range of 60 to 70% of the value at the end of the
fourth desorption. In other words, about two-thirds of the total creep had occurred by the
end of the first desorption. This observation points to the importance of the first
desorption of a beam occurring under load. The creep deflection of a timber bridge deck
that dries out under its own deadweight load could be significant. Intermittent loading
due to traffic would no doubt add to the problem.

11
Flexural Creep: Samples with Aluminum Foil Adhesive Bonded at the Neutral Axis
For this set of experiments, the aluminum foil was bonded at the neutral axis of
the samples. There were four sample types used: 1) conventional samples (no foil), 2)
samples with aluminum foil sandwiched at the neutral axis and foil covering the two
edges (BFO), 3) samples with foil at the neutral axis and only the tension face exposed to
the environment (TFO), and 4) samples with foil at the neutral axis and only the
compression face open (CFO). Each sample type was represented by three closely
matched samples. The stress level was 600 psi and the EMC was cycled between
approximately 17% and 7%. Figure 3 shows a diagram of the test setup for the
compression face open sample.
12
Figure 3
Compression Face Open Sample
Compression Face Opx
Aluminum Foilat Center -
Third Point Loading of Test Sample
Dial Gauge Measurement
It is apparent from Figure 4 that there was little effect due to the foil bonded at the
neutral axis since the shape of the curve for the BFO samples is quite comparable to that
of the conventional samples. The curve for the conventional samples remains below the
4

13
one for the BFO samples, but that may be due to the added strength derived from the fact
that their edges, compared to the BFO samples, were able to uniformly dry more quickly.
Furthermore, the drying of the edges meant that less moisture was sorbed through the
highly stressed surface layers, which helped reduce the interactive effects of moisture
change and stress.
Figure 4
Laminated Beams - Aluminum Foil at Center250
200
S150
ltoo
50
0
0 500 1000 1500
Hours
2000
--- D-- CONTROL
........ ........ BFO
...- 0---- CFOA = Adsorption
D = Desorption
There is a notable difference in the shape of the TFO curves for Figures 2 and 4.
Without foil at the neutral axis (Figure 2) the amount of deflection recovery early in
desorption is less, and the rate of creep following the inflection point of the recovery is
greater. With no vapor barrier at the neutral axis, moisture migration occurred in the top
half of the beam as well as the bottom half of the beam. This enabled the compression

14
half of the beam to experience downward deflection, which offset the deflection recovery
attributable to the tension face.
In Figure 4, the recovery early in each desorption step for TFO samples is about
twice the magnitude for each counterpart in Figure 2. This is because the moisture in the
compression half of the beam was unable to migrate downward and serve as a buffer to
mitigate the effect of the drying at the lower or tension surface.
During the adsorption steps, these same differentials are evident for the TFO
samples in Figures 2 and 4. Without a barrier at the neutral axis, moisture moves into the
compression half of the beam and this translates into recovery of deflection. The
recovery is apparent from the graph for the CFO samples in Figure 4. This recovery
counteracts the downward deflection caused by adsorption through the tension face.
CFO samples show a definite downward deflection for the initial rapid rate period
that takes place early in each desorption step. As was true for the TFO samples, an
inflection point is quickly reached. Following this inflection, the CFO samples gradually
recover from their point of maximum deflection. When the EMC is raised from 7% to
17%, there is a rapid recovery of deflection as moisture is rapidly adsorbed through the
compression face. This appears to be due to quick attainment of maximum swelling on
the highly stressed compression.
The deflection curves for the various sample types shown in Figure 4 offer a
probable explanation for the constant deflection portion of flexural curves for wood that
can be found in the literature (Hearmon, R.F.S. and J.M.Paton. 1964. For. Prod. Jour.).
The downward deflection attributable to the tension half of the beam offsets the
deflection recovery for the compression half of the beam.

15
In the literature flexural creep is modeled through the use of dashpots and springs.
The Figure 4 curves for CFO and TFO might possibly be explained in terms of a model
for which the CFO has the behavior of a dashpot and the TFO the behavior of a spring.
During the rapid rate desorption, the compression face undergoes shrinkage in addition to
the mechano-sorptive response that produces compression set. The high rate of MC
change at and near the surface, taking place in the presence of the highest compressive
stress present in the beam, results in large compression set on the upper or compression
surface. The formation of the compression set is limited by the longevity of rapid MC
change. Once the near-surface MC is at equilibrium with the ambient air EMC, the rate
of MC loss from the surface becomes dependent upon the MC gradient in the wood. As
drying continues, moisture continues to move slowly through the surface and this serves
to assist in the recovery of compression set. As moisture moves through the surface, the
process of making and breaking the hydrogen bonds allows for slippage or movement of
the microfibrils such that the stress due to the set is then partially and incrementally
relieved. If this slow drying were continued for the CFO sample until its MC gradient
were eliminated, the deflection remaining would be due to nonrecoverable compression
set (creep). However, when the ambient air is changed to a high EMC condition, the
wood at the surface of the compression side of the beam is induced to take up more
moisture and swell. This swelling is restrained and therefore more compression set is
induced into the exposed wood on the compression face.
The TFO sample has a behavior more similar to that of a spring, not a dashpot.
With rapid rate desorption the sudden drying causes a contraction of the wood on the
tension face. However, this contraction is restrained by the remaining portion of the
beam as well as the load that has been placed on the beam. This combined effect causes a
tension set on the wood at the surface such that the fibers are stretched beyond their
elastic limit and take on longer dimension than before. Once again the process is limited
by the extent of drying; when the drying changes from being surface dependent to

16
diffusion dependent, the recovery curve has reached its inflection point. As diffusion-
dependent drying continues, the movement of water through the highly stressed surface
causes the level of tension set to increase. The moisture movement and the making and
breaking of the hydrogen bonds of the fibers near the surface results in increased
microfibril slippage due to the continued effect of the load on the beam.
The hypothesis that the tension half of the beam behaves like a spring is supported
by the amount of recovery obtained by the TFO beams following load removal. The
deflection reading 235 hours after load removal is -0.050", which was within 0.007" of
the original unloaded deflection of .057" at an equilibrium MC of 17%. Since there is an
appreciable slope to the recovery curve, it is likely that more recovery would have
occurred with time and the discrepancy would have disappeared.
The other three types of beams each of which experienced a series of adsorption/
desorption cycles for the compression half of the beam, are clustered near the same value
after the load had been removed. The range of values is about -0.010" to -0.016". This
leaves each of these three sample types with a final deflection value that falls in the range
of about 0.040" to 0.050" greater than its original pretest unloaded reading at 17% MC.
This scenario suggest that the compression half of the beam is responsible for most, if not
all of the credit for the unrecoverable deflection (creep). These results can be related to
Boyd's model of wood structure where the cell wall resembles a lenticular platelet form in
the S2 layer and the microfibril chains are supported by the amorphous regions
surrounding them. There is likely to be considerably more delayed elastic recovery of the
microfibril chains due to tensile stress caused by pulling along the chains. This tensile
stress may straighten and lengthen the chain while the stress is applied, however, when
the stress is removed, the chain returns to its original configuration. Conversely, when the
lenticular platelet structure is subjected to a compression force, it is possible to deform
the amorphous regions and to shorten the length of the chain by increasing the bends

17
within it. This type of deformation is inherently less recoverable because the structure
has taken on a new configuration.
Results from the 2x4 Beams
Results from the testing of 2x4 beams are shown in Figure 5. All of the previous
studies have been with small samples. The 2x4 beams were set on edge and did not
contain a foil moisture barrier at the neutral axis. A very definite creep response was
observed for the small beams. With larger beams there is considerably greater depth
effect. Therefore, this test was set up to evaluate whether or not larger beams would
show a similar behavior to the smaller beams.

18
Figure 5
2x4 Beams
0.6
4
,DI0
S
A
0.4
0.2
0 2000 4000 6000
Hours ----- CFO
A = Adsorption ........ ....... T
D = Desorption ----...---- BFO
The 2x4 beam results show a very similar creep response when compared to the
small beams. During the rapid rate periods, the amount of deflection or recovery was
very definite and very fast. Following the rapid rate period, in each case there is a
recovery period, similar to the small beams. Furthermore with each of the adsorption and
desorption cycles, the amount of deflection increase. Consequently over time there is
creep occurring.

19
Creep in Samples Stressed in Compression Perpendicular to the Grain
Tests were conducted on red pine samples 0.016" thick, 1.0" parallel to the grain
and 2.5" long in the radial or tangential direction. The end grain was coated with resin
plus a strip of aluminum foil after the samples were equilibrated to approximately
15% MC.
Testing was performed with an apparatus built by the University of Minnesota
Scientific Apparatus Shop. The apparatus is housed in the working chamber of a Blue M
environmental unit and each of the three internal loading heads is coupled to its matched
loading head external to the chamber. The dead weight load applied to an external head
is transferred to the internal head through a glycine-filled pair of bellows and connecting
copper tubing. Dimensional changes of the test samples can be tracked by measuring the
movement of the loading head. Moisture content was monitored on an unstressed sample
suspended from a quartz spring in the forefront of the internal loading heads. Vertical
displacement of the MC sample was determined by sighting through the Plexiglas door of
the working chamber with a cathetometer.

20
Figure 6
Creep in Compression
I
50
*AP
0 250 500 750 1000
Hours -- -- Creep 60 psi
........*........ Creep 120 psi
Samples were loaded at two stress levels: 60 psi and 120 psi. The MC was cycled
between approximately 6% and 15% while maintaining a dry bulb temperature close to
90*F. Figure 6 shows shrinkage and creep for the samples from 60 psi and 120 psi
testing. The shrinkage samples were cycled with essentially no external loading; only
enough to ensure continuous contact of the sample with the loading head throughout the
testing. The creep samples were subjected to the loading required for obtaining 60 psi.
By the end of the 4th desorption, there is a differential in the dimensional change
for the shrinkage and 60 psi samples. The differential is the creep since the shrinkage has
been subtracted from the total dimensional change values for the loaded samples. This
differential tends toward being constant over the remaining cycles, with both curves
I ^^/%

21
exhibiting a slight positive slope. It is noteworthy that at the end of the first adsorption,
the creep is already equal in magnitude to the shrinkage: 0.020". By the end of the 4th
desorption, at which the sample appears to have attained a constant differential compared
to the shrinkage, it has a value of 0.030". In other words, two-thirds of the total creep
obtained from the four desorptions developed during the initial desorption. It is of great
interest that the creep curves for samples tested perpendicular to the grain are equivalent
to those obtained for beams.
A very interesting feature for the 120 psi samples is that at the end of the first
desorption, the amount of creep is about the same as that for the 60 psi samples, i.e. just
over 0.020". This suggests that during the first desorption the amount of creep produced
was more a function of the internal stresses than of the additional 60 psi of stress. For
each desorption/ adsorption cycle thereafter, the additional creep per cycle was much
greater for the 120 psi than for the 60 psi.
Freezing Effects: Coldness-Induced Shrinkage
Observations from the Cyphers Bridge
The first observations concerning problems with coldness-induced shrinkage
occurred with the Cyphers bridge in northern Minnesota. The Cyphers Bridge was
designed by Dr. Bruno Franck, P.E. It was fabricated by Wheeler Lumber and erected by
Zeller Contracting Inc. Construction of the Cyphers Bridge was completed October
1989. Since construction the bridge has been monitored. The data was collected by the
Minnesota DNR and then transferred to the University of Minnesota Department of
Forest Products and the United States Forest Products Laboratory. The monitoring
program concerned the level of rod stress within two of the stressing rods on the bridge.
22
The Cyphers Bridge is a stress-laminated bridge whereby the lumber laminae are
pushed together by plates which are transversely oriented from rail to rail perpendicular
to the direction of traffic. At certain times over the past three years, the rod stresses have
decreased significantly. Between Dec. 8 and Dec. 22 of 1989, the temperature dropped
from 13"F to -18°F and the rod stress decreased by 25% in rod #5 and 21% in rod #8.
Similar, though smaller reductions can be observed at Dec. 21, 1990 (-16°F) and Nov. 4,
1991 (-5"F). The larger reductions in rod stress in 1989 are probably due to the larger AT
and a higher moisture content of the wood in the bridge deck at the time.
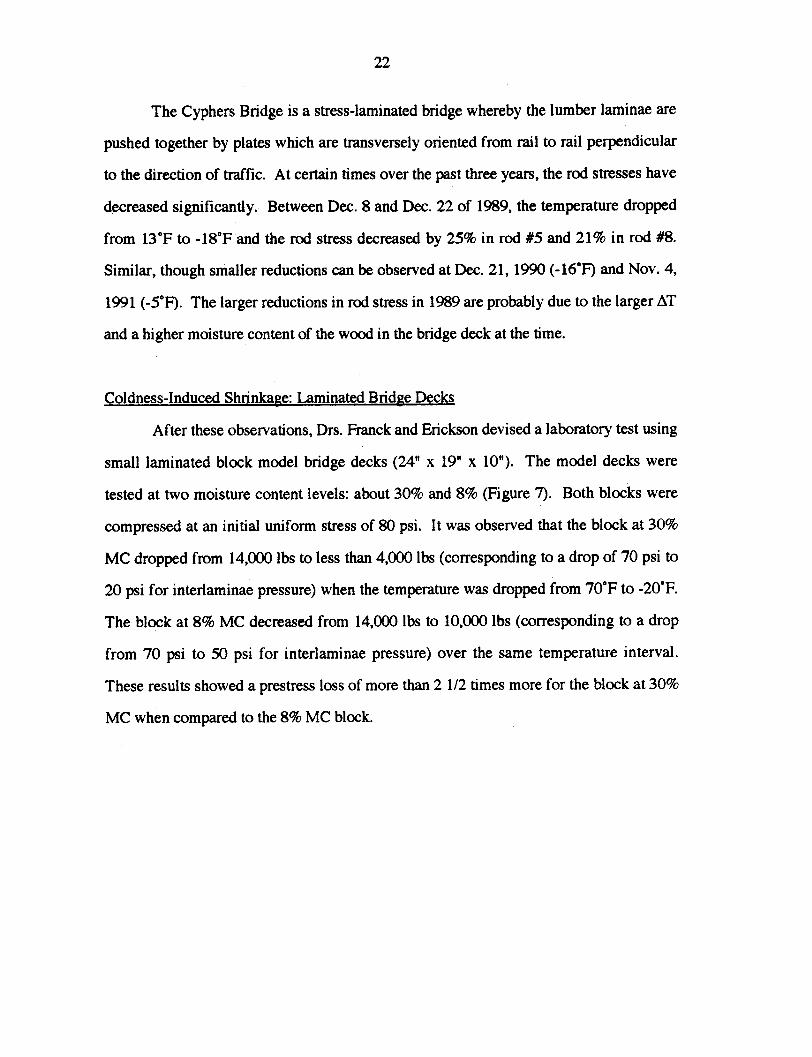
Coldness-Induced Shrinkage: Laminated Bridge Decks
After these observations, Drs. Franck and Erickson devised a laboratory test using
small laminated block model bridge decks (24" x 19" x 10"). The model decks were
tested at two moisture content levels: about 30% and 8% (Figure 7). Both blocks were
compressed at an initial uniform stress of 80 psi. It was observed that the block at 30%
MC dropped from 14,000 lbs to less than 4,000 lbs (corresponding to a drop of 70 psi to
20 psi for interlaminae pressure) when the temperature was dropped from 70°F to -20°F.
The block at 8% MC decreased from 14,000 lbs to 10,000 lbs (corresponding to a drop
from 70 psi to 50 psi for interlaminae pressure) over the same temperature interval.
These results showed a prestress loss of more than 2 1/2 times more for the block at 30%
MC when compared to the 8% MC block.

23
Figure 7
Freezing Test with Model Blocks
Rod Stre(Pounds)
250 500 750 1000
Hours--- 30 % MC
........ 0 ....... 8% MC
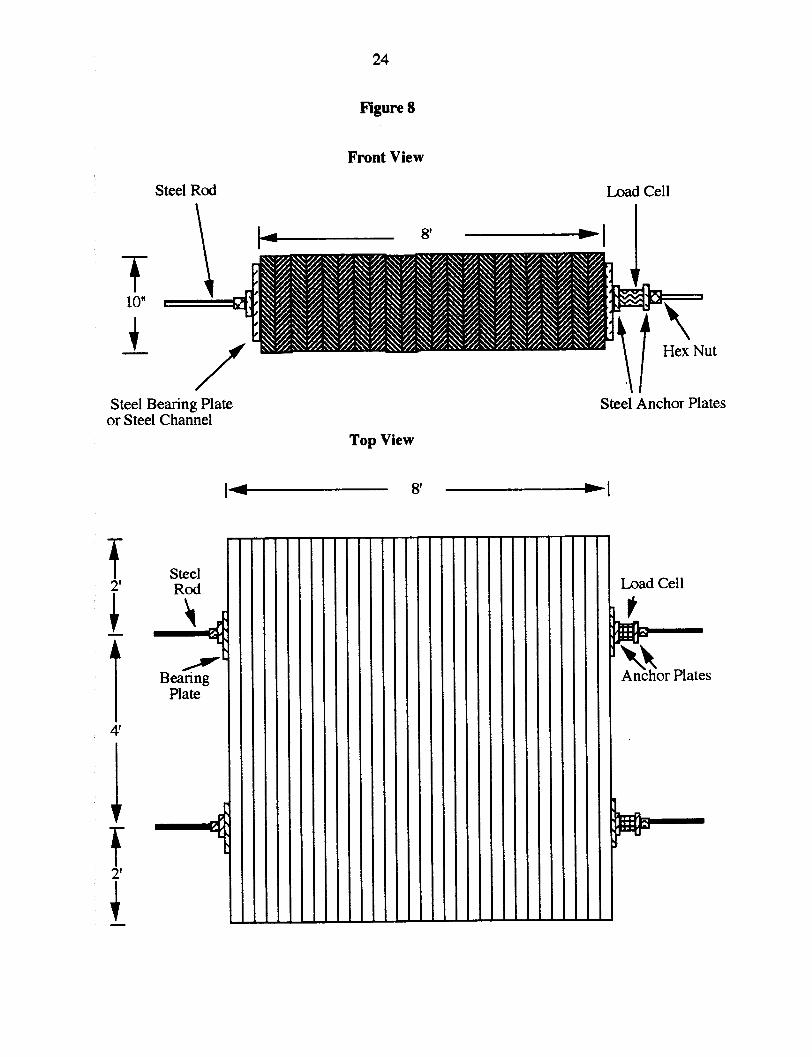
Another study was also designed to examine the effect of coldness-induced
shrinkage on larger sized model decks which were located outside on the St. Paul
campus. Two decks (8'x8'xlO") were constructed, one utilized plates for prestressing
while the other utilized channels (Figure 8). These decks were monitored over two
winters. The results from these runs are shown in Figures 9 and 10.
24
Figure 8
Front View
Steel Rod Load Cell
8' s--mall
X, 0,XX0,X10"
/Steel Bearing Plateor Steel Channel
Top View
8'
V2'
4'
Hex Nut
Steel Anchor Plates
imml-
I
91
Irm

25
Figure 9
Rod Stress: St. Paul Campus Bridge DecksWinter I
Rod Stre,(Pounds)
0 100 200 300
Days: July 11, 1990 to June 12, 1991 --- Channels
0........ ....... Plates
The most dramatic effects are observed during the first winter at about 160 days
into the run. These results are highlighted in Table 1. During a two-day period, the
temperature decreased by 45"F from 25"F to -20°F. The reduction in the rod stress was
34% for the deck with the channel and 54% for the deck with the plates. Similar results
could be observed over the second winter, although the magnitude of the temperature
change and the corresponding stress loss was reduced. A general observation of the
prestress levels from these winters indicates that the rod stress levels are very stable for
most of the year, however the period from December through March is prone to
significant fluctuations depending on the outside temperature.

26
Figure 10
Rod Stress: St.
30000 -
20000 -
Rod Stress(Pounds)
10000 -
0-
500
Paul Campus Bridge DecksWinter II
I I550 600
Days: November 25, 1991 to April 27, 1992
----- Channels
........ 4 ........ Plates
Table 1
Time Period AT(°F) Rod Stress Reduction
12/20/90 - 12/22/90 45OF 34% Channels
(46.8 hours) (250 to -20'F) 54% Plates
1/14/92 - 1/15/92 150F 29% Channels
(32 hours) 28% Plates
rý

27
Conclusions
1. Creep due to mechano-sorptive interaction between wood and water may be an
important factor in bridge design as spans are lengthened and as the deadweight of
the bridge deck is increased.
2. Coldness-induced shrinkage is an important factor for bridge design due to the
effect of this shrinkage on the ability of the stress-laminated bridge deck to
perform as an orthotropic plate.
3. The results from this study clearly identify the importance of moisture content to
the long-term durability of the bridge. The results from the analysis of flexural
and compressive creep indicate that up to two-thirds of the observed creep takes
place during the first desorption. Lumber used for bridge decks should be dried
uniformly to 15% moisture content or to a moisture content that is appropriate for
the temperature and humidity conditions of the region.

28
Bibliography
1. Boyd, J.D. 1982. "An anatomical explanation for visco-elastic and mechano-
sorptive creep in wood, and effects of loading rate on strength." New
Perspectives on Wood Anatomy, 171-222.
2. Erickson, Robert W. , Bruno M. Franck, Vern Guyer, Robert T. Seavey, and
Wanbing Lu. 1990. "Creep investigations in the context of laterally prestressed
timber bridge decks." FPRS Annual Meeting, Salt Lake City, Utah.
3. Hearmon, R. F. S., and J. M. Paton, 1964. "Moisture content changes and creep
of wood." Forest Products Journal 14(8): 357-359.
4. Holzer, Siegfried M., Joseph R. Loferski, and David A. Dillard. 1989. " A
review of creep in wood: concepts relevant to develop long-term behavior
predictions for wood structures." Wood and Fiber Science 21(4), 376-392.
5. Hoyle, Robert J., Jr., Rafki Y. Itnai, and James J. Eckard. 1986. "Creep of
douglas fir beams due to cyclic humidity fluctuations.: Wood and Fiber Science
18(3), 468-477.
6. Kubler, Hans. 1962. "Schwinden und Quellen des Holzes durch Kilte." Holz
Roh - Werkst. 20 (9): 364 - 368.
7. Kubler, Hans, L. Liang, and L. S. Chang. 1973. "Thermal expansion of moist
wood." Wood and Fiber 5 (3): 257 - 267.
29
8. Kubler, Hans. 1988. "Frost cracks in stems of trees." Arboricultural Journal.
Vol. 12: pp. 163 - 175.
9. Oliva, M. G., Al G. Dimakis, Michael A. Ritter, ,and Roger L. Tuomi. 1990.
"Stress laminated wood bridge decks." USDA Forest Service, Forest Products
Laboratory Research Paper FPL-RP-495.
10. Ritter, M. A., 1990. "Timber bridges. design, construction, inspection, and
maintenance." EM 7700-8, Madison, WI, U.S. Department of Agriculture, Forest
Service, Forest Products Laboratory.
11. Schniewind, Arno P. 1967. "Creep-rupture life of douglas-fir under cyclic
environmental conditions." Wood Science and Technology Vol. 1., Springer-
Verlag, 278-288.
12. Schniewind, Arno P. and Duane E. Lyon. 1973. " Further experiments on creep-
rupture under cyclic environmental conditions." Wood and Fiber Science Vol.
4(4), 334 - 341.
13. Taylor, R. J. 1981. "Inter-laminate shear strength in post-tensioned laminated
wood systems." Kingston, Ontario, Canada: Queen's University, Civil
Engineering Department; Undergraduate report.
14. Taylor, R., Batchelor, J., Dev, B., Van Dalen, K. 1983. "Prestressed wood
bridges." Downsview Ontario, Canada: Ontario Ministry of Transportation and
Communications, Research and Development, Branch; SRR-83-01.
