mne_plan_undp-slm project final (1)
TRANSCRIPT
Monitoring & Evaluation Plan
Mainstreaming Sustainable Land
Management in Agro-Pastoral Production Systems of Kenya Project
Prepared by Zablon Wagalla, Natural Resources/M&E Consultant
October/November 2014

Table of Contents
1.0 M&E PLAN ........................................................................................................................................................................ 5
M&E OF PROJECT PERFORMANCE ............................................................................................................................................... 5 M&E OF PROJECT IMPACT ............................................................................................................................................................. 5 1.1 PROJECT OVERVIEW ........................................................................................................................................................ 6 1.2 SPHERE OF INFLUENCE MAPPING: KEY STAKEHOLDERS, THEIR MANDATES, RESPONSIBILITIES, INTEREST, POTENTIAL
CHALLENGES AND MITIGATION STRATEGIES ................................................................................................................................ 7 1.3 PROJECT PARTICIPANTS AND PARTNERS AT ALL LEVELS ...................................................................................................... 13
2.0 PURPOSE OF M&E PLAN .............................................................................................................................................15
3.0. M&E OF PROJECT PERFORMANCE .........................................................................................................................17
3.1 PROJECT IMPLEMENTATION APPROACH ................................................................................................................. 17 3.2 INDICATORS ....................................................................................................................................................................... 18 3.3 DATA COLLECTION .......................................................................................................................................................... 18
4.0 REPORTING ....................................................................................................................................................................20
Diagram 3: Monitoring, Evaluation and Reporting Implementation Arrangements ..................................................... 23
5.0. M&E OF PROJECT IMPACT .........................................................................................................................................24
5.1 BASELINE DATA AND METHODS .................................................................................................................................. 24 5.2 IMPACT ASSESSMENT METHODS ............................................................................................................................... 24 5.3 SUSTAINABILITY INDICATORS ...................................................................................................................................... 25
National ................................................................................................................................................................................... 25 Counties .................................................................................................................................................................................. 26 Catchment/Communities ...................................................................................................................................................... 26 FFS/PFS ................................................................................................................................................................................. 26
6.0. CONCLUSION AND RECOMMENDATIONS ...............................................................................................................27
ANNEX 1: STRATEGIC RESULTS FRAMEWORK/LOGICAL FRAMEWORK ...............................................................28
ANNEX 2: M&E MATRIX.......................................................................................................................................................42
MONITORING AND EVALUATION PLAN FOR SLM PROJECT-KENYA. ........................................................................................... 42 I. Key Evaluation Questions ................................................................................................................................................ 42 II. Monitoring and Evaluation Plan ...................................................................................................................................... 43
ANNEX 3: IMPACT ASSESSMENTS AND THEMATIC STUDIES ...................................................................................50
IMPACT ASSESSMENTS: ............................................................................................................................................................... 50 THEMATIC STUDIES: ..................................................................................................................................................................... 51
ANNEX 4: CHARACTERIZATION OF THE LANDSCAPE/COMMUNITY AND SLM ACTION PLAN- REPORT
TEMPLATE .............................................................................................................................................................................52
PART 1: OVERVIEW OF THE TARGET LANDSCAPE 1.1 BASIC INFORMATION- CATCHMENT ....................................................... 52 1.2 Reasons for selection of the catchment: .............................................................................................................. 52
PART 2: CHARACTERIZATION OF THE TARGET CATCHMENT ....................................................................................................... 52 2.2 Geography, Land and Water Availability and Use ..................................................................................................... 53

2.3 Land Degradation ..................................................................................................................................................... 53 2.4 SLM ............................................................................................................................................................................ 53 2.5 Policy and planning ........................................................................................................................................................ 53
PART 3: CATCHMENT- COMMUNITY SLM ACTION PLAN............................................................................................................. 54 3.1 SLM interventions and activities proposed at community/catchment level ..................................................... 54 3.2 Capacity Building ............................................................................................................................................................ 54 3.3 Collaboration and Co-financing .................................................................................................................................... 54 3.3 Upscaling process and sustainability .................................................................................................................... 55
ANNEX 5: M&E REPORTING TEMPLATES ...................................................................................................................................56

List of Abbreviation and Acronyms
ALRMP Arid Land Resource Management Programme
ASALS Arid and Semi-arid Lands
APR Annual Progress Review
ASDSP Agriculture Sector Development Support Programme
BTOR Back to Office Reports
CDW Country Dialogue Workshop
DLPO District Livestock Production Officer
DLMC District Livestock Management Committee
DMT District Management Team
DRSRS Department of Resource Surveys & Remote Sensing
ERC Evaluation Resource Centre
FAO Food and Agriculture Organisation
FFS Farmer Field Schools
GEF Global Environment Facility
IFAD International Finance for Agricultural Development
KEFRI Kenya Forestry Research Institute
KFS Kenya Forestry Service
LD Land Development
M & E Monitoring & Evaluation
MOA, L & F Ministry of Agriculture, Livestock and Fisheries
NALEP National Agricultural & Extension Programme
NDMA National Drought Management Authority
OFP Operational Focal Point
PFS Pastoral Field Schools
PIR Project Implementation Report
PMED Planning, Monitoring & Evaluation Department
PRA Participatory Rural Appraisal
QPR Quarter Progress Report
RCU Regional Central Unit
SDL State Department of Livestock Development
SIP Strategic Implementation Plan
SLM Sustainable Land Management
SO Strategic Objective
UNCCD United Nations Convention to Combat Desertification
UNDP United Nations Development Programme
UNDP CO United Nations Development Programme Country Office
UNEP United Nations Environment Programme

1.0 M&E PLAN
The M&E plan for the Mainstreaming Sustainable Land Management in Agro-Pastoral Production Systems
of Kenya Project has been developed by the consultant in close collaboration with the Dr. Zeinabu Khalif,
Programme Analyst (UNDP Country Office),all the staff working at the Project Management Unit (PMU-Hill
Plaza) and all the District Management Team, Frontline Extension Officers working at the sub-county levels
of Dadaab, Kyuso, Mbeere North and Narok North using a collaborative and participatory work sessions
with field officers from Garissa, Kyuso, Narok and Embu during October/November 2014. Guidance and
technical comments were provided by the staff working at PMU Office, Leonard Odini, Communications
Officer, Solomon Karuri, Ag. National Project Manager, Barbara Ombasa, Project Assistant, State
Department of Livestock, Planning, Monitoring and Evaluation Division staff.
The M&E plan includes two components addressing the target indicators in the project log-frame:
M&E of Project Performance Monitoring focuses on the management and supervision of project activities, seeking to improve efficiency
and overall effectiveness of project implementation. It is a continuous process to collect information on
actual implementation of project activities compared to those scheduled in the annual work plans, including
the delivery of quality outputs in a timely manner, to identify problems and constraints (technical,
processes, human resource, and financial), to make clear recommendations for corrective actions, and
identify lessons learned and best practices for scaling up, etc. Performance evaluation will assess the
project’s success in achieving its objectives. The project will be monitored closely by UNDP Energy
Environment and Climate Change Unit and the State Department of Livestock Planning, Monitoring and
Evaluation Division through Monthly statement of expenditure reports, Quarterly progress reports, Annual
progress reports, Annual implementation reviews, Mid-term reviews and Terminal evaluation reports, and
regular technical supervision missions to the project sites as required to enhance success. Participatory
monitoring and evaluation is also encouraged at the grassroot level where beneficiaries are involved
through their respective FFS/PFS in monitoring progress of their activities. The grassroot monitoring
missions are led by county focal point persons for monitoring and evaluations and these feeds into monthly
and quarterly progress reports.
M&E of project impact Evaluation of the project’s success in achieving its outcomes will be monitored continuously throughout the
project period. The key indicators can be found in the logical framework as indicated in the annex 1. The
indicators have been further reviewed/refined during the development of this M&E Plan, and tools and
methods and indicators for measuring impact have been determined and agreed to ensure that a
standardized framework is shared by the four participating sub-counties while ensuring compliance with
UNDP and government M&E requirements are met.
1.1 PROJECT OVERVIEW
Mainstreaming Sustainable Land Management in Agro-pastoral Production Systems of Kenya Project
(SLM) is a 5 year (2010-2015) Project financed by Global Environmental Facility (GEF), supported by
United Nations Development Programme (UNDP-Kenya) and Government of Kenya (GoK) through State
Department of Livestock, Ministry of Agriculture, Livestock and Fisheries, . The project is financed under
the Land Degradation Focal Area of GEF – hence part of Kenya’s implementation of the UNCCD program
of work and is also part of the regional Strategic Investment Plan of TerrAfrica.
The overall goal of the project is to promote economic development, food security and sustainable land use
practices while restoring ecological integrity of the ASALs. The main objective of the project is to provide
land users and managers with enabling policy and institutional capacity for effective adoption of sustainable
land management (SLM). This will be realized by enhancing the ability of the local communities to mitigate
impacts of climate changes by adopting appropriate technologies that promote socio-economic resilience.
The envisaged outcomes of the project are:
a) Knowledge-based land use planning forms the basis for improving drylands sustainable economic
development
b) Viability of agro-pastoral production system increased through diversification and access to
finances for SLM
c) Mainstreaming SLM policies into cross-sectoral national and local level decision making processes
and support implementation
d) Lessons learnt used to upscale SLM in other ASAL districts.
The project uses two pronged approaches in achieving its goal. At national level, it supports review of
policies related to Sustainable Land Management and mainstreaming of SLM in national planning
processes. It also supports civil societies in mobilization of communities to champion land use policies that
support SLM. At local level, the project activities are implemented in four pilot districts of Mbeere North,
Kyuso, Narok North and Dadaab. The lessons learnt from these pilot districts will be used to upscale in
other ASAL areas.

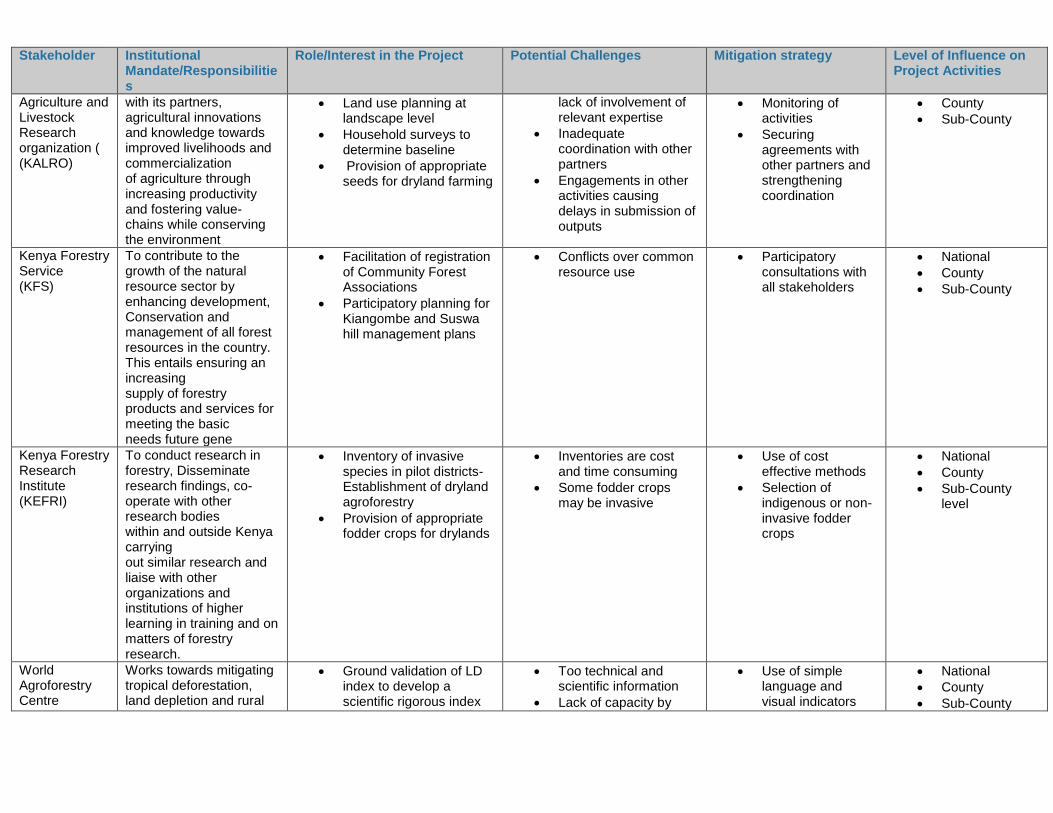
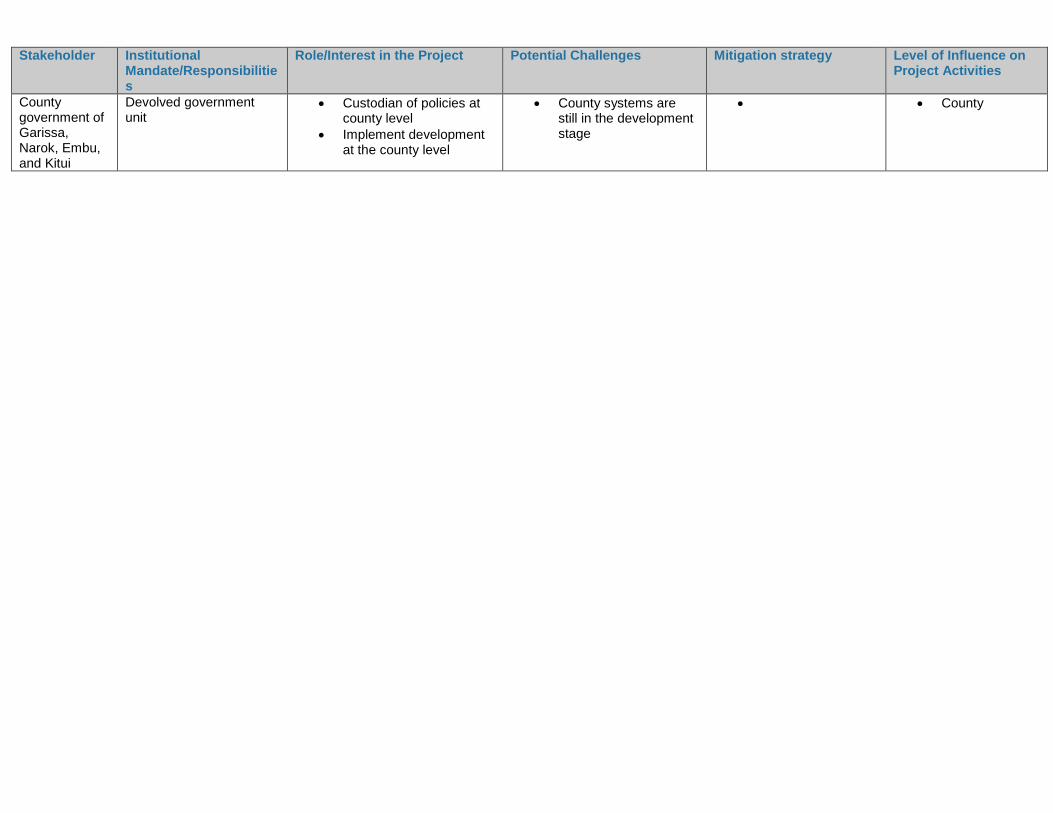
1.2 Sphere of Influence Mapping: Key Stakeholders, their Mandates, Responsibilities, Interest,
Potential Challenges and Mitigation Strategies
Stakeholder Institutional
Mandate/Responsibilities
Role/Interest in the Project Potential Challenges Mitigation strategy Level of Influence on Project Activities
State Department of Agriculture
To promote sustainable and competitive agriculture through creation of an enabling environment and provision of support services, to enhance food security, incomes and employment opportunities
Establishment of Agro pastoral FFS Facilitation / training in:
soil and water conservation
water harvesting
crop husbandry
promotion of emerging crops
income generating activities
value addition
market information
Inadequate extension staff
Staff transfers
Multiple projects in the district requiring same staffs
Lack of motivation among extension staff
Strengthening the linkages
between district and HQ levels
Strengthening the district
Coordination units
Motivate facilitators
Through training and recognition awards
National
County
Sub-County level
State Department of Livestock
To create a favourable legal framework for the sustainable development of the livestock industry; and to provide support services that increase productivity, value addition and market access for the sub- sector products
Technical training and support in;
animal husbandry
livestock upgrading
pasture and fodder establishment
disease control
emerging livestock
value addition
beekeeping
market information
Inadequate field extension officers
Staff transfers
Multiple projects in the district requiring the same staffs
Inadequate motivation among extension staff
Lobbying for recruitment of staff
Strengthening the linkage with ministry headquarters
Strengthening district coordination unit
Motivation of facilitators
through training and recognition awards
National
County
Sub-County level
Ministry of Environment
Protecting, conserving and managing the environment and natural resources through
Coordinating TerrAfrica Strategic Investment Framework for sustainable land management (SLM) in
Inadequate baseline data on SLM initiatives
Inadequate linkage to grassroot initiatives and
Inventory of SLM projects and programmes in the country
National

Stakeholder Institutional Mandate/Responsibilities
Role/Interest in the Project Potential Challenges Mitigation strategy Level of Influence on Project Activities
sustainable exploitation for the social- economic development, aimed at eradicating poverty, improving living standards and ensuring that a clean environment is sustained now and in the future.
Kenya (KSIF) representation of local communities
Overlap/duplication of activities with other national frameworks
Nominating local communities to national committees Harmonizing roles with other national frameworks e.g. National Environmental Council
National Drought management Authority (NDMA)
To enhance food security and reduce livelihood vulnerability in drought-prone and marginalized communities in 28 ASAL districts
Support SLM implementation
water harvesting
reseeding
Provide early warning system
Support value addition initiatives
Donor funded
Relief dependence may stifle local food security initiatives
Recurrent droughts
Sustainable financing from central government
More investment for long term food security solutions
Factoring drought management in all projects
National
County
Sub-County level
Agriculture Sector Development Support Programme (ASDSP)
To promote the socio-economic development of the agricultural sector (in its broadest sense including livestock, forestry and processing activities based on agricultural raw materials); while at the same time contribute towards the national priority of poverty alleviation.
Linkage with Agro-pastoral FFS in the pilot districts
Sharing of same facilitators and other resources
Sharing experiences
Inadequacy of coordination
Overlapping and duplication of projects
Farmers fatigue with different programmes
Strengthening linkages with NALEP vertically and horizontally
County
Sub-County level
Department of Resource Surveys and Remote Sensing (DRSRS)
To collect data on natural resources for use by other government agencies and institutions for their use in conservation and management
Spatial analysis of landscape units
Linkage with INRA Project
Inadequate coordination with other partners
Engagements in many other activities
Securing agreements with other partners and strengthening coordination
National
County
Kenya To contribute, together Soil analysis Sectoral approach and Detailed ToRs National
Stakeholder Institutional Mandate/Responsibilities
Role/Interest in the Project Potential Challenges Mitigation strategy Level of Influence on Project Activities
Agriculture and Livestock Research organization ( (KALRO)
with its partners, agricultural innovations and knowledge towards improved livelihoods and commercialization of agriculture through increasing productivity and fostering value- chains while conserving the environment
Land use planning at landscape level
Household surveys to determine baseline
Provision of appropriate seeds for dryland farming
lack of involvement of relevant expertise
Inadequate coordination with other partners
Engagements in other activities causing delays in submission of outputs
Monitoring of activities
Securing agreements with other partners and strengthening coordination
County
Sub-County
Kenya Forestry Service (KFS)
To contribute to the growth of the natural resource sector by enhancing development, Conservation and management of all forest resources in the country. This entails ensuring an increasing supply of forestry products and services for meeting the basic needs future gene
Facilitation of registration of Community Forest Associations
Participatory planning for Kiangombe and Suswa hill management plans
Conflicts over common resource use
Participatory consultations with all stakeholders
National
County
Sub-County
Kenya Forestry Research Institute (KEFRI)
To conduct research in forestry, Disseminate research findings, co-operate with other research bodies within and outside Kenya carrying out similar research and liaise with other organizations and institutions of higher learning in training and on matters of forestry research.
Inventory of invasive species in pilot districts- Establishment of dryland agroforestry
Provision of appropriate fodder crops for drylands
Inventories are cost and time consuming
Some fodder crops may be invasive
Use of cost effective methods
Selection of indigenous or non-invasive fodder crops
National
County
Sub-County level
World Agroforestry Centre
Works towards mitigating tropical deforestation, land depletion and rural
Ground validation of LD index to develop a scientific rigorous index
Too technical and scientific information
Lack of capacity by
Use of simple language and visual indicators
National
County
Sub-County

Stakeholder Institutional Mandate/Responsibilities
Role/Interest in the Project Potential Challenges Mitigation strategy Level of Influence on Project Activities
(ICRAF) poverty through improved agroforestry systems. Its goal is to initiate and assist in the generation and dissemination of appropriate agroforestry technologies for resource-poor farmers and other land users
of LD that would allow regional and global evaluation of LD
Land Health Surveillance: Evidence based diagnosis on agricultural and environmental problems.
Use of SENTINEL monitoring sites.
M&E framework
facilitators to interpret data
that the Agropastoralists and field staffs can understand
level
African Highlands Initiative (AHI/ICRAF)
To develop innovative methods and approaches for participatory "integrated natural resource management" (INRM) through their development and testing in pilot sites, cross-site synthesis and regional dissemination and institutionalization
Support for development of institutional processes for sustaining SLM on the ground
Define key technical entry points and combine FFS and Landcare approaches based on SLM best practices
Develop methods for scaling up from plot to landscape, from private to communal land and from household to community
Conflicts over management of common landscape resources
Disagreements among institutions
Participatory planning
Defining roles of all stakeholders
National
County
Sub-County level
Improved Management of Agricultural Water in Eastern and Southern Africa (IMAWESA)
To enable poor producers in Eastern, Central and Southern Africa increase their incomes through improved management of agricultural water
Enhance the capacity of beneficiaries in rainwater harvesting (RWH)
Advocate and mobilize local & national resources for water harvesting in communities beyond the FFS level
Policy advocacy and support for agropastoralists, at local, district and national levels, including regional
Expensive equipment for water harvesting
Siltation of water reservoirs
Selecting cost effective water harvesting techniques
Integrating water harvesting with soil conservation
National
County
Sub-County level

Stakeholder Institutional Mandate/Responsibilities
Role/Interest in the Project Potential Challenges Mitigation strategy Level of Influence on Project Activities
level
International Livestock Research Institute (ILRI)
To work at the crossroads of livestock and poverty, bringing high-quality science and capacity-building to bear on poverty reduction and sustainable development for poor livestock keepers and their communities
A synthesis of climate change impacts on grazing and livelihoods in FFS sites with details for each catchment basin, habitat structure and landscape ecology
Guidelines for adaptation Strategies for Agropastoralists to cope with climate change.
Lack of data to support climate change scenarios
Need to understand the impact of land degradation and climate variation which at times is interpreted as climate change
National
County
Sub-County level
FAO- Rural Knowledge Networks / SARD- Livestock Market Access Initiative (MACS)
To initiate a people-centered knowledge management process that is built on an understanding of farmer needs, shapes the existing technical information to respond to farmer’s requirements and delivers the knowledge in a form they can understand
Development and support of market access companies in project sites
Commodity trading scaling up of best practices
Brokers may frustrate the initiative
Corrupt dealings and cheating of farmers
Securing legal contracts
Monitoring all transactions for accountability and transparency
National
County
Sub-County level
Agro-pastoral Farmer Field Schools
Key learning Mechanism of the project
Community mobilization
Piloting through experiential learning and practice
Linking FFS to their livelihoods
Participatory monitoring of project activities
Scaling up Agro pastoral FFS across the selected landscape
Too high expectations
Community conflicts over resources and leadership
Agro-pastoralist fatigue over too many projects
Sustainability of pilot activities
Definition of project scope
Participatory planning and implementation Conflict resolution
Mobilization of resources from various donors
Sustainability strategy
Sub-County level
National Environment Management Authority
Environment regulatory authority
Advocacy for environmental projects
Wide coverage in the country
National and global
Stakeholder Institutional Mandate/Responsibilities
Role/Interest in the Project Potential Challenges Mitigation strategy Level of Influence on Project Activities
County government of Garissa, Narok, Embu, and Kitui
Devolved government unit
Custodian of policies at county level
Implement development at the county level
County systems are still in the development stage
County
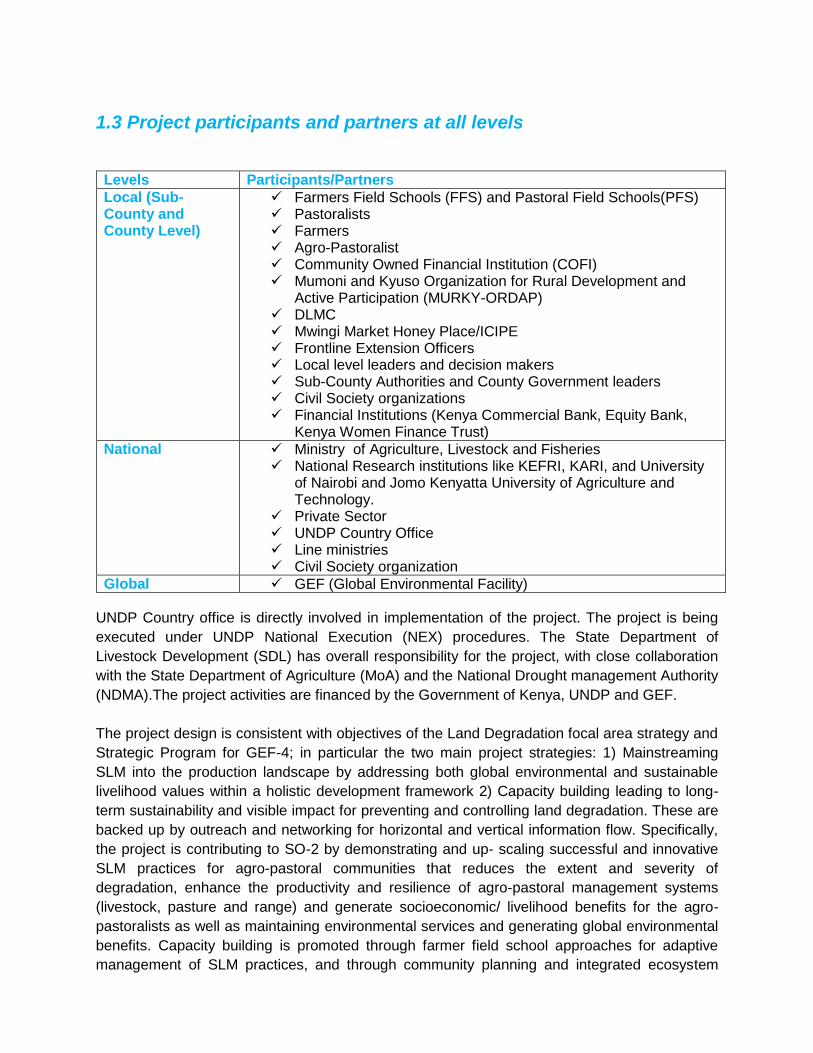
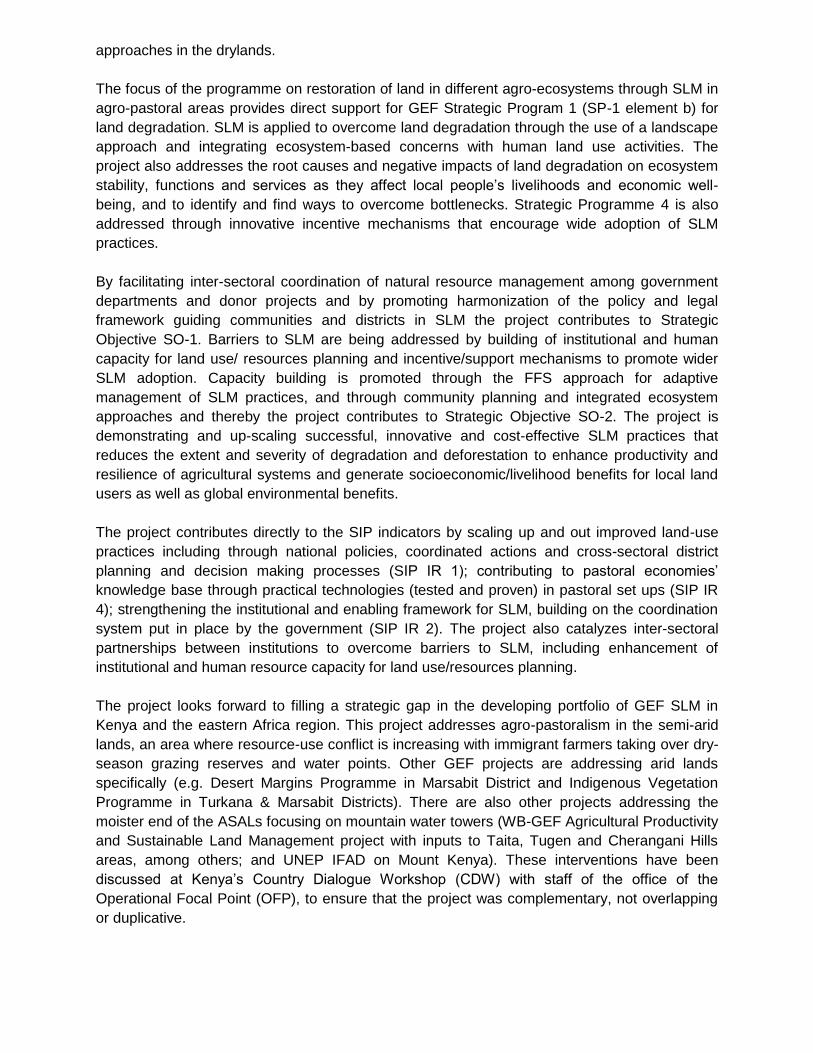
1.3 Project participants and partners at all levels
Levels Participants/Partners
Local (Sub-County and County Level)
Farmers Field Schools (FFS) and Pastoral Field Schools(PFS) Pastoralists Farmers Agro-Pastoralist Community Owned Financial Institution (COFI) Mumoni and Kyuso Organization for Rural Development and
Active Participation (MURKY-ORDAP) DLMC Mwingi Market Honey Place/ICIPE Frontline Extension Officers Local level leaders and decision makers Sub-County Authorities and County Government leaders Civil Society organizations Financial Institutions (Kenya Commercial Bank, Equity Bank,
Kenya Women Finance Trust)
National Ministry of Agriculture, Livestock and Fisheries National Research institutions like KEFRI, KARI, and University
of Nairobi and Jomo Kenyatta University of Agriculture and Technology.
Private Sector UNDP Country Office Line ministries Civil Society organization
Global GEF (Global Environmental Facility)
UNDP Country office is directly involved in implementation of the project. The project is being
executed under UNDP National Execution (NEX) procedures. The State Department of
Livestock Development (SDL) has overall responsibility for the project, with close collaboration
with the State Department of Agriculture (MoA) and the National Drought management Authority
(NDMA).The project activities are financed by the Government of Kenya, UNDP and GEF.
The project design is consistent with objectives of the Land Degradation focal area strategy and
Strategic Program for GEF-4; in particular the two main project strategies: 1) Mainstreaming
SLM into the production landscape by addressing both global environmental and sustainable
livelihood values within a holistic development framework 2) Capacity building leading to long-
term sustainability and visible impact for preventing and controlling land degradation. These are
backed up by outreach and networking for horizontal and vertical information flow. Specifically,
the project is contributing to SO-2 by demonstrating and up- scaling successful and innovative
SLM practices for agro-pastoral communities that reduces the extent and severity of
degradation, enhance the productivity and resilience of agro-pastoral management systems
(livestock, pasture and range) and generate socioeconomic/ livelihood benefits for the agro-
pastoralists as well as maintaining environmental services and generating global environmental
benefits. Capacity building is promoted through farmer field school approaches for adaptive
management of SLM practices, and through community planning and integrated ecosystem
approaches in the drylands.
The focus of the programme on restoration of land in different agro-ecosystems through SLM in
agro-pastoral areas provides direct support for GEF Strategic Program 1 (SP-1 element b) for
land degradation. SLM is applied to overcome land degradation through the use of a landscape
approach and integrating ecosystem-based concerns with human land use activities. The
project also addresses the root causes and negative impacts of land degradation on ecosystem
stability, functions and services as they affect local people’s livelihoods and economic well-
being, and to identify and find ways to overcome bottlenecks. Strategic Programme 4 is also
addressed through innovative incentive mechanisms that encourage wide adoption of SLM
practices.
By facilitating inter-sectoral coordination of natural resource management among government
departments and donor projects and by promoting harmonization of the policy and legal
framework guiding communities and districts in SLM the project contributes to Strategic
Objective SO-1. Barriers to SLM are being addressed by building of institutional and human
capacity for land use/ resources planning and incentive/support mechanisms to promote wider
SLM adoption. Capacity building is promoted through the FFS approach for adaptive
management of SLM practices, and through community planning and integrated ecosystem
approaches and thereby the project contributes to Strategic Objective SO-2. The project is
demonstrating and up-scaling successful, innovative and cost-effective SLM practices that
reduces the extent and severity of degradation and deforestation to enhance productivity and
resilience of agricultural systems and generate socioeconomic/livelihood benefits for local land
users as well as global environmental benefits.
The project contributes directly to the SIP indicators by scaling up and out improved land-use
practices including through national policies, coordinated actions and cross-sectoral district
planning and decision making processes (SIP IR 1); contributing to pastoral economies’
knowledge base through practical technologies (tested and proven) in pastoral set ups (SIP IR
4); strengthening the institutional and enabling framework for SLM, building on the coordination
system put in place by the government (SIP IR 2). The project also catalyzes inter-sectoral
partnerships between institutions to overcome barriers to SLM, including enhancement of
institutional and human resource capacity for land use/resources planning.
The project looks forward to filling a strategic gap in the developing portfolio of GEF SLM in
Kenya and the eastern Africa region. This project addresses agro-pastoralism in the semi-arid
lands, an area where resource-use conflict is increasing with immigrant farmers taking over dry-
season grazing reserves and water points. Other GEF projects are addressing arid lands
specifically (e.g. Desert Margins Programme in Marsabit District and Indigenous Vegetation
Programme in Turkana & Marsabit Districts). There are also other projects addressing the
moister end of the ASALs focusing on mountain water towers (WB-GEF Agricultural Productivity
and Sustainable Land Management project with inputs to Taita, Tugen and Cherangani Hills
areas, among others; and UNEP IFAD on Mount Kenya). These interventions have been
discussed at Kenya’s Country Dialogue Workshop (CDW) with staff of the office of the
Operational Focal Point (OFP), to ensure that the project was complementary, not overlapping
or duplicative.
2.0 PURPOSE OF M&E PLAN
The monitoring and evaluation plan for the SLM project will serve two functions: first, periodic
assessment of project implementation progress and performance of activities (M&E of Project
Performance-efficiency of resource application), and second, evaluation of their results in terms
of relevance, effectiveness and impact in promoting the adoption of sustainable land and agro-
ecosystem management (SLM) (M&E of Project Impact). The M&E system of the project will
provide answers on the progress and impact made by UNDP, Government line departments
and their partners in achieving the project’s outputs and outcomes. Project Performance: Performance evaluation will assess the project’s success in achieving
the outputs with the inputs provided and activities conducted. The project will be monitored
closely by UNDP Energy Environment and Climate Change Unit, Planning, Monitoring and
Evaluation Division of the State Department of Livestock, Ministry of Agriculture, Livestock and
Fisheries, the Project Steering Committee and the Project Technical Committee through
Monthly expenditure reports, Quarterly progress reports, and Annual progress reports.
Moreover, regular technical supervision missions and Back to Office Reports will be provided as
required to enhance success, and serve well as guidance notes and feedbacks on reports.
Project Impact: Evaluation of the project’s success in achieving its outcomes will be monitored
continuously throughout the project. The key indicators found in the logical framework, and in
the revised M&E matrix will guide the evaluation of the project results and impacts. To do so,
reliable baseline data was collected at start of the project activities, and impact data will be
collected when appropriate during the project implementation. The diagrams 1, 2 and 3 below
illustrates the monitoring and evaluation continuum of the project

Monitoring Project Performance
(Assess how are inputs are used to produce outputs)
Outputs
Activities
Impact
Outcomes
Outputs
Monitoring Project Impact
(Assess whether outputs produce the expected results)
Diagram 1: M&E of project performance and project impact Both project performance and impact M&E will contribute to improve decision making and
management, by keeping the project on track towards achieving the outcomes and environmental
and development objectives and by integrating lessons learnt into planning. Project achievements was evaluated at mid-term and the same will be done at the end of the
project through an independent final evaluation.
Monitor Monitor
Evaluate Act Evaluate Act
Plan Diagram 2: M&E as part of project management and planning
3.0. M&E OF PROJECT PERFORMANCE
The M&E of project performance focuses on the record of information related to the project
implementation process (inputs), activities and outputs. A minimum data collection is required
to enable the project management and stakeholders:
i. To track at regular time intervals the activities achieved (compare planned/versus achieved) and assess effects of both external factors and internal project operations;
ii. To assess results (outputs), lessons learnt, and solutions to keep project on track.
3.1 PROJECT IMPLEMENTATION APPROACH
The challenge in the ASALs in Kenya and the rest of SSA is to develop an innovative approach
to sustainable land management (SLM) at the landscape level where resource conservation
and land rehabilitation can be combined with improved livelihoods and income generation for
local communities and farmers/herders.
Selected districts represent a variety of agropastoral contexts so it is envisaged that many
lessons will be learned for scaling up within Kenya and more widely in agro-pastoral and
pastoral systems for example through the World Initiative for Sustainable Pastoralism. Land
uses historically in Narok and Garissa have mainly been pastoralism and herding, with recent
trends towards privatization of land and increase in crop production, while Mbeere North and
Kyuso are based on mixed agropastoral systems but increasingly inhabited by farming
communities with small numbers of livestock.
The GEF project will implement targeted incremental activities to strengthen SLM and assist in
identifying and removing policy, financial and capacity barriers currently impeding SLM and
sustainable agriculture in ASALs. It will therefore mainstream SLM by strengthening
institutional and community capacities at district and local levels; ensuring policies support
SLM and improving the local level access to alternative income generating activities. Innovative
ideas will be taken up by cross-sectoral District and National Planning and decision-making
processes which will ultimately influence policy change on SLM in agropastoral areas. The
project will operate under significant government co-finance by ongoing programmes, in
particular the Arid Lands Resource Management Project (ALRMP) and National Agriculture
and Livestock Extension Programme (NALEP) while the districts will provide office space and
technical and logistical support for project implementation.
The project will focus on four district: Dadaab (Garissa County); Mbeere North (Embu County)
Kyuso (Kitui County); and Narok North (Narok County); which have been regarded as sites of
land degradation severe enough to cause significant reduction in productivity and
crop/livestock yields. The extent of intervention (expected to exceed over 70,000 ha directly in
the project lifetime) and anticipated improvement in agricultural yields, will lead to sustainable
land management on a scale that reduces poverty and increases food security. This will free
up disaster resources, allowing for replication of interventions.
Lessons learned and experiences from SLM will be captured in different ways. The project will
invest into a large M& E component linked to and co-financed by ICRAF’s partnerships with the
Gates Foundation (Africa Soils Initiative). In this respect, it will develop Sentinel Soil sites at
three landscapes with detailed soil and vegetative cover (biodiversity surrogates) monitoring,
related to changing land uses. This work will be done in partnership with KARI (Kenya
Agricultural Research Institute), which will ensure continuity and upscaling.
3.2 INDICATORS
Indicators provide parameters against which to assess project performance and achievement
in terms of quantity (how many/how much?), time (when?), target group (who?) and quality
(how good?). Indicators can be quantitative, (number of people, number of ha, % of adoption),
semi-quantitative (scale, ranking), or qualitative (perceptions, opinions, categories).
The table of objectively verifiable indicators (OVI) at sub county and country levels is in Annex 1
3.3 DATA COLLECTION
The established monitoring and evaluation systems for the project are multilayered at different
levels using a variety of tools and funding mechanisms. At pilot project sites a monitoring and
evaluation officer has been designated who collates back to office reports submitted by
executing officers. The FFS and PFS executives committees monitor and evaluate members
and SLM activities and achievements that are subsequently deposited with the DLPOs office.
The PMU monitors the DMTs through quarterly progress reports and field visits. The Project
board monitors the PMU through meetings and reports. The UNDP Country Office monitors
and evaluates the PMU through reports, meetings and undertakes field visits to the project
sites.
The local level M&E focal points who should be in charge of collecting and providing
information on project activities and implementation to the SLM project Coordinator at the sub
county level are the Sub county M & E Officers, sector leads at the sub county levels, local
extension officers, and FFS facilitators at the divisional level. These resource people can use
the proposed project recording forms (in the M&E tools folder) and if necessary can be trained
in data collection and participatory M&E. Furthermore, the PMU shall synthesize the
information for the project area (all selected catchments, communities and sub-counties) and
similarly shall compile it for reporting to the UNDP country office on quarterly and annual basis.

The M&E tools provided with this plan are composed of a set of forms to collect and compile the information at each level:
Community M&E form for the local extension officers and FFS/PFS facilitators
Sub County level M&E form for the SLM project Coordinators at the Sub counties
National level M&E form for the PMU, and excel table for quantity data tracking
The templates are a way of standardizing the way data is recorded and stored, aggregating data, and informing project management about progress.
M&E Stakeholders and Responsibilities
Stakeholders M&E Responsibilities
UNDP Country Office Review the progress and result reports and propose adjustments. Send progress reports and budget to GEF
State Department of Livestock, Planning, Monitoring and Evaluation Division
Review the progress and result reports from PMU and makes sure they are line with the government development policies
PMU (Project Management Unit)
Prepare the progress report (Quarterly and annual) Submit workplan and budget on time Share minutes meetings of Project Technical Committee
M&E consultant (when needed)
Review/update the M&E plan, develop the M&E forms Provide support in participatory M&E and for the design of impact assessments
DMTs Prepare Quarterly work plan and targets Prepare the progress report and send it to PMU Share minutes meetings of DMT Provide information to PMU on activities carried out, problems encountered, e.t.c at the catchment/community level
Frontline Extension officer, DLPOs office.
Provide information to Sub county SLM Coordinator and Sub-County M & E Officers on activities carried out, problems encountered, e.t.c at catchment/community level
FFS and PFS executive committees
Provide information to sector lead extension officers and M & E focal person on activities carried out, problems encountered, e.t.c at FFS/PFS level.

4.0 REPORTING
Project monitoring and evaluation will be conducted in accordance with established UNDP and
GEF procedures and will be provided by the project team and the UNDP Country Office (UNDP
CO) with support from UNDP/GEF. The Logical Framework Matrix in Annex 2 provides
indicators for project implementation, cross referenced to the SIP Results Framework as
currently designed, along with their corresponding means of verification. These will form the
basis on which the project's Monitoring and Evaluation system will be built.
Project start: A Project Inception Workshop was held within the first 2 months of project start
with those assigned roles in the project organization structure, UNDP country office and
regional technical policy and programme advisors as well as other stakeholders. The Inception
Workshop was crucial to building ownership for the project results and to planning the first year
annual work plan. It addressed a number of key issues including: assist all partners to fully
understand and take ownership of the project; detail the roles, support services and
complementary responsibilities of UNDP CO and Regional Coordination Unit (RCU) staff vis à
vis the project team; discussed the roles, functions, and responsibilities within the project's
decision-making structures, including reporting and communication lines, and conflict
resolution mechanisms; shared the terms of reference for project staff as needed.
The inception workshop provided a venue for finalizing the first annual work plan as well as
reviewing and agreeing on the indicators, targets and their means of verification, and
rechecking assumptions and risks; it provided a detailed overview of reporting, monitoring and
evaluation (M&E) requirements; it also confirmed the monitoring and evaluation work plan and
budgets and schedules; discussed financial reporting procedures and obligations, and
arrangements for annual audit; planning and scheduling Project Board meetings; clarifying
roles and responsibilities of all project organization structures; and holding the first Project
Board meeting.
Monthly Expenditure reports: Expenditure reports are generated monthly by the respective
SLM coordinators to track expenditure according to planned activities monthly and submitted to
PMU.
Quarterly: Project Progress will be monitored quarterly using the UNDP Enhanced Results
Based Management Platform. The risks identified at project design will be entered into ATLAS
and monitored quarterly. The risks related to markets, micro-finance and conflicts are all rated
critical under the Enhanced Results Based Management Platform on the basis of their
innovative nature (high impact and uncertainty due to no previous experience justifies
classification as critical), and the high incidents of conflicts in the ASALs. These will therefore
be monitored very carefully and information used to adapt project management.
Quarterly Project Progress Reports (PPR) will be generated in the Executive Snapshot,
using the information recorded in Atlas. Other ATLAS logs will be used to monitor issues,
lessons learned etc. The use of these functions is a key indicator in the UNDP Executive
Balanced Scorecard.
Annually: Annual Project Progress will be monitored and captured through the Annual Project
Review/Project Implementation Reports (APR/PIR). This key report comprehensively combines
both UNDP and GEF reporting requirements and includes, but is not limited to, reporting on:
progress made toward project objective and project outcomes - each with indicators, baseline
data and end-of-project targets (cumulative); project outputs delivered per project outcome
(annual); lesson learned/good practice; AWP and other expenditure reports; risk and adaptive
management; and, ATLAS QPR. Portfolio level indicators (i.e. GEF focal area tracking tools)
are used by most focal areas on an annual basis as well.
Periodic Monitoring through site visits: UNDP CO and the UNDP RCU will conduct visits to
project sites based on the agreed schedule in the project's Inception Report/Annual Work Plan
to assess first hand project progress. Other members of the Project Board may also join these
visits. A Field Visit Report/BTOR will be prepared by the CO and UNDP RCU and will be
circulated no less than one month after the visit to the project team and Project Board
members.
Mid-term of project cycle: The project has undergone an independent Mid-Term Evaluation
at the mid-point of project implementation, in August 2014. The Mid-Term Evaluation
determined progress being made towards the achievement of outcomes and identified course
correction that are needed including reviewing of the indicators and having a structured
Monitoring and Evaluation plan for the project. It focused on the effectiveness, efficiency and
timeliness of project implementation; highlighted issues requiring decisions and actions; and
presented initial lessons learned about project design, implementation and management.
Findings of this review will be incorporated as recommendations for enhanced implementation
during the final half of the project’s term.
End of Project: An independent Final Evaluation will take place three months prior to the final
Project Board meeting and will be undertaken in accordance with UNDP and GEF guidance.
The final evaluation will focus on the delivery of the project’s results as initially planned (and as
corrected after the mid-term evaluation, if any such correction took place). The final evaluation
will look at impact and sustainability of results, including the contribution to capacity
development and the achievement of global environmental benefits/goals. The Terms of
Reference for this evaluation will be prepared by the UNDP CO based on guidance from the
Regional Coordinating Unit and UNDP-GEF. The Terminal Evaluation will also provide
recommendations for follow-up activities and will be accompanied by a management response
which will be uploaded to PIMS and to the UNDP Evaluation Office Evaluation Resource
Center (ERC). The relevant GEF Focal Area Tracking Tools will also be completed during the
final evaluation.
During the last three months, the project team will prepare the Project Terminal Report. This
comprehensive report will summarize the results achieved (objectives, outcomes, outputs),
lessons learned, problems met and areas where results may not have been achieved. It will
also lay out recommendations for any further steps that may need to be taken to ensure
sustainability and replicability of the project’s results.
Learning and knowledge sharing: Results from the project will be disseminated within and
beyond the project intervention zone through existing information sharing networks and forums.
The project will therefore identify and participate, as relevant and appropriate, in scientific,
policy-based and/or any other networks, which may be of benefit to project implementation
though lessons learned. The project will also identify, analyze, and share lessons learned that
might be beneficial in the design and implementation of similar future projects. Finally, there
will be a two-way flow of information between this project and other projects of a similar focus.
Currently, the project publishes a quarterly newsletter named SLM focus that shares success
stories, and best practices.
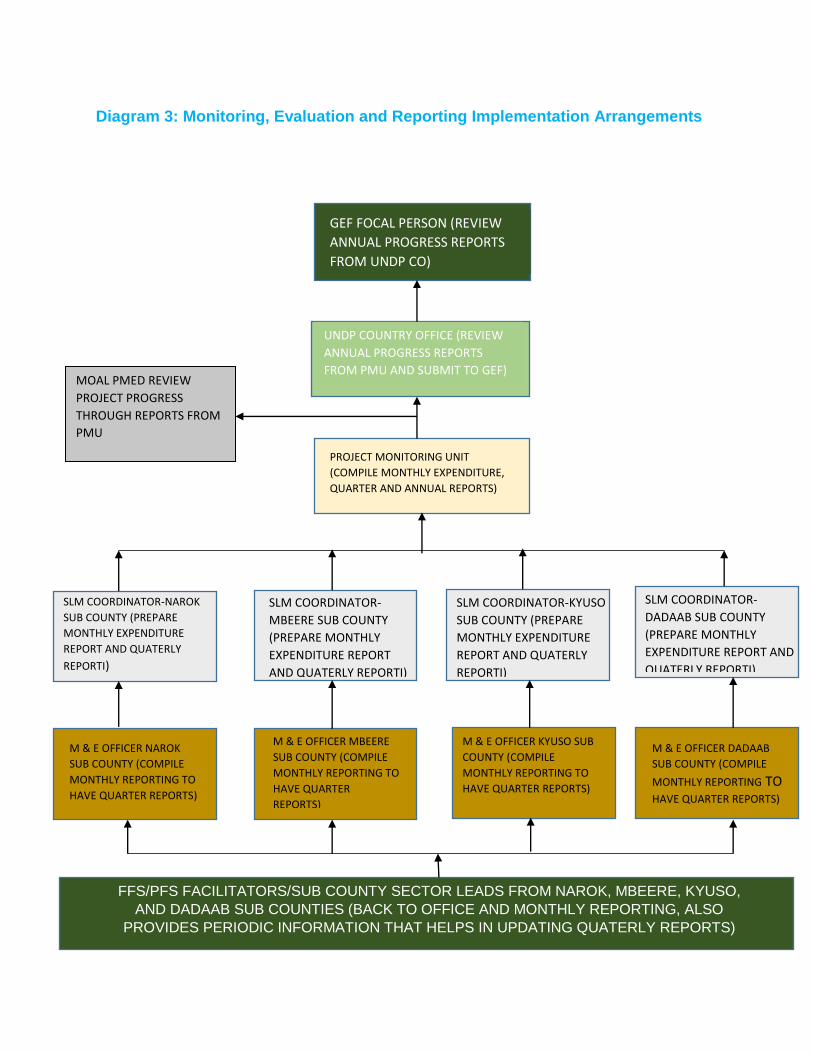
Diagram 3: Monitoring, Evaluation and Reporting Implementation Arrangements
GEF FOCAL PERSON (REVIEW
ANNUAL PROGRESS REPORTS
FROM UNDP CO)
UNDP COUNTRY OFFICE (REVIEW
ANNUAL PROGRESS REPORTS
FROM PMU AND SUBMIT TO GEF)
PROJECT MONITORING UNIT
(COMPILE MONTHLY EXPENDITURE,
QUARTER AND ANNUAL REPORTS)
SLM COORDINATOR-NAROK
SUB COUNTY (PREPARE
MONTHLY EXPENDITURE
REPORT AND QUATERLY
REPORTI)
SLM COORDINATOR-
MBEERE SUB COUNTY
(PREPARE MONTHLY
EXPENDITURE REPORT
AND QUATERLY REPORTI)
SLM COORDINATOR-KYUSO
SUB COUNTY (PREPARE
MONTHLY EXPENDITURE
REPORT AND QUATERLY
REPORTI)
SLM COORDINATOR-
DADAAB SUB COUNTY
(PREPARE MONTHLY
EXPENDITURE REPORT AND
QUATERLY REPORTI)
M & E OFFICER NAROK
SUB COUNTY (COMPILE
MONTHLY REPORTING TO
HAVE QUARTER REPORTS)
M & E OFFICER MBEERE
SUB COUNTY (COMPILE
MONTHLY REPORTING TO
HAVE QUARTER
REPORTS)
M & E OFFICER KYUSO SUB
COUNTY (COMPILE
MONTHLY REPORTING TO
HAVE QUARTER REPORTS)
M & E OFFICER DADAAB
SUB COUNTY (COMPILE
MONTHLY REPORTING TO HAVE QUARTER REPORTS)
FFS/PFS FACILITATORS/SUB COUNTY SECTOR LEADS FROM NAROK, MBEERE, KYUSO,
AND DADAAB SUB COUNTIES (BACK TO OFFICE AND MONTHLY REPORTING, ALSO
PROVIDES PERIODIC INFORMATION THAT HELPS IN UPDATING QUATERLY REPORTS)
MOAL PMED REVIEW
PROJECT PROGRESS
THROUGH REPORTS FROM
PMU

5.0. M&E OF PROJECT IMPACT
The Project Logical Framework (in the project document) provides performance and impact
indicators for guiding project implementation. Through a process of working with the Project
Management Unit, and project implementers at the sub county levels and these indicators have
been reviewed and revised and their means of verification (assessment methods) specified to
complete the M&E matrix. The resulting M&E matrix is in Annex 2.
5.1 BASELINE DATA AND METHODS
Baseline information such as baseline problem tree/situational analysis, characterization and
evaluation of land management practices and their implication was collected in Narok North,
Kyuso, Mbeere North and Dadaab and PRA processes conducted in a range of agro-ecological
zones and contexts by an interdisciplinary team of experts with community representatives. An
inventory of pertinent studies on soil erosion, extent of burning, soil fertility, productivity, SLM
costs and impacts/benefits, etc. was gathered and reviewed to inform and complement the
baseline for this project.
5.2 IMPACT ASSESSMENT METHODS
Indicators of project impact will be applied at the national, sub county and catchment/community levels. Major areas identified for impact assessment include:
Status of land, natural resources and ecosystems, their conservation and capacity for production of goods and services;
Evidence of positive changes in the management and use of biodiversity and natural
resources ;
Improvement in achievement of environmental and livelihood goals – reversing land degradation, biodiversity conservation, carbon sequestration and enhancing crop and livestock productivity, reducing poverty, reducing food insecurity and vulnerability;
Strengthened capacities for integrated sustainable land and agro-ecosystem
management (SLM) at different levels
Policies reviewed and formulated at the national and sub county level to support SLM principles and activities
The assessment of project impact will be based on 4 specific and complementary activities (1) Stakeholder discussion groups and PRA at catchment/community levels around project
components and outputs. These will help to analyse information, identify lessons learnt, and make recommendations about project implementation, and to assess the changes brought up by the project;

Example: Case Studies, Focus group discussion with the project participants to assess the quality of services provided (information, expertise and institutional support) at the field level.
(2) Household and farm survey with randomly selected FFS members and non-members to
assess livelihoods, agricultural production, resilience and food security;
Example: Survey with farmers in FFS to identify their % of adoption and extent (ha) for each SLM practice, and benefits of SLM.
(3) Field survey to assess changes in environmental benefits (carbon, biodiversity, tree
density, pasture vegetation cover, water quality and quantity) from SLM interventions;
Example: Field monitoring protocol and land user survey on land degradation/improvement
through LD local indicators, such as : soil properties, soil erosion, soil carbon sampling,
vegetation cover and extent of burning, water resources conditions and availability, habitat
diversity, species/varietal diversity, pest & disease incidence, trends in land/livestock
productivity under different land use types and management practices (controlling for
yearly rainfall difference), livelihoods : income, food security and vulnerability.
(4) Thematic studies undertaken to provide further information on important issues Examples: SLM technologies and approaches, canopy cover on landscapes before/after SLM actions, and monitor how SLM practices/approaches contribute to Community action plans and County development action plans
The different impact assessments shall be done periodically to be included in quarterly reports.
Doing so, the results and recommendations of the impact assessment can feed on to the quarter
and annual reports, use to produce newsletters and bulleting’s on SLM project successes and
documented as knowledge and lessons learnt for project upscaling and dissemination.
5.3 SUSTAINABILITY INDICATORS
Through discussions at the field level, document reviews and discussions with PMU staff, a simple check list here in developed to help in assessing the project sustainability during implementation and at the end of the project:
National
Policies to support SLM principles and activities reviewed
Best practices and lessons learnt are mainstreamed in development processes, and used
in SLM project upscaling
SLM information and knowledge generated by the project is available
SLM practices and approaches are mainstreamed in County agriculture, rangeland and

natural resources action plans
Counties
SLM action plans are mainstreamed in County Integrated Development Plans, and district
funds are allocated
Partnership and collaboration continue at County level between different stakeholders
Catchment/Communities
SLM interventions are maintained by local communities and land owners
SLM technologies promoted are upscaled by land users and communities
Charcoal users associations formalized and registered and are using sustainable
charcoal production methods as well as paying levies to county government
FFS/PFS
FFS/PFS and cooperatives/associations/groups created/supported by the project have
opened bank accounts and are formerly registered
FFS and cooperatives/associations/groups remain active
FFS and cooperatives/associations/groups have diversified their activities and are
generating income

6.0. CONCLUSION AND RECOMMENDATIONS
The project M&E is based on the project document and indicators in the log-frame. It has two
main components: project performance, and project impact. Project performance requires the
monitoring of activities and outputs, and his closely related with project execution and planned
activities versus achieved (and budget). Project impact is assessed through the impact and
outcome indicators and through specific and timely assessments, including baseline studies. The
information at the project baseline serves as a basis for monitoring and eventually for impact
assessment at project mid-term and closure.
Some recommendations are as below:
i. M&E focal points established at the sub counties should be strengthened to be effective
in tracking and monitoring activities, especially at field level (catchment/community).
Templates for data collection are provided in annexes, and punctual support for planning
and assessment shall be provided by the PMU and if possible with the help of a
consultant. PMU shall integrate the lessons learnt into their planning, and document
these in their progress reports. Moreover, it is suggested that M&E training on data
collection and participatory impact monitoring shall later be organized to build capacities
of the M&E focal points in regard to M&E for all M & E focal point persons at the sub
county levels. This is suggested to be carried out by the officers from the PMED of State
Department of Livestock.
ii. Considering the project needs partners and co-funding, it would benefit from developing a
clear communication strategy. It is proposed that PMU and Government line ministries
should be proactive in providing information for preparation and dissemination of a
newsletter every three months to update partners on project activities (each newsletter
would have a theme e.g.: selection of the catchments, startup of field activities).
Moreover, the PMU shall be pro-active on proposing specific outputs on which to develop
partnership for SLM implementation and co-funding. It would be important to highlight the
linkages between SLM and climate change adaptation and mitigation, as this can also
generate further funding and partnerships.

ANNEX 1: STRATEGIC RESULTS FRAMEWORK/LOGICAL FRAMEWORK
The strategic results framework was reviewed and found adequate. Included in the result framework are reviewed indicators and indicator
definition in reference to the Mid-term review, desk research and analysis and discussions by field focal persons.
Results Objectively Verifiable Indicators (OVIs)
Indicator Definition Means of Verification (MOVs)- Sources of information/ data - Sources of information/ data
Risks and Assumptions
Project Goal : “Sustainable Land Management” provides the basis for economic development , food security and sustainable livelihoods while restoring the ecological integrity of the ASALs
Baseline surveys
Impact studies
Monitoring and evaluation reports
End of project evaluation report
Prolonged drought Increased encroachment by agriculture
Purpose; To provide land users and managers with financial incentives , enabling policy, institutional and capacity for effective adoption of SLM in four agro pastoral districts
50% of rangeland in the 4 pilot districts register improvement of range condition by end of project
Level of dependency on food aid in target landscape reduced by 30% by the end of project period
At least 25% of woodlands showing recovery as measured by regeneration and improvement in species index and canopy cover
Ha of Improved rangeland
% of households depending on food aid
Number of trees planted/Types of species introduced.
Baseline surveys
Impact studies
Monitoring and evaluation reports
Mid-term review report
Prolonged drought Increased encroachment by agriculture
Outcome 1: Knowledge based land use planning forms the basis for improving drylands sustainable economic development
25% of cultivators in pilot landscapes adopting 3-5 forms of improved practices by mid-term and 75 cumulatively by project end
At least 30% increase in soil fertility from baselines for land users consistently engaging in 3-5 improved
Numbers of farmers adopted improved practices
• Numbers of farmers
Sampling captured in the monitoring reports
Project training reports as part of M& E reports
Project M&E and technical
Prolonged drought Increased encroachment by agriculture
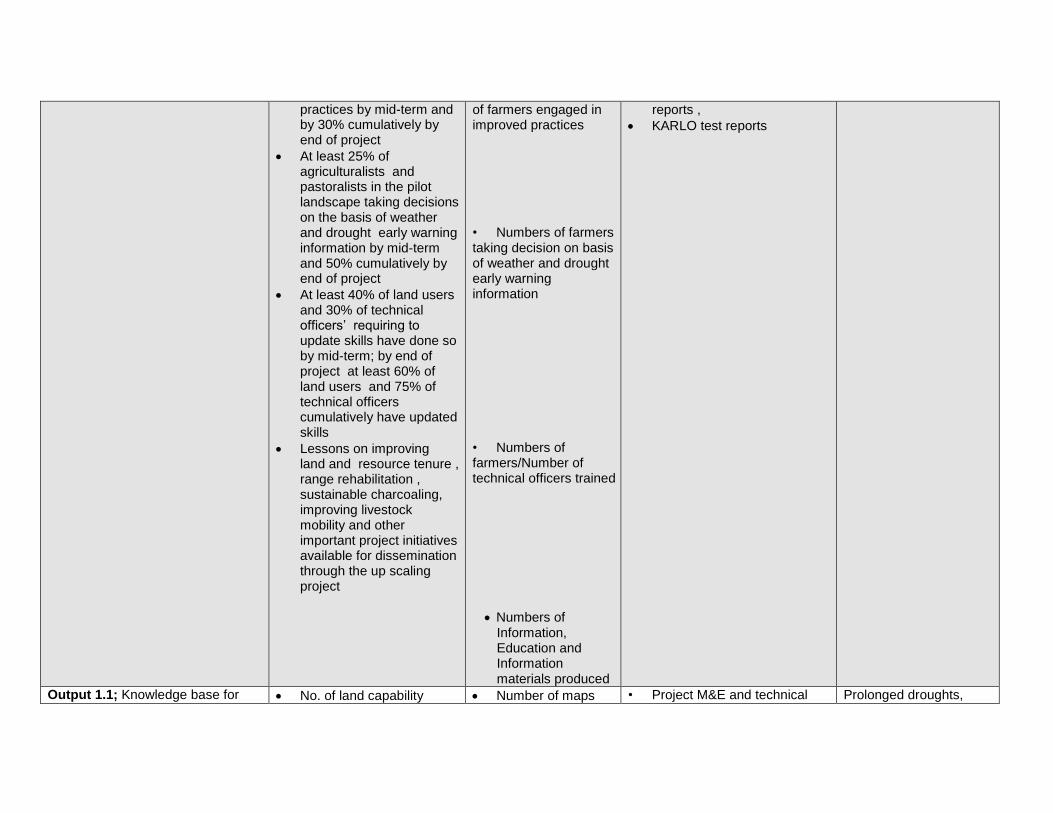
practices by mid-term and by 30% cumulatively by end of project
At least 25% of agriculturalists and pastoralists in the pilot landscape taking decisions on the basis of weather and drought early warning information by mid-term and 50% cumulatively by end of project
At least 40% of land users and 30% of technical officers’ requiring to update skills have done so by mid-term; by end of project at least 60% of land users and 75% of technical officers cumulatively have updated skills
Lessons on improving land and resource tenure , range rehabilitation , sustainable charcoaling, improving livestock mobility and other important project initiatives available for dissemination through the up scaling project
of farmers engaged in improved practices • Numbers of farmers taking decision on basis of weather and drought early warning information • Numbers of farmers/Number of technical officers trained
Numbers of Information, Education and Information materials produced
reports ,
KARLO test reports
Output 1.1; Knowledge base for No. of land capability Number of maps • Project M&E and technical Prolonged droughts,

landscape based land use planning in place
updated maps
Integrated land use plans for pilot landscapes
No. of collaborating institutions for training and research
No. of new FFS/PFS established
No. of stakeholders aware on SLM land use practices
Number of plans
Number of institutions
Number of FFS/PFS
Number of farmers
reports conflicts driven by political considerations and developments
Activity 1.1.1: Land capability assessment & use of result in land use decision making
No. and frequency of land capability assessment done
No. of land users using assessment results
Ha of land
Number of farmers
Monitoring and evaluation reports
Activity reports
Community willingness to participate
Sub-Activity 1.1.1.1: Updating land capability maps and land use plans using GIS
No. of land capability maps and land use plans updated using GIS
Number of plans Financial and procurement reports
Activity reports
Institutions partnerships developed
Sub-Activity 1.1.1.2: Determining current livestock land carrying capacity
Hectares of land whose current livestock land carrying capacity is known in pilot landscapes
Ha of land Monitoring and Evaluation reports
Community willingness to participate
Sub-Activity 1.1.1.3: Determining land potential for dry land cropping
Hectares of land whose cropping potential for dry land cropping is known in pilot landscapes
Ha of land Monitoring and Evaluation reports
Community willingness to participate
Activity 1.1.2: Developing guidelines for integrated land use planning
No. of stakeholders forum held
No. of stakeholder by categories consulted
Number of stakeholders
Financial and procurement reports
Community willingness to participate and resources available

No. of capacity needs assessment conducted
Sub-Activity 1.1.2.1: Stakeholders consultations on guidelines development
• No. of stakeholders forum held
Number of forums Monitoring and Evaluation reports
Stakeholders workshop reports
Pictures
Community willingness to participate and resources available
Sub-Activity 1.1.2.2: Conducting capacity needs assessment to design capacity building programmes for stakeholders
• No. of stakeholders forum held
Number of forums Monitoring and Evaluation reports
Assess reports/ back to office report
Community willingness to participate and resources available
Activity 1.1.3: capacity building on
integrated land use planning using developed guidelines
No. of people trained on integrated land use planning
Number of people Monitoring and Evaluation reports
Workshop reports
Pictures
Community willingness to participate and resources available
Sub-Activity 1.1.3.1: training of technical officers, land users , politicians and civil society
No. of people attending awareness forum on SLM guidelines by category
No. awareness forum created
Number of people
Number of forums
Monitoring and Evaluation reports
Training reports
Pictures
Community willingness to participate and resources available
Sub-Activity 1.1.3.2: updating extension packages and increasing dissemination and use of weather information
No. of extension packages updated
No. of land users using weather information and EWS from MET department
Number of extension packages
Number of farmers
Monitoring and Evaluation reports
Community willingness to participate and resources available
Activity 1.1.4: Collaboration with universities and research institutions colleges
No. of institutions by type collaborating for training and review of course curriculum
Number of institutions
Monitoring and Evaluation reports
MOU/MOA
Collaborators reports
Community willingness to participate and resources available
Sub-Activity 1.1.4.1: to reviewing curriculum for training courses in agriculture, forestry, and biological sciences
No. and types of courses whose curriculum is reviewed
Number of courses Monitoring and Evaluation reports
Workshop reports
Pictures
Institutions of Learning cooperative and participate in project activities.
Sub-Activity 1.1.4.2: Supporting training in research on SLM relevant courses
No. of technical officers and level of training supported
Number of technical officers
Monitoring and Evaluation reports
Training reports
Community willingness to participate and resources available
Output 1.2; Community based experiential learning for SLM
At least 25% of cultivators in the pilot landscapes
% of farmers adopting new
Monitoring and Evaluation reports
Community willingness to participate and resources
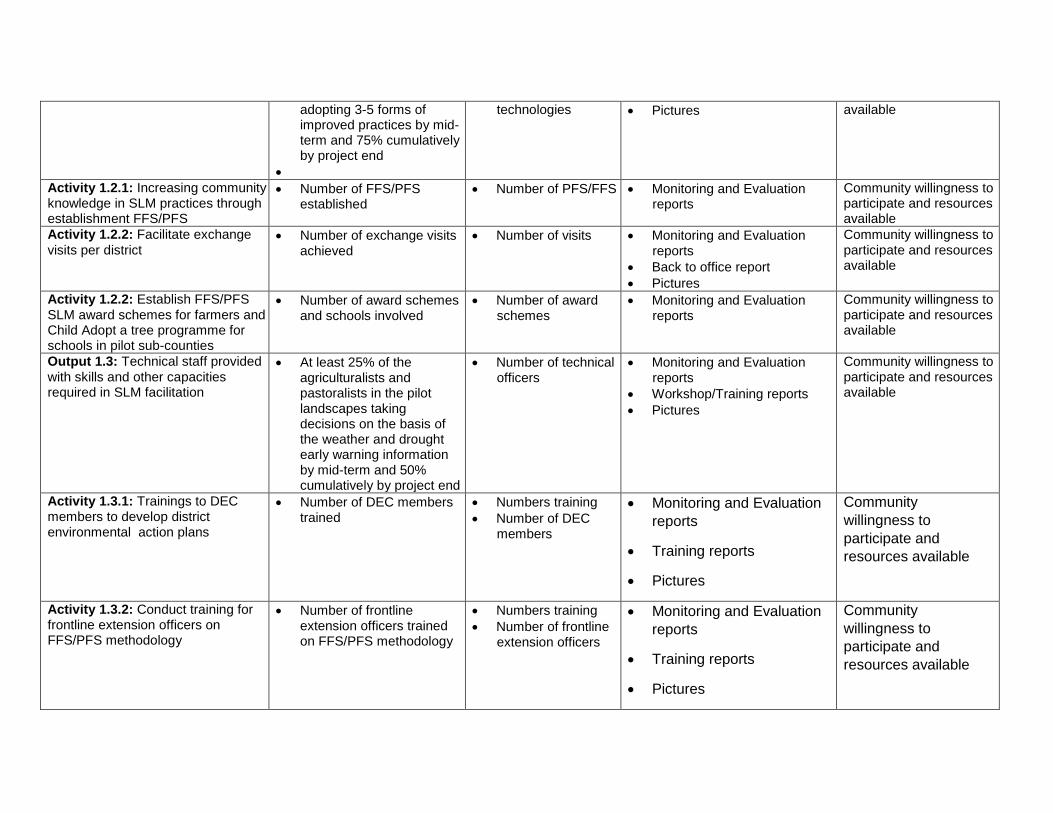
adopting 3-5 forms of improved practices by mid-term and 75% cumulatively by project end
technologies Pictures available
Activity 1.2.1: Increasing community knowledge in SLM practices through establishment FFS/PFS
Number of FFS/PFS established
Number of PFS/FFS Monitoring and Evaluation reports
Community willingness to participate and resources available
Activity 1.2.2: Facilitate exchange
visits per district Number of exchange visits
achieved Number of visits Monitoring and Evaluation
reports
Back to office report
Pictures
Community willingness to participate and resources available
Activity 1.2.2: Establish FFS/PFS
SLM award schemes for farmers and Child Adopt a tree programme for schools in pilot sub-counties
Number of award schemes and schools involved
Number of award schemes
Monitoring and Evaluation reports
Community willingness to participate and resources available
Output 1.3: Technical staff provided
with skills and other capacities required in SLM facilitation
At least 25% of the agriculturalists and pastoralists in the pilot landscapes taking decisions on the basis of the weather and drought early warning information by mid-term and 50% cumulatively by project end
Number of technical officers
Monitoring and Evaluation reports
Workshop/Training reports
Pictures
Community willingness to participate and resources available
Activity 1.3.1: Trainings to DEC members to develop district environmental action plans
Number of DEC members trained
Numbers training
Number of DEC members
Monitoring and Evaluation
reports
Training reports
Pictures
Community
willingness to
participate and
resources available
Activity 1.3.2: Conduct training for frontline extension officers on FFS/PFS methodology
Number of frontline extension officers trained on FFS/PFS methodology
Numbers training
Number of frontline extension officers
Monitoring and Evaluation
reports
Training reports
Pictures
Community
willingness to
participate and
resources available

Activity 1.3.3: Support world day to Combat desertification activities and World Environment day
Resources allocated towards support of events
Amount of resources
Monitoring and Evaluation
reports
Back to office report
Pictures
Community
willingness to
participate and
resources available
Output 1.4:Rehabilitation of
degraded lands At least 30% increase in
soil fertility from baselines for land users consistently engaging in 3-5 improved practices by mid-term and by 30% cumulatively by end of the project
% increase in soil fertility
Number of samples
Monitoring and Evaluation reports
Pictures
Community
willingness to
participate and
resources available
Activity 1.4.1: Support to land rehabilitation, pasture reseeding and soil conservation structures
Number of Ha of land rehabilitated
Ha, Km of terraces, Ha of pasture reseeded
Monitoring and Evaluation reports
Pictures
Community
willingness to
participate and
resources available
Activity 1.4.2: Rehabilitation of selected degraded land sites through support to agro-forestry
Number of trees planted Number of trees Monitoring and Evaluation reports
Pictures
Community
willingness to
participate and
resources available
Output 1.5: A participatory M&E
system designed and used to provide information to link policy decisions to ecosystem health and improvements in livelihoods
Lessons on improving land and resource tenure, range rehabilitation, sustainable charcoaling, improving livestock mobility, and other important
M & E plan developed and shared
Monitoring and Evaluation plan documented
All stakeholders and
project participants are
involved in the
discussion and
development of M % E
Plan document
Activity 1.5.1: Conduct quarterly monitoring visits to assess implementation progress
Number of monitoring missions conducted
Number of monitoring missions
Monitoring reports All stakeholders and
project participants are
involved in monitoring
missions
Activity 1.5.2: Conduct training on Early warning systems
Number of trainings on Early Warning Systems
Number of trainings Monitoring and Evaluation Reports
Community willingness to participate and

Training reports resources available
Outcome 2: Viability of the agro
pastoralism production system increased through diversification increased access to finance for SLM
At least 20% increase in agricultural produce for key crops for those adopting 3-5 improved practices consistently by mid-term and 50% cumulative by project end
At least a 20% increase in livestock prices being obtained in markets within the pilot landscapes due to better marketing/trading conditions
At least 25% increase in numbers accessing micro-finance and credits By mid project - at least 25% increase in household incomes for more than 40% of participating households, cumulatively rising to at least 40% for more than 50% of households
At least 50% of current mobile pastoralists still retain livestock mobility by the end of the project
At least 10% reduction in incidents of conflicts over land and resources in the pilot districts and a cumulative 50% reduction by project end
Numbers of farmers • % increase in livestock prices • Numbers of farmers accessing micro-finance credits • Numbers of farmers still retain livestock mobility
Numbers of farmers
Sampling captured in the monitoring reports
Project training reports as part of M& E reports
Project M&E and technical reports
Prolonged drought Increased encroachment by agriculture

• Numbers of
conflicts reported
Numbers of conflicts
reported
Output 2.1: Livestock Trade Improved.
At least a 20% increase in livestock prices being obtained in markets within the pilot landscapes due to better marketing/trading conditions
% increase in livestock prices
Livestock prices reports and assessments
Community willingness
to participate and
resources available
Activity 2.1.1: Support to dissemination of livestock market information
Number of Livestock market Information distributed
Number of information materials
Monitoring and Evaluation reports
Community willingness
to participate and
resources available
Activity 2.1.2: Strengthen/rehabilitate existing market structures in pilot sites
Number of markets rehabilitated
Number of Markets Monitoring and Evaluation reports
Pictures
Community willingness
to participate and
resources available
Activity 2.1.3: Support upgrading of local livestock breed to improve productivity
Breeds of livestock upgraded
Increase in productivity
Number of improved breeding stock
Monitoring and Evaluation reports
Pictures
Partnership with KALRO
developed and breeding
done.
Activity 2.1.4: Conduct field days to promote livestock-based trade
Number of field days conducted
Number of field days Monitoring and Evaluation reports
Back to Office report
Pictures
Community participate
and resources available
Output 2.2: Access to markets for alternative sustainable livelihood options increased
At least 20% increase in
agricultural produce for
key crops for those
adopting 3-5 improved
practices consistently by
mid-term and 50%
cumulative by project end
% increase in agricultural produce
Monitoring and Evaluation reports
Community participate
and resources available
Activity 2.2.1: Promote alternative income generating activities and support linkage to markets
Number of IGAs
developed and linked to
Number of IGAs Monitoring and Evaluation reports
Community participate
and resources
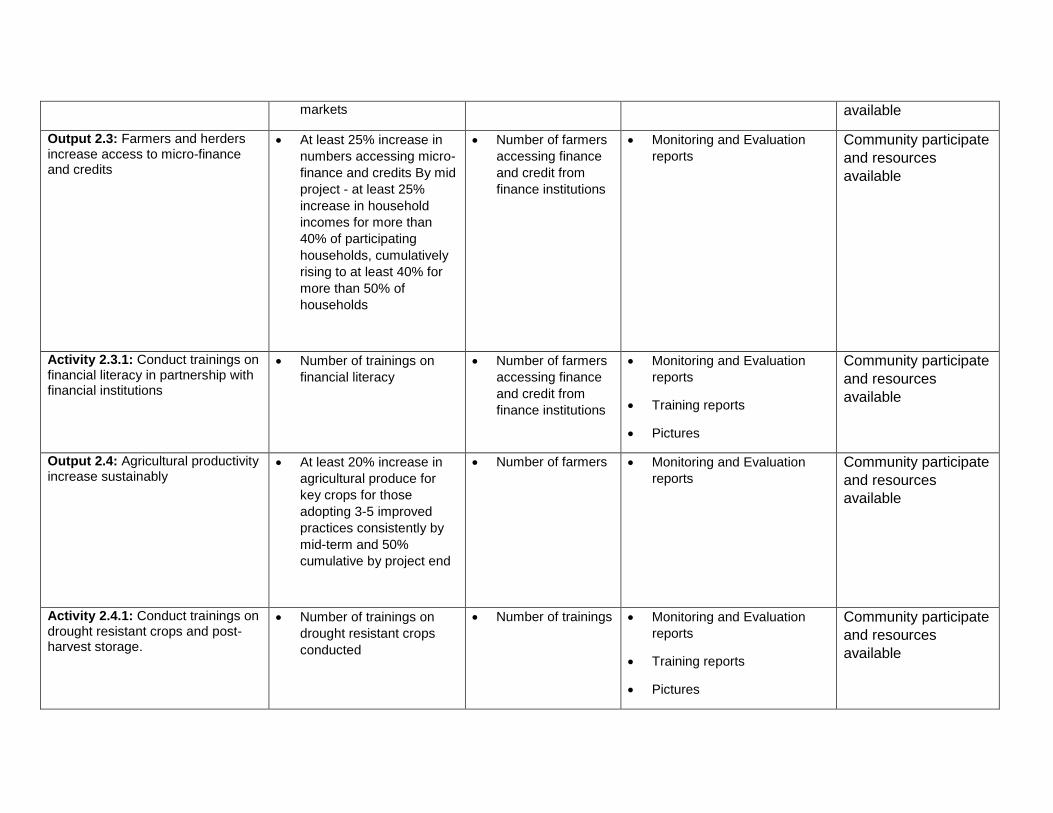
markets available
Output 2.3: Farmers and herders increase access to micro-finance and credits
At least 25% increase in
numbers accessing micro-
finance and credits By mid
project - at least 25%
increase in household
incomes for more than
40% of participating
households, cumulatively
rising to at least 40% for
more than 50% of
households
Number of farmers
accessing finance
and credit from
finance institutions
Monitoring and Evaluation
reports
Community participate
and resources
available
Activity 2.3.1: Conduct trainings on financial literacy in partnership with financial institutions
Number of trainings on
financial literacy
Number of farmers
accessing finance
and credit from
finance institutions
Monitoring and Evaluation
reports
Training reports
Pictures
Community participate
and resources
available
Output 2.4: Agricultural productivity increase sustainably
At least 20% increase in
agricultural produce for
key crops for those
adopting 3-5 improved
practices consistently by
mid-term and 50%
cumulative by project end
Number of farmers Monitoring and Evaluation
reports
Community participate
and resources
available
Activity 2.4.1: Conduct trainings on drought resistant crops and post-harvest storage.
Number of trainings on
drought resistant crops
conducted
Number of trainings Monitoring and Evaluation
reports
Training reports
Pictures
Community participate
and resources
available
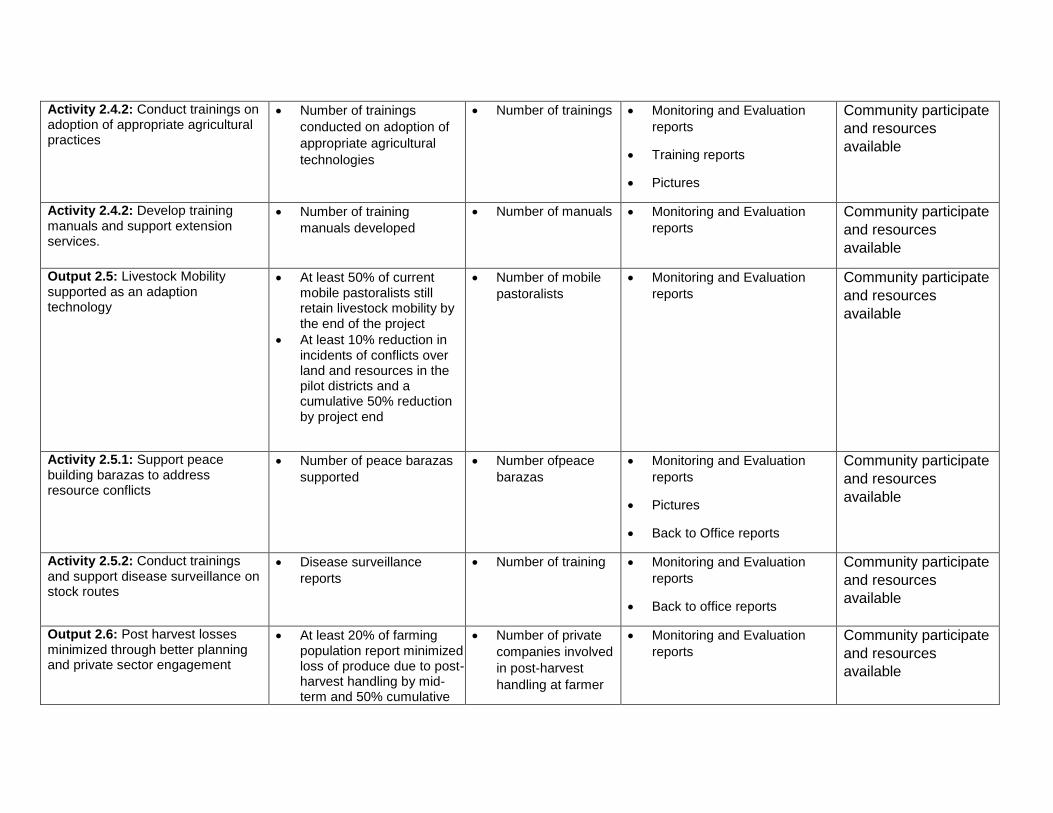
Activity 2.4.2: Conduct trainings on adoption of appropriate agricultural practices
Number of trainings
conducted on adoption of
appropriate agricultural
technologies
Number of trainings Monitoring and Evaluation
reports
Training reports
Pictures
Community participate
and resources
available
Activity 2.4.2: Develop training manuals and support extension services.
Number of training
manuals developed
Number of manuals Monitoring and Evaluation
reports
Community participate
and resources
available
Output 2.5: Livestock Mobility supported as an adaption technology
At least 50% of current mobile pastoralists still retain livestock mobility by the end of the project
At least 10% reduction in incidents of conflicts over land and resources in the pilot districts and a cumulative 50% reduction by project end
Number of mobile
pastoralists
Monitoring and Evaluation
reports
Community participate
and resources
available
Activity 2.5.1: Support peace building barazas to address resource conflicts
Number of peace barazas
supported
Number ofpeace
barazas
Monitoring and Evaluation
reports
Pictures
Back to Office reports
Community participate
and resources
available
Activity 2.5.2: Conduct trainings and support disease surveillance on stock routes
Disease surveillance
reports
Number of training Monitoring and Evaluation
reports
Back to office reports
Community participate
and resources
available
Output 2.6: Post harvest losses minimized through better planning and private sector engagement
At least 20% of farming population report minimized loss of produce due to post-harvest handling by mid-term and 50% cumulative
Number of private
companies involved
in post-harvest
handling at farmer
Monitoring and Evaluation
reports
Community participate
and resources
available

by project end
level
Activity 2.6.1: Mapping post-harvest risks using GIS
Report of Post-harvest risks mapped.
Report on post-harvest risks
Monitoring and Evaluation
reports
Maps
Back to office reports
Community participate
and resources
available
Activity 2.6.2: Conduct trainings on post-harvest management and facilitate involvement of private sector in servicing post-harvest technologies
Number of trainings on post-harvest management
Number of private sector involved in servicing post-harvest technologies
Number of trainings
Number of private sector companies
Monitoring and Evaluation
reports
Training reports
Pictures
Community participate
and resources
available
Output 2.7: Gender mainstreamed into SLM, Policy, and economic outcomes.
Gender mainstreaming strategy developed
Strategy document Monitoring and Evaluation
reports
Community participate
and resources
available
Activity 2.7.1: Implementation and monitoring of gender mainstreaming Action Plans.
Gender mainstreaming action plan developed
Action plan Monitoring and Evaluation
reports
Community participate
and resources
available
Outcome 3: The policy, regulatory
and Institutional environment support sustainable land management in the agro pastoral production system (and ASALs)
At least 2 policies revised to mainstream SLM principles and so provide a better policy environment for SLM; Discussions for legislation and institutional arrangement for policy implementation for at least 2 key policies held by mid-term and recommendations provided adopted by end of the project At least 5 charcoal associations have rules and
Numbers of policies • Number of policies discussed
Sampling captured in the monitoring reports
Project training reports as part of M& E reports
Project M&E and technical reports
Pictures of the adopted technologies
Prolonged drought Increased encroachment by agriculture
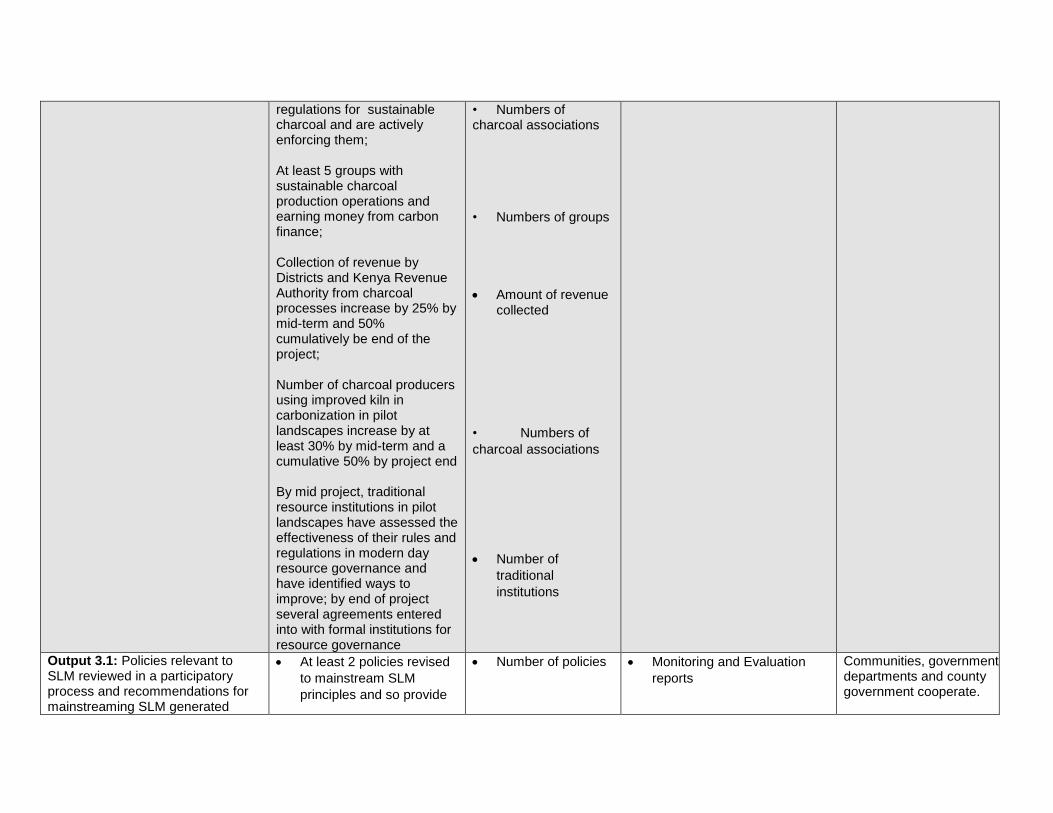
regulations for sustainable charcoal and are actively enforcing them; At least 5 groups with sustainable charcoal production operations and earning money from carbon finance; Collection of revenue by Districts and Kenya Revenue Authority from charcoal processes increase by 25% by mid-term and 50% cumulatively be end of the project; Number of charcoal producers using improved kiln in carbonization in pilot landscapes increase by at least 30% by mid-term and a cumulative 50% by project end By mid project, traditional resource institutions in pilot landscapes have assessed the effectiveness of their rules and regulations in modern day resource governance and have identified ways to improve; by end of project several agreements entered into with formal institutions for resource governance
• Numbers of charcoal associations • Numbers of groups
Amount of revenue collected
• Numbers of
charcoal associations
Number of
traditional
institutions
Output 3.1: Policies relevant to SLM reviewed in a participatory process and recommendations for mainstreaming SLM generated
At least 2 policies revised
to mainstream SLM
principles and so provide
Number of policies Monitoring and Evaluation
reports
Communities, government departments and county government cooperate.
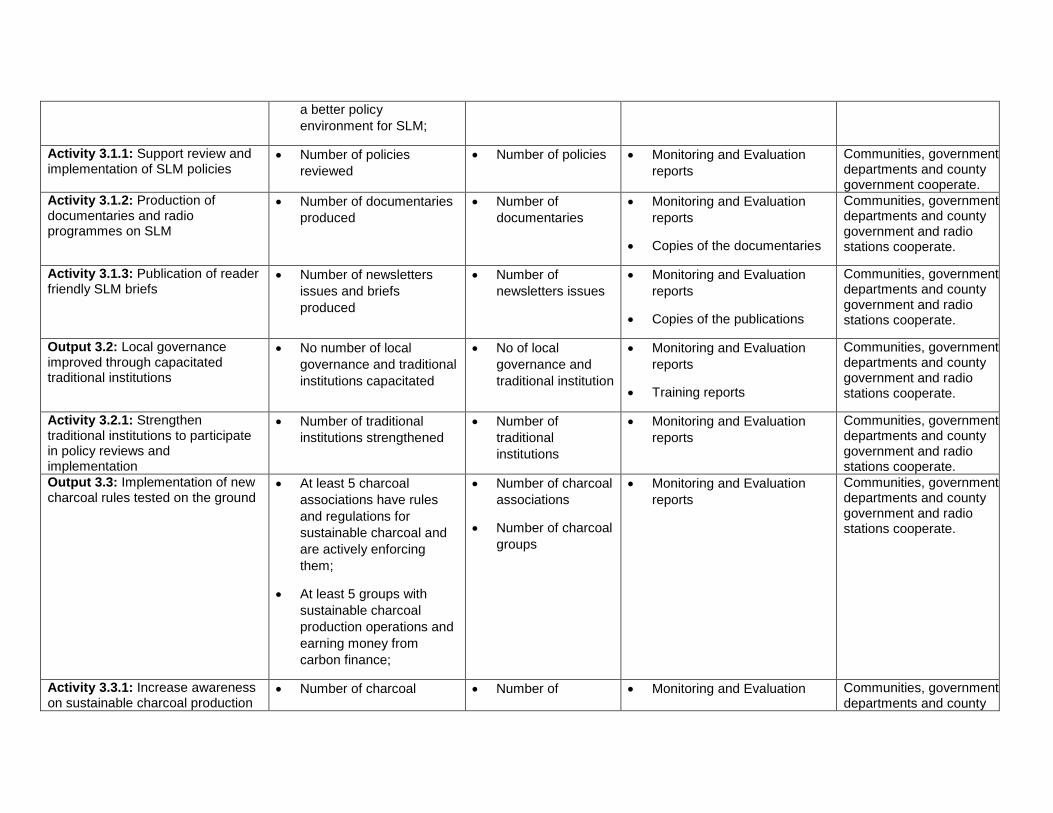
a better policy
environment for SLM;
Activity 3.1.1: Support review and implementation of SLM policies
Number of policies
reviewed
Number of policies Monitoring and Evaluation
reports
Communities, government departments and county government cooperate.
Activity 3.1.2: Production of documentaries and radio programmes on SLM
Number of documentaries
produced
Number of
documentaries
Monitoring and Evaluation
reports
Copies of the documentaries
Communities, government departments and county government and radio stations cooperate.
Activity 3.1.3: Publication of reader friendly SLM briefs
Number of newsletters
issues and briefs
produced
Number of
newsletters issues
Monitoring and Evaluation
reports
Copies of the publications
Communities, government departments and county government and radio stations cooperate.
Output 3.2: Local governance improved through capacitated traditional institutions
No number of local
governance and traditional
institutions capacitated
No of local
governance and
traditional institution
Monitoring and Evaluation
reports
Training reports
Communities, government departments and county government and radio stations cooperate.
Activity 3.2.1: Strengthen traditional institutions to participate in policy reviews and implementation
Number of traditional
institutions strengthened
Number of
traditional
institutions
Monitoring and Evaluation
reports
Communities, government departments and county government and radio stations cooperate.
Output 3.3: Implementation of new charcoal rules tested on the ground
At least 5 charcoal
associations have rules
and regulations for
sustainable charcoal and
are actively enforcing
them;
At least 5 groups with
sustainable charcoal
production operations and
earning money from
carbon finance;
Number of charcoal
associations
Number of charcoal
groups
Monitoring and Evaluation
reports
Communities, government departments and county government and radio stations cooperate.
Activity 3.3.1: Increase awareness on sustainable charcoal production
Number of charcoal Number of Monitoring and Evaluation Communities, government departments and county
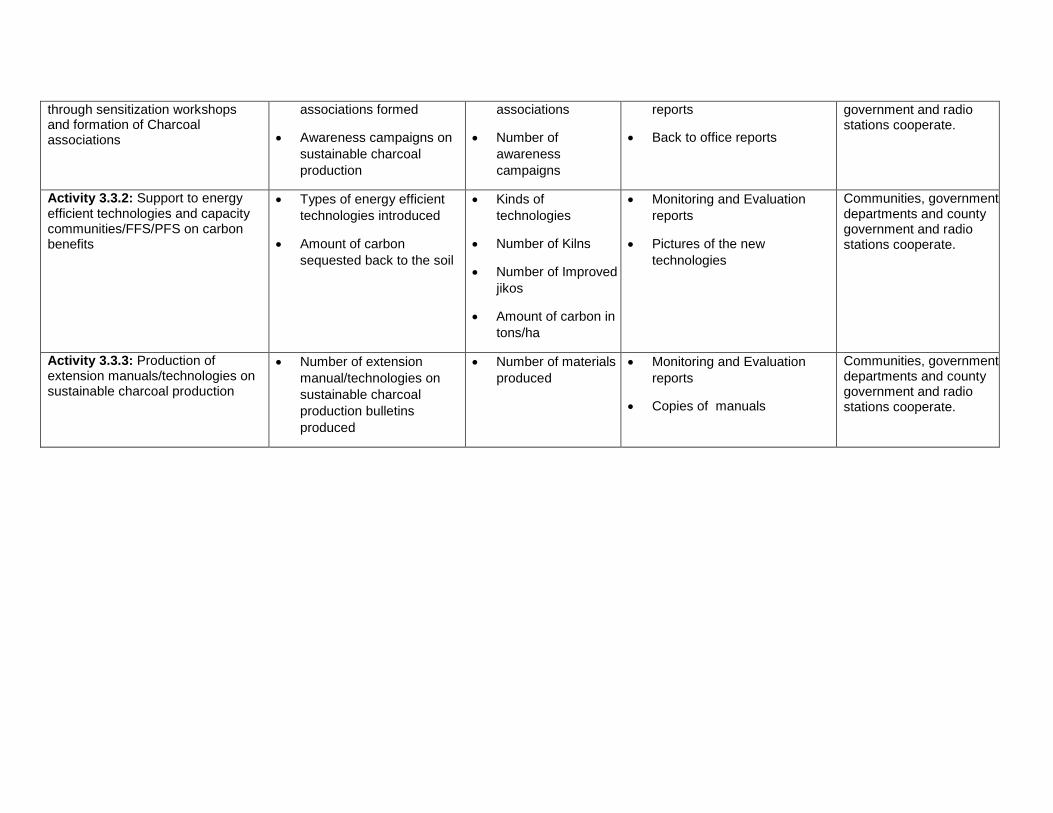
through sensitization workshops and formation of Charcoal associations
associations formed
Awareness campaigns on
sustainable charcoal
production
associations
Number of
awareness
campaigns
reports
Back to office reports
government and radio stations cooperate.
Activity 3.3.2: Support to energy efficient technologies and capacity communities/FFS/PFS on carbon benefits
Types of energy efficient
technologies introduced
Amount of carbon
sequested back to the soil
Kinds of
technologies
Number of Kilns
Number of Improved
jikos
Amount of carbon in
tons/ha
Monitoring and Evaluation
reports
Pictures of the new
technologies
Communities, government departments and county government and radio stations cooperate.
Activity 3.3.3: Production of extension manuals/technologies on sustainable charcoal production
Number of extension
manual/technologies on
sustainable charcoal
production bulletins
produced
Number of materials
produced
Monitoring and Evaluation
reports
Copies of manuals
Communities, government departments and county government and radio stations cooperate.

ANNEX 2: M&E MATRIX
Monitoring and Evaluation Plan for SLM Project-Kenya.
I. Key Evaluation Questions
Baseline Context: What is the current context in the status of land, natural resources and ecosystems, their conservation and capacity for production of goods and services?
Needs: What are the evidence of positive changes in the management and use of biodiversity and natural resources?
Inputs: Have correct, sufficient and appropriate interventions been designed? Are there sufficient human and financial resources and leadership support to design and implement them?
Processes/Implementation: How well is the project proceeding: are all inputs, processes and outputs on track and are milestones being met? What is the quality of training and advocacy processes being implemented? To what extent are key stakeholders providing support and involvement needed to achieve results?
Outputs: Has the community acquired new knowledge and skills as a result of training? Have supervisory visits and work environment improvements taken place?
Effects: To what extent did the indicators showing the difference between desired and actual performance change as a result of the interventions that were implemented? To what extent has SLM principles adopted?
Impacts: To what extent have desired strategic results been achieved? How satisfied are the catchment community with performance improvements? How effective was the project implementation and what lessons/best practices can be derived? How sustainable is the process?
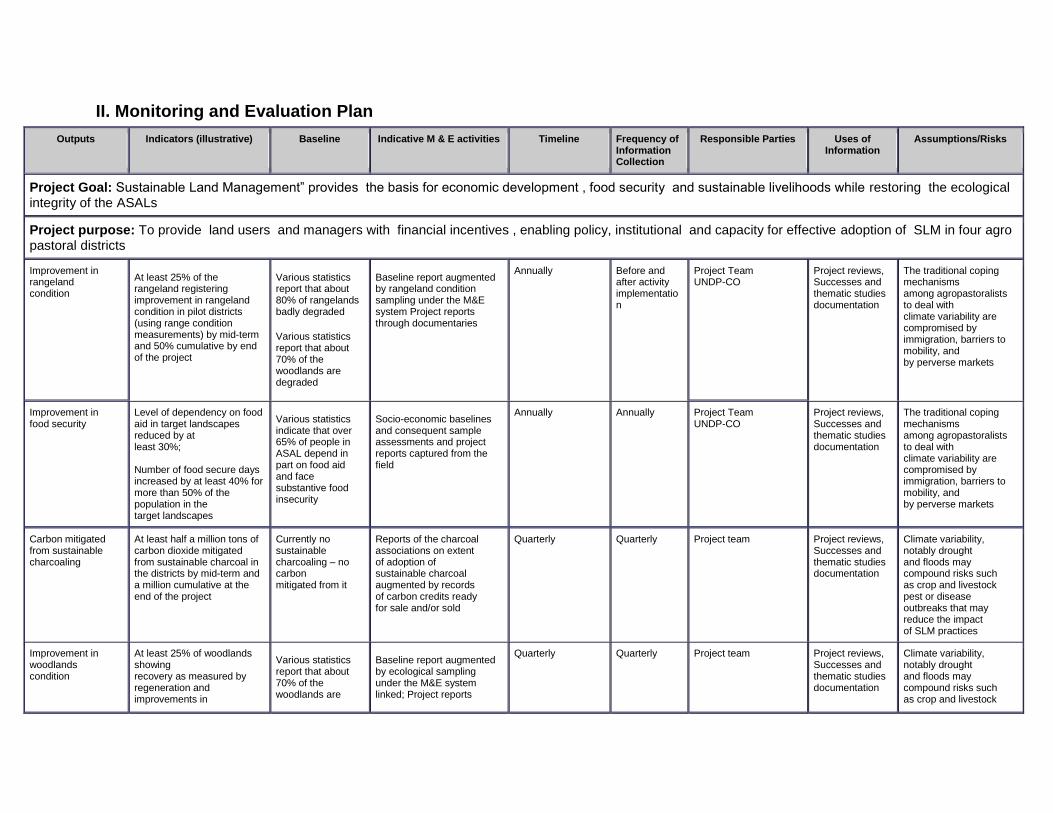
II. Monitoring and Evaluation Plan
Outputs Indicators (illustrative) Baseline Indicative M & E activities Timeline Frequency of Information Collection
Responsible Parties Uses of Information
Assumptions/Risks
Project Goal: Sustainable Land Management” provides the basis for economic development , food security and sustainable livelihoods while restoring the ecological integrity of the ASALs
Project purpose: To provide land users and managers with financial incentives , enabling policy, institutional and capacity for effective adoption of SLM in four agro pastoral districts
Improvement in rangeland condition
At least 25% of the rangeland registering improvement in rangeland condition in pilot districts (using range condition measurements) by mid-term and 50% cumulative by end of the project
Various statistics report that about 80% of rangelands badly degraded
Various statistics report that about 70% of the woodlands are degraded
Baseline report augmented by rangeland condition sampling under the M&E system Project reports through documentaries
Annually Before and after activity implementation
Project Team UNDP-CO
Project reviews, Successes and thematic studies documentation
The traditional coping mechanisms among agropastoralists to deal with climate variability are compromised by immigration, barriers to mobility, and by perverse markets
Improvement in food security
Level of dependency on food aid in target landscapes reduced by at least 30%; Number of food secure days increased by at least 40% for more than 50% of the population in the target landscapes
Various statistics indicate that over 65% of people in ASAL depend in part on food aid and face substantive food insecurity
Socio-economic baselines and consequent sample assessments and project reports captured from the field
Annually Annually Project Team UNDP-CO
Project reviews, Successes and thematic studies documentation
The traditional coping mechanisms among agropastoralists to deal with climate variability are compromised by immigration, barriers to mobility, and by perverse markets
Carbon mitigated from sustainable charcoaling
At least half a million tons of carbon dioxide mitigated from sustainable charcoal in the districts by mid-term and a million cumulative at the end of the project
Currently no sustainable charcoaling – no carbon mitigated from it
Reports of the charcoal associations on extent of adoption of sustainable charcoal augmented by records of carbon credits ready for sale and/or sold
Quarterly Quarterly Project team Project reviews, Successes and thematic studies documentation
Climate variability, notably drought and floods may compound risks such as crop and livestock pest or disease outbreaks that may reduce the impact of SLM practices
Improvement in woodlands condition
At least 25% of woodlands showing recovery as measured by regeneration and improvements in
Various statistics report that about 70% of the woodlands are
Baseline report augmented by ecological sampling under the M&E system linked; Project reports
Quarterly Quarterly Project team Project reviews, Successes and thematic studies documentation
Climate variability, notably drought and floods may compound risks such as crop and livestock
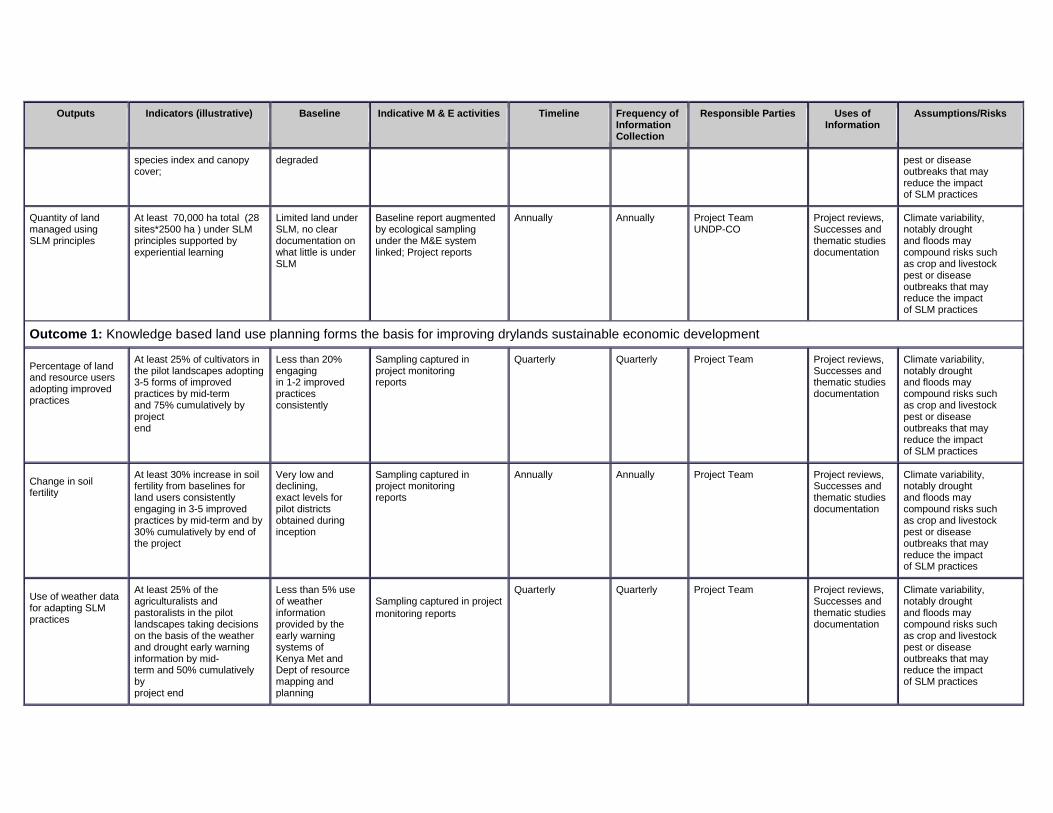
Outputs Indicators (illustrative) Baseline Indicative M & E activities Timeline Frequency of Information Collection
Responsible Parties Uses of Information
Assumptions/Risks
species index and canopy cover;
degraded pest or disease outbreaks that may reduce the impact of SLM practices
Quantity of land managed using SLM principles
At least 70,000 ha total (28 sites*2500 ha ) under SLM principles supported by experiential learning
Limited land under SLM, no clear documentation on what little is under SLM
Baseline report augmented by ecological sampling under the M&E system linked; Project reports
Annually Annually Project Team UNDP-CO
Project reviews, Successes and thematic studies documentation
Climate variability, notably drought and floods may compound risks such as crop and livestock pest or disease outbreaks that may reduce the impact of SLM practices
Outcome 1: Knowledge based land use planning forms the basis for improving drylands sustainable economic development
Percentage of land and resource users adopting improved practices
At least 25% of cultivators in the pilot landscapes adopting 3-5 forms of improved practices by mid-term and 75% cumulatively by project end
Less than 20% engaging in 1-2 improved practices consistently
Sampling captured in project monitoring reports
Quarterly Quarterly Project Team Project reviews, Successes and thematic studies documentation
Climate variability, notably drought and floods may compound risks such as crop and livestock pest or disease outbreaks that may reduce the impact of SLM practices
Change in soil fertility
At least 30% increase in soil fertility from baselines for land users consistently engaging in 3-5 improved practices by mid-term and by 30% cumulatively by end of the project
Very low and declining, exact levels for pilot districts obtained during inception
Sampling captured in project monitoring reports
Annually Annually Project Team Project reviews, Successes and thematic studies documentation
Climate variability, notably drought and floods may compound risks such as crop and livestock pest or disease outbreaks that may reduce the impact of SLM practices
Use of weather data for adapting SLM practices
At least 25% of the agriculturalists and pastoralists in the pilot landscapes taking decisions on the basis of the weather and drought early warning information by mid- term and 50% cumulatively by project end
Less than 5% use of weather information provided by the early warning systems of Kenya Met and Dept of resource mapping and planning
Sampling captured in project
monitoring reports
Quarterly Quarterly Project Team Project reviews, Successes and thematic studies documentation
Climate variability, notably drought and floods may compound risks such as crop and livestock pest or disease outbreaks that may reduce the impact of SLM practices

Outputs Indicators (illustrative) Baseline Indicative M & E activities Timeline Frequency of Information Collection
Responsible Parties Uses of Information
Assumptions/Risks
Number of people with relevant skills for SLM
At least 40% of land users and 30% of technical officers requiring to up-date skills have done so by mid- term: by the end of project, at least 60% of land users and 75% of technical officers cumulatively have updated skills.
Less than 15% of land users and pastoralists have skills for improved management; less than 50% of technical officers have updated SLM skills
Project training reports as part M&E reports
Quarterly Quarterly Project Team Project reviews, Successes and thematic studies documentation
Climate variability, notably drought and floods may compound risks such as crop and livestock pest or disease outbreaks that may reduce the impact of SLM practices
Lessons generated Lessons on improving land and resource tenure, range rehabilitation, unstainable charcoaling, improving livestock mobility, and other important project initiatives available for dissemination through the upscaling project;
Limited knowledge management happening now, no clear mechanism for generating and sharing lessons
Project M&E and technical reports
Quarterly Quarterly Project Team Project reviews, Successes and thematic studies documentation
Climate variability, notably drought and floods may compound risks such as crop and livestock pest or disease outbreaks that may reduce the impact of SLM practices
Outcome 2: Viability of the agro pastoralism production system increased through diversification increased access to finance for SLM
Change in agricultural productivity
At least 20% increase in agricultural produce for key crops for those adopting 3-5 improved practices consistently by mid-term and 50% cumulative by project end
Current low and declining, exact levels of selected crops to be obtained during inception
Project monitoring reports Quarterly Quarterly Project Team Project reviews,
Successes and thematic studies documentation
Climate variability, notably drought and floods may compound risks such as crop and livestock pest or disease outbreaks that may reduce the impact of SLM practices
Increase in livestock trade and prices
At least a 20% increase in livestock prices being obtained in markets within the pilot landscapes due to better marketing/trading conditions
Currently livestock trading riddled with problems of insecurity, lack of up to date information on prices and therefore very low prices being obtained
Household economic activity data captured in project monitoring reports
Quarterly Quarterly Project Team Project reviews, Successes and thematic studies documentation
Climate variability, notably drought and floods may compound risks such as crop and livestock pest or disease outbreaks that may reduce the impact of SLM practices
Number of households or
At least 25% increase in numbers accessing micro-
Less than 10% of households have
Household economic activity data captured in project
Quarterly Quarterly Project Team Project reviews, Successes and
Climate variability, notably drought and
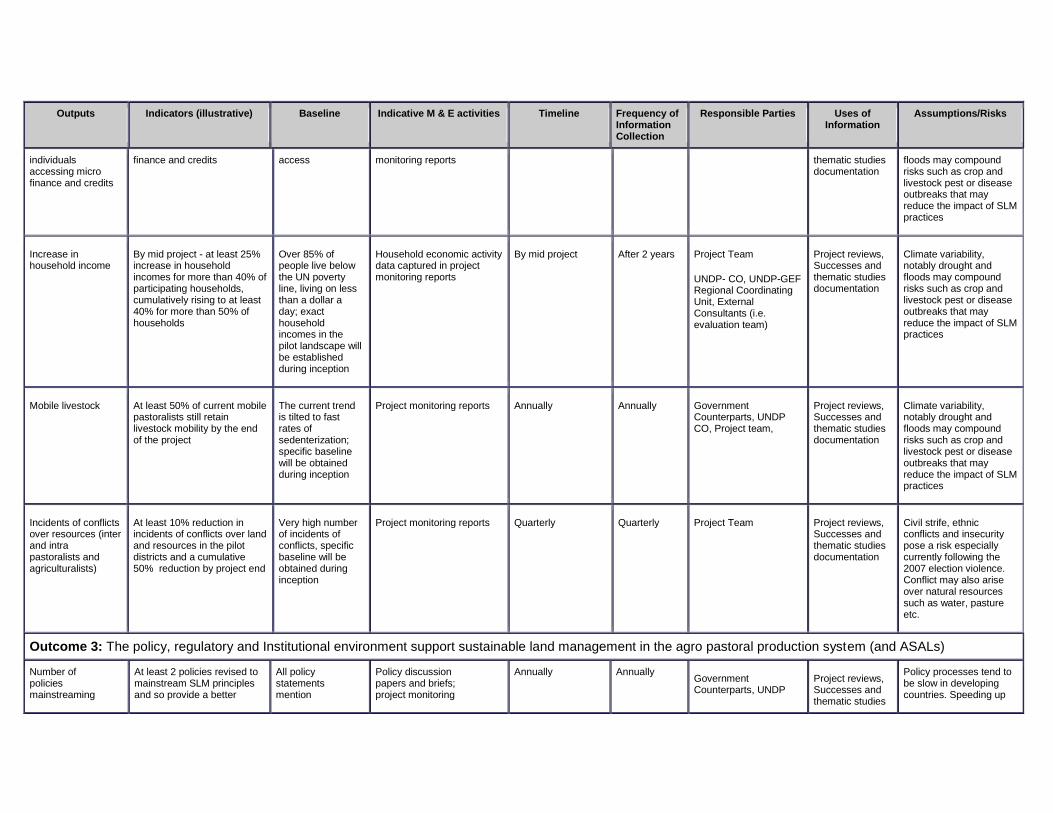
Outputs Indicators (illustrative) Baseline Indicative M & E activities Timeline Frequency of Information Collection
Responsible Parties Uses of Information
Assumptions/Risks
individuals accessing micro finance and credits
finance and credits access monitoring reports thematic studies documentation
floods may compound risks such as crop and livestock pest or disease outbreaks that may reduce the impact of SLM practices
Increase in household income
By mid project - at least 25% increase in household incomes for more than 40% of participating households, cumulatively rising to at least 40% for more than 50% of households
Over 85% of people live below the UN poverty line, living on less than a dollar a day; exact household incomes in the pilot landscape will be established during inception
Household economic activity data captured in project monitoring reports
By mid project After 2 years Project Team
UNDP- CO, UNDP-GEF Regional Coordinating Unit, External Consultants (i.e. evaluation team)
Project reviews, Successes and thematic studies documentation
Climate variability, notably drought and floods may compound risks such as crop and livestock pest or disease outbreaks that may reduce the impact of SLM practices
Mobile livestock At least 50% of current mobile pastoralists still retain livestock mobility by the end of the project
The current trend is tilted to fast rates of sedenterization; specific baseline will be obtained during inception
Project monitoring reports Annually Annually Government Counterparts, UNDP CO, Project team,
Project reviews, Successes and thematic studies documentation
Climate variability, notably drought and floods may compound risks such as crop and livestock pest or disease outbreaks that may reduce the impact of SLM practices
Incidents of conflicts over resources (inter and intra pastoralists and agriculturalists)
At least 10% reduction in incidents of conflicts over land and resources in the pilot districts and a cumulative 50% reduction by project end
Very high number of incidents of conflicts, specific baseline will be obtained during inception
Project monitoring reports Quarterly Quarterly Project Team Project reviews, Successes and thematic studies documentation
Civil strife, ethnic conflicts and insecurity pose a risk especially currently following the 2007 election violence. Conflict may also arise over natural resources such as water, pasture etc.
Outcome 3: The policy, regulatory and Institutional environment support sustainable land management in the agro pastoral production system (and ASALs)
Number of policies mainstreaming
At least 2 policies revised to mainstream SLM principles and so provide a better
All policy statements mention
Policy discussion papers and briefs; project monitoring
Annually Annually Government Counterparts, UNDP
Project reviews, Successes and thematic studies
Policy processes tend to be slow in developing countries. Speeding up

Outputs Indicators (illustrative) Baseline Indicative M & E activities Timeline Frequency of Information Collection
Responsible Parties Uses of Information
Assumptions/Risks
SLM policy environment for SLM; importance of SLM but don’t have details of how SLM will be ensured
reports CO, Project team, documentation the process, especially of formulating legislative frameworks will be necessary for achievement of this indicator
Number of policies with legislation and institutional arrangement for effective implementation
Discussions for legislation and institutional arrangement for policy implementation for at least 2 key policies held by mid-term and recommendations provided adopted by end of the project
Few SLM policies have updated and effective frameworks well linked into the local institutions
Policy discussion papers and briefs; project monitoring reports
Annually Annually Government Counterparts, UNDP CO, Project team, UNDP-GEF Regional Coordinating Unit
Project reviews, Successes and thematic studies documentation
Policy processes tend to be slow in developing countries. Speeding up
Number of functional charcoal associations
At least 5 charcoal associations have rules and regulations for sustainable charcoal and are actively enforcing them;
No charcoal associations
Charcoal production data captured in project reports
Annually Annually Project Team Project reviews, Successes and thematic studies documentation
Current willingness and support by government and people to clean up charcoaling processes declines
Number of groups with operational sustainable charcoal processes
At least 5 groups with sustainable charcoal production operations and earning money from carbon finance;
No charcoal producing groups
Charcoal production data captured in project reports
Annually Annually Project Team Project reviews, Successes and thematic studies documentation
Current willingness and support by government and people to clean up charcoaling processes declines
Revenue from charcoal going to District and national revenue
Collection of revenue by Districts and Kenya Revenue Authority from charcoal processes increase by 25% by mid-term and 50% cumulatively be end of the project;
Minimal collection through licensing but none through taxation
County Budgets Project monitoring reports
Annually Annually Project Team, County team
Project reviews, Successes and thematic studies documentation
Current willingness and support by government and people to clean up charcoaling processes declines
Adoption of improved kilns in carbonization
Number of charcoal producers using improved kiln in carbonization in pilot landscapes increase by at least 30% by mid- term and a cumulative 50% by project end
Less than 5% use improved kilns in carbonization
Charcoal production data captured in project reports
Mid-term 2 years Project Team, Project reviews, Successes and thematic studies documentation
Current willingness and support by government and people to clean up charcoaling processes declines
Improvement in local resource governance institutions
By mid project, traditional resource institutions in pilot landscapes have assessed the effectiveness of their rules and regulations in
Currently traditional institutions sidelined in natural resource management but
Project reports based on project monitoring
Mid-term 2 years Project Team, Project reviews, Successes and thematic studies documentation
Current political support for SLM persists; local institutions can be revived for resource
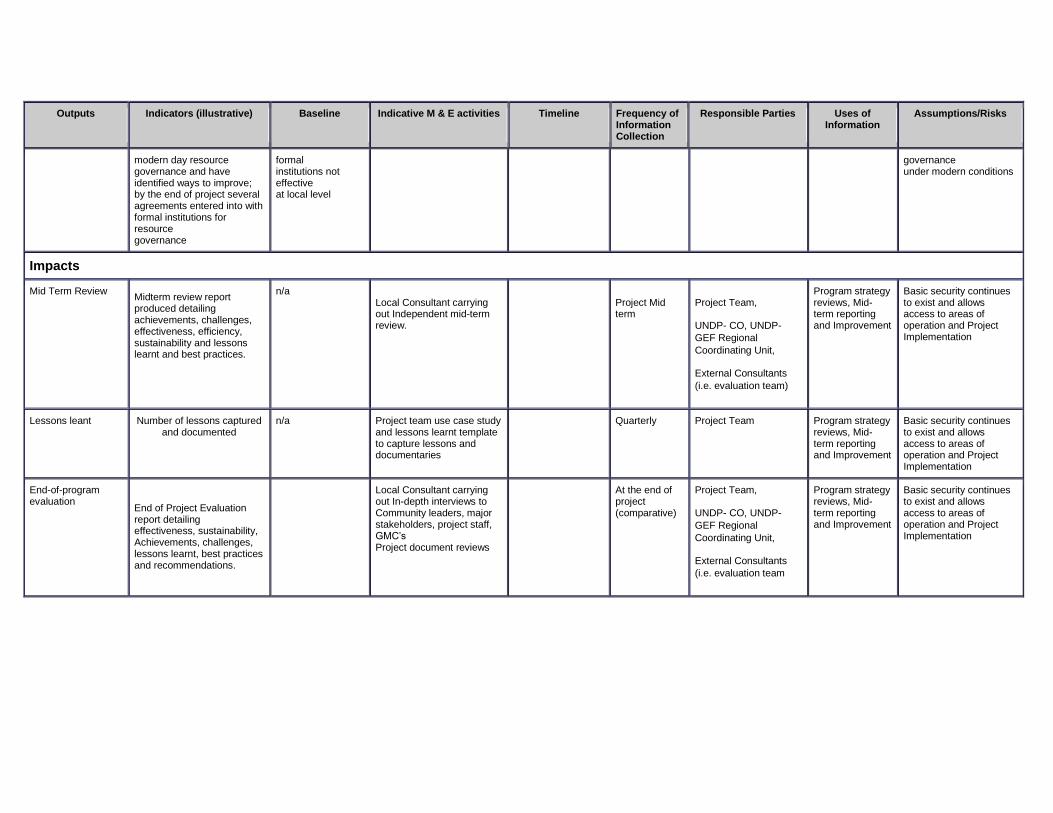
Outputs Indicators (illustrative) Baseline Indicative M & E activities Timeline Frequency of Information Collection
Responsible Parties Uses of Information
Assumptions/Risks
modern day resource governance and have identified ways to improve; by the end of project several agreements entered into with formal institutions for resource governance
formal institutions not effective at local level
governance under modern conditions
Impacts
Mid Term Review Midterm review report produced detailing achievements, challenges, effectiveness, efficiency, sustainability and lessons learnt and best practices.
n/a Local Consultant carrying out Independent mid-term review.
Project Mid term
Project Team,
UNDP- CO, UNDP-
GEF Regional
Coordinating Unit,
External Consultants
(i.e. evaluation team)
Program strategy reviews, Mid-term reporting and Improvement
Basic security continues to exist and allows access to areas of operation and Project Implementation
Lessons leant Number of lessons captured and documented
n/a Project team use case study and lessons learnt template to capture lessons and documentaries
Quarterly Project Team Program strategy reviews, Mid-term reporting and Improvement
Basic security continues to exist and allows access to areas of operation and Project Implementation
End-of-program evaluation
End of Project Evaluation report detailing effectiveness, sustainability, Achievements, challenges, lessons learnt, best practices and recommendations.
Local Consultant carrying out In-depth interviews to Community leaders, major stakeholders, project staff, GMC’s Project document reviews
At the end of project (comparative)
Project Team,
UNDP- CO, UNDP-
GEF Regional
Coordinating Unit,
External Consultants
(i.e. evaluation team
Program strategy reviews, Mid-term reporting and Improvement
Basic security continues to exist and allows access to areas of operation and Project Implementation

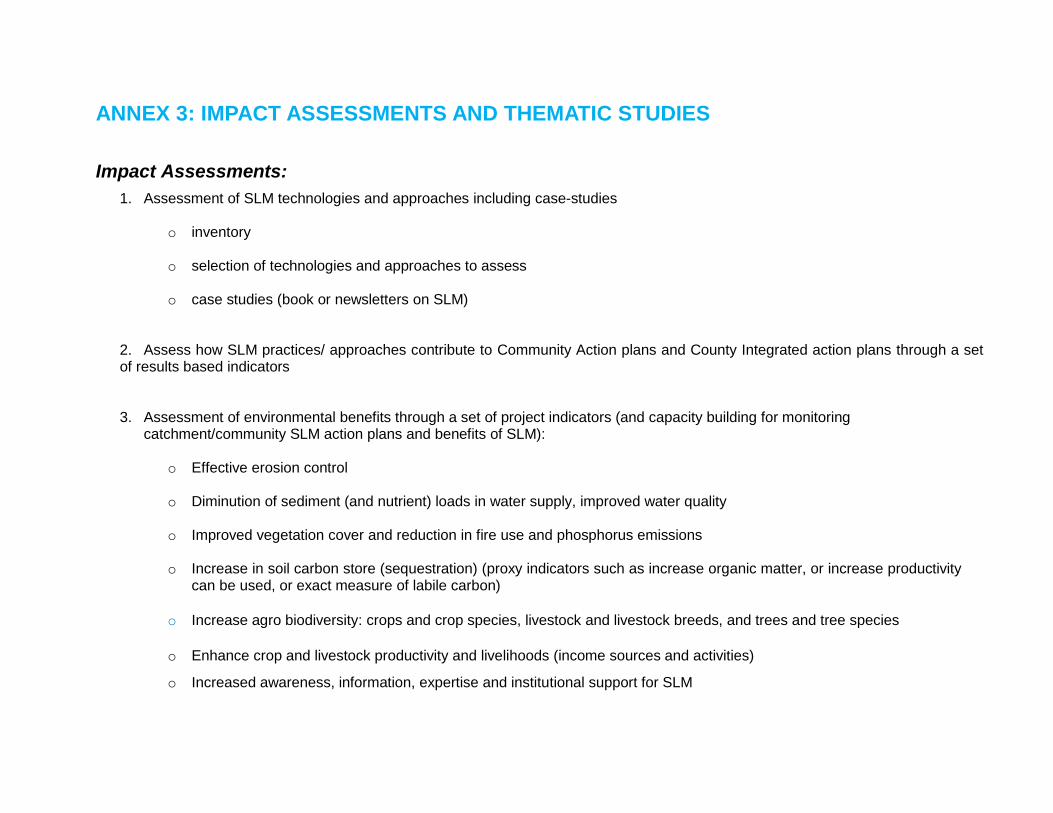
ANNEX 3: IMPACT ASSESSMENTS AND THEMATIC STUDIES
Impact Assessments:
1. Assessment of SLM technologies and approaches including case-studies
o inventory
o selection of technologies and approaches to assess
o case studies (book or newsletters on SLM)
2. Assess how SLM practices/ approaches contribute to Community Action plans and County Integrated action plans through a set of results based indicators
3. Assessment of environmental benefits through a set of project indicators (and capacity building for monitoring catchment/community SLM action plans and benefits of SLM):
o Effective erosion control
o Diminution of sediment (and nutrient) loads in water supply, improved water quality
o Improved vegetation cover and reduction in fire use and phosphorus emissions
o Increase in soil carbon store (sequestration) (proxy indicators such as increase organic matter, or increase productivity
can be used, or exact measure of labile carbon)
o Increase agro biodiversity: crops and crop species, livestock and livestock breeds, and trees and tree species
o Enhance crop and livestock productivity and livelihoods (income sources and activities)
o Increased awareness, information, expertise and institutional support for SLM

o Resilience: resilience to recent shocks (climatic, market, food prices, etc.)
o Food Security: production and yield of main crops cultivated, and duration of the lean period
Thematic Studies: 1. Best practices to address sustainable land management practices mainstreamed in planning and development processes:
o discuss best practices and constraints (draft reports by consultants and workshop)
o agree on mechanism to mainstream best practices in planning and development processes in counties (final reports by consultants)
o inform policy makers from different sectors (agriculture, environment, land, water, livestock, etc.) for integration in
development and planning processes
o Solicit co-funding from sub-counties to address issues and develop pilot actions
2. Policy recommendations per county that support national policy decisions and regulatory mechanisms for SLM,
o Review national policies and regulatory mechanisms, and identify the gaps, and draft 5 policy recommendations
o Identify bye-laws and existing barriers at sub-county and community level,
o Workshop to discuss and agree on policy recommendations
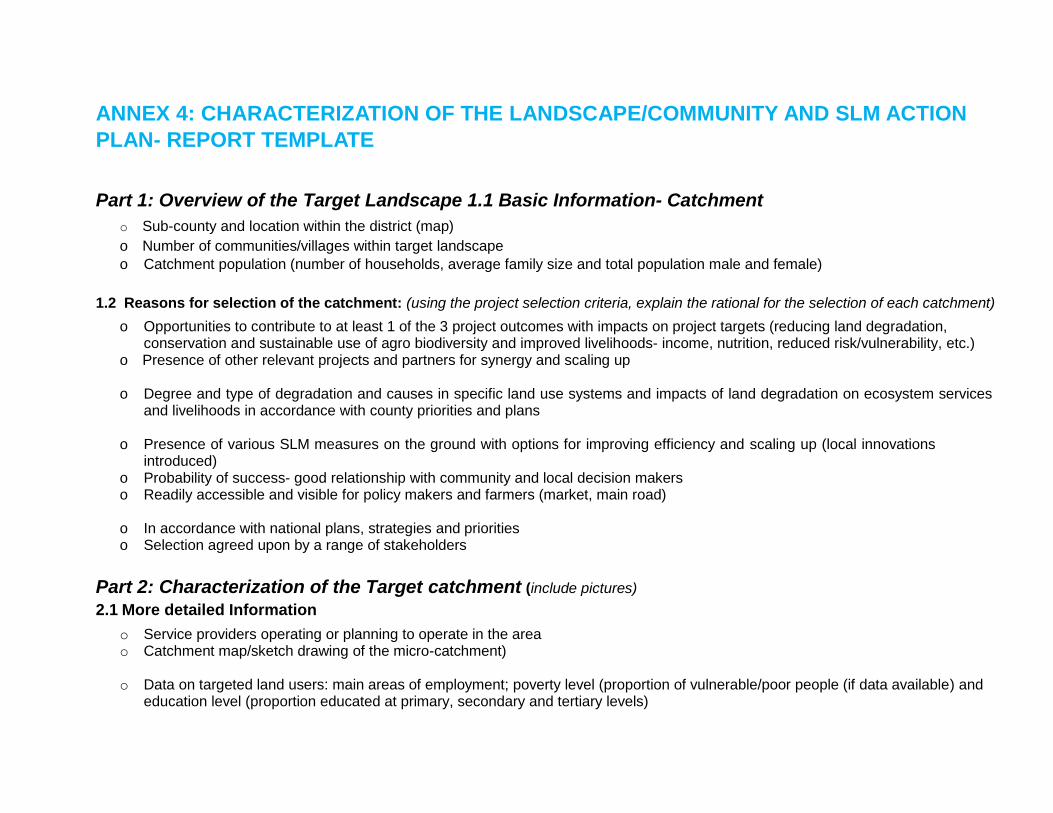
ANNEX 4: CHARACTERIZATION OF THE LANDSCAPE/COMMUNITY AND SLM ACTION
PLAN- REPORT TEMPLATE
Part 1: Overview of the Target Landscape 1.1 Basic Information- Catchment
o Sub-county and location within the district (map) o Number of communities/villages within target landscape o Catchment population (number of households, average family size and total population male and female)
1.2 Reasons for selection of the catchment: (using the project selection criteria, explain the rational for the selection of each catchment)
o Opportunities to contribute to at least 1 of the 3 project outcomes with impacts on project targets (reducing land degradation, conservation and sustainable use of agro biodiversity and improved livelihoods- income, nutrition, reduced risk/vulnerability, etc.)
o Presence of other relevant projects and partners for synergy and scaling up
o Degree and type of degradation and causes in specific land use systems and impacts of land degradation on ecosystem services and livelihoods in accordance with county priorities and plans
o Presence of various SLM measures on the ground with options for improving efficiency and scaling up (local innovations
introduced) o Probability of success- good relationship with community and local decision makers o Readily accessible and visible for policy makers and farmers (market, main road)
o In accordance with national plans, strategies and priorities o Selection agreed upon by a range of stakeholders
Part 2: Characterization of the Target catchment (include pictures) 2.1 More detailed Information
o Service providers operating or planning to operate in the area o Catchment map/sketch drawing of the micro-catchment)
o Data on targeted land users: main areas of employment; poverty level (proportion of vulnerable/poor people (if data available) and
education level (proportion educated at primary, secondary and tertiary levels)

o Community organizations and CSOs
2.2 Geography, Land and Water Availability and Use
o Maps available (soils, elevation, slope, topographic, etc.)- specify scales, o Main land use types (proportion of each and significant changes if available), o Main farming systems and enterprises (crops, livestock, forestry, others) for consumption and market average farm sizes and
degree of fragmentation (hectares; number of parcels/plots) for small, medium, large farms) o Land tenure arrangement and level of security o Water sources (distance, supply, management, quality, permanent or seasonal and recent changes if available) o Conflicts/competition over land and water resources
2.3 Land Degradation (mention and explain the land degradation problems in the catchment) o Types (by land use types) o Extent o Severity o Causes (hypothesis) o Impacts (hypothesis)
2.4 SLM (mention and explain the measures and practices seen in the catchment-inventory) o Technologies/practices (local innovations and introduced) o Approaches/process (for each Technology)
2.5 Policy and planning
o Application of environmental and agricultural policies
o Existence of district or local action plans and budgets

o Existence of local environmental and agricultural committees
Part 3: Catchment- Community SLM Action Plan
3.1 SLM interventions and activities proposed at community/catchment level Demonstration sites (for improved pasture/rangelands, protection of wetland/buffer zones, protection of river banks, erosion
control, water management, uncontrolled charcoal production, agro-forestry, tree planting, etc.).
Activities (by whom, where, when, how -inputs and responsibilities)
3.2 Capacity Building
Farmer Field School Number of PFS/FFS groups and plots in the Target catchment/communities
Number of FFS facilitators (trained by project, trained by others)
Number of farmers in FFS (Male and female and youth (what age?)
Number of poor in FFS (male and female) and access to land and water
Activities (SLM and income generation and other (nutrition, business management e.t.c)
Trainings Training of trainers, technicians and policy makers
Trainings of land users on income generating activities
Trainings of land users on SLM at catchment/community level
3.3 Collaboration and Co-financing
o Letters of agreement and MOUs (who with, what for and amounts) o Co-funding amount (in kind; cash) and proportion by Government, private sector, projects, NGOs e.t.c) o Other areas of collaboration (ongoing; in pipeline)

3.3 Upscaling process and sustainability (Explain how activities will be upscaled and sustained through partnership, income generating (including PFS and FFS)
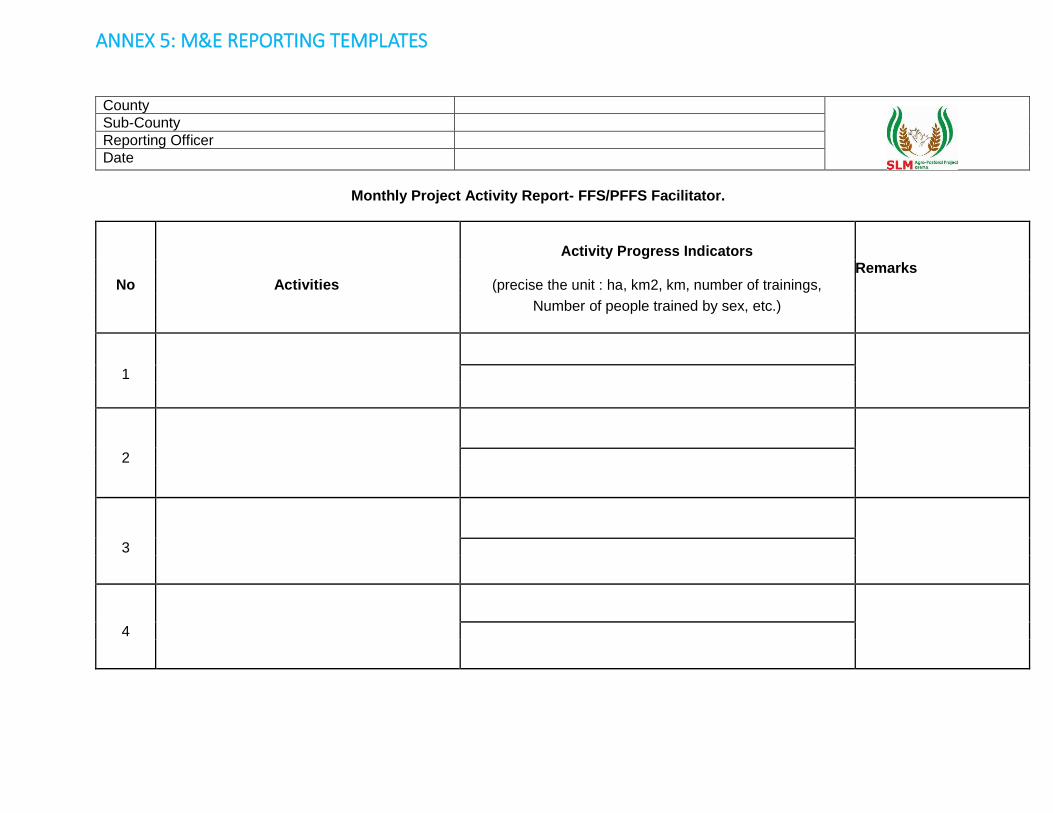
ANNEX 5: M&E REPORTING TEMPLATES
County
Sub-County
Reporting Officer
Date
Monthly Project Activity Report- FFS/PFFS Facilitator.
No Activities
Activity Progress Indicators Remarks
(precise the unit : ha, km2, km, number of trainings,
Number of people trained by sex, etc.)
1
2
3
4
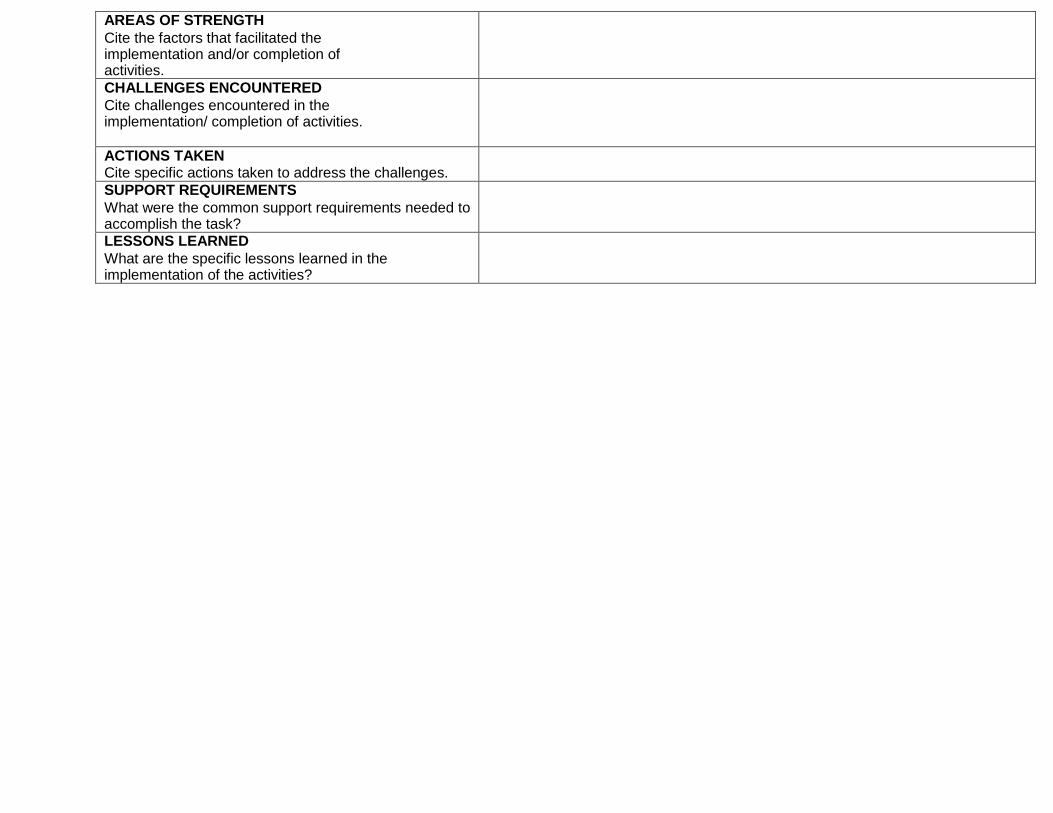
AREAS OF STRENGTH Cite the factors that facilitated the implementation and/or completion of activities.
CHALLENGES ENCOUNTERED Cite challenges encountered in the implementation/ completion of activities.
ACTIONS TAKEN Cite specific actions taken to address the challenges.
SUPPORT REQUIREMENTS What were the common support requirements needed to accomplish the task?
LESSONS LEARNED What are the specific lessons learned in the implementation of the activities?

County
Sub-County
Reporting Officer
Date
Quarterly Project Activity Report- by Sub-County Facilitator
Sub-County Level
Activity Progress Indicators Quarter : Remarks
No
Outputs- Activities (precise the unit : ha, km2, km,
(explain reasons if low rate of
number of trainings, number of
achievement and mitigation
Rate of
people trained by sex, etc.)
actions)
Planned Achieved achievement
%
Output
Output

Add rows as necessary to report on all outputs and activities relevant for the quarter
AREAS OF STRENGTH Cite the factors that facilitated the implementation and/or completion of activities.
CHALLENGES ENCOUNTERED Cite challenges encountered in the implementation/ completion of activities.
ACTIONS TAKEN Cite specific actions taken to address the challenges.
SUPPORT REQUIREMENTS What were the common support requirements needed to accomplish the task?
LESSONS LEARNED What are the specific lessons learned in the implementation of the activities?
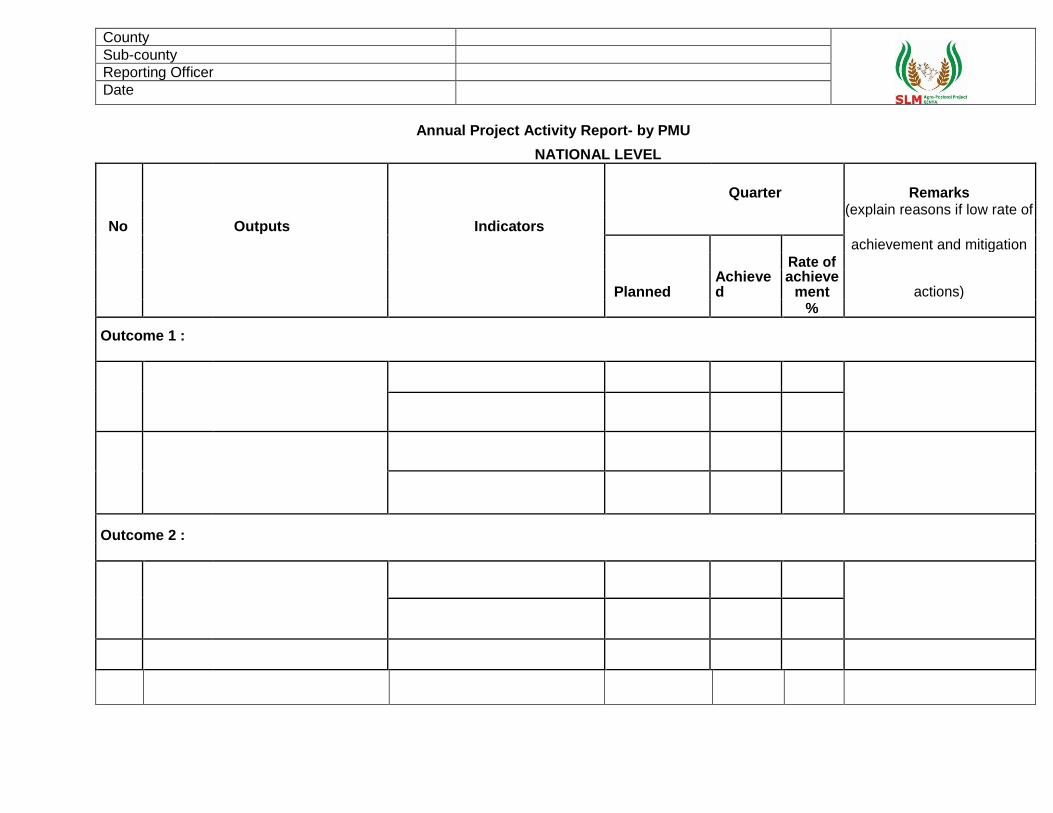
County
Sub-county
Reporting Officer
Date
Annual Project Activity Report- by PMU
NATIONAL LEVEL
Quarter Remarks
No
Outputs Indicators (explain reasons if low rate of
achievement and mitigation
Rate of
actions)
Planned Achieved
achievement
%
Outcome 1 :
Outcome 2 :
Outcome 3:
Outcome 4:
Add rows as necessary to report on all outputs and activities relevant for the quarter
AREAS OF STRENGTH Cite the factors that facilitated the implementation and/or completion of activities.
CHALLENGES ENCOUNTERED Cite challenges encountered in the implementation/ completion of activities.
ACTIONS TAKEN Cite specific actions taken to address the challenges.
SUPPORT REQUIREMENTS What were the common support requirements needed to accomplish the task?
LESSONS LEARNED What are the specific lessons learned in the implementation of the activities?