mobile application for the purpose of marketing, product
TRANSCRIPT
Mobile application for the purposeof marketing, product distributionand location-based logistics for
elderly farmersSumitra Nuanmeesri
Suan Sunandha Rajabhat University, Bangkok, Thailand
AbstractThis research has developed a one-stop service supply chain mobile application for the purpose of marketing,product distribution and location-based logistics for elderly farmers and consumers in accordance with theThailand 4.0 economic model. This is an investigation into the agricultural product distribution supply chainwhich focuses on marketing, distribution and logistics using the Dijkstra’s and Ant Colony Algorithms torespectively explore the major and minor product transport routes. The accuracy rate was determined to be97%. The application is congruent with the product distribution, supply chain, in a value-based economy. Theeffectiveness of the mobile application was indicated to be at the highest level of results of learning outcomes,user comprehension and user experience of users. That is, the developedmobile application could be effectivelyused as a tool to support elderly farmers to distribute their agricultural products in the one-stop service supplychain which emphasizes marketing, distribution and location-based logistics for elderly farmers andconsumers with respect to Thailand 4.0.
Keywords Mobile application, Elderly, Supply chain, Location-based logistics, Distribution,
Dijkstra’s algorithm, Ant Colony Algorithm
Paper type Original Article
Mobileapplication forelderly farmers
© Sumitra Nuanmeesri. Published in Applied Computing and Informatics. Published by EmeraldPublishing Limited. This article is published under the Creative Commons Attribution (CC BY 4.0)license. Anyone may reproduce, distribute, translate and create derivative works of this article (for bothcommercial and non-commercial purposes), subject to full attribution to the original publication andauthors. The full terms of this license may be seen at http://creativecommons.org/licences/by/4.0/legalcode
I would like to express my gratitude to the National Research Council of Thailand who granted aresearch fund for this project. I, moreover, would like to expressmy thankfulness to Institute of Researchand Development, Suan Sunandha Rajabhat University for facilitating this research project.
Declaration of Competing Interest: He authors declare that they have no known competingfinancial interests or personal relationships that could have appeared to influence the work reported inthis paper.
Publishers note: The publisher wishes to inform readers that the article “Mobile application for thepurpose of marketing, product distribution and location-based logistics for elderly farmers” wasoriginally published by the previous publisher of Applied Computing and Informatics and thepagination of this article has been subsequently changed. There has been no change to the content ofthe article. This change was necessary for the journal to transition from the previous publisher to thenew one. The publisher sincerely apologises for any inconvenience caused. To access and cite thisarticle, please use Nuanmeesri, S. (2020), “Mobile application for the purpose of marketing, productdistribution and location-based logistics for elderly farmers”, New England Journal ofEntrepreneurship, Vol. ahead-of-print No. ahead-of-print. https://10.1016/j.aci.2019.11.001. Theoriginal publication date for this paper was 06/11/2019.
The current issue and full text archive of this journal is available on Emerald Insight at:
https://www.emerald.com/insight/2210-8327.htm
Received 28 July 2019Revised 4 October 2019
Accepted 3 November 2019
Applied Computing andInformatics
Emerald Publishing Limited2210-8327
DOI 10.1016/j.aci.2019.11.001
1. IntroductionThailand, likemany countries, is an aging society, with an increase in elderly people (60 yearsold or above) from 6.8% in 1994 to 14.9% in 2014. In 1994, elderly people accounted for 6.8%of the total population; 45.1% of them were males and 54.9% of them were females. By 2002,2007 and 2011, the figures rose to 9.4%, 10.7% and 12.2%, respectively. To be considered anaging society, 10% or more of the population have to be aged 60 years old and above, alongwith a decrease in the child andworking demographic [17,22]. Scholars predicted that by 2025there will be 14.4 million elderly people living in Thailand, making up 27% of the totalpopulation by 2050. Meanwhile, the average life expectancy of females is expected to behigher than males by 4–5 years. The elderly are considered to be valuable because of theirknowledge and experience. These members of society may still contribute by continuing towork in agriculture, which is associated with positive mental and physical health benefits.The ability to continue to earn an income rather than relying on a pension or provident fundcould continue to make them proud of themselves, and similarly, continuing to do businessassists in minimizing the risk of loneliness, and depression, among the elders.
Seeing that agriculture and animal husbandry have been continuously practiced asprimary occupations in Thailand. Thai agricultural products are diversely and authenticallyoffered in different regions. These occupations are important as they are the foundation ofthe country, with exports of agricultural products such as rice, rubber, fruit and otherproducts being important. Traditionally, farmers transfer their agricultural knowledge andpractices from generation to generation. However, now elderly farmers are experiencing adifficulty in finding successors. These elders cannot conveniently distribute or transporttheir products by themselves and are more susceptible to being exploited. In case of massproduction without the notification of marketplaces or a fair-trade price, agricultural goodsare at risk of being damaged or spoiling, while waiting for buyers. For some elderly farmers,they may have problems with finding a marketplace or customers. These farmers mayeventually go bankrupt, or need to close down their agricultural business, leading to thediscontinuing of the supply chain or an unbalanced relationship between suppliers andconsumers.
In this digital era, the government has supported the application of technologies and newinnovations. Integration of technology to the market can be supported by the development ofmobile applications for elderly farmers, enabling them to promote their products, improveselling channels, and in securing a fair price. This can improve the livelihood of the farmers,make them proud of themselves, and help them expand their distribution channels bythemselves so that they are not a burden on society. Furthermore, such an application canassist society in preserving agricultural careers, as these elderly farmers are experts in theirfield. That theymay lackmarketing knowledge, theymay be supported by technology, whichadds value to their products.
This research thus aims to develop a one-stop service supply chain mobile applicationfocusing on marketing, product distribution and location-based logistics for elderly farmersand consumers in accordance with Thailand 4.0 and contributing to a value-based economy.Thiswill benefit the farmers by giving a platform to promote their products inwhich they canidentify the quantity, price, on-sale dates and locations of the product marketplaces. If there isa prospective buyer in the system, the application will build the connection and show the listof buyers who are interested in purchasing a product directly. To find a route for distributingproducts is a complicated dilemma since the transportation routes resemble graphs. Thisstudy applies the Dijkstra’s and the Ant Colony Algorithms (Section 2), to present the majorand minor routes for the distributors (respectively), who would like to make better decisionswith regard to goods delivery. If there is a consumer or a buyer who is interested in a farmer’sreleased product, the application will show the list of items alongside the routes, as well as thedistance between the farmer and buyer, allowing buyers to directly contact the farmer,
ACI

purchase, and pick up the product (Section 3). This technology will help the elderly farmers toprofit from agriculture (Section 4).
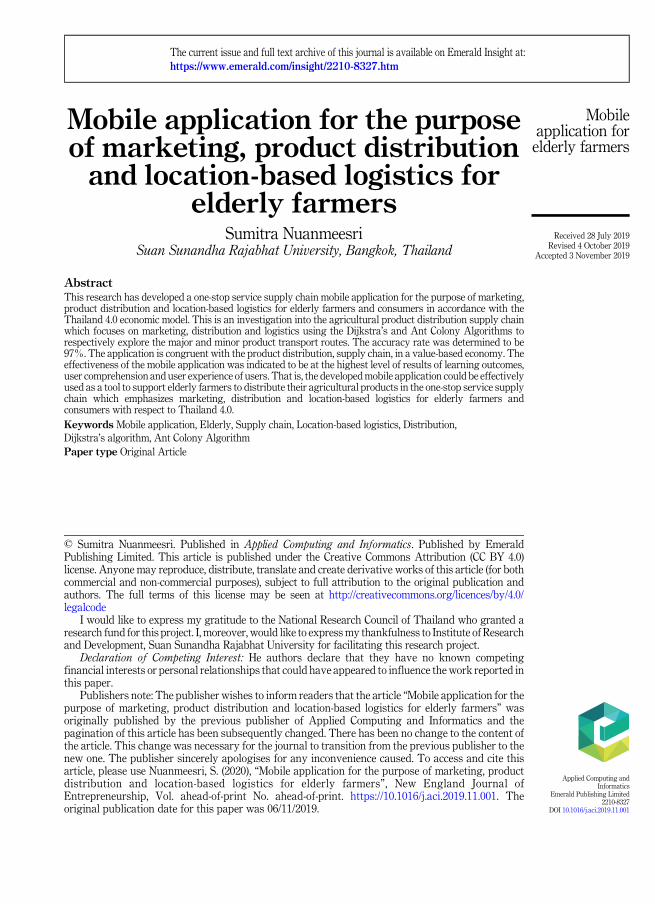
2. Related works2.1 Graph theory in the shortest path problemIn the graph theory, the shortest path problem refers to the problem of finding a path betweentwo vertices (or nodes) in a graph by which the total sum of the edges weights isminimum [23].
The components of graph G 5 (V, E) in which.
– the set of vertex is indicated by V(G)
– the set of edge is indicated by E(G)
According to Figure 1, the results will be:
V(G) 5 {A,B,C,D,E}
E(G) 5 {e1, e2, e3, e4, e5, e6, e7}
There are some specific types of graphs which demonstrate additional information and/orpresent certain limitations as follows [10,13].
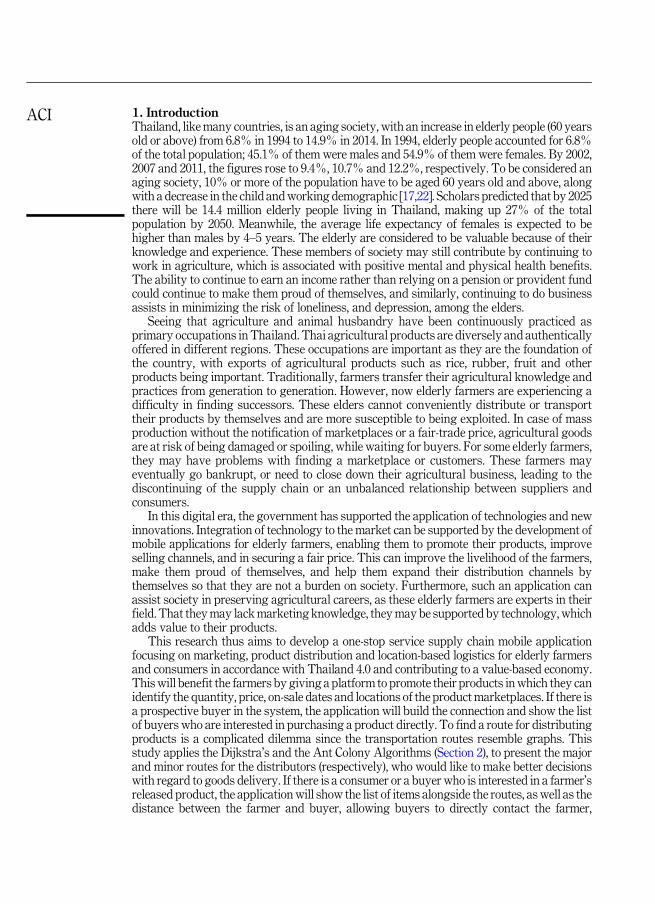
2.1.1 Directed graph. A directed graph is a graph where each arc is one directional. Thisrefers to an arc between two nodes which only indicates the possibility of moving from onenode to another but not in the opposite direction. The arcs are generally drawn as arrows topoint out the directions. An example of a potential use of a directed graph is to track possiblestates that a computer could identify; there are numerous ways for a computer in one state tofind a path to reach another state, but there is no way to immediately return from the secondpoint to the first, as illustrated in Figure 2(A). One can formally define a directed graph asG5 (V, E), consisting of a set V of nodes and set E of edges, which are pairs of V elements putin order.
2.1.2 Weighted graph. A weighted graph is a graph where some ‘cost’ is associated witheach arc. In general, each edge in a weighted graph has a numerical value called ‘weight’.Given below is an example of a weighted graph; each small numerical digit will appeardirectly adjacent to every arc to display its cost. A typical use of a weighted graph is theplanning of routes between locations on a map where the ‘cost’ associated with the arc wouldbe the distance between two locations, as shown in Figure 2(B). Figure 2(C) shows a directedweighted graph. It should be noted that in the aforementioned graphs all the weights arepositive, but negatives (and zero) weights are also allowed.
2.1.3 Tree graph. A tree graph is a special graph where every connected node can bereached from every other node in relation to each arc; the number of arcs is fewer than thenumber of nodes by exactly one point. A tree is regularly drawnwith a node so-called ‘the rootnode’ at the top of the diagram, and then grows downwards with arcs and nodes getting
Figure 1.An example of graph.
Mobileapplication forelderly farmers
further and further from the root. Correspondingly, nodes can be grouped according to theirdistances from the root. Every node expanding from the root is referred to as a descendant ofthe root node to which it is connected and one point next to the root. This kind of node is alsocalled a parent node of its descendant. Every node has one parent node only, but each parentnode can have one or more descendants. Nodes without any descendent are frequentlyaddressed ‘leaf nodes’, as illustrated in Figure 2(D).
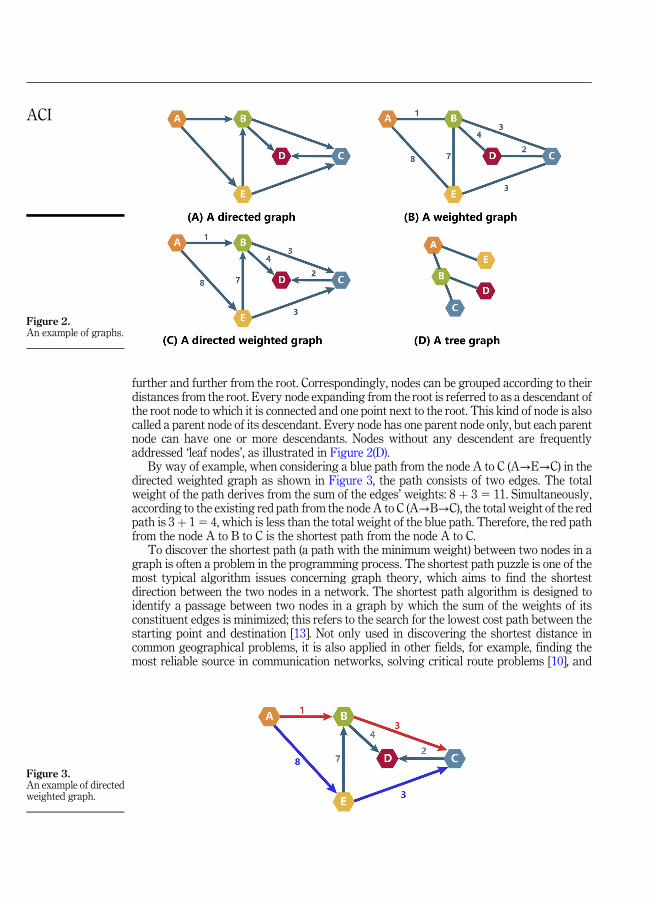
By way of example, when considering a blue path from the node A to C (A→E→C) in thedirected weighted graph as shown in Figure 3, the path consists of two edges. The totalweight of the path derives from the sum of the edges’ weights: 8 þ 3 5 11. Simultaneously,according to the existing red path from the node A to C (A→B→C), the total weight of the redpath is 3þ 15 4, which is less than the total weight of the blue path. Therefore, the red pathfrom the node A to B to C is the shortest path from the node A to C.
To discover the shortest path (a path with the minimum weight) between two nodes in agraph is often a problem in the programming process. The shortest path puzzle is one of themost typical algorithm issues concerning graph theory, which aims to find the shortestdirection between the two nodes in a network. The shortest path algorithm is designed toidentify a passage between two nodes in a graph by which the sum of the weights of itsconstituent edges is minimized; this refers to the search for the lowest cost path between thestarting point and destination [13]. Not only used in discovering the shortest distance incommon geographical problems, it is also applied in other fields, for example, finding themost reliable source in communication networks, solving critical route problems [10], and
Figure 2.An example of graphs.
Figure 3.An example of directedweighted graph.
ACI
solving the direction search problems in network routing algorithm, game design andartificial intelligence. Moreover, it is applicable when finding the shortest routes in thefollowing scenarios: the shortest path between two nodes, the shortest distance among allnodes, the K shortest path, the real-time shortest path and the shortest direction of thedesignated path. In this case, the shortest route algorithms can be classified into single-sourceshortest path algorithms and multi-source shortest path algorithms. A single-source shortestpath algorithm provides the shortest route from an assumed vertex to any other vertex. Oneof the most classic single-source shortest path algorithm is Dijkstra’s Algorithm, commonlyused in road networks. In order to interpret graphs, nodes, and branches in graph theory, it isnecessary to solve the shortest path puzzle.
2.2 Dijkstra’s AlgorithmDijkstra’sAlgorithm is an algorithmused for identifying the shortest routes between nodes ina graph, which may portray, in this case, road networks. It was conceptualized by EdsgerW.Dijkstra, a computer scientist, in 1956 and then publicized in 1959 [5]. The algorithm has beenutilized in different ways depending on the application. For instance, the original variantdeveloped by Dijkstra was employed to pinpoint the shortest path between two nodes.Nonetheless, a single node is set as the source node by a more common variant to identify theshortest paths from the source to all other nodes in the graph, creating a shortest-route tree.Given a graphG5 (V, E) with positive edgeweights, Dijkstra’sAlgorithmhas been applied totasks such as finding directions and transportation routes, without negative edgeweights, byrunning O(—V—) time operation [6,18].
The identification of the shortest routes has been determined by the use of a modifiedDijkstra’s Algorithm, and presented in the form of a Matrix with previous nodes, that followthe shortest-path tree [12]. The algorithm can reduce the repetitive procedures and find theshortest routes effectively. The application of Dijkstra’s Algorithm considers the differentweights and determines the priorities for the specific identification of starting points anddestinations. The starting points and the destinations are set as the center of their own circles.The priority is specifically fixed in the circle, when the next point is connected with a startingpoint, the process is repeated until it reaches the zone of a destination. By using the principlesof the modified Dijkstra’s Algorithm, it can be seen that the data processing time has beenoptimized when compared to the normal Dijkstra’s Algorithm [3]. The normal Dijkstra’sAlgorithm has been applied to calculate the shortest paths for network expansions, but ittends to take more time when nodes increase in each network. The modification of theDijkstra’s Algorithm is based on the Heap Sort Algorithm, a special kind of complete binarytrees, as operating in a priority queue. This research has developed a modified Dijkstra’sAlgorithm by using a complete binary tree, and node information, stored in the 3-elementcompression structure and this has lead to an improved data processing procedure andconsequently reduce the processes to O (n log n). In this study, a graph with 54 nodes isutilized to test the validity of the procedure; this will likely verify that this method offers morestability and effectiveness than other methods [11].
2.3 Ant Colony AlgorithmThe Ant Colony Algorithm is a probabilistic technique using the metaheuristic optimizationmethod for finding the best result within the time limit. This technique was inspired by thefood hunting behavior of ants. By nature, ants try to find the shortest path from the anthill totheir food by following the way marked with pheromones released from each ant. The antsfollowing the previous ones will reinforce the pheromones to improve the food trail and locatetheir resources. Pheromones, hence, are an important source of information for ants to goback and forth between the anthill and the food source. Ants use pheromones to identify the
Mobileapplication forelderly farmers
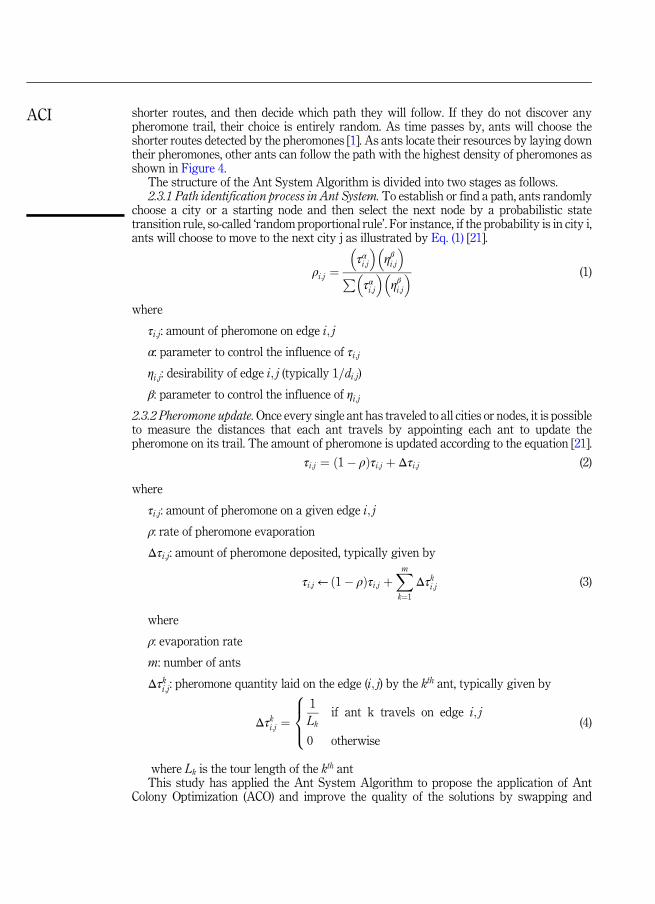
shorter routes, and then decide which path they will follow. If they do not discover anypheromone trail, their choice is entirely random. As time passes by, ants will choose theshorter routes detected by the pheromones [1]. As ants locate their resources by laying downtheir pheromones, other ants can follow the path with the highest density of pheromones asshown in Figure 4.
The structure of the Ant System Algorithm is divided into two stages as follows.2.3.1 Path identification process in Ant System. To establish or find a path, ants randomly
choose a city or a starting node and then select the next node by a probabilistic statetransition rule, so-called ‘random proportional rule’. For instance, if the probability is in city i,ants will choose to move to the next city j as illustrated by Eq. (1) [21].
ρi;j ¼�ταi;j��
ηβi;j�
P�ταi;j��
ηβi;j� (1)
where
τi;j: amount of pheromone on edge i; j
α: parameter to control the influence of τi;j
ηi;j: desirability of edge i; j (typically 1=di;j)
β: parameter to control the influence of ηi;j
2.3.2 Pheromone update.Once every single ant has traveled to all cities or nodes, it is possibleto measure the distances that each ant travels by appointing each ant to update thepheromone on its trail. The amount of pheromone is updated according to the equation [21].
τi;j ¼ ð1� ρÞτi;j þ Δτi;j (2)
where
τi;j: amount of pheromone on a given edge i; j
ρ: rate of pheromone evaporation
Δτi;j: amount of pheromone deposited, typically given by
τi;j ← ð1� ρÞτi;j þXmk¼1
Δτki;j (3)
where
ρ: evaporation rate
m: number of ants
Δτki;j: pheromone quantity laid on the edge (i; j) by the kth ant, typically given by
Δτki;j ¼
8><>:
1
Lk
if ant k travels on edge i; j
0 otherwise
(4)
where Lk is the tour length of the kth antThis study has applied the Ant System Algorithm to propose the application of Ant
Colony Optimization (ACO) and improve the quality of the solutions by swapping and
ACI
moving 2-opt and 3-opt algorithms to solve the problems in locating different productdistribution centers and managing the transportation and delivery routes. This will providethe most optimal transportation distance for each car. To find a solution for big problems, theuse of a Very Large-Scale Neighborhood (VLSN) search was performed alongside with theAnt System Algorithm [4]. The Improved Ant Colony System (IACS) was developed forsolving route management problems by applying multi-phase rewrite rules, the pheromoneupdate rule, the 2-opt local search algorithm, and the exchange method. The findings showthat the modified ant colony system gives better solutions than the normal Ant Systemmethod. Routemanagement problem falls into the NP-hard problem category, in which one ofthe solutions for this problem is the metaheuristic technique and the application of ACO.After computing the results, it was revealed that service-level price change can affect overallspending. If the level of service is high, the overall spending will also be high [2]. Thecombination of ACO and Emergency Material Scheduling (EMS) establishes an effectiveemergency rescue system, by which its functions involve material management, cityinformation management, vehicle management, emergency call center and rescue operation.The multi-objective optimization programming is occasionally difficult to operate due tomulti-objective constraints. In such cases, it is important to solve the problem with optimalmulti-vehicle scheduling. The Pareto optimal solution is the optimization by DataEnvelopment Analysis (DEA), providing the best scheme of time balance [7]. In addition,ACO is also viewed as a basic algorithm used together with other algorithms. Hybrid GeneticACO is often applied to solve the EMS model problem where Genetic Algorithm (GA) isemployed for searching the primary solution universally and rapidly. Subsequently, theresult is interpreted as the fundamental pheromone distribution of the ACO. The positivefeedback mechanism and parallelism of ACO are used for operating the optimizationefficiently [9]. The Multi-objective EMS model for multi-reserve depots and multi-supplydepots is designed by using a hybrid intelligent algorithm based on non-dominated sortinggenetic algorithm II (NSGA-II) and ACO to solve the problem. For the problem-solving, two-dimensional binary chromosome coding, corresponding crossover frequencies and mutationoperations are applied, and an improved coding strategy is proposed to determine thepossible conflict of the EMS between multiple supply depots [25]. The ultimate goal of theEMSmodel based on emergency relief characteristics is to discover the shortest delivery timeby considering both the road conditions and the material shortage in demand depots. Theimproved fish-swarm ant colony optimization (FSACO) is also designed for optimizationpurposes [27], alongside the Hybrid algorithm based on artificial immunity and ant colonyoptimization algorithm. With this hybrid algorithm, the Pareto optimization model can beused for calculating the congestion degree, while the population is determined by the ant
Figure 4.The simulation of ants’
food tracking.
Mobileapplication forelderly farmers

colony optimization algorithm. By applying the rapid global convergence, randomness of theimproved immune algorithm, the distributed search ability and positive feedback ability ofthe ACO algorithm, a better solution set is achieved speedily [26]. ACO is a probabilisticalgorithm adopted for identifying the optimal route; the features of this algorithm includepositive information feedback, distributed computing and heuristic search. It is basically aheuristic global optimization approach under the evolutionary algorithm processing.Furthermore, this algorithm can be used for solving route management problems with timelimitations, regardless of the level of service. The solutions given by this algorithm areusually more practical than other algorithms.
3. MethodologyThe research methods adopted in the development process for the mobile application for thepurpose of marketing, product distribution and location-based logistics for elderly farmers,include the following steps:
3.1 Data collectionDistribution information for the agricultural products was studied to understand the supplychain as produced by elderly farmers based on the feedback of volunteer groups whocommunicated via social media for a period of 90 days. They were divided into three groups,which comprised 20 agricultural producers/suppliers, 20 prospective distributors, and 20prospective buyers. Each volunteer contacted the team by telephone and full informationabout the survey was provided and all queries were answered. This was performed withregard to the marketing, and selling of products, the buying process of the buyers, and theproduct delivery process.
3.2 Exploring the shortest routesExploring the shortest routes to distribute products, was done by the developed mobileapplication which is connected to the Google Map API to portray the map of transportationroutes, from the starting point to the destinations. This research applied Dijkstra’s Algorithmto support the mobile application in determining the shortest paths. Goods transportation inThailand is usually a high cost due to traffic congestion and speed restrictions in urban areas,this study thus modified the Dijkstra’s Algorithm to identify the shortest paths as rapidlypossible with reasonable capital as illustrated by Eq. (5).
D½s; t� ¼ min
Xj
i¼1
�di;j
spi;jð1þ ORÞ
�!ðtypically 0≤OR≤ 1; i∈ n; j∈ nÞ (5)
where
D½s; t�: shortest distance from node s to t
s: original source (or current node)
t: target or destination node
n: set of all nodes from node s to t
i: node in the path between node s to t
j: the next node from node i (adjacent of node i)
di;j: distance from node i to j
ACI
spi;j: maximum speed or speed limit from node i to j
OR: occupancy ratio (traffic congestion levels), typically given by:
0.0–0.2 is no traffic delays
0.3–0.7 is medium amount of traffic
0.8–1.0 is high traffic delays
The occupancy ratio was calculated by CCTV cameras which are installed on various streetsor roads. These cameras collect the video streams for counting the number of vehicles andthen translate this data into the traffic congestion level in metropolitan areas.
The researchers used the fourth equation and applied the Ant Colony Algorithm torecommend minor routes for distributing products. The system stores the routes that havebeen used for transporting products from the start to the finish/end point, and then records theroute suggestions from the distributors who have provided their routes, for calculating theshortest path from the data in the database. The information is then presented on the mobileapplication and can be seen by other product distributors accordingly, as shown in Figure 5.
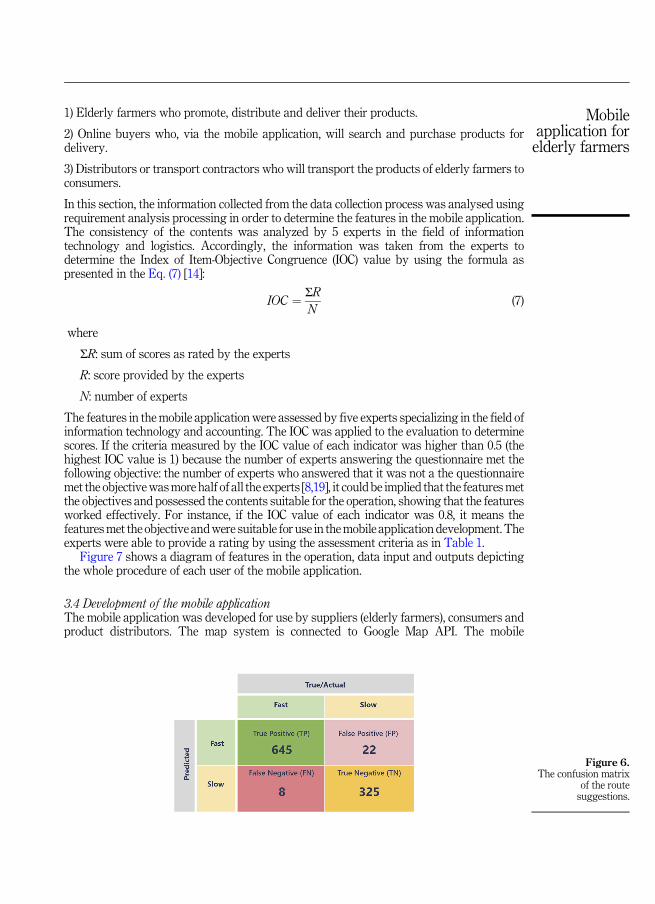
By applyingDijkstra’s and theAnt ColonyAlgorithms, 50 vehicle samples which includedmotorcycles and cars that voluntarily took the accuracy test, were used in the exploration ofmain and minor routes. The result showed that it was 97% accurate. Accurate efficiency wasevaluated using their accuracy show in equation [20,24].
Accuracy ¼ ðTP þ TNÞðTP þ FP þ FN þ TNÞ (6)
where
TP: path that reaches the destination is fast, with a given path that allows reaching thedestination quickly
TN: path that reaches the destination is slow, in a given path that allows reaching thedestination slowly
FP: path that reaches the destination is fast, in a given path allowing to reach thedestination slowly
FN: path that reaches the destination is slow, in a given path that tends to reach thedestination quickly
Figure 6 shows the confusionmatrix with 1,000 samples, the values of TP, TN, FP and FN are645, 325, 22 and 8.
From the confusion matrix of the route suggestions can calculate the value of accuracy asfollows.
Accuracy ¼ ð645þ 325Þð645þ 22þ 8þ 325Þ
¼ 0:97 3 100
¼ 97%
3.3 Design of the mobile applicationThe design of the mobile application is based on the documentary research andtransportation route analysis which consists of:
Mobileapplication forelderly farmers
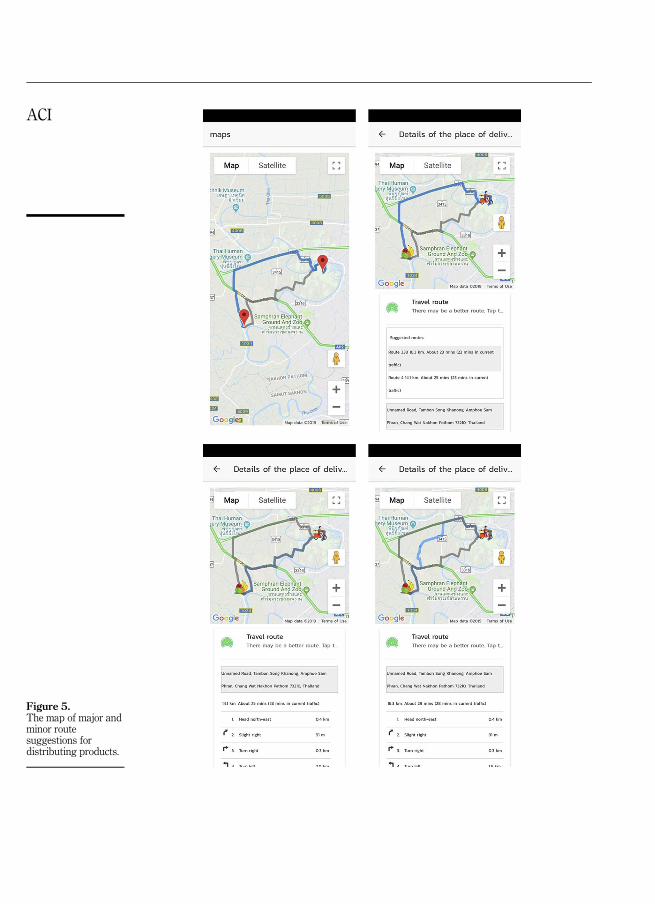
Figure 5.The map of major andminor routesuggestions fordistributing products.
ACI
1) Elderly farmers who promote, distribute and deliver their products.
2) Online buyers who, via the mobile application, will search and purchase products fordelivery.
3) Distributors or transport contractors who will transport the products of elderly farmers toconsumers.
In this section, the information collected from the data collection process was analysed usingrequirement analysis processing in order to determine the features in the mobile application.The consistency of the contents was analyzed by 5 experts in the field of informationtechnology and logistics. Accordingly, the information was taken from the experts todetermine the Index of Item-Objective Congruence (IOC) value by using the formula aspresented in the Eq. (7) [14]:
IOC ¼ ΣRN
(7)
where
ΣR: sum of scores as rated by the experts
R: score provided by the experts
N: number of experts
The features in themobile applicationwere assessed by five experts specializing in the field ofinformation technology and accounting. The IOC was applied to the evaluation to determinescores. If the criteria measured by the IOC value of each indicator was higher than 0.5 (thehighest IOC value is 1) because the number of experts answering the questionnaire met thefollowing objective: the number of experts who answered that it was not a the questionnairemet the objectivewasmore half of all the experts [8,19], it could be implied that the featuresmetthe objectives and possessed the contents suitable for the operation, showing that the featuresworked effectively. For instance, if the IOC value of each indicator was 0.8, it means thefeaturesmet the objective andwere suitable for use in themobile application development. Theexperts were able to provide a rating by using the assessment criteria as in Table 1.
Figure 7 shows a diagram of features in the operation, data input and outputs depictingthe whole procedure of each user of the mobile application.
3.4 Development of the mobile applicationThe mobile application was developed for use by suppliers (elderly farmers), consumers andproduct distributors. The map system is connected to Google Map API. The mobile
Figure 6.The confusion matrix
of the routesuggestions.
Mobileapplication forelderly farmers

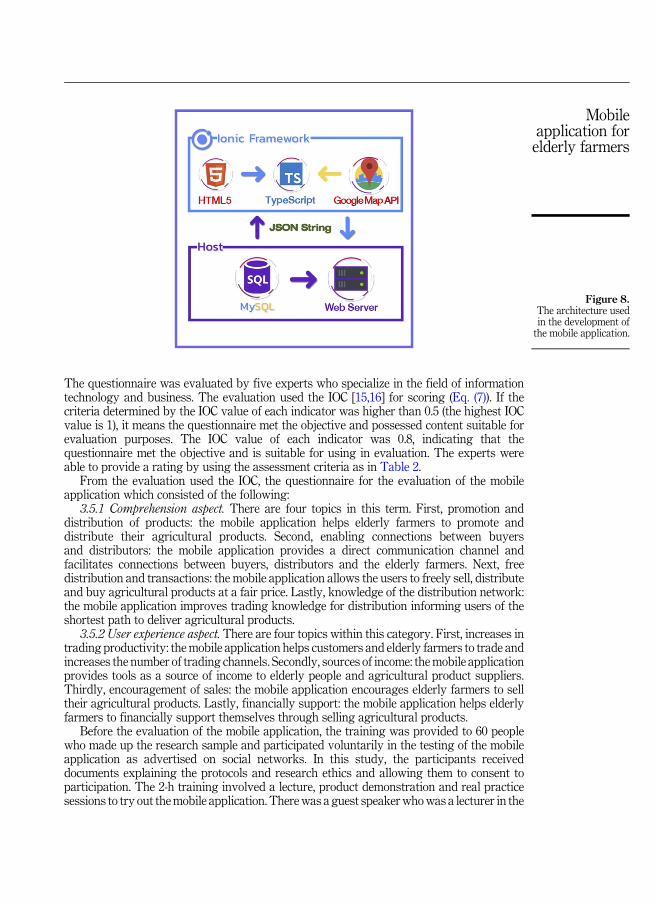
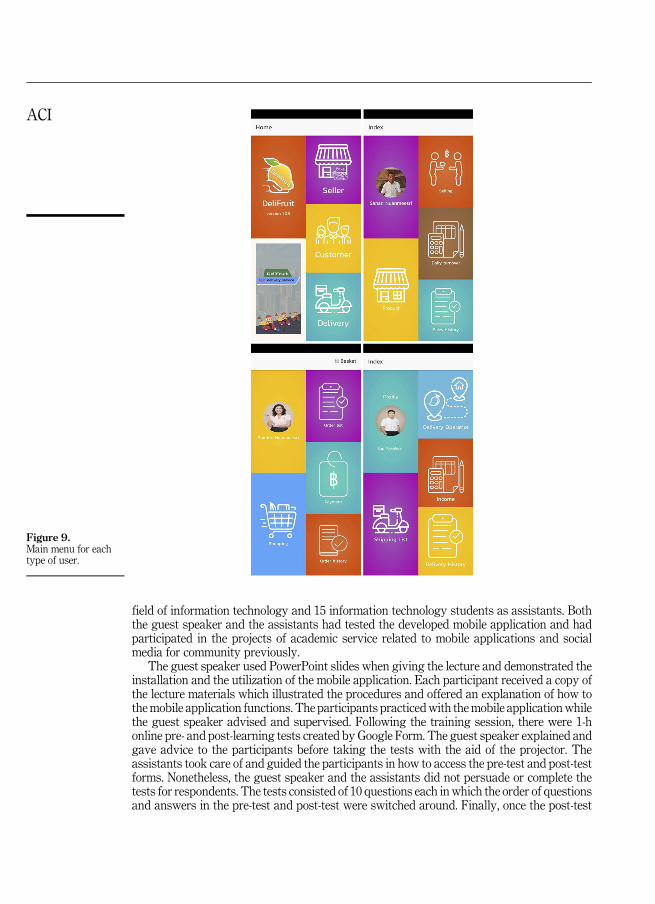
application was developed based on the ionic framework which allowed the application towork with iOS and Android operational systems. The architecture consists of HTML,TypeScript and Google Map API. The process involves the information hyperlinks on webserver which is the host service for clients. JavaScript Object Notation (JSON) is applied toshare the data, while the data is stored in MySQL database showing the architecture used inthe development of the mobile application as shown in Figure 8. Examples of the mobileapplication in operation are depicted Figures 9–11.
3.5 Evaluation of the mobile applicationThe mobile application was evaluated by 60 respondents. The sample consisted of 20agricultural producers or suppliers, 20 prospective distributors, and 20 prospective buyers;they voluntarily registered for the training which was offered in the form of a groupdemonstration. So, researchers had no information with regard to farmer identification andtheir performance. Thiswas the basis uponwhich ethics approval was obtained for the study.
Rating criteria Meaning
1 There is content consistency, showingsuitability for inclusion as a feature inthe application.
0 Uncertainty in content consistency andinappropriateness for use as a feature inthe mobile application.
�1 No content consistency and cannot workas a feature in the mobile application.
Figure 7.Diagram of features inthe operation of themobile application.
Table 1.Rating criteria forcontent consistencyand identifyingfeatures in the mobileapplicationdevelopment.
ACI
The questionnaire was evaluated by five experts who specialize in the field of informationtechnology and business. The evaluation used the IOC [15,16] for scoring (Eq. (7)). If thecriteria determined by the IOC value of each indicator was higher than 0.5 (the highest IOCvalue is 1), it means the questionnaire met the objective and possessed content suitable forevaluation purposes. The IOC value of each indicator was 0.8, indicating that thequestionnaire met the objective and is suitable for using in evaluation. The experts wereable to provide a rating by using the assessment criteria as in Table 2.
From the evaluation used the IOC, the questionnaire for the evaluation of the mobileapplication which consisted of the following:
3.5.1 Comprehension aspect. There are four topics in this term. First, promotion anddistribution of products: the mobile application helps elderly farmers to promote anddistribute their agricultural products. Second, enabling connections between buyersand distributors: the mobile application provides a direct communication channel andfacilitates connections between buyers, distributors and the elderly farmers. Next, freedistribution and transactions: the mobile application allows the users to freely sell, distributeand buy agricultural products at a fair price. Lastly, knowledge of the distribution network:the mobile application improves trading knowledge for distribution informing users of theshortest path to deliver agricultural products.
3.5.2 User experience aspect. There are four topics within this category. First, increases intrading productivity: themobile application helps customers and elderly farmers to trade andincreases the number of trading channels. Secondly, sources of income: themobile applicationprovides tools as a source of income to elderly people and agricultural product suppliers.Thirdly, encouragement of sales: the mobile application encourages elderly farmers to selltheir agricultural products. Lastly, financially support: the mobile application helps elderlyfarmers to financially support themselves through selling agricultural products.
Before the evaluation of the mobile application, the training was provided to 60 peoplewho made up the research sample and participated voluntarily in the testing of the mobileapplication as advertised on social networks. In this study, the participants receiveddocuments explaining the protocols and research ethics and allowing them to consent toparticipation. The 2-h training involved a lecture, product demonstration and real practicesessions to try out themobile application. Therewas a guest speakerwhowas a lecturer in the
Figure 8.The architecture usedin the development ofthe mobile application.
Mobileapplication forelderly farmers
field of information technology and 15 information technology students as assistants. Boththe guest speaker and the assistants had tested the developed mobile application and hadparticipated in the projects of academic service related to mobile applications and socialmedia for community previously.
The guest speaker used PowerPoint slides when giving the lecture and demonstrated theinstallation and the utilization of the mobile application. Each participant received a copy ofthe lecture materials which illustrated the procedures and offered an explanation of how tothemobile application functions. The participants practicedwith themobile applicationwhilethe guest speaker advised and supervised. Following the training session, there were 1-honline pre- and post-learning tests created by Google Form. The guest speaker explained andgave advice to the participants before taking the tests with the aid of the projector. Theassistants took care of and guided the participants in how to access the pre-test and post-testforms. Nonetheless, the guest speaker and the assistants did not persuade or complete thetests for respondents. The tests consisted of 10 questions each in which the order of questionsand answers in the pre-test and post-test were switched around. Finally, once the post-test
Figure 9.Main menu for eachtype of user.
ACI
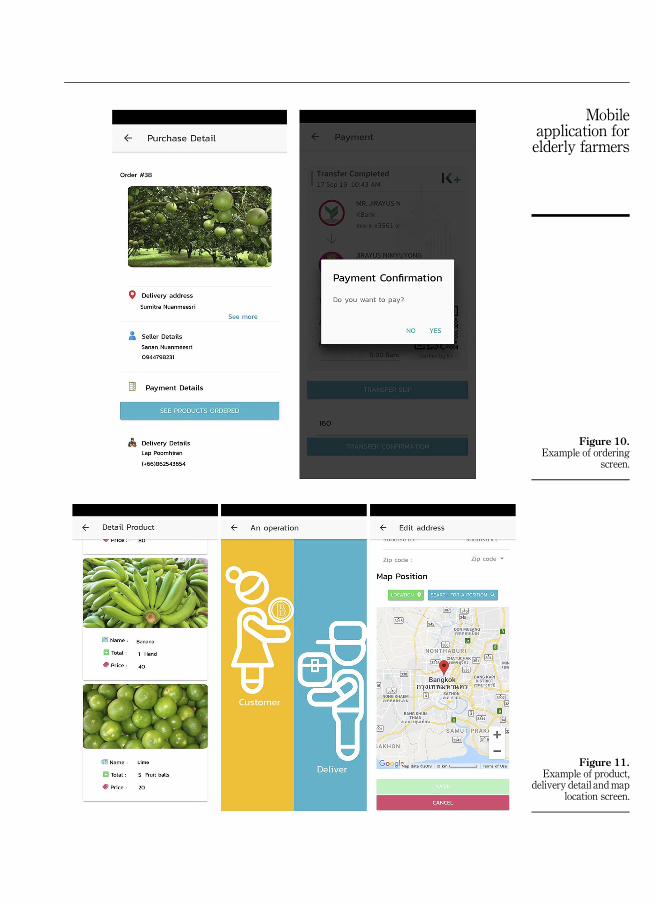
Figure 10.Example of ordering
screen.
Figure 11.Example of product,
delivery detail andmaplocation screen.
Mobileapplication forelderly farmers

was completed by all of the participants, the guest speaker gave the answers and statedwhere the training materials were published and could be downloaded. This included themobile application demonstration video which was published on social media for the seniorusers to review and gave further information about the application.
In the evaluation of the mobile application online questionnaire, the data obtained wasanalyzed to gain the mean value, the standard deviation value and percentage.
4. ResultsIn this section, we provide the results of learning outcome scores, comprehension aspect anduser experience aspect.
4.1 The evaluation from the learning outcomesThe effectiveness of the application learning outcome scores were obtained from the 60respondents via a test before and after the training. There were 10 questions in each test withthe questions and the answers switched to ensure difference between the tests. The resultsshowed that the respondents, post training, had better learning results when compared to theresults prior to training, as shown in Figures 12–14.
4.2 The effectiveness evaluation the mobile application from comprehension aspect and userexperience aspectThe evaluation indicators for the developed mobile application was assessed by 60respondents who made up the test group in terms of the comprehension and user experienceaspects. The data was analyzed to find the mean value and the standard deviation valueaccording to the scoring criteria of the Likert Scale [21] to rate, as shown in Table 3.
The evaluation results collected from the sample showed that, in terms of comprehensionand user experience, the comprehension aspect was determined to have a mean of 4.56 and a
Rating criteria Meaning
1 There is content consistency andthe application works.
0 Uncertainty in content consistencyand application workability.
�1 No content consistency, norit cannot work.
Table 2.Rating criteria forcontent consistencyand applicationworkability.
Figure 12.The learning results ofthe mobile applicationutilization by farmers.
ACI

standard deviation of 0.50; and the user experience aspect was rated with a mean of 4.60 andstandard deviation of 0.49. This indicates that the mobile application is an effective tool at ahigh level, the arithmetic meanwas 4.58 and the standard deviation was 0.49, suggesting thatthe supply chain mobile application in relation to marketing, product distribution andlocation-based logistics for elderly farmers and buyers was at the highest level, as presentedin Table 4.
Scale Range of Weighted Mean Level of effective mobile application
5 4.51–5.00 The highest4 3.51–4.50 The high3 2.51–3.50 The medium2 1.51–2.50 The little1 1.00–1.50 The least
Figure 14.The learning results ofthe mobile applicationutilization by product
consumers.
Table 3.Scoring criteria for
evaluating the mobileapplication.
Figure 13.The learning results ofthe mobile applicationutilization by product
distributors.
Mobileapplication forelderly farmers
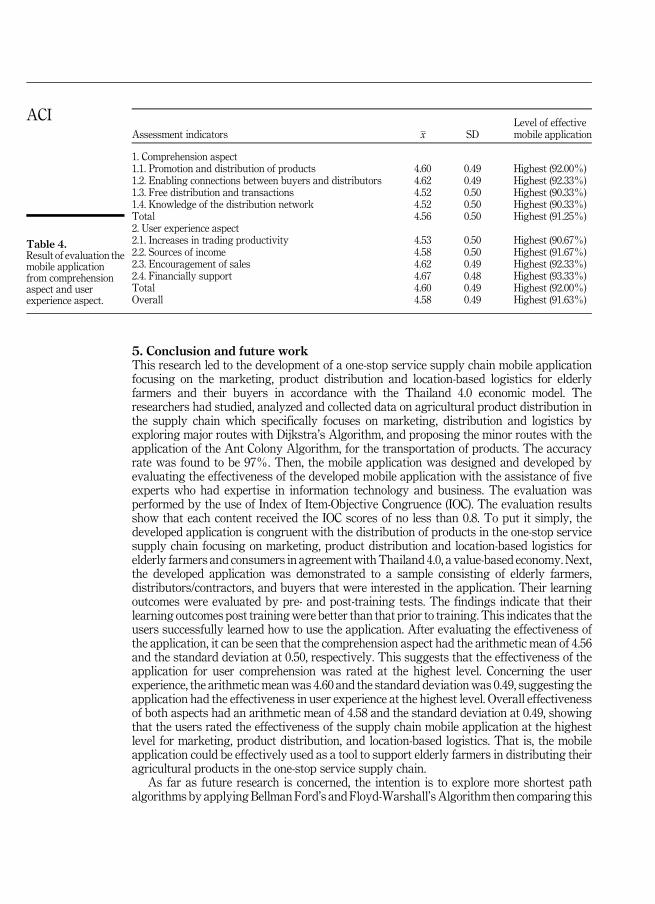
5. Conclusion and future workThis research led to the development of a one-stop service supply chain mobile applicationfocusing on the marketing, product distribution and location-based logistics for elderlyfarmers and their buyers in accordance with the Thailand 4.0 economic model. Theresearchers had studied, analyzed and collected data on agricultural product distribution inthe supply chain which specifically focuses on marketing, distribution and logistics byexploring major routes with Dijkstra’s Algorithm, and proposing the minor routes with theapplication of the Ant Colony Algorithm, for the transportation of products. The accuracyrate was found to be 97%. Then, the mobile application was designed and developed byevaluating the effectiveness of the developed mobile application with the assistance of fiveexperts who had expertise in information technology and business. The evaluation wasperformed by the use of Index of Item-Objective Congruence (IOC). The evaluation resultsshow that each content received the IOC scores of no less than 0.8. To put it simply, thedeveloped application is congruent with the distribution of products in the one-stop servicesupply chain focusing on marketing, product distribution and location-based logistics forelderly farmers and consumers in agreementwithThailand 4.0, a value-based economy. Next,the developed application was demonstrated to a sample consisting of elderly farmers,distributors/contractors, and buyers that were interested in the application. Their learningoutcomes were evaluated by pre- and post-training tests. The findings indicate that theirlearning outcomes post trainingwere better than that prior to training. This indicates that theusers successfully learned how to use the application. After evaluating the effectiveness ofthe application, it can be seen that the comprehension aspect had the arithmetic mean of 4.56and the standard deviation at 0.50, respectively. This suggests that the effectiveness of theapplication for user comprehension was rated at the highest level. Concerning the userexperience, the arithmeticmeanwas 4.60 and the standard deviationwas 0.49, suggesting theapplication had the effectiveness in user experience at the highest level. Overall effectivenessof both aspects had an arithmetic mean of 4.58 and the standard deviation at 0.49, showingthat the users rated the effectiveness of the supply chain mobile application at the highestlevel for marketing, product distribution, and location-based logistics. That is, the mobileapplication could be effectively used as a tool to support elderly farmers in distributing theiragricultural products in the one-stop service supply chain.
As far as future research is concerned, the intention is to explore more shortest pathalgorithms by applyingBellman Ford’s and Floyd-Warshall’sAlgorithm then comparing this
Assessment indicators x SDLevel of effectivemobile application
1. Comprehension aspect1.1. Promotion and distribution of products 4.60 0.49 Highest (92.00%)1.2. Enabling connections between buyers and distributors 4.62 0.49 Highest (92.33%)1.3. Free distribution and transactions 4.52 0.50 Highest (90.33%)1.4. Knowledge of the distribution network 4.52 0.50 Highest (90.33%)Total 4.56 0.50 Highest (91.25%)2. User experience aspect2.1. Increases in trading productivity 4.53 0.50 Highest (90.67%)2.2. Sources of income 4.58 0.50 Highest (91.67%)2.3. Encouragement of sales 4.62 0.49 Highest (92.33%)2.4. Financially support 4.67 0.48 Highest (93.33%)Total 4.60 0.49 Highest (92.00%)Overall 4.58 0.49 Highest (91.63%)
Table 4.Result of evaluation themobile applicationfrom comprehensionaspect and userexperience aspect.
ACI

to Dijkstar’s Algorithm. Furthermore, the mobile application will be improved to allowautomatic matching between buyers and suppliers. For example, if elderly farmers post theirproduct for sale, the application will automatically find and match customers who havepreviously requested to buy some agricultural products in the system. Finally, the applicationwill conduct an automatic search for distributors available to deliver agricultural productswithin the specified distance area.
References
[1] E. Bonabeau, M. Dorigo, G. Theraulaz, Swarm Intelligence: From Natural to Artificial Systems,Oxford University Press, New York, 1999.
[2] S.W. Changchien, C.S. Wu, An Ant Colony System for Vehicle Routing Problems with TimeWindow, Department of Information Management, Chaoyang University of Technology,Taiwan, 2009.
[3] Y. Chao, W. Hongxia, Developed dijkstra shortest path search algorithm and simulation, in:Proceedings of the International Conference on Computer Design and Applications (ICCDA), 2010,pp. 116–119.
[4] C.H. Chen, C.J. Ting, An improved ant colony system algorithm for the vehicle routing problem, J.Chin. Inst. Ind. Eng. 23 (2006) 115–126.
[5] T.H. Cormen, C.E. Leiserson, R.L. Rivest, C. Stein, Introduction to Algorithms, second ed., TheMIT Press, Cambridge, 2001.
[6] M.L. Fredman, R.E. Tarjan, Fibonacci heaps and their uses in improved network optimizationalgorithms, J. Assoc. Comput. Mach. 34 (1987) 596–615.
[7] Z. Fu, D. Luo, The logistics distribution route research of ant colony algorithm, Comput. Knowl.Technol. 10 (2014) 4255–4257.
[8] R.K. Hambleton, Test Score Validity and Standard-Setting Method, Johns Hopkins Press,Baltimore, 1980, Chapter Criterion-referenced Measurement: The State of the Art. pp. 80–123.
[9] R. Hao, Y. Li, Research on military distribution logistics vehicle routing, J. Xi’an Technol. Univ. 35(2015) 63–69.
[10] S. Hougardy, The floyd-warshall algorithm on graphs with negative cycles, Inf. Process. Lett. 110(2010) 278–281.
[11] Y. Hu, Z. Chang, L. Sun, Y. Wang, Analysis of the shortest repaired path of distribution networkbased on dijkstra algorithm, in: Proceedings of the International Conference on Energy andEnvironment Technology, 2009, pp. 73–76.
[12] X. Ji-Xian, L. Fang-Ling, An improvement of the shortest path algorithm based on dijkstraalgorithm, in: Proceedings of the 2nd International Conference on Computer and AutomationEngineering (ICCAE), 2010.
[13] D. Kong, Y.M.X. Liang, L. Zhang, Improvement and realization of dijkstra algorithm in gis ofdepot, in: Proceedings of Control, Automation and Systems Engineering, 2011, pp. 1–4.
[14] M.R. Lynn, Determination and quantification of content validity, Nurs. Res. 35 (1986) 382–385.
[15] S. Nuanmeesri, Extended study of undergraduate students’ usage of mobile application forindividual differentiation learning support of lecture-based general education subjects, Int. J.Interactive Mobile Technol. 13 (2019) 99–112.
[16] S. Nuanmeesri, L. Poomhiran, Perspective electrical circuit simulation with virtual reality, Int. J.Online Biomed. Eng. 15 (2019) 28–37.
[17] N.S. Office, Report on the 2014 Survey of the Older Persons in Thailand, National StatisticalOffice, Bangkok, 2017.
[18] D.B. Robert, Algorithm 360: shortest-path forest with topological ordering, Commun. ACM 12(1969) 632–633.
Mobileapplication forelderly farmers
[19] R.J. Rovinelli, R.K. Hambleton, On the use of content specialists in the assessment of criterion-referenced test item validity, Tijdschrift voor Onderwijsresearch 2 (1977) 49–60.
[20] S. Saichon, Data Mining, Jamjuree Products, Bangkok, 2015.
[21] A. Shekhawat, P. Poddar, D. Boswal, Ant colony optimization algorithms: introduction andbeyond, in: Artificial Intelligence Seminar, Indian Institute of Technology Bombay, 2009.
[22] H.S. Shryock, The Methods and Materials of Demography, Academic Press, New York, 2004.
[23] T. Suwannapruek, S. Prechaverakul, W. Sutiwipakorn, The development of an optimal safe pathfor trip planning, in: Proceedings of the Conference of Engineering, Prince of Songkla University,2011, pp. 105–111.
[24] A. Tharwat, Classification assessment methods, , Appl. Comput. Inf. (2018) 1–13 (in press).
[25] X. Wang, T.M. Choi, H. Liu, X. Yue, A novel hybrid ant colony optimization algorithm foremergency transportation problems during post-disaster scenarios, IEEE Trans. Syst. ManCybern. 48 (2016) 1–12.
[26] J. Zhang, H. Liu, G. Yu, J. Ruan, F.T.S. Chan, A three-stage and multi-objective stochasticprogramming model to improve the sustainable rescue ability by considering secondary disastersin emergency logistics, Comput. Ind. Eng. 135 (2019) 1145–1154.
[27] Q. Zhang, S. Xiong, Routing optimization of emergency grain distribution vehicles using theimmune ant colony optimization algorithm, Appl. Soft Comput. 71 (2018) 917–925.
About the authorSumitra Nuanmeesri received the Ph.D. degree in Information Technology from KingMongkut’s University of Technology North Bangkok. She is Assistant Professor withthe Department of Information Technology, Faculty of Science and Technology atSuan Sunandha Rajabhat University, Bangkok 10300 Thailand. Her research interestsinclude deep learning, computer vision, image processing, mobile application, supplychain management system, Augmented Reality (AR) and Virtual Reality (VR). SumitraNuanmeesri can be contacted at: [email protected]
For instructions on how to order reprints of this article, please visit our website:www.emeraldgrouppublishing.com/licensing/reprints.htmOr contact us for further details: [email protected]
ACI