mobile communications systems gsm/umts - a-anacom ltd
TRANSCRIPT

Mobile Communications Systems
GSM/UMTS
QQuuaalliittyy ooff SSeerrvviiccee AAsssseessssmmeenntt
Assessment of the QoS of Voice and Video-telephony Services, and
GSM and WCDMA Network Coverage, in the main Urban
Agglomerations and Major Roads of Mainland Portugal.
November 2009


Assessment of Voice and Video-telephony Services, and Network Coverage| Mainland Portugal | Sep.-Oct. 2009 3
ABBREVIATIONS AND ACRONYMS
CoDec Codifier/De-codifier.
CPICH RSCP Common Pilot Channel, Received Signal Code Power – Level of the signal received by a mobile terminal (WCDMA).
ETSI European Telecommunications Standards Institute – European Telecommunications Standards Institute.
GSM Global System for Mobile communications – Second generation (2G) Mobile Communications System.
ITU International Telecommunications Union – ITU International Telecommunications Union.
MOS Mean Opinion Score – Quality rate quantifying the effort to understand an end-to-end type conversation. Its limits are 0 (zero) when there is no communication and 5 (five) when the communication is perfect. The value “zero” never shows in the results since only situations where the connection was established and maintained for a given period are considered. “Five” never shows in the results either, because the CoDec7 used by mobile networks, renders impossible such high voice or video quality values (the voice or video quality reached with the CoDec usually used gives MOS values lower than 4.5).
PESQ Perceptual Evaluation of Speech Quality – Algorithm used in the analysis of the audio quality of a voice communication (Recommended by ITU: ITU-T Recommendation P.862 (02/2001); ITU-T Recommendation P.862.1 (11/2003)).
ISDN Integrated Services Digital Network – Technology used on the fixed access network.
RF Radio Frequency.
RxLev Received signal level, at a mobile (GSM) terminal (GSM).
Scanner Scanner Measurement equipment that collects radio signal levels for each channel of a frequency band.
SQuad-LQ SwissQual’s speech quality algorithm for Listening Quality – Algorithm developed by SwissQual to analyse the audio quality of a communication.
UMTS Universal Mobile Telecommunications System – Third generation (3G) Mobile Communications System.
VQuad Objective Model for Video Quality Assessment – Algorithm used in the analysis of the video quality of a communication (developed by SwissQual).
WCDMA Wideband Code Division Multiple Access – Technology used in the radio component of the UMTS communications systems.

Assessment of Voice and Video-telephony Services, and Network Coverage| Mainland Portugal | Sep.-Oct. 2009 5
Contents
I Executive Summary ..................................................................................................................................... 7
I.I General Framework ............................................................................................................................................... 7
I.II Main Results and Conclusions ............................................................................................................................... 9
1 Quality of Service Assessment ................................................................................................................. 17
1.1 Goal ...................................................................................................................................................................... 17
1.2 Services Analysed ................................................................................................................................................ 17 1.2.1 Telephony Services: ............................................................................................................................................................ 17 1.2.2 Regardless of Service: ........................................................................................................................................................ 17
2 Methodology ............................................................................................................................................... 18
2.1 Fundamentals ...................................................................................................................................................... 18
2.2 Main QoS Indicators ............................................................................................................................................. 18 2.2.1 Regardless of the Service ................................................................................................................................................... 19 2.2.2 Telephony Services ............................................................................................................................................................. 20
2.3 Measurement Profiles .......................................................................................................................................... 24 2.3.1 General Features ................................................................................................................................................................ 24 2.3.2 Coverage ............................................................................................................................................................................. 24 2.3.3 Telephony Services ............................................................................................................................................................. 25
2.4 Test/Measurement and Post-Processing System ................................................................................................ 27
3 Study Sample .............................................................................................................................................. 29
3.1 Tested Areas ........................................................................................................................................................ 29
3.2 Sample Size ......................................................................................................................................................... 31
3.3 Data Collection Conditions ................................................................................................................................... 31
4 Aggregated Results ................................................................................................................................... 32
4.1 Urban Agglomerations ......................................................................................................................................... 32 4.1.1 Voice Service ...................................................................................................................................................................... 32 4.1.2 Video-telephony Service ..................................................................................................................................................... 34 4.1.3 Network Coverage .............................................................................................................................................................. 37
4.2 Major Roads ......................................................................................................................................................... 40 4.2.1 Voice Service ...................................................................................................................................................................... 40 4.2.2 Video-telephony Service ..................................................................................................................................................... 42 4.2.3 Network Coverage .............................................................................................................................................................. 45
4.3 Global ................................................................................................................................................................... 48 4.3.1 Voice Service ...................................................................................................................................................................... 48 4.3.2 Video-telephony Service ..................................................................................................................................................... 50 4.3.3 Network Coverage .............................................................................................................................................................. 53
Appendix – Individual results, by urban agglomeration and major road.


Assessment of Voice and Video-telephony Services, and Network Coverage| Mainland Portugal | Sep.-Oct. 2009 7
I EXECUTIVE SUMMARY
I.I GENERAL FRAMEWORK
In September and October 2009 the Autoridade Nacional de Comunicações (ANACOM) carried out an
assessment of the quality of mobile services – voice, video-telephony and GSM and WCDMA (UMTS)
network coverage – provided by operators OPTIMUS, TMN and VODAFONE in the main urban
agglomerations and major roads of Mainland Portugal, by analysing technical parameters that translate
the quality perception from the consumer’s standpoint.
The methodology that was used in this study relies on field tests performed from the user’s standpoint,
by using an automatic measurement system that reflects the several features affecting the quality of the
services (end-to-end measurements). Measurements were carried out on equal terms for the three
operators, i.e. at the same time, in the same locations and with the same parameters, thus making it
possible to perform a comparative analysis of the observed performances.
The main quality indicators were analysed, considering the user’s perspective and the services under
study:
1. Network Coverage – Availability of the GSM and WCDMA (UMTS) radio networks;
2. Service Accessibility (voice or video-telephony) – probability of success when setting up calls;
3. Call set up time (voice or video-telephony) – period of time that the network takes to establish
the communication, after the correct sending of the request (target telephone number);
4. Call Termination Rate (voice or video-telephony) – Probability of a call, once successfully set
up, being maintained for a period of time, ending normally, i.e. according to the user’s will;
5. Call Audio Quality (voice or video-telephony) – perceptibility of the conversation during a call;
6. Call Video Quality (Video-telephony) – perceptibility of the communication’s video feature.
Data collection took place on working days and during normal working hours, from September 14 to
October 20, 2009. 23,971 test calls were made and 4,731,307 radio signal level measurements were
taken, amounting to approximately 218 hours of measurements over 9,916 kilometres.
The used sample provided global results for each operator, with a maximum error below 1.7% in urban

8 QoS-Mobile Networks and Services| GSM-UMTS
agglomerations, and below 3% on major roads, for a 95% confidence level.
In view of these services’ penetration rate and the diversity of the terminal equipment that is used, and
given each user’s subjective view itself, it is impossible to rigorously reproduce each consumer’s
conditions of interaction with the networks. In this context, the results of this study must be understood
as an indicator of the networks’ global behaviour, since it does not intend to evaluate the compliance
with licenses by the mobile operators. The transposition/extrapolation of these results to specific
situations requires some prudence, at the risk that biased conclusions might be drawn.
The technical and methodological options of this study directly influenced its results and must be taken
into account when analysing the results, as follows:
Tests were exclusively based on a technical solution (hardware + software) and performed totally
automatically, thereby setting a level playing field for the monitoring of the three operators and
eliminating the subjectivity inherent to the human user;
It used NOKIA N95 and NOKIA 6680 terminal equipment;
Tests were carried out in moving vehicles and with outdoor antennas (without gain);
Call duration, for both voice and video-telephony, was 120 seconds;
Voice and video-telephony tests were made with automatic selection of the 2G (GSM) or 3G
(UMTS) infrastructure;
Coverage indicators, particularly WCDMA coverage, do not take into account networks’ loads
(number of simultaneous users and type of services used);
The results of the study only reflect the behaviour of the networks in the locations and at the time
the measurements were taken;
On the other hand, operators are constantly improving their networks. The technical interventions
necessary for these improvements can cause momentary degradation of the service in the
geographic area of intervention.

Assessment of Voice and Video-telephony Services, and Network Coverage| Mainland Portugal | Sep.-Oct. 2009 9
I.II MAIN RESULTS AND CONCLUSIONS
The results of the quality of service indicators analysed in this study show that GSM mobile
communications systems have good coverage levels and a good performance for the voice service,
both in urban agglomerations and on major roads.
The video-telephony service maintains its positive evolution trend. Mobile communications systems
exhibit good performance in urban agglomerations, with the capacity of establishing and maintaining
video-telephony calls recording levels close to those for the voice service. But the video-telephony
service still does not perform adequately on major roads, as a direct consequence of the areas with
poor or even non-existent WCDMA coverage.
GSM and WCDMA Network Coverage
The mobile communication systems studied have good GSM coverage levels, both in urban agglomerations and major agglomerations and major roads, with no significant differences between operators (Figure 1 – Coverage Indicator in the
Urban Agglomerations of Mainland Portugal.
and Figure 2 – Coverage Indicator on the Major Roads of Mainland Portugal.
). The coverage levels already recorded in the study conducted in October/November 2008 are maintained (Figure 1 – Coverage Indicator in the Urban Agglomerations of Mainland Portugal.
and Figure 2 – Coverage Indicator on the Major Roads of Mainland Portugal.
).
WCDAM (UMTS) networks have better coverage levels in urban areas than on major roads (Figure 1 – Coverage Indicator in the Urban Agglomerations of Mainland Portugal.
and Figure 2 – Coverage Indicator on the Major Roads of Mainland Portugal.
). Comparing with results from the study carried out in October/November 2008, there is a degradation in the good coverage
levels, particularly on major roads and for OPTIMUS and VODAFONE (Figure 1 – Coverage Indicator in the Urban Agglomerations of Mainland Portugal.
and Figure 2 – Coverage Indicator on the Major Roads of Mainland Portugal.
).). In urban agglomerations OPTIMUS exhibits the best performance, with 96.2% of measurements

10 QoS-Mobile Networks and Services| GSM-UMTS
presenting good coverage levels, while VODAFONE performs worst, with 92.9%. On major roads,
WCDMA coverage has lower levels, with some areas still having bad or even non-existent coverage,
and significant differences were noted between operators. TMN has the best performance, with 86.9%
of measurements showing good coverage levels, while the figure for OPTIMUS is 81.7% and for
VODAFONE it is 69.6%.
Figure 1 – Coverage Indicator in the Urban Agglomerations of Mainland Portugal.
Table 1 – Evolution of the Coverage Indicator, from 2008 to 2009, in the Urban Agglomerations of Mainland Portugal. (Difference between figures from the 2009 study and figures from the 2008 study)
GSM WCDMA OPTIMUS TMN VODAFONE OPTIMUS TMN VODAFONE
Rad
io
cove
rag
e
Good 0.03% -0.01% 0.02% -2.33% -1.25% -5.67%
Acceptable 0.02% 0.07% 0.05% 2.13% 0.88% 3.23%
Bad 0.00% 0.00% 0.00% 0.26% 0.35% 1.75%
Non-existent -0.05% -0.06% -0.07% -0.05% 0.02% 0.69%
------------------------------ ------------------------------ ------------------------------ ------------------------------ ------------------------------ ------------------------------
Figure 2 – Coverage Indicator on the Major Roads of Mainland Portugal.

Assessment of Voice and Video-telephony Services, and Network Coverage| Mainland Portugal | Sep.-Oct. 2009 11
Table 2 – Evolution of the Coverage Indicator, from 2008 to 2009, on the Major Roads of Mainland Portugal. (Difference between figures from the 2009 study and figures from the 2008 study)
GSM WCDMA OPTIMUS TMN VODAFONE OPTIMUS TMN VODAFONE
Rad
io
cove
rag
e
Good 0.20% -0.03% -0.10% -8.05% -1.20% -10.01%
Acceptable -0.08% 0.02% 0.18% 6.23% 0.77% 3.97%
Bad -0.01% 0.01% 0.02% 2.09% 0.91% 3.49%
Non-existent -0.11% 0.01% -0.10% -0.27% -0.48% 2.55%
------------------------------ ------------------------------ ------------------------------ ------------------------------ ------------------------------ ------------------------------
Voice Service
The voice service has good results in all analysed indicators, both in urban roads (Figure 3 – Service Accessibility and Call Termination Rate Indicators in the Urban
Agglomerations of Mainland Portugal.
, Figure 4 – Service Accessibility and Call Termination Rate Indicators, on the Major Roads of Mainland Portugal.
, Figure 5 – Call Set Up Time Indicator in the Urban Agglomerations of Mainland Portugal.
, Figure 6 – Call Set Up Time Indicator on the Major Roads of Mainland Portugal.
, Figure 7 – Call Audio Quality Indicator in the Urban Agglomerations of Mainland Portugal.
and Figure 8 – Call Audio Quality Indicator on the Major Roads of Mainland Portugal.
). Comparing the results obtained in this study with those recorded in the study carried out in
October/November 2008, no major changes are observed, except for the Call Termination Rate
indicator of operators OPTIMUS and TMN on major roads, which show a slight degradation (Figure 3 –
Service Accessibility and Call Termination Rate Indicators in the Urban Agglomerations of Mainland
Portugal.
and Table 4 – Evolution of the Service Accessibility, Call Termination Rate, Average Call Set Up Time and Average Audio Quality
Indicators, from 2008 to 2009, on the Major Roads of Mainland Portugal.
).
Differences between operators are not relevant in urban agglomerations, but are more significant on
major roads, particularly for the Service Accessibility and Call Termination Rate indicators.

12 QoS-Mobile Networks and Services| GSM-UMTS
Figure 3 – Service Accessibility and Call Termination Rate Indicators in the Urban Agglomerations of Mainland Portugal.
Table 3 – Evolution of the Service Accessibility, Call Termination Rate, Average Call Set Up Time and Average Audio Quality Indicators, from 2008 to 2009, in the Urban Agglomerations of Mainland Portugal.
(Difference between figures from the 2009 study and figures from the 2008 study)
OPTIMUS TMN VODAFONE MobileFixed FixedMobile MobileFixed FixedMobile MobileFixed FixedMobile
Vo
ice
Ser
vice
Service Accessibility 0.07% -0.46% -0.72% -1.73% -0.26% -0.99%
Call Termination Rate -1.50% -0.87% -0.86% -0.62% -1.71% -0.82%
Average Call Set Up Time[s] -0.69 -0.98 0.11 -0.23 -0.60 -0.93
Average Audio Quality [MOS] 0.027 -0.019 0.032 -0.023 0.171 0.009
Figure 4 – Service Accessibility and Call Termination Rate Indicators, on the Major Roads of Mainland Portugal.

Assessment of Voice and Video-telephony Services, and Network Coverage| Mainland Portugal | Sep.-Oct. 2009 13
Table 4 – Evolution of the Service Accessibility, Call Termination Rate, Average Call Set Up Time and Average Audio Quality Indicators, from 2008 to 2009, on the Major Roads of Mainland Portugal.
(Difference between figures from the 2009 study and figures from the 2008 study)
OPTIMUS TMN VODAFONE MobileFixed FixedMobile MobileFixed FixedMobile MobileFixed FixedMobile
Vo
ice
Ser
vice
Service Accessibility -1.53% -0.77% -0.77% -1.08% -0.13% -1.41%
Call Termination Rate -2.81% -1.44% -2.30% -3.25% 0.36% 0.83%
Average Call Set Up Time[s] -0.34 -0.50 0.06 -0.17 -0.40 -0.63
Average Audio Quality [MOS] 0.016 -0.001 0.016 0.017 0.107 0.048
Figure 5 – Call Set Up Time Indicator in the Urban Agglomerations of Mainland Portugal.
Figure 6 – Call Set Up Time Indicator on the Major Roads of Mainland Portugal.

14 QoS-Mobile Networks and Services| GSM-UMTS
Figure 7 – Call Audio Quality Indicator in the Urban Agglomerations of Mainland Portugal.
Figure 8 – Call Audio Quality Indicator on the Major Roads of Mainland Portugal.
Video-telephony Service
The performance of the video-telephony service maintains a positive evolution trend, particularly in the
Service Accessibility indicator (Figure 9 – Service Accessibility, Call Termination Rate and Call Set Up
Time Indicators in the Urban Agglomerations of Mainland Portugal.
, Figure 10 – Service Accessibility, Call Termination Rate and Call Set Up Time Indicators, on the Major
Roads of Mainland Portugal.
, Figure 11 – Call Audio Quality and Call Video Quality Indicators in the Urban Agglomerations of Mainland Portugal.

Assessment of Voice and Video-telephony Services, and Network Coverage| Mainland Portugal | Sep.-Oct. 2009 15
, Figure 12 – Call Audio Quality and Call Video Quality Indicators on the Major Roads of Mainland Portugal.
, Figure 9 – Service Accessibility, Call Termination Rate and Call Set Up Time Indicators in the Urban
Agglomerations of Mainland Portugal.
and Figure 10 – Service Accessibility, Call Termination Rate and Call Set Up Time Indicators, on the
Major Roads of Mainland Portugal.
).
Urban agglomerations register a good Service Accessibility and Call Termination Rate, with levels close
to those recorded by the voice service. OPTIMUS and VODAFONE register the best Service
Accessibility, with levels above 97.4%, while TMN stands at 95.3%. For the Call Termination Rate, all
operators have very similar levels, above 98%. Comparing this study’s results to those of the previous
year the most significant evolution was recorded in OPTIMUS’ Service Accessibility, with an
improvement of over 2%.
Figure 9 – Service Accessibility, Call Termination Rate and Call Set Up Time Indicators in the Urban Agglomerations of Mainland Portugal.
Table 5 – Evolution of the Service Accessibility, Call Termination Rate, Average Call Set Up Time and Average Audio Quality Indicators, from 2008 to 2009, in the Urban Agglomerations of Mainland
Portugal. (Difference between figures from the 2009 study and figures from the 2008 study)
OPTIMUS TMN VODAFONE MobileMobile MobileMobile MobileMobile
Vid
eo-
tele
ph
o
ny
ser
vic e Service Accessibility 2.02% -0.82% 0.13%

16 QoS-Mobile Networks and Services| GSM-UMTS
Call Termination Rate -0.21% 0.48% 0.09%
Average Call Set Up Time[s] 0.06 0.21 0.34
Average Audio Quality [MOS] -0.022 -0.007 -0.027
Average Video Quality [MOS] -0.027 -0.013 -0.081
On major roads, operators OPTIMUS and TMN exhibit the best performances, with Service Accessibility
levels of 95.1% and 93.7%, respectively, and Call Termination Rates of 96.7% and 96.8%, respectively.
VODAFONE figures are considerably lower, being 81.4% for Service Accessibility and 93% for the Call
Termination Rate. Regarding the study carried out in 2008, these indicators have a positive evolution,
particularly OPTIMUS’ Service Accessibility which improved by around 8%.
Figure 10 – Service Accessibility, Call Termination Rate and Call Set Up Time Indicators, on the Major Roads of Mainland Portugal.
Table 6 – Evolution of the Service Accessibility, Call Termination Rate, Average Call Set Up Time and Average Audio Quality Indicators, from 2008 to 2009, on the Major Roads of Mainland Portugal.
(Difference between figures from the 2009 study and figures from the 2008 study)
OPTIMUS TMN VODAFONE
MobileMobil
e MobileMobil
e MobileMobil
e
Vid
eo-t
elep
ho
ny
serv
ice
Service Accessibility 7.97% 1.62% 1.31%
Call Termination Rate 0.24% 1.90% 0.91%
Average Call Set Up Time[s] 0.19 0.22 0.40
Average Audio Quality [MOS] -0.026 -0.024 -0.026
Average Video Quality [MOS] -0.027 -0.044 -0.091

Assessment of Voice and Video-telephony Services, and Network Coverage| Mainland Portugal | Sep.-Oct. 2009 17
The average call set up time does not differ greatly from urban agglomerations to major roads, with the
same values already registered in the 2008 study being more or less unchanged. The best average time
observed was recorded by VODAFONE, with 5.8 seconds, and the highest average time was recorded
by TMN, with 7.8 seconds.
Normally-ended video-telephony calls (120 seconds long) have a good average Audio Quality, and an
acceptable average Video Quality. No major differences were observed between operators or between
urban agglomerations and major roads. Regarding the 2008 study, no major changes were observed for
these indicators.
Figure 11 – Call Audio Quality and Call Video Quality Indicators in the Urban Agglomerations of Mainland Portugal.
Figure 12 – Call Audio Quality and Call Video Quality Indicators on the Major Roads of Mainland Portugal.


Assessment of Voice and Video-telephony Services, and Network Coverage| Mainland Portugal | Sep.-Oct. 2009 19
1 QUALITY OF SERVICE ASSESSMENT
1.1 GOAL
This study intends to analyse the quality of the telecommunications services supported on the
Portuguese GSM/UMTS mobile networks, from the user’s standpoint, by conducting automatic end-to-
end tests in the main urban agglomerations and on the major roads of Mainland Portugal.
1.2 SERVICES ANALYSED
In an assessment of the QoS from the user’s standpoint, one must consider the services that, for each
technology, are more relevant to end users in accordance with national and international market logic,
and which are normally provided by all operators on the market.
With this guiding principle, and considering the current reality, the following services were included in
this study:
1.2.1 TELEPHONY SERVICES:
a. Voice Service (GSM / UMTS);
b. Video-telephony Service (UMTS);
1.2.2 REGARDLESS OF SERVICE:
c. Network Radio Coverage (GSM / WCDMA).

20 QoS-Mobile Networks and Services| GSM-UMTS
2 METHODOLOGY
The methodology is based on the performance of end-to-end automatic tests, thus making it possible to
identify the quality of service on the field, giving as much a realistic perspective of the networks’
performance as possible, from the user’s standpoint.
Measurements are collected using drive-tests. Besides providing an assessment from the user’s
standpoint, this approach makes it possible to carry out the tests independently of the correct
functioning of the networks themselves, i.e. for example, also analysing the areas where coverage is
poor or non-existent.
On the other hand, the use of a sole testing system to assess the services provided by the three mobile
networks makes the results highly comparable, in terms of time and space.
2.1 FUNDAMENTALS
This study’s methodology is based on three key characteristics:
a) End-to-end measurements – measurements reflect all aspects that impact the quality of a
service.
b) Impartiality – measurements are carried out in the same conditions for the three operators
(OPTIMUS, TMN and VODAFONE).
c) Objectivity – tests are carried out completely automatically, thus eliminating the subjectivity
inherent to human intervention or decision.
2.2 MAIN QOS INDICATORS
From the user’s standpoint, the use of mobile services involves the following stages (different features
of the Quality of Service):
a. Network Availability – Shows that the mobile network is present;
b. Network Access – Shows that it is possible to use the services (it usually corresponds to the
indication of the network’s name on the screen of the terminal equipment and the indication of
the availability of GPRS and/or 3G);
c. Service Access – When the user intends to use a service the mobile operator provides the
access to that service; (e.g. to set up a voice call);

Assessment of Voice and Video-telephony Services, and Network Coverage| Mainland Portugal | Sep.-Oct. 2009 21
d. Service Integrity – Corresponds to the Quality of Service (QoS) during its use (e.g. Audio
Quality during a voice call; Video Quality during a video-telephony call);
e. Consistency – Corresponds to how the use of the service is ended (according or not to the
user’s will).
The main Quality of Service Indicators were analysed for each of the QoS features.
2.2.1 REGARDLESS OF THE SERVICE
2.2.1.1 RADIO NETWORK AVAILABILITY (COVERAGE)
Network availability is the probability of the mobile services being available to a user (radio network
coverage).
100% tsMeasuremen of No. Total
Services Mobile Available with tsMeasuremen of No.%y AvailailitNetwork Radio
Mobile services are considered to be available when the radio signals’ values are above the minimum
levels that make their use possible. These levels may be adjusted by mobile operators and normally
have different values for GSM and WCDMA1.
The testing and measurement system, which used an RF Scanner, makes it possible to continuously
measure each network’s signal levels. These measurements are georeferenced, thus rendering
possible their representation on maps and making it easy to visualize the coverage levels of mobile
networks on the routes under study.
Table 7 – Coverage Levels
Coverage GSM WCDMA Good RxLev 85 dBm CPICH RSCP 95 dBm Acceptable 95 dBm RxLev 85 dBm 105 dBm CPICH RSCP 95 dBm Bad 110 dBm RxLev 95 dBm 115 dBm CPICH RSCP 105 dBm Non-existent RxLev 110 dBm CPICH RSCP 115 dBm
1 Wideband Code Division Multiple Access – Technology used on the radio networks of UMTS communications systems.

22 QoS-Mobile Networks and Services| GSM-UMTS
2.2.2 TELEPHONY SERVICES
2.2.2.1 SERVICE ACCESSIBILITY (VOICE OR VIDEO-TELEPHONY)
Service accessibility is the probability of the user having access to the service (voice or video-
telephony), i.e. likelihood of success when establishing a (voice or video-telephony) call.
A call is considered to be “Set Up Successfully” if it reaches the called terminal (one hears the “calling
signal” on the calling terminal).
100% Calls Set Up toAttempts of No. Total
Calls Set Uply Successful of No.%ity Accessibil Service
2.2.2.2 CALL SET UP TIME (VOICE OR VIDEO-TELEPHONY)
Call set up time is the period of time elapsing from the sending of a complete destination address (target
telephone number) to the setting up of a call.
ndingaddress_segnalcalling_si
t- ts Time Set Up Call
taddress_sending – moment when the user presses the send button.
tcalling signal – moment when the call is successfully set up (one hears the “calling signal” on the caller terminal”).
2.2.2.3 CALL TERMINATION RATE (VOICE OR VIDEO-TELEPHONY)
Call termination rate is the probability of a call being maintained for a given period of time after it is set
up, and ending normally, i.e., according to the user’s will.
100% Calls Set Uply Successful of No.
Calls EndedNormally of No.% Raten Terminatio Call
2.2.2.4 CALL AUDIO QUALITY (VOICE OR VIDEO-TELEPHONY)
This indicator quantifies how well the conversation is perceived during a (voice or video-telephony) call.
Two-way communication is assessed and only calls with normal termination are considered.
This QoS indicator is assessed by comparing the original audio sample sent, X(t), with the

Assessment of Voice and Video-telephony Services, and Network Coverage| Mainland Portugal | Sep.-Oct. 2009 23
corresponding degraded sample received, Y(t), on the other end of the call, by applying the PESQ2
algorithm.
The objective audio quality index obtained by applying this algorithm is close to what would be obtained
if sample Y(t) were submitted to the subjective appreciation of a panel of service users.
tt
tt
YX
YX
BA
AB
f
f
; MOS_LQO Quality Audio Call
; MOS_LQO Quality Audio Call
B side
A side
side A; side B – name of both ends of a voice call.
MOS_LQO – perceived audio quality quantification scale (Mean Opinion Score - Listening Quality Objective).
f – function corresponding to the application of the calculation algorithm and conversion function of the results in MOS_LQO values.
XA(t); XB(t) – original audio sample sent from side A (B)
YA(t); YB(t) – degraded audio sample received at side A (B), resulting from the transmission of the original sample XB(t) (XA(t),
The results of the algorithm application are shown on a MOS (Mean Opinion Score) type scale from 1 to
5 named MOS_LQO (Mean Opinion Score – Listening-only Quality Objective), such as shown in Table
8. The MOS scale quantifies the effort that it takes to understand a conversation. Its limits are 0 (zero)
when there is no communication and 5 (five) when the communication is perfect. The value “zero” never
shows in the results since they only consider situations where the connection was set up and sustained
for a given period. “Five” never shows in the results either, because the CoDec3, used by mobile
networks does not enable such high voice quality values (the voice quality reached with the CoDec
usually used gives MOS values lower than 4.5).
Table 8 - MOS_LQO / MOS_VQO Scale
MOS Quality 5 Excellent 4 Good 3 Acceptable 2 Poor 1 Bad
In situations where each direction of a call sends and receives several audio samples {X1(t), …, Xn(t);
Y1(t), …, Yn(t)}, the Call Audio Quality indicator is reckoned through the arithmetic mean of the values
obtained by applying the formula shown above to each pair of audio samples, i.e.:
2 PESQ – Perceptual Evaluation of Speech Quality. Recommended by the ITU-International Telecommunications Union (ITU-T Recommendation P.862 (02/2001); ITU-T Recommendation P.862.1 (11/2003)).
3 CoDec – Codifier/Decodifier.

24 QoS-Mobile Networks and Services| GSM-UMTS
n
tYtXtYtX
n
tYtXtYtX
nn
nn
BABA
ABAB
ff
ff
; ... ; MOS_LQO Quality Audio Call
; ... ; MOS_LQO Quality Audio Call
11
11
B side
A side
2.2.2.5 VIDEO-TELEPHONY CALL VIDEO QUALITY
This indicator quantifies the communication’s visual quality during a video-telephony call. Both directions
of the communications are evaluated simultaneously and only calls ending normally are considered.
The evaluation process of this indicator is similar to that used for Call Audio Quality. The difference is
that it takes place in full-duplex, i.e. simultaneously in both directions of communication and while the
test call is taking place. This feature reproduces the real video-telephony service usage situation.
tt
tt
ZW
ZW
BA
AB
f
f
; MOS_VQO Quality Video Call
; MOS_VQO Quality Video Call
B side
A side
side A; side B – name of the two ends of a video-telephony call.
MOS_VQO – perceived visual quality quantification scale (Mean Opinion Score – Visual Quality Objective).
f – function corresponding to the application of the calculation algorithm and conversion function of the results in MOS_VQO values.
WA(t); WB(t) – original video sample sent from side A (B).
ZA(t); ZB(t) – degraded video sample received at side A (B), resulting from the transmission of the original sample WB(t) (WA(t)).
There is currently no algorithm being recommended by international standard organizations to evaluate
video quality. However, some measurement system manufacturers have developed their own
algorithms taking into account the guidelines established by ETSI (ETSI TR 102 493 V1.1.1 (2005-08))
and by VQEG – Video Quality Experts Group (“Multimedia Group Test Plan”, Draft Version 1.16,
February 7, 2007). SwissQual, AG, is one such firm. It is the supplier of the testing and measurement
system used in this study and uses its own algorithm in its products, called VQuad - Objective Model for
Video Quality Assessment.

Assessment of Voice and Video-telephony Services, and Network Coverage| Mainland Portugal | Sep.-Oct. 2009 25
Figure 13 – VQuad (SwissQual, AG) algorithm function diagram
shows the functional diagram of the VQuad algorithm. This algorithm is based on a full reference type
model, i.e., on a perceptual comparison of the degraded video sample with its reference. A reference
video sequence (sample) is transmitted through the mobile network being tested. At the destination, the
video sequence is captured and objectively validated via perceptual comparison with the reference
video sequence. This gives a global visual quality index (MOS_VQO) and other specific quality
parameters (block distortion, blurring, jerkiness, level, PSNR, frame jitter, frame loss, lip-sync, etc.).

26 QoS-Mobile Networks and Services| GSM-UMTS
Figure 13 – VQuad (SwissQual, AG) algorithm function diagram
The global visual quality index that results from the application of the VQuad algorithm is presented in a
MOS (Mean Opinion Score) type scale from 1 to 5 named MOS_VQO (Mean Opinion Score – Visual
Quality Objective), as shown in Table 8.
In situations where each direction of the same call sends and receives several video samples {W1(t), …,
Wn(t); Z1(t), …, Zn(t)}, the Call Video Quality indicator is reckoned from the arithmetic mean of the
values obtained by applying the formula presented above to each pair of video samples, i.e.:
n
tZtWtZtW
n
tZtWtZtW
nn
nn
BABA
ABAB
ff
ff
; ... ; MOS_VQO Quality Video Call
; ... ; MOS_VQO Quality Video Call
11
11
B side
A side

Assessment of Voice and Video-telephony Services, and Network Coverage| Mainland Portugal | Sep.-Oct. 2009 27
2.3 MEASUREMENT PROFILES4
Measurement profiles define a set of conditions that must the verified in order to correctly assess the
services’ quality and to guarantee the reliability of the tests. They also include process standardization
and the definition of testing and measurement parameters, thus making it feasible to perform analyses
and compare results.
2.3.1 GENERAL FEATURES
Tests are performed automatically by means of the Diversity system (there is no human intervention or
decision during the carrying out of a test).
Measurements are taken in moving vehicles and with outdoor antennas (without gain), and with
automatic selection of the 2G (GSM) or 3G (UMTS) infrastructures. All collected parameters are
georeferenced and which allows their subsequent representation in digital cartography.
2.3.2 COVERAGE
Network coverage is assessed by measuring the downlink signal levels, RxLev (Received signal Level)
for GSM and CPICH RSCP (Common Pilot Channel Received Signal Code Power) for WCDMA, along
each analysed route.
Measurements are taken through an RF Scanner device adapted and exclusively dedicated to this task
- so that the measured signal levels correspond to the effective levels. The measuring equipment can
collect signal samples from all GSM and WCDMA radio channels used by the operators under analysis,
at approximately one second intervals. These samples are later analysed and only the best signal level
results obtained for each point, technology and operator are considered.
Each measurement point is georeferenced so that signal levels can be later represented in digital
cartography, thus making it easier to visualise coverage levels of the mobile networks along the routes
under study and to identify the locations with poor or non-existing coverage.
4 The measurement profiles given here are base on the technical specifications ETSI TS 102 250, particularly part 5 (ETSI TS 102 250-5 V1.3.1 (2005-11)), and ETSI EG 202 057, particularly parts 3 and 4 (ETSI EG 202 057-3 V1.1.1 (2005-04) and ETSI EG 202 057-4 V1.1.1 (2005-10)).

28 QoS-Mobile Networks and Services| GSM-UMTS
2.3.3 TELEPHONY SERVICES
These services are evaluated end-to-end, using a “call” as the basic test unit.
Test calls are made between two terminal devices, where at least one of them is of a mobile type (MS –
Mobile Station or UE – User Equipment). This MS or UE moves along the studied route/location, and
the calls originated from this terminal equipment are named MOC (Mobile Originated Call).
In order to minimize the uncertainty that is part and parcel of taking measurements, the second end of
the test calls must have good performance levels and great stability. This end’s impact on the services’
performance indicators is intended to be minimal. The solutions include using fixed network terminals
(ISDN) to assess the performance of voice services, and to use mobile terminals (UE) to assess the
performance of the video-telephony service. The UE remain stationary in locations with proper (good)
radio coverage, minimum interference and with a (virtually) 100% probability of accessing the video-
telephony service. Calls originated at this end, in the ISDN or UE terminal, and ended at the mobile
terminal that is under test, are named MTC (Mobile Terminated Call).
In order to compare the performance of the several operators (benchmark), a fixed time frame is used
for making each call during the test sessions. When a call failure occurs, either when establishing a call
or in the conversation phase, the next call is only started when the next time frame arrives.
2.3.3.1 VOICE SERVICE
The analysis of the voice service at a given location includes the ability to establish and to end calls, as
well as the communication’s integrity.
Since the aim is to study the normal use of the voice service, the duration of test calls is close to the
average duration of calls routed on the networks. Besides the call’s own duration, the time frame
considers time periods that make possible the setting up and ending of a call, and also a 30 second
pause between consecutive calls, to prevent possible network constraints regarding signalling or
mobility management.
After the test call is started, the communication’s integrity – audio quality – is analysed alternately in
each direction, regardless of the end that started the call.
The test parameters used for the analysis of the voice service have the following values:

Assessment of Voice and Video-telephony Services, and Network Coverage| Mainland Portugal | Sep.-Oct. 2009 29
► MOC/MTC ratio: 1/1;
► Duration of the test calls: 120 seconds;
► Time frame for making a test call: 180 seconds;
► Maximum call set up time: 20 seconds.
2.3.3.2 VIDEO-TELEPHONY SERVICE
The capacity to establish and end calls, as well as the integrity of communications – audio and video
quality - is analysed. Audio quality is analysed separately for each direction of the communication,
regardless of the side that started the test call, while video quality is analysed simultaneously in both
directions of the communication.
The test parameters for the analysis of the video-telephony service are similar to those used for the
voice service. The difference occurs in the time frame, which is larger since the time needed to establish
calls and negotiating audio/video communications between terminals is longer.
The test parameters used for the analysis of the video-telephony service have the following values:
► MOC/MTC ratio: 1/1;
► Duration of the test calls: 120 seconds;
► Time frame for making a test call: 210 seconds;
► Maximum call set up time: 20 seconds;
► Maximum audio and video communication set up time: 30 seconds.
2.4 TEST/MEASUREMENT AND POST-PROCESSING SYSTEM
The Diversity/NetQual system, conceived and developed by SwissQual, A.G. (Switzerland), was used
for measurements on the field and for their post-processing. This is a tool specifically designed for the
analysis and benchmarking of mobile communications systems.
The system is made up of the following modules:

30 QoS-Mobile Networks and Services| GSM-UMTS
a. Diversity – Mobile Unit, with an RF scanner and commercial mobile terminal devices (NOKIA
N95 terminals were used in the study);
b. Land Unit – Fixed Unit, with ISDN interface cards, used for voice tests;
c. Video Call Server – Fixed Unit, with commercial mobile terminal devices (NOKIA 6680), used
for video-telephony tests;
d. Media Server – Fixed Unit, server used for data and video streaming tests;
e. NQDI – Post-processing System, for analysis and reporting of the measurements taken.
Figure 14 – Diversity/NetQual system architecture
ISDN
Internet
GSM/GPRS/UMTS
Media Server
Diversity
Video Call Server
Land Unit
NQDI – Server NQDI – Client

Assessment of Voice and Video-telephony Services, and Network Coverage| Mainland Portugal | Sep.-Oct. 2009 31
3 STUDY SAMPLE
A sample representing the use of these services in the main urban agglomerations and on major roads
of Mainland Portugal was chosen for a proper assessment of the quality of Voice, Video-telephony and
Network Coverage (GSM and WCDMA).
3.1 TESTED AREAS
This study aims to assess the quality of the services provided by mobile networks, as it is perceived by
consumers. It would thus be desirable to conduct measurements in all locations where these
communications are or could be provided; at least we ought to consider the whole of Portugal’s
geographical area, including the interior of buildings. Understandably, conducting tests in all these
locations is unfeasible.
However, the purpose is not to take exhaustive measurements, but to collect an adequate sample that
can be used as an indicator of the networks’ overall performance. With this end in view, locations where
the service is most used were chosen, i.e. in the larger urban agglomerations and on the major roads.
The exclusive adoption of this criterion would lead to an over- concentration of measurements in the
most densely populated areas along the northern coast, and so we decided to consider a geographical
distribution of locations in order to take account of inland regions.
Tests were therefore carried out in all of the country’s district capitals, the collection area was
broadened to the greater Lisbon and Porto peripheral areas, and also to the major roads of Mainland
Portugal.
The population of the urban agglomerations that make up the selected sample amounts to 41.7% of the
Portuguese population, according to the results of the last Census (2001).

32 QoS-Mobile Networks and Services| GSM-UMTS
Table 9 – Locations and their population
Territorial Unit Resident Population Present Population Aveiro 73,136 76,415
Beja 35,659 37,001
Braga 163,981 165,048
Bragança 34,689 37,170
Castelo Branco 55,909 56,280
Coimbra 148,122 159,039
Évora 56,359 58,564
Faro 57,151 59,527
Guarda 43,759 44,593
Leiria 119,319 119,065
Portalegre 25,814 26,511
Santarém 63,418 63,106
Setúbal 113,480 112,227
Viana do Castelo 88,409 86,355
Vila Real 49,928 52,129
Viseu 93,259 93,041
Total 1,222,392 1,246,071
Greater Porto
Porto 262,928 266,790
Gondomar 163,462 159,547
Maia 119,718 117,539
Matosinhos 166,275 162,671
Vila Nova de Gaia 287,597 280,466
Total 999,980 987,013
Greater Lisbon
Lisbon 556,797 559,248
Amadora 174,788 169,507
Cascais 168,827 166,539
Loures 198,685 193,320
Oeiras 160,147 157,152
Sintra 363,556 351,976
Almada 159,550 156,746
Seixal 150,095 146,843
Odivelas 132,971 130,569
Total 2,065,416 2,031,900
Overall Total 4,287,788 4,264,984
Source: INE - Instituto Nacional de Estatística
Table 10 – Major Roads
Major Roads Approximate Distance [Km]
Aveiro-Viseu-Vilar Formoso (A25) 200
Chaves-Vila Real-Figueira da Foz (A24 / IP3 / A14) 285
Lagos-Vila Real de Sto. António-Faro-Lagos (A22 / EN125) 275
Lisbon-Algarve (A2) 245
Lisbon-Cascais-Sintra-Lisbon (A5 / IC19) 60
Lisbon-Évora-Elvas (A12 / A2 / A6) 215
Lisbon-Leiria-Aveiro (A8 / A17) 245
Lisbon-Porto (A1) 315
Maia-Guimarães-Braga-Esposende (A41 / A42 / A11) 120
Oeiras-Castelo Branco-Guarda (A9 / A10 / A1 / A23) 330
Porto-Bragança (A4 / IP4) 260
Porto-Braga-Valença-Viana do Castelo-Porto (A3 / A28) 230
Póvoa de Varzim-Vila Pouca de Aguiar (A7) 110
Total 2,890

Assessment of Voice and Video-telephony Services, and Network Coverage| Mainland Portugal | Sep.-Oct. 2009 33
3.2 SAMPLE SIZE
Table 11 – Sample for the three analysed operators
3.3 DATA COLLECTION CONDITIONS
Field work took place on normal working days from September 14 to October 20.
In the Greater Lisbon and Greater Porto regions, measurements were taken between 8h00 and 12h00
and between 16h00 and 20h00. In the remaining urban agglomerations, measurements were taken
during normal working hours.
On each major road, data was collected in two series of runs, except for the A5/IC19 route, where
several runs were made in one day (6h04).

34 QoS-Mobile Networks and Services| GSM-UMTS
4 AGGREGATED RESULTS
4.1 URBAN AGGLOMERATIONS
4.1.1 VOICE SERVICE
OPTIMUS TMN VODAFONE MobileFixed FixedMobile MobileFixed FixedMobile MobileFixed FixedMobile
Cal
ls M
ade
Number of Calls 1,535 1,499 1,531 1,499 1,531 1,498
Dropped on Set Up 9 15 18 34 11 28
Dropped During Call 29 23 25 23 34 25
With Normal Termination 1,497 1,461 1,488 1,442 1,486 1,445
Service Accessibility 99.4% 99.0% 98.8% 97.7% 99.3% 98.1%
Call Termination Rate 98.1% 98.5% 98.3% 98.4% 97.8% 98.3%
Cal
l Set
Up
Number of Samples (Calls) 1,526 1,484 1,513 1,465 1,520 1,470
Average Time [s] 4.4 5.4 4.8 5.5 3.5 4.9
Maximum Time [s] 19.5 20.3 19.9 12.9 11.9 13.0
Minimum Time [s] 3.4 3.7 3.7 4.2 2.7 3.5
Standard Deviation [s] 1.0 1.8 0.9 1.3 0.6 1.2
Au
dio
Qu
alit
y
Number of Samples (Calls) 2,958 2,958 2,930 2,930 2,931 2,931
Average [MOS] 3.92 3.95 3.93 3.91 3.97 3.86
Maximum [MOS] 4.14 4.19 4.13 4.17 4.14 4.17
Minimum [MOS] 1.88 1.52 1.04 1.71 2.70 1.91
Standard Deviation [MOS] 0.16 0.18 0.17 0.20 0.15 0.17
OPTIMUS TMN VODAFONE MobileFixed FixedMobile MobileFixed FixedMobile MobileFixed FixedMobile
Pre
cisi
on
Err
or Service Accessibility 0.5% 0.6% 0.7% 0.9% 0.6% 0.8%
Call Termination Rate 0.8% 0.8% 0.8% 0.8% 0.9% 0.8%
Call Set Up Time [s] 0.049 0.089 0.046 0.066 0.033 0.061
Audio Quality [MOS] 0.006 0.006 0.006 0.007 0.005 0.006
Confidence Level = 95 %
4.1.1.1 SERVICE ACCESSIBILITY AND CALL TERMINATION RATE INDICATORS

Assessment of Voice and Video-telephony Services, and Network Coverage| Mainland Portugal | Sep.-Oct. 2009 35
4.1.1.2 CALL SET UP TIME INDICATOR
4.1.1.3 VOICE CALL AUDIO QUALITY INDICATOR
4.1.1.4 PROBABILITY DENSITY FUNCTION OF THE VOICE CALL AUDIO QUALITY INDICATOR

36 QoS-Mobile Networks and Services| GSM-UMTS
4.1.2 VIDEO-TELEPHONY SERVICE
OPTIMUS TMN VODAFONE MobileMobile MobileMobile MobileMobile
Cal
ls M
ade
Number of Calls 2,585 2,593 2,592
Dropped on Set Up 64 122 67
Dropped During Call 39 26 42
With Normal Termination 2,482 2,445 2,483
Service Accessibility 97.5% 95.3% 97.4%
Call Termination Rate 98.5% 98.9% 98.3%
Cal
l Set
Up
Number of Samples (Calls) 2,521 2,471 2,525
Average Time [s] 7.0 7.7 5.8
Maximum Time [s] 22.1 14.7 25.4
Minimum Time [s] 5.2 5.7 4.2
Standard Deviation [s] 1.4 1.2 1.1
Au
dio
Qu
alit
y
Number of Samples (Calls) 4,964 4,889 4,966
Average [MOS] 3.95 3.94 3.96
Maximum [MOS] 4.05 4.05 4.05
Minimum [MOS] 1.00 1.12 1.00
Standard Deviation [MOS] 0.19 0.21 0.16
Vid
eo Q
ual
ity
Number of Samples (Calls) 4,964 4,890 4,966
Average [MOS] 2.36 2.35 2.33
Maximum [MOS] 2.67 2.67 2.67
Minimum [MOS] 1.00 1.00 1.09
Standard Deviation [MOS] 0.25 0.30 0.26
OPTIMUS TMN VODAFONE MobileMobile MobileMobile MobileMobile
Pre
cisi
on
Err
or Service Accessibility 0.7% 0.9% 0.7%
Call Termination Rate 0.6% 0.5% 0.6%
Call Set Up Time [s] 0.053 0.047 0.044
Audio Quality [MOS] 0.005 0.006 0.005
Video Quality[MOS] 0.007 0.008 0.007
Confidence Level = 95 %

Assessment of Voice and Video-telephony Services, and Network Coverage| Mainland Portugal | Sep.-Oct. 2009 37
4.1.2.1 SERVICE ACCESSIBILITY AND CALL TERMINATION RATE INDICATORS
4.1.2.2 CALL SET UP TIME INDICATOR
4.1.2.3 VIDEO-TELEPHONY CALL AUDIO QUALITY INDICATOR

38 QoS-Mobile Networks and Services| GSM-UMTS
4.1.2.4 PROBABILITY DENSITY FUNCTION OF THE VIDEO-TELEPHONY CALL AUDIO QUALITY INDICATOR
4.1.2.5 VIDEO-TELEPHONY CALL VIDEO QUALITY INDICATOR
4.1.2.6 PROBABILITY DENSITY FUNCTION OF THE VIDEO-TELEPHONY CALL VIDEO QUALITY INDICATOR

Assessment of Voice and Video-telephony Services, and Network Coverage| Mainland Portugal | Sep.-Oct. 2009 39
4.1.3 NETWORK COVERAGE
GSM WCDMA OPTIMUS TMN VODAFONE OPTIMUS TMN VODAFONE
Co
vera
ge
Number of Samples (Measurements) 553,226 553,133 553,059 555,364 555,550 555,04
Average Signal Level [dBm] -52 -51 -52 -75 -73 -75
Maximum Signal Level [dBm] -22 -16 -17 -33 -21 -27
Minimum Signal Level[dBm] -115 -115 -115 -125 -132 -131
Standard Deviation [dBm] 10 10 11 12 13 14
Good 99.7% 99.8% 99.7% 96.2% 95.4% 92.9%
Acceptable 0.0% 0.1% 0.0% 3.4% 3.7% 4.4%
Bad 0.0% 0.0% 0.0% 0.4% 0.8% 1.9%
Non-existent 0.2% 0.1% 0.3% 0.0% 0.1% 0.7%
------------------------------ ------------------------------ ------------------------------ ------------------------------ ------------------------------ ------------------------------
4.1.3.1 GSM

40 QoS-Mobile Networks and Services| GSM-UMTS
4.1.3.2 GSM - PROBABILITY DENSITY FUNCTION
4.1.3.3 WCDMA
Assessment of Voice and Video-telephony Services, and Network Coverage| Mainland Portugal | Sep.-Oct. 2009 41
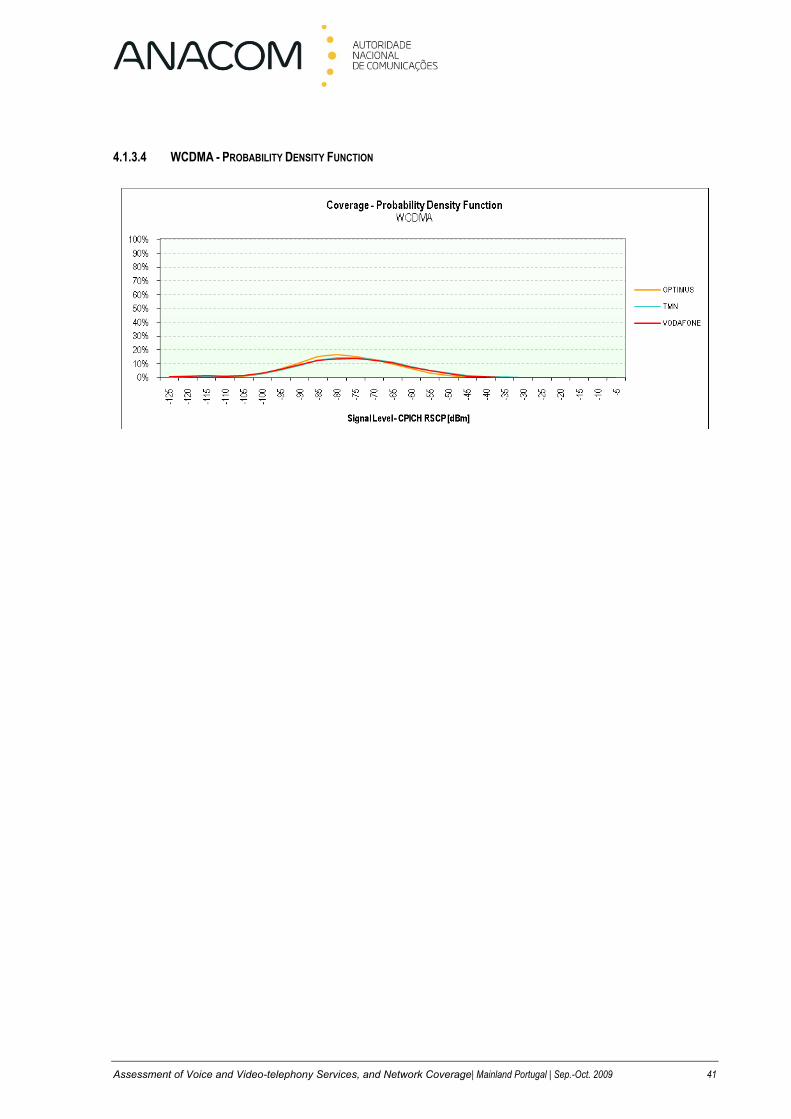
4.1.3.4 WCDMA - PROBABILITY DENSITY FUNCTION

42 QoS-Mobile Networks and Services| GSM-UMTS
4.2 MAJOR ROADS
4.2.1 VOICE SERVICE
OPTIMUS TMN VODAFONE
MobileFixed FixedMobile MobileFixed FixedMobile MobileFixed FixedMobile
Cal
ls M
ade
Number of Calls 648 628 648 629 648 627
Dropped on Set Up 12 12 5 15 7 16
Dropped During Call 29 16 25 24 13 10
With Normal Termination 607 600 618 590 628 601
Service Accessibility 98.1% 98.1% 99.2% 97.6% 98.9% 97.4%
Call Termination Rate 95.4% 97.4% 96.1% 96.1% 98.0% 98.4%
Cal
l Set
Up
Number of Samples (Calls) 636 616 643 614 641 611
Average Time [s] 4.6 5.7 4.8 5.7 3.7 5.2
Maximum Time [s] 19.4 19.9 10.4 16.2 12.0 11.7
Minimum Time [s] 2.9 3.5 3.8 4.2 2.9 3.6
Standard Deviation [s] 1.5 2.1 0.8 1.4 0.7 1.2
Au
dio
Qu
alit
y
Number of Samples (Calls) 1,207 1,207 1,208 1,208 1,229 1,229
Average [MOS] 3.88 3.95 3.91 3.95 3.89 3.88
Maximum [MOS] 4.13 4.18 4.11 4.17 4.12 4.17
Minimum [MOS] 2.94 2.53 1.77 2.78 1.05 2.69
Standard Deviation [MOS] 0.19 0.20 0.15 0.17 0.18 0.19
OPTIMUS TMN VODAFONE
MobileFixed FixedMobile MobileFixed FixedMobile MobileFixed FixedMobile
Pre
cisi
on
Err
or Service Accessibility 1.4% 1.4% 1.0% 1.5% 1.1% 1.6%
Call Termination Rate 1.9% 1.6% 1.8% 1.9% 1.4% 1.4%
Call Set Up Time [s] 0.113 0.166 0.065 0.110 0.056 0.097
Audio Quality [MOS] 0.011 0.012 0.008 0.010 0.010 0.010
Confidence Level = 95 %
4.2.1.1 SERVICE ACCESSIBILITY AND CALL TERMINATION RATE INDICATORS

Assessment of Voice and Video-telephony Services, and Network Coverage| Mainland Portugal | Sep.-Oct. 2009 43
4.2.1.2 CALL SET UP TIME INDICATOR
4.2.1.3 VOICE CALL AUDIO QUALITY INDICATOR
4.2.1.4 PROBABILITY DENSITY FUNCTION OF THE VOICE CALL AUDIO QUALITY INDICATOR

44 QoS-Mobile Networks and Services| GSM-UMTS
4.2.2 VIDEO-TELEPHONY SERVICE
OPTIMUS TMN VODAFONE
MobileMobile MobileMobile MobileMobile
Cal
ls M
ade
Number of Calls 1,090 1,096 1,094
Dropped on Set Up 53 69 203
Dropped During Call 34 33 62
With Normal Termination 1,003 994 829
Service Accessibility 95.1% 93.7% 81.4%
Call Termination Rate 96.7% 96.8% 93.0%
Cal
l Set
Up
Number of Samples (Calls) 1,037 1,027 891
Average Time [s] 7.2 7.8 6.0
Maximum Time [s] 22.8 12.8 12.6
Minimum Time [s] 5.4 6.0 4.4
Standard Deviation [s] 1.5 1.1 1.0
Au
dio
Qu
alit
y
Number of Samples (Calls) 2,003 1,988 1,658
Average [MOS] 3.93 3.92 3.94
Maximum [MOS] 4.05 4.05 4.05
Minimum [MOS] 1.00 1.00 1.00
Standard Deviation [MOS] 0.25 0.23 0.19
Vid
eo Q
ual
ity
Number of Samples (Calls) 2,006 1,988 1,658
Average [MOS] 2.37 2.34 2.31
Maximum [MOS] 2.67 2.66 2.64
Minimum [MOS] 1.42 1.03 1.21
Standard Deviation [MOS] 0.24 0.31 0.26
OPTIMUS TMN VODAFONE
MobileMobile MobileMobile MobileMobile
Pre
cisi
on
Err
or Service Accessibility 1.4% 1.6% 2.4%
Call Termination Rate 1.3% 1.3% 1.9%
Call Set Up Time [s] 0.093 0.069 0.069
Audio Quality [MOS] 0.011 0.010 0.009
Video Quality[MOS] 0.011 0.014 0.012
Confidence Level = 95 %

Assessment of Voice and Video-telephony Services, and Network Coverage| Mainland Portugal | Sep.-Oct. 2009 45
4.2.2.1 SERVICE ACCESSIBILITY AND CALL TERMINATION RATE INDICATORS
4.2.2.2 CALL SET UP TIME INDICATOR
4.2.2.3 VIDEO-TELEPHONY CALL AUDIO QUALITY INDICATOR

46 QoS-Mobile Networks and Services| GSM-UMTS
4.2.2.4 PROBABILITY DENSITY FUNCTION OF THE VIDEO-TELEPHONY CALL AUDIO QUALITY INDICATOR
4.2.2.5 VIDEO-TELEPHONY CALL VIDEO QUALITY INDICATOR
4.2.2.6 PROBABILITY DENSITY FUNCTION OF THE VIDEO-TELEPHONY CALL VIDEO QUALITY INDICATOR

Assessment of Voice and Video-telephony Services, and Network Coverage| Mainland Portugal | Sep.-Oct. 2009 47
4.2.3 NETWORK COVERAGE
GSM WCDMA
OPTIMUS TMN VODAFONE OPTIMUS TMN VODAFONE
Co
vera
ge
Number of Samples (Measurements) 233,628 233,580 233,717 234,866 234,923 234,957
Average Signal Level [dBm] -55 -54 -56 -81 -77 -86
Maximum Signal Level [dBm] -21 -21 -20 -34 -30 -27
Minimum Signal Level[dBm] -115 -115 -115 -136 -138 -139
Standard Deviation [dBm] 12 12 12 15 16 20
Good 99.5% 99.5% 98.9% 81.7% 86.9% 69.6%
Acceptable 0.2% 0.3% 0.7% 13.1% 8.6% 12.9%
Bad 0.0% 0.0% 0.1% 4.2% 3.3% 8.4%
Non-existent 0.3% 0.1% 0.3% 1.0% 1.1% 9.2%
------------------------------ ------------------------------ ------------------------------ ------------------------------ ------------------------------ ------------------------------
4.2.3.1 GSM

48 QoS-Mobile Networks and Services| GSM-UMTS
4.2.3.2 GSM - PROBABILITY DENSITY FUNCTION
4.2.3.3 WCDMA

Assessment of Voice and Video-telephony Services, and Network Coverage| Mainland Portugal | Sep.-Oct. 2009 49
4.2.3.4 WCDMA - PROBABILITY DENSITY FUNCTION

50 QoS-Mobile Networks and Services| GSM-UMTS
4.3 GLOBAL
4.3.1 VOICE SERVICE
OPTIMUS TMN VODAFONE
MobileFixed FixedMobile MobileFixed FixedMobile MobileFixed FixedMobile
Cal
ls M
ade
Number of Calls 2,183 2,127 2,179 2,128 2,179 2,125
Dropped on Set Up 21 27 23 49 18 44
Dropped During Call 58 39 50 47 47 35
With Normal Termination 2,104 2,061 2,106 2,032 2,114 2,046
Service Accessibility 99.0% 98.7% 98.9% 97.7% 99.2% 97.9%
Call Termination Rate 97.3% 98.1% 97.7% 97.7% 97.8% 98.3%
Cal
l Set
Up
Number of Samples (Calls) 2,162 2,100 2,156 2,079 2,161 2,081
Average Time [s] 4.5 5.5 4.8 5.6 3.6 5.0
Maximum Time [s] 19.5 20.3 19.9 16.2 12.0 13.0
Minimum Time [s] 2.9 3.5 3.7 4.2 2.7 3.5
Standard Deviation [s] 1.1 1.9 0.9 1.3 0.7 1.2
Au
dio
Qu
alit
y
Number of Samples (Calls) 4,165 4,165 4,138 4,138 4,160 4,160
Average [MOS] 3.91 3.95 3.92 3.92 3.95 3.87
Maximum [MOS] 4.14 4.19 4.13 4.17 4.14 4.17
Minimum [MOS] 1.88 1.52 1.04 1.71 1.05 1.91
Standard Deviation [MOS] 0.17 0.19 0.16 0.20 0.16 0.17
OPTIMUS TMN VODAFONE
MobileFixed FixedMobile MobileFixed FixedMobile MobileFixed FixedMobile
Pre
cisi
on
Err
or Service Accessibility 0.5% 0.6% 0.5% 0.7% 0.5% 0.7%
Call Termination Rate 0.8% 0.7% 0.7% 0.7% 0.7% 0.6%
Call Set Up Time [s] 0.048 0.080 0.038 0.056 0.028 0.052
Audio Quality [MOS] 0.005 0.006 0.005 0.006 0.005 0.005
Confidence Level = 95 %
4.3.1.1 SERVICE ACCESSIBILITY AND CALL TERMINATION RATE INDICATORS

Assessment of Voice and Video-telephony Services, and Network Coverage| Mainland Portugal | Sep.-Oct. 2009 51
4.3.1.2 CALL SET UP TIME INDICATOR
4.3.1.3 VOICE CALL AUDIO QUALITY INDICATOR
4.3.1.4 PROBABILITY DENSITY FUNCTION OF THE VOICE CALL AUDIO QUALITY INDICATOR

52 QoS-Mobile Networks and Services| GSM-UMTS
4.3.2 VIDEO-TELEPHONY SERVICE
OPTIMUS TMN VODAFONE
MobileMobile MobileMobile MobileMobile
Cal
ls M
ade
Number of Calls 3,675 3,689 3,686
Dropped on Set Up 117 191 270
Dropped During Call 73 59 104
With Normal Termination 3,485 3,439 3,312
Service Accessibility 96.8% 94.8% 92.7%
Call Termination Rate 97.9% 98.3% 97.0%
Cal
l Set
Up
Number of Samples (Calls) 3,558 3,498 3,416
Average Time [s] 7.1 7.7 5.8
Maximum Time [s] 22.8 14.7 25.4
Minimum Time [s] 5.2 5.7 4.2
Standard Deviation [s] 1.4 1.2 1.1
Au
dio
Qu
alit
y
Number of Samples (Calls) 6,967 6,877 6,624
Average [MOS] 3.94 3.93 3.95
Maximum [MOS] 4.05 4.05 4.05
Minimum [MOS] 1.00 1.00 1.00
Standard Deviation [MOS] 0.21 0.21 0.17
Vid
eo Q
ual
ity
Number of Samples (Calls) 6,970 6,878 6,624
Average [MOS] 2.36 2.35 2.33
Maximum [MOS] 2.67 2.67 2.67
Minimum [MOS] 1.00 1.00 1.09
Standard Deviation [MOS] 0.25 0.30 0.26
OPTIMUS TMN VODAFONE
MobileMobile MobileMobile MobileMobile
Pre
cisi
on
Err
or Service Accessibility 0.6% 0.8% 0.9%
Call Termination Rate 0.5% 0.5% 0.6%
Call Set Up Time [s] 0.047 0.039 0.037
Audio Quality [MOS] 0.005 0.005 0.004
Video Quality[MOS] 0.006 0.007 0.006
Confidence Level = 95 %

Assessment of Voice and Video-telephony Services, and Network Coverage| Mainland Portugal | Sep.-Oct. 2009 53
4.3.2.1 SERVICE ACCESSIBILITY AND CALL TERMINATION RATE INDICATORS
4.3.2.2 CALL SET UP TIME INDICATOR
4.3.2.3 VIDEO-TELEPHONY CALL AUDIO QUALITY INDICATOR

54 QoS-Mobile Networks and Services| GSM-UMTS
4.3.2.4 PROBABILITY DENSITY FUNCTION OF THE VIDEO-TELEPHONY CALL AUDIO QUALITY INDICATOR
4.3.2.5 VIDEO-TELEPHONY CALL VIDEO QUALITY INDICATOR
4.3.2.6 PROBABILITY DENSITY FUNCTION OF THE VIDEO-TELEPHONY CALL VIDEO QUALITY INDICATOR

Assessment of Voice and Video-telephony Services, and Network Coverage| Mainland Portugal | Sep.-Oct. 2009 55
4.3.3 NETWORK COVERAGE
GSM WCDMA
OPTIMUS TMN VODAFONE OPTIMUS TMN VODAFONE
Co
vera
ge
Number of Samples (Measurements) 786,854 786,713 786,776 790,230 790,473 790,261
Average Signal Level [dBm] -53 -52 -53 -77 -74 -78
Maximum Signal Level [dBm] -21 -16 -17 -33 -21 -27
Minimum Signal Level[dBm] -115 -115 -115 -136 -138 -139
Standard Deviation [dBm] 11 11 11 13 14 17
Good 99.6% 99.7% 99.5% 91.9% 92.9% 86.0%
Acceptable 0.1% 0.2% 0.2% 6.3% 5.2% 7.0%
Bad 0.0% 0.0% 0.0% 1.5% 1.5% 3.8%
Non-existent 0.2% 0.1% 0.3% 0.3% 0.4% 3.2%
------------------------------ ------------------------------ ------------------------------ ------------------------------ ------------------------------ ------------------------------
4.3.3.1 GSM
4.3.3.2 GSM - PROBABILITY DENSITY FUNCTION

56 QoS-Mobile Networks and Services| GSM-UMTS
4.3.3.3 WCDMA
4.3.3.4 WCDMA - PROBABILITY DENSITY FUNCTION
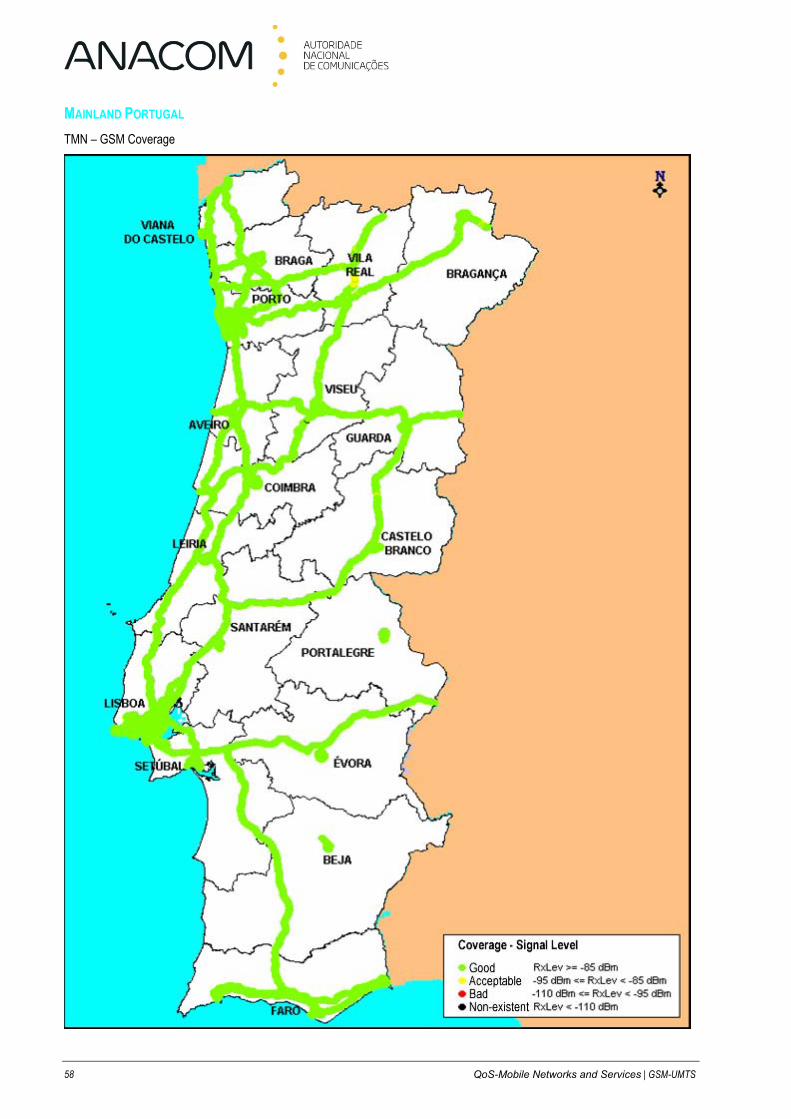
4.3.3.4.1 COVERAGE MAPS
(Following pages)

Assessment of Voice and Video-telephony Services, and Network Coverage| Mainland Portugal | Sep.-Oct. 2009 57
MAINLAND PORTUGAL
OPTIMUS – GSM Coverage
58 QoS-Mobile Networks and Services | GSM-UMTS
MAINLAND PORTUGAL
TMN – GSM Coverage

Assessment of Voice and Video-telephony Services, and Network Coverage| Mainland Portugal | Sep.-Oct. 2009 59
MAINLAND PORTUGAL
VODAFONE – GSM Coverage

60 QoS-Mobile Networks and Services | GSM-UMTS
MAINLAND PORTUGAL
OPTIMUS – WCDMA Coverage

Assessment of Voice and Video-telephony Services, and Network Coverage| Mainland Portugal | Sep.-Oct. 2009 61
MAINLAND PORTUGAL
TMN – WCDMA Coverage

62 QoS-Mobile Networks and Services | GSM-UMTS
MAINLAND PORTUGAL
VODAFONE – WCDMA Coverage