mobile manipulator performance measurement data · 1 . introduction . science-based measurements of...
TRANSCRIPT

NIST Technical Note 1965
Mobile Manipulator Performance Measurement Data
Roger Bostelman Ya-Shian Li-Baboud
Steve Legowik Tsai Hong
Sebti Foufou
This publication is available free of charge from: https://doi.org/10.6028/NIST.TN.1965

NIST Technical Note 1965
Mobile Manipulator Performance Measurement Data
Roger Bostelman
Ya-Shian Li-Baboud Intelligent Systems Divison
Engineering Laboratory
Steve Legowik Robotics Research, LLC.
Gaithersburg, MD
Tsai Hong Intelligent Systems Divison
Engineering Laboratory
Sebti Foufou College of Engineering
Qatar University Doha, Qatar
This publication is available free of charge from: https://doi.org/10.6028/NIST.TN.1965
June 2017
U.S. Department of Commerce Wilbur L. Ross, Jr., Secretary
National Institute of Standards and Technology
Kent Rochford, Acting NIST Director and Under Secretary of Commerce for Standards and Technology

Certain commercial entities, equipment, or materials may be identified in this document in order to describe an experimental procedure or concept adequately.
Such identification is not intended to imply recommendation or endorsement by the National Institute of Standards and Technology, nor is it intended to imply that the entities, materials, or equipment are necessarily the best available for the purpose.
National Institute of Standards and Technology Technical Note 1965 Natl. Inst. Stand. Technol. Tech. Note 1965, 34 pages (June 2017)
CODEN: NTNOEF
This publication is available free of charge from: https://doi.org/10.6028/NIST.TN.1965

i
Abstract The National Institute of Standards and Technology, Intelligent Systems Division has collected data measuring the performance of a mobile manipulator; i.e., an automatic guided vehicle (AGV)1 with onboard robot arm, from two different manufacturers. The performance measurement concept uses a novel artifact and method that have been verified using an optical tracking system (OTS), which can measure AGV position, manipulator motion, and position uncertainty. The data needed to make these three measurements was collected during two tests; both tests have corresponding timestamps relative to global positioning system (GPS) time, where the computer clocks are synchronized using the Network Time Protocol. This paper provides detailed explanation of the data from mobile-manipulator, performance-measurement tests. It is expected that the user of the information within this document and the data files that accompany this document will have sufficient knowledge to implement mobile manipulation testing and evaluation.
Keywords: mobile manipulator, AGV, robot arm, optical tracking system, GPS timestamp, performance measurement
1 Disclaimer: NIST does not endorse products discussed within this paper nor manufacturers of these products. Products mentioned are for information purposes only and are not expressed as an endorsement for them or their manufacturer. † Robotic Research was funded in FY16 for this research under NIST grant 70NANB14H293, “Abstracted Calibration System for Automated Manufacturing”
______________________________________________________________________________________________________ This publication is available free of charge from
: https://doi.org/10.6028/NIS
T.TN.1965

ii
Table of Contents Introduction .................................................................................................................................................. 1
Mobile Manipulator Performance Measurement Concept .......................................................................... 1
Mobile Manipulator Algorithm ................................................................................................................. 4
Independent Measurement System ......................................................................................................... 5
Procedures .................................................................................................................................................... 7
Systems Setup ........................................................................................................................................... 7
Test Details ................................................................................................................................................ 9
Log Files ................................................................................................................................................... 10
Data Collection Anomalies ...................................................................................................................... 10
Data Correspondence Between Log Files ................................................................................................... 11
Example Robot controller data log file ................................................................................................... 11
Example AGV data log file ....................................................................................................................... 11
Example Optical Tracking System data log file ....................................................................................... 11
Time Correspondence across data files .................................................................................................. 12
References .................................................................................................................................................. 12
Appendices .................................................................................................................................................. 14
Appendix A - AGV transport structure .................................................................................................... 14
Appendix B - AGV paths from the Vehicle Diagnostics Tool ................................................................... 15
Appendix C - Optical Tracking System information ................................................................................ 17
Appendix D - Test 1 data files and file information ................................................................................ 18
AGV VDT - .bz2 files ............................................................................................................................. 18
AGV - .csv files ..................................................................................................................................... 18
Robot log files ..................................................................................................................................... 19
OTS log files ......................................................................................................................................... 23
Appendix E - Test 2 data files .................................................................................................................. 25
AGV VDT - .bz2 files ............................................................................................................................. 25
AGV - .csv files ..................................................................................................................................... 25
Robot log files ..................................................................................................................................... 26
OTS log files ......................................................................................................................................... 26
Appendix F – Ground Truth data files ..................................................................................................... 28
OTS files of the RMMA ........................................................................................................................ 28
OTS file of the Static AGV and robot ................................................................................................... 28
Appendix G - Time Correspondence Across All Data Files ...................................................................... 29
______________________________________________________________________________________________________ This publication is available free of charge from
: https://doi.org/10.6028/NIS
T.TN.1965

1
Introduction Science-based measurements of the performance metrics of mobile manipulators performing standard tasks (poses and motions) are non-existent. Usually, measurements are used to simply ensure that tasks have been ‘more or less’ completed. Typical, robot-performance measurements include path drawing, path comparisons, Cartesian and polar coordinates, triangulation, optical tracking, and inertial measuring. Additional measurements are associated mainly with how well the end of arm tooling deviates from the commanded robot position and orientation or pose.
Making ground-truth measurements using different motion-tracking systems provides robot-joint, segment, and tool-point position information. This information is accurate enough to make comparisons to the commanded pose summarizing review of robot, mobile robot, and mobile manipulator performance measurement research shows this as being relatively new to the research community [1]. The National Institute of Standards and Technology (NIST) Robotic Systems for Smart Manufacturing (RSSM) Program [2] has been researching methods for measuring the performance of mobile manipulators for several years. The data collected during two tests that are described in this paper provides an extension of the RSSM publications referenced here and provides publicly-accessible experimental data to further this research.
This paper discusses the use of the NIST reconfigurable mobile manipulator artifact (RMMA) in measuring mobile manipulator performance. The concepts of using artifacts for measurement and programmed algorithms to control the manipulator are described. Two mobile manipulator performance measurement tests, their procedures, and logged data files are discussed to inform the reader about the accompanying data. Optical tracking system data of the two tests is also provided, along with ground truth data, to allow the user an additional measurement method beyond the artifact method.
Mobile Manipulator Performance Measurement Concept NIST has been developing a mobile manipulator, performance measurement concept over the past two years [3, 4, 5]. This concept, which evolved from the experiments described in [6], consists of using 1) a NIST-developed, reconfigurable, mobile manipulator artifact (RMMA) (see Figure 1) with 2) interchangeable and varying sized fiducials to be detected by a sensor carried by the mobile manipulator.
Researchers pre-programmed the forklift automatic guided vehicle (AGV) movements to ten different (see Figure 2) positions and orientations (poses). AGV orientation angles were programmed to be at 45° with respect to the RMMA. The AGV moved from a home position away from the RMMA to the first pose next to the RMMA, stopped and waited until the manipulator registered to RMMA reflectors, and then detected a pattern of fiducials mounted in a circle and a square pattern.
Upon completion of the circle or square pattern fiducial detections for one location, the AGV moved to the remaining nine other locations and poses. The AGV completed the test by moving towards the home position. Emergency stops, which are common in industrial uses of AGVs, occurred twice during the first test and once during the second test to add a semblance of reality.
______________________________________________________________________________________________________ This publication is available free of charge from
: https://doi.org/10.6028/NIS
T.TN.1965

2
A laser retroreflector was mounted in-line to the manipulator end-of-arm-tool joint and used as a reflector detection device. A circle pattern and a square of 2 mm diameter fiducial reflectors were mounted to the RMMA. Additionally, two large (42 mm) diameter reflectors were mounted within the two patterns (four total) and used as registration devices for the mobile manipulator. A “bisect with search” registration method for registering the mobile manipulator to the RMMA was developed. Once the registration was completed, the mobile manipulator was expected to then detect all fiducials within a local pattern (circle or square) to the current AGV pose. Upon completion, the manipulator stows and the AGV moves to the next pre-taught pose until all ten poses are completed.
Figure 1 – Mobile Manipulator positioned next to the reconfigurable mobile manipulator apparatus (RMMA)
______________________________________________________________________________________________________ This publication is available free of charge from
: https://doi.org/10.6028/NIS
T.TN.1965

3
a b
Figure 2 – (a) Map of AGV reference point paths (blue lines) and stop points (black dots on paths), and approximate locations of AGV wall-mounted reflectors (green circles with X’s) used for navigation. (b) AGV stop location corresponding to the map, point number corresponding to the transport structure
point, and vehicle orientation at each stop location. The left straight-to-right turn only path beginning at the unlabeled home triangle was not used.
______________________________________________________________________________________________________ This publication is available free of charge from
: https://doi.org/10.6028/NIS
T.TN.1965

4
A square search pattern provided the best search method [5] for detection of the 2 mm or smaller fiducials. An example of the square step pattern is shown in Figure 3 where the search begins away from the reflector at the chosen start point (yellow arrow dotted end). Each step moves along the small white or gray arrows until the laser retroreflector detected the fiducial reflector with the red arrow step.
Figure 3 – Example square step search pattern drawing. The pattern begins with the yellow arrow dotted end and ends when the reflector is detected with the red arrow search step.
Mobile Manipulator Algorithm The Mobile Manipulator program controlled the manipulator during the tests. It interfaced with the AGV directly to obtain the current AGV position and orientation. It also interfaced with the NDC8 [12] AGV control program (Transport Structure) running on the NDC8 Order Manager application to coordinate the motion of the arm with the motion of the AGV. The AGV control program signaled the Mobile Manipulator program when it arrived at one of the stop or test locations. The AGV control program also sent the identification number of the test location. The Mobile Manipulator program read the current AGV pose and used it to compute the initial search for the locations of the two registration reflectors in the target pattern (circle or square). Additional patterns could also have been used in the Mobile Manipulator program.
The manipulator was first moved from a stowed location over the body of the AGV to a staging location directly in front of the AGV. The manipulator was then moved from the staging location to the first of the two registration reflectors. The staging location was chosen so that the manipulator could make a straight-line motion from the staging location to a registration reflector - located in front of, or to either side of, the AGV - without colliding with its shoulder joint. After moving to the first registration reflector, the manipulator performed a square spiral search to determine the exact location of the reflector. When it determined the location of the first registration reflector, the program repeated the process with the second registration reflector. When the locations of the two registration reflectors were determined, the program had sufficient information to compute the locations of the other fiducials in the square or circular patterns. The initial registration number of iterations count was logged and included in results. Repeatability is a common metric in robotics and can be compared to the registration number within this log.
Once the locations of all reflectors in the pattern were computed, the manipulator cycled through them a set number of times – one time for the circle pattern and two times for square pattern. At each
______________________________________________________________________________________________________ This publication is available free of charge from
: https://doi.org/10.6028/NIS
T.TN.1965

5
fiducial reflector, the laser retroreflector checked to see if the manipulator was aligned with the reflector.
When the test was completed, the manipulator was moved to the staging location and then to the stow location. When the manipulator was back in the stow location, the Mobile Manipulator program signaled to the AGV control program that it was clear to move.
The positions of the circle and square patterns of fiducials were recorded prior to performing the repeatability tests. The AGV was first moved to a location where it could reach both patterns of fiducials. The current location and orientation of the AGV were recorded. The arm was repositioned manually until the sensor detected alignment [3, 5, 6] with each of the index fiducials, and the manipulator position was recorded. This information, along with the position of the manipulator base relative to the vehicle’s coordinate system, allowed the correct manipulator coordinates for the index fiducials to be calculated for an arbitrary AGV location. This allowed the AGV to approach the target/work area from any direction and to compensate for variations in the AGV’s stopping pose.
The calibration of the manipulator base location involved recording the position of one or more fiducials from a variety of locations. Both the AGV location and the manipulator coordinates of the fiducials were recorded. This data was processed using an iterative, non-linear model [13] to find the best value of the base position and orientation.
Independent Measurement System An independent measurement system was used to verify the mobile manipulator, performance measurement concept that uses an artifact. Data collected from both the NDC8 AGV Vehicle Diagnostics Tool (VDT) and the robot control program include much information about their motion and position and are provided with the accompanying data set. However, the data set sometimes is not complete; missing data or other information that may be useful to the system designer, researcher, or user is, for some reason, not included. See the Data Collection Anomalies section for these occurrences during tests.
An optical tracking system (OTS) manufactured by NaturalPoint was used for this research. There are several, similar systems on the market; these systems can be located using a simple online search. In addition to using the manufacturer’s method for calibrating the OTS used for this mobile manipulator data collection exercise, research at NIST [7, 8] has led to developing a calibration method for these systems that has recently been standardized2. We include this information here as potentially useful background information for users of optical tracking systems. Markers were mounted to the AGV and to the robot as shown in Figure 4 and are described in the Procedures.
2 https://www.astm.org/Standards/E3064.htm
______________________________________________________________________________________________________ This publication is available free of charge from
: https://doi.org/10.6028/NIS
T.TN.1965

6
Figure 4 – Highlighted (white) AGV- and robot-mounted markers and AGV wall-mounted reflectors. Two robot link markers were used, one is shown and one on the opposite side of the link (not shown). Robot
base markers were not included in Tests 1 and 2.
Ground truth of the RMMA was measured after the two tests. All fiducials and large bisect markers were unscrewed from the RMMA. A 19 mm diameter marker was placed on each screw hole where each fiducial and bisect marker was normally located (See Figure 5). Rigid bodies were created for the bisect reflector markers (BISECT), the circle pattern of markers (CIRCLE), and the square pattern of markers (SQUARE). Three data sets of approximately 30 s in duration were collected using the OTS of only the static RMMA markers. The OTS performed data collection at 120 Hz.
Figure 5 – OTS markers located on the bisect reflector, circle pattern fiducial, and square pattern fiducial locations of the RMMA measured for use as ground truth. The associated bisect reflectors and fiducials
are lying next to their respective mounting locations.
Ground truth data was also collected for the robot base to allow static correlation of the base with respect to the AGV top markers. A rigid body was created for the robot base (called ROBOT BASE) and approximately 10 s of data was collected about it simultaneously with all other robot and AGV rigid bodies. Screenshots of the OTS rigid bodies developed for the AGV and robot and for the RMMA are
AGV wall-mounted navigation reflectors
Robot link markers (1 of 2)
Robot end-of-arm-tool markers
Robot base markers
AGV wall-mounted navigation reflectors
AGV navigation sensor markers
AGV top markers
______________________________________________________________________________________________________ This publication is available free of charge from
: https://doi.org/10.6028/NIS
T.TN.1965

7
shown in the screenshots in Figure 6 a and b, respectively and correspond to Figures 4 and 5, respectively.
a
b Figure 6 – Screen shots of OTS rigid bodies developed for the (a) AGV and robot and (b) the RMMA.
Procedures Systems Setup 1. Passive optical tracking markers were installed on the AGV and the manipulator. 2. Within the Optical Tracking System (OTS) Software, two AGV rigid bodies were formed (i.e., a
grouping of specific markers on an object) surrounding the navigation sensor (called NAV) and on the surface where the robot is mounted (called AGV_TOP). Two robot rigid bodies were formed along the distal link (called ROBOT_PLATE1 and ROBOT_PLATE2) and on the end-of-arm-tool joint (called EOAT).
3. Extraneous markers within test area were covered, although there were perhaps five or so reflective spots shown on the OTS display from light reflected off the painted floor.
4. The four (two for the circle and two for the square) adjustable reconfigurable mobile manipulator (RMMA) fiducials (see Figure 3) were set to 2 mm diameter. The simplest method is to use a 2 mm diameter rod inserted within the aperture, closing the aperture until it contacts the rod, and removing the rod leaving the aperture opening set at a 2 mm diameter.
5. The manipulator step size was set to 0.5 mm within a square-step search grid pattern as shown in Figure 3.
NAV
ROBOT_PLATE1
ROBOT_PLATE2
ROBOT BASE
EOAT
AGV_TOP
Square pattern of fiducials Bisect reflectors Circle pattern of fiducials
______________________________________________________________________________________________________ This publication is available free of charge from
: https://doi.org/10.6028/NIS
T.TN.1965
8
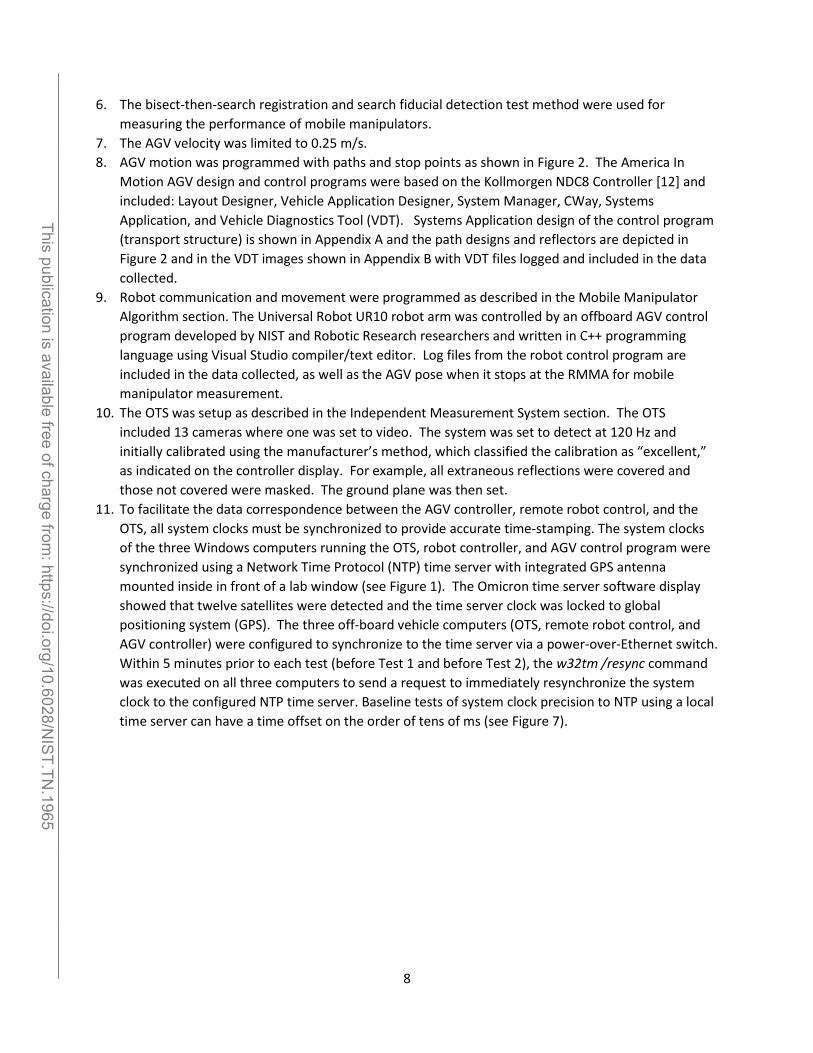
6. The bisect-then-search registration and search fiducial detection test method were used for measuring the performance of mobile manipulators.
7. The AGV velocity was limited to 0.25 m/s. 8. AGV motion was programmed with paths and stop points as shown in Figure 2. The America In
Motion AGV design and control programs were based on the Kollmorgen NDC8 Controller [12] and included: Layout Designer, Vehicle Application Designer, System Manager, CWay, Systems Application, and Vehicle Diagnostics Tool (VDT). Systems Application design of the control program (transport structure) is shown in Appendix A and the path designs and reflectors are depicted in Figure 2 and in the VDT images shown in Appendix B with VDT files logged and included in the data collected.
9. Robot communication and movement were programmed as described in the Mobile Manipulator Algorithm section. The Universal Robot UR10 robot arm was controlled by an offboard AGV control program developed by NIST and Robotic Research researchers and written in C++ programming language using Visual Studio compiler/text editor. Log files from the robot control program are included in the data collected, as well as the AGV pose when it stops at the RMMA for mobile manipulator measurement.
10. The OTS was setup as described in the Independent Measurement System section. The OTS included 13 cameras where one was set to video. The system was set to detect at 120 Hz and initially calibrated using the manufacturer’s method, which classified the calibration as “excellent,” as indicated on the controller display. For example, all extraneous reflections were covered and those not covered were masked. The ground plane was then set.
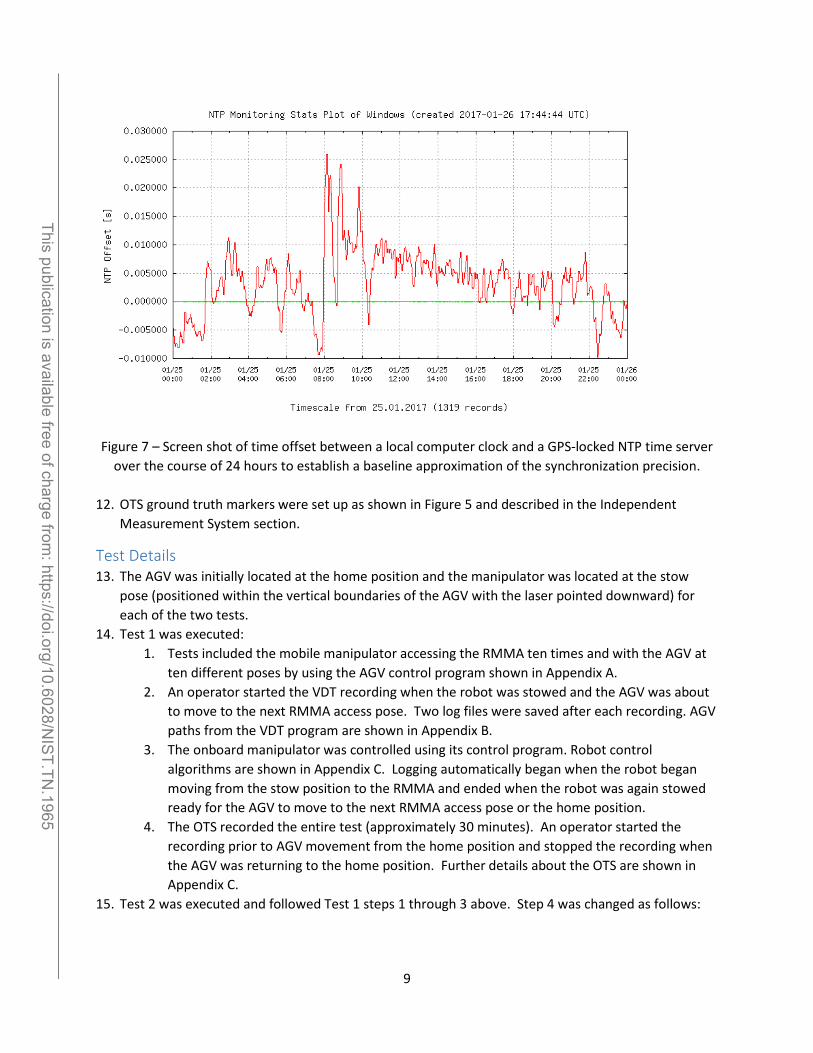
11. To facilitate the data correspondence between the AGV controller, remote robot control, and the OTS, all system clocks must be synchronized to provide accurate time-stamping. The system clocks of the three Windows computers running the OTS, robot controller, and AGV control program were synchronized using a Network Time Protocol (NTP) time server with integrated GPS antenna mounted inside in front of a lab window (see Figure 1). The Omicron time server software display showed that twelve satellites were detected and the time server clock was locked to global positioning system (GPS). The three off-board vehicle computers (OTS, remote robot control, and AGV controller) were configured to synchronize to the time server via a power-over-Ethernet switch. Within 5 minutes prior to each test (before Test 1 and before Test 2), the w32tm /resync command was executed on all three computers to send a request to immediately resynchronize the system clock to the configured NTP time server. Baseline tests of system clock precision to NTP using a local time server can have a time offset on the order of tens of ms (see Figure 7).
______________________________________________________________________________________________________ This publication is available free of charge from
: https://doi.org/10.6028/NIS
T.TN.1965
9
Figure 7 – Screen shot of time offset between a local computer clock and a GPS-locked NTP time server over the course of 24 hours to establish a baseline approximation of the synchronization precision.
12. OTS ground truth markers were set up as shown in Figure 5 and described in the Independent
Measurement System section.
Test Details 13. The AGV was initially located at the home position and the manipulator was located at the stow
pose (positioned within the vertical boundaries of the AGV with the laser pointed downward) for each of the two tests.
14. Test 1 was executed: 1. Tests included the mobile manipulator accessing the RMMA ten times and with the AGV at
ten different poses by using the AGV control program shown in Appendix A. 2. An operator started the VDT recording when the robot was stowed and the AGV was about
to move to the next RMMA access pose. Two log files were saved after each recording. AGV paths from the VDT program are shown in Appendix B.
3. The onboard manipulator was controlled using its control program. Robot control algorithms are shown in Appendix C. Logging automatically began when the robot began moving from the stow position to the RMMA and ended when the robot was again stowed ready for the AGV to move to the next RMMA access pose or the home position.
4. The OTS recorded the entire test (approximately 30 minutes). An operator started the recording prior to AGV movement from the home position and stopped the recording when the AGV was returning to the home position. Further details about the OTS are shown in Appendix C.
15. Test 2 was executed and followed Test 1 steps 1 through 3 above. Step 4 was changed as follows:
______________________________________________________________________________________________________ This publication is available free of charge from
: https://doi.org/10.6028/NIS
T.TN.1965

10
4. The OTS recorded the entire test (approximately 35 minutes). An operator started the recording prior to AGV movement from the home position and stopped the recording when the AGV was returning to the home position.
Log Files Log file information for each of the AGV, Manipulator, and OTS are shown: in Appendix D for Test 1, in Appendix E for Test 2, and in Appendix F for Ground Truth.
Data Collection Anomalies Four known anomalies, numbered below, occurred in the data collected during the two tests. Instead of retaking data, these anomalies were deemed to be potentially useful to the data user. The events were included in the data set as a unique occurrence, although potentially a situation that might occur in industry.
1. During both tests, the VDT data file inconsistently collected data when the vehicle stopped and the robot was asked to perform a task. Although the robot controller logged data both when the vehicle stopped and when the robot began registration with the RMMA, there is still a gap in that data. Figure 8 shows a sample of the VDT data with this gap shown as an error. The gap/error occurs when the AGV controller communicates to the robot controller that it has stopped and to relinquish control until receiving a “continue AGV control” handshake where once again, the AGV can continue motion control. During this communication, the AGV is decelerating and coming to a steady state stop, which can vary in time depending on the floor surface undulation or the AGV system itself.
Figure 8 – Gap (blue highlight) in data from the AGV VDT program when the vehicle was at a stop location waiting for the robot to communicate to the AGV that it can again continue motion control.
______________________________________________________________________________________________________ This publication is available free of charge from
: https://doi.org/10.6028/NIS
T.TN.1965

11
2. During Test 1, while the AGV was accessing the seventh pose, the safety laser protecting obstacles near the forks detected a safety cone within its rotation path and caused an emergency stop. The test was continued upon an AGV reset.
3. During Test 1, while returning to the home position, the AGV veered off-path by more than the approximate 76 mm (3 in) safety standard allowance and emergency stopped itself. The event was also recorded with both the OTS and the VDT.
4. During Test 2, while the AGV was returning to the home position, it again veered off-path by more than the approximate 76 mm (3 in) safety standard allowance and emergency stopped itself. The event was also recorded with both the OTS and the VDT.
Data Correspondence Between Log Files Example Robot controller data log file When the AGV stops and the robot controller begins logging data, the log file is produced and corresponds to the time when the robot begins moving from the stow position to the first bisect reflector (i.e., marker -1). For example, in the file: “data_2017-03-08_11.21.21_circle.csv”, start would be at time “8.959”. See Figure 9.
Figure 9 – Example log file and highlighted timestamped data line that corresponds with the AGV and OTS log files.
Example AGV data log file The AGV logs data from the Vehicle Diagnostics Application (VDA) with timestamping shown in Unix epoch format (i.e., the number of seconds that have elapsed since 00:00:00 Coordinated Universal Time (UTC), January 1, 1970, not counting leap seconds in local time). Within the VDA file: “8Mar2017-1123test.bz2”, data covers time from the 1120 (home to pose 1) test through 1123 (pose 1 to pose 2) test. Within the 8Mar2017-1123test.bz2 file, timestamp “set 1488990089.9447” corresponds to the robot data log file: “data_2017-03-08_11.21.21”, data point “8.959”. The log data line corresponding to this timestamp shows:
set 1488990089.9447 0 0.0285 0 0.0182 0 0.0182
This time is when the robot initially moves from the stow position to the first bisect reflector; i.e., marker -1. Note that between “set 1488990140.2395” and “set 1488990210.4846”, there is a gap in the data during this time so no correspondence can occur here across the robot log file and the AGV log file.
Example Optical Tracking System data log file Within log file: “Take 2017-03-08 11.20.45 AM_truncated”, the timestamped data point: “44.95833” corresponds to the nearest timestamp to the above robot data and AGV data. See Figure 10.
______________________________________________________________________________________________________ This publication is available free of charge from
: https://doi.org/10.6028/NIS
T.TN.1965

12
Figure 10 – Example log file and highlighted timestamped data line that corresponds to the AGV and robot log files.
Time Correspondence across data files A Time Correspondence program was developed to correlate the time stamps when the robot, AGV, and OTS all logged data at approximately the same start-activity time, including the time when a file was produced and the time when a reflector was detected. An example of the program output is shown in Figure 10. The output includes data files from the Robot, AGV, and OTS and uses the three associated Unix timestamps when the laser retroreflector (i.e., EOAT) registers with the -1 marker (i.e., first bisect reflector). The program then shows the start time of the OTS program file and the time to generate the robot log file. It then provides an estimated offset time from the robot to the OTS files to provide a check to the data user on where to locate this data point and correlate times. The program translated the file’s local timestamps from the OTS (OTS Time column) and robot (Robot Time column) into UTC and finally Unix timestamp epoch, which is the number of seconds since January 1, 1970.
Each measurement in the robot file has a relative offset from file creation; this offset was added to provide the values for the column “Robot Start Time” in Figure 11. The difference between the column Robot Start Time (s) and OTS Time is computed to provide a relative OTS Offset (s) estimate. The estimate is then compared to the row in the OTS data with the closest time-stamp before the OTS estimated offset to determine the OTS data point corresponding to the robot and AGV measurements. Similarly, the corresponding robot time is shown for the AGV. Appendix G shows the time correspondence across all data files using this format.
Figure 11 – Example time correspondence across the robot, OTS, and AGV files output from the Time Correspondence program.
References [1] Bostelman R., Hong T., Marvel J., “Survey of Research for Performance Measurement of Mobile
Manipulators”, Journal of Research of the National Institute of Standards and Technology, Volume 121 (2016), March. 2015.
[2] National Institute of Standards and Technology (NIST) Robotic Systems for Smart Manufacturing Program, https://www.nist.gov/programs-projects/robotic-systems-smart-manufacturing-program, accessed February 8, 2017.
______________________________________________________________________________________________________ This publication is available free of charge from
: https://doi.org/10.6028/NIS
T.TN.1965
13
[3] Bostelman, R., Hong, T., Marvel, J. “Performance Measurement of Mobile Manipulators”, SPIE 2015, Baltimore, MD, April 2015.
[4] Bostelman R., Hong T., Cheok G., “Navigation performance evaluation for automatic guided vehicles”, IEEE International Conf. on Technologies for Practical Robot Applications (TePRA), May 11, 2015.
[5] Bostelman, R., Eastman, R., Hong, T., Enein, O. A., Legowik, S., and Foufou, S. “Comparison of Registration Methods for Mobile Manipulators”, In 19th International Conf. on CLAWAR, London, UK, September 2016.
[6] Bostelman, R., Foufou, S., Legowik, S., and Hong T., “Mobile Manipulator Performance Measurement Towards Manufacturing Assembly Tasks” PLM 2016, Charleston, SC, 2016.
[7] Bostelman, R., Hong, T., Legowik, S., and Shah, M. “Dynamic Metrology and ASTM E57.02 Dynamic Measurement Standard”, CMSC Conf. 2016,
[8] Bostelman, R., Falco, J., Shah, M., and Hong T., “Dynamic Metrology Performance Measurement of a Six Degree-Of-Freedom Tracking System used in Smart Manufacturing”, ASTM International “Autonomous Industrial Vehicles: From the Laboratory to the Factory Floor” book chapter, 2016.
[9] “Motion Capture Software Developers in the US: Market Research Report,” IBISWorld 2014 [10] Bostelman, R., Falco, J., Shah, M., and Hong, T., “Dynamic Metrology Performance Measurement of
a Six Degree-Of-Freedom Tracking System used in Smart Manufacturing," book chapter, ASTM International, Washington, DC 20036
[11] OptiTrack, http://wiki.optitrack.com/index.php?title=Motive_Basics, accessed March 2017. [12] NDC8 Controller, http://ndcsolutions.com/, accessed March 2017. [13] Steven Legowik, Roger Bostelman and Tsai Hong, “Sensor Calibration and Registration for Mobile
Manipulators”, Fifth International Conference on Advances in Vehicular Systems, Technologies and Applications, VEHICULAR 2016, Barcelona, Spain, November 13 - 17, 2016.
______________________________________________________________________________________________________ This publication is available free of charge from
: https://doi.org/10.6028/NIS
T.TN.1965

14
Appendices Appendix A - AGV transport structure Figure A-1 shows the transport structure to control the AGV through tests 1 and 2.
Figure A-1 – Transport structure program used to control the AGV during tests.
______________________________________________________________________________________________________ This publication is available free of charge from
: https://doi.org/10.6028/NIS
T.TN.1965

15
Appendix B - AGV paths from the Vehicle Diagnostics Tool Figures B-1 a, b, and c show screenshots from the AGV Diagnostics Tool application during test 2 (test 1 included similar information). The images show the programmed points (red), planned paths (green), actual paths driven (blue), facility reflectors (gray dots), and navigation sensor detection of reflectors (gray lines) at consecutive points in time during Test 2.
a
b
______________________________________________________________________________________________________ This publication is available free of charge from
: https://doi.org/10.6028/NIS
T.TN.1965

16
c
Figure B-1 a, b, c - Snapshots of the Vehicle Diagnostics Tool showing the programmed points (red), planned paths (green), actual paths driven (blue), facility reflectors (gray dots), and navigation sensor
detection of reflectors (gray lines) at consecutive points in time during Test 2.
______________________________________________________________________________________________________ This publication is available free of charge from
: https://doi.org/10.6028/NIS
T.TN.1965

17
Appendix C - Optical Tracking System information Numerous optical tracking systems (OTS), including motion capture systems, have been developed in research centers and commercialized [9]. These OTS systems are proving useful as ground truth measurement systems to assess the performance of robots, autonomous ground vehicles, and assembly tasks in smart manufacturing. In order to be used as ground truth, the accuracy of the OTS must be at least ten times better than a given system under test. The twelve-camera OTS system which has submillimeter uncertainty in our setting [10] serves as ground truth for evaluating the performance of an automatic guided vehicle (AGV) with an onboard robot arm (mobile manipulator) and for evaluating the performance of robotic workstation assembly tasks (see Figure C-1).
Figure C- 1 The lab is equipped with twelve (six are shown and circled in red) optical tracking system cameras. The data is collected over an area of approximately 13000 mm x 6000 mm while the optical
tracking system tracked the mobile manipulator motion. The laser tracker on the left was not used for this data collection.
The OTS tracking system will save the Take files (TAK), Project files (TTP), and Calibration (CAL) [11]. The information in TAK files is described in [11]. The TAK file name includes the time that the file was created (e.g., Take 2017-03-08 12.48.17 PM.csv). Each TAK file contains the frame number, relative time stamp, rigid body name and pose (i.e., position and orientation), pose error, and each marker pose with marker quality. TAK files are then exported into .csv files and for this data set are shown in Appendices D and E.
______________________________________________________________________________________________________ This publication is available free of charge from
: https://doi.org/10.6028/NIS
T.TN.1965

18
Appendix D - Test 1 data files and file information The three systems (AGV, manipulator, and OTS) have associated data collected during Test 1 where the test includes one large OTS data log.
AGV VDT - .bz2 files VDT files are named by the operator and .bz2 (.bz2) suffixed files listed in Figure D-1 are labeled with (from left to right) the file data and time, the file close date, the file type, and the file size, respectively, across columns (see Appendices D and E). Information shown within these files is described in the NDC8 controller documents [12] for the VDT program. Within the file are text lines, which, among other line-leaders, shows ‘set’, ‘laser’, ‘state’, and ‘usedrefl’. Epoch time immediately follows these line-leaders. The remaining information provided in this file contains status information of the vehicle. The user should consult NDC for further description.
Figure D-1 - List of BZ2 file types that include timestamp and laser navigation sensor data.
AGV - .csv files Figure D-2 shows a list of comma separated value files with (from left to right) .csv suffixes named by the operator and adding to the vehicle internet protocol address with _file data and time, followed by the file close date, the file type, and the file size, respectively, across columns (see Appendices D and E). Information shown within these files is described in the NDC8 controller documents [12] for the VDT program. Within the file are headers on columns as shown in Figure D-3. The headers refer to the AGV X, Y, and angle with respect to 0⁰ as shown in Figure 2. The NavLevel column refers to the navigation confidence level, 100 being the highest. The user should consult NDC for further description.
______________________________________________________________________________________________________ This publication is available free of charge from
: https://doi.org/10.6028/NIS
T.TN.1965

19
Figure D-2 - List of comma separated value files that include AGV position and orientation.
Figure D-3 – Snapshot of AGV .csv file header and data.
Robot log files Robot log files, suffixed with .dat, are listed in Figure D-4 and are automatically created and named by the robot control program with file creation date/time and pattern measured. The following columns show the date/time when the file was automatically closed, the file type, and the file size. An example of the log file data within a .dat log file is shown in Figure D-5 with further explanation where needed.
Figure D-4 - List of robot log DAT files for Test 1.
Log File Information Explanation of Data Entry Averaging 10 positions Averaging multiple AGV position values to
get a more stable value.
Sample spread: 1.6mm 1mm 0.0515662deg Range of AGV position values (x, y, and angle) averaged to get reported AGV pose value
Vehicle position = 7155.56 11808.9 90.1583 AGV pose (X, Y, angle) Starting circle Pattern of fiducials Pausing 0.1 seconds. Pause to allow arm to settle after moving
to initial positon
______________________________________________________________________________________________________ This publication is available free of charge from
: https://doi.org/10.6028/NIS
T.TN.1965

20
Bisecting point... Beginning bisect 1 of 2 x dim = 44.5 Length of chord in x direction y dim = 43.4194 Length of chord in y direction Pausing 0.1 seconds. Pause to allow arm to settle after move to
center of reflector point moved from -6.93095 -768.802 to -17.681 -768.592
Initial position estimate and bisected center
distance = 10.752 Distance between initial position estimate and bisected center
Pausing 0.1 seconds. Pause to let arm settle Bisecting point... Beginning bisect 2 of 2 x dim = 43 Length of chord in x direction y dim = 42.0312 Length of chord in y direction Pausing 0.1 seconds. Pause to let arm settle point moved from -1.98639 -464.069 to -13.9864 -466.554
Initial estimate of position and bisected center
distance = 12.2545 Distance between initial estimate and bisected center
running 2 iterations Number of pattern iterations Starting iteration 0 65.2586 Moving to position[0] : [-168.222, -615.709, 328, 180, 0, 90]
at position[0]. First fiducial position 66.6558 at [-168.263, -615.776, 328.089, -180, 0.014069, 90.0037]
Running spiral search... Didn’t immediately detect fiducial, running search
66.6573 Running spiral search These are the positions commanded as the search progresses. Each should be a 0.5 mm move.
66.6574 at [-167.763, -615.776, 328.089, -180, 0.014069, 90.0037]
EOAT [x, y, z, roll, pitch, yaw]
66.761 at [-168.263, -615.276, 328.089, -180, 0.014069, 90.0037]
66.864 at [-168.763, -615.776, 328.089, -180, 0.014069, 90.0037]
67.857 at [-168.263, -616.276, 328.089, -180, 0.014069, 90.0037]
68.51 at [-167.263, -616.276, 328.089, -180, 0.014069, 90.0037]
69.0611 at [-167.263, -615.276, 328.089, -180, 0.014069, 90.0037]
69.6631 at [-167.763, -614.776, 328.089, -180, 0.014069, 90.0037]
70.2571 at [-168.763, -614.776, 328.089, -180, 0.014069, 90.0037]
______________________________________________________________________________________________________ This publication is available free of charge from
: https://doi.org/10.6028/NIS
T.TN.1965

21
70.8591 at [-169.263, -615.276, 328.089, -180, 0.014069, 90.0037]
71.4611 at [-169.263, -616.276, 328.089, -180, 0.014069, 90.0037]
72.0622 at [-168.763, -616.776, 328.089, -180, 0.014069, 90.0037]
72.6652 at [-167.763, -616.776, 328.089, -180, 0.014069, 90.0037]
73.2662 at [-166.763, -616.776, 328.089, -180, 0.014069, 90.0037]
73.8682 at [-166.763, -615.776, 328.089, -180, 0.014069, 90.0037]
74.2692 at [-166.763, -614.776, 328.089, -180, 0.014069, 90.0037]
74.8713 at [-167.263, -614.276, 328.089, -180, 0.014069, 90.0037]
75.4725 Search stopped successfully at offset [0.947901, 1.4491] after 8.80808 seconds and 33 steps.
Completed iteration 0 75.4751 Moving to position[1] : [137.503, -617.988, 328.089, -180, 0.0125922, 89.9948]
Move to second fiducial : EOAT [x, y, z, roll, pitch, yaw]
at position[1]. 77.0722 at [137.491, -617.909, 327.947, -179.995, 0.00257236, 89.9823]
(Repeat from above.)
Running spiral search... 77.0734 Running spiral search 77.0734 at [137.991, -617.909, 327.947, -179.995, 0.00257236, 89.9823]
77.1764 at [137.491, -617.409, 327.947, -179.995, 0.00257236, 89.9823]
77.8734 at [136.991, -617.909, 327.947, -179.995, 0.00257236, 89.9823]
Figure D-5 – Robot .dat file example showing column labels and data.
Robot log files, suffixed with .csv, are listed in Figure D-6 and are automatically created and named by the robot control program with file creation date/time and pattern measured. The following columns show the date/time when the file was automatically closed, the file type, and the file size. An example of the log file data within a .csv log file is shown in Figure D-7a, b, c.
______________________________________________________________________________________________________ This publication is available free of charge from
: https://doi.org/10.6028/NIS
T.TN.1965

22
Figure D-6 - List of comma separated value robot log files for Test 1.
a
b
c
______________________________________________________________________________________________________ This publication is available free of charge from
: https://doi.org/10.6028/NIS
T.TN.1965

23
Figure D-7 - Robot .csv file example showing a) full data as shown in the file and larger b) left and c) right sides of the full data shown for readability.
Descriptions of the data entries for each column shown if Figure D-7 are shown in Figure D-8. The example data shown was collected when the robot was measured using the circle pattern.
Log File Header Explanation of Header time Timestamp when data was collected iter Iteration of the test: 0 = prior to collecting the
circle pattern data; 1 = collecting circle pattern fiducial data
marker Bisect or fiducial marker: -1 & -2 = left and right, respectively, bisect registration reflectors; 0 & 1 iteration 0 markers = fiducials with variable diameter aperture; 0 through 6 iteration 1 markers = aperture and fixed diameter fiducials
init_x Initial x robot position init_y Initial y robot position init_z Initial z robot position init_xrot Initial x robot rotation init_yrot Initial y robot rotation init_zrot Initial z robot rotation ok 1 = when the search found the target; 0 = the
search timed out; Any other number = the time when the search detected the target.
time Time to complete the iteration. 1 = detection occurred at the robot move to the fiducial (i.e., no further search was required to detect the fiducial)
steps Number of search moves to detect the edge of the bisect registration reflector or to detect the fiducial
x Final x robot position y Final y robot position z Final z robot position xrot Final x robot rotation yrot Final y robot rotation zrot Final z robot rotation
Figure D-8 - Robot .csv log file headers and explanation of headers for each column of data.
OTS log files OTS log files are automatically created and labeled by the OTS Tracking program including (from left to right columns in Figure D-9): filename labeled with creation date/time, date/time when the file was processed, file type, and file size.
______________________________________________________________________________________________________ This publication is available free of charge from
: https://doi.org/10.6028/NIS
T.TN.1965

24
Figure D-9 - OTS log file for test 1.
______________________________________________________________________________________________________ This publication is available free of charge from
: https://doi.org/10.6028/NIS
T.TN.1965
25
Appendix E - Test 2 data files The three systems (AGV, manipulator, and OTS) have associated data collected during Test 2 where the test includes ten data logs - one for each AGV pose.
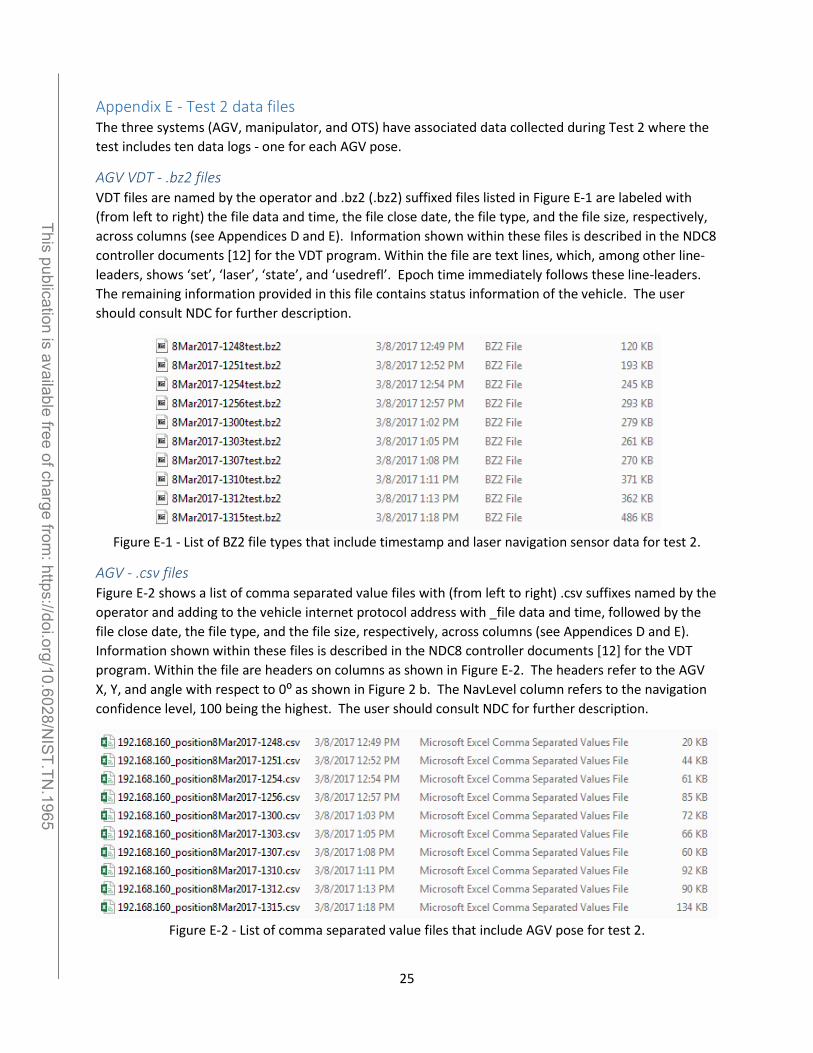
AGV VDT - .bz2 files VDT files are named by the operator and .bz2 (.bz2) suffixed files listed in Figure E-1 are labeled with (from left to right) the file data and time, the file close date, the file type, and the file size, respectively, across columns (see Appendices D and E). Information shown within these files is described in the NDC8 controller documents [12] for the VDT program. Within the file are text lines, which, among other line-leaders, shows ‘set’, ‘laser’, ‘state’, and ‘usedrefl’. Epoch time immediately follows these line-leaders. The remaining information provided in this file contains status information of the vehicle. The user should consult NDC for further description.
Figure E-1 - List of BZ2 file types that include timestamp and laser navigation sensor data for test 2.
AGV - .csv files Figure E-2 shows a list of comma separated value files with (from left to right) .csv suffixes named by the operator and adding to the vehicle internet protocol address with _file data and time, followed by the file close date, the file type, and the file size, respectively, across columns (see Appendices D and E). Information shown within these files is described in the NDC8 controller documents [12] for the VDT program. Within the file are headers on columns as shown in Figure E-2. The headers refer to the AGV X, Y, and angle with respect to 0⁰ as shown in Figure 2 b. The NavLevel column refers to the navigation confidence level, 100 being the highest. The user should consult NDC for further description.
Figure E-2 - List of comma separated value files that include AGV pose for test 2.
______________________________________________________________________________________________________ This publication is available free of charge from
: https://doi.org/10.6028/NIS
T.TN.1965

26
Robot log files Robot log files are automatically created and labeled by the robot control program with file creation date/time and pattern measured. The second column shows the date/time when the file was automatically closed. Figure E-3 shows a list of DAT robot log files and Figure E-4 shows a list of comma separated value robot log files.
Figure E-3 - List of DAT robot log files for test 2.
Figure E-4 - List of comma separated value robot log files for test 2.
OTS log files OTS log files are automatically created and labeled by the OTS Tracking program including (from left to right columns in Figure E-5): filename labeled with creation date/time, date/time when the file was processed, file type, and file size.
______________________________________________________________________________________________________ This publication is available free of charge from
: https://doi.org/10.6028/NIS
T.TN.1965

27
Figure E-5 - List of OTS log files for test 2.
______________________________________________________________________________________________________ This publication is available free of charge from
: https://doi.org/10.6028/NIS
T.TN.1965

28
Appendix F – Ground Truth data files OTS log files are automatically created and labeled by the OTS Tracking program including (from left to right columns in Figures F-1 and F-2): filename labeled with creation date/time, date/time when the file was processed, file type, and file size.
OTS files of the RMMA
Figure F-1 – List of RMMA ground truth files
OTS file of the Static AGV and robot
Figure F-2 - Static AGV and robot rigid body data capture file, including the robot base.
______________________________________________________________________________________________________ This publication is available free of charge from
: https://doi.org/10.6028/NIS
T.TN.1965

29
Appendix G - Time Correspondence Across All Data Files
Figure G-1 - Time Correspondence Across All Data Files
______________________________________________________________________________________________________ This publication is available free of charge from
: https://doi.org/10.6028/NIS
T.TN.1965