mobile traffic forecasts 2010-2020 - ungisgroups.itu.int/portals/17/sg5/wp5d/2-3 umts forum...
TRANSCRIPT
UMTS Forum Report 44
Mobile traffic forecasts 2010-2020
© UMTS Forum January 2011
Mobile traffic forecasts
2010-2020A report by the UMTS Forum
Copyright © UMTS Forum January 2011
Prepared for the UMTS Forum by
IMT.UPDATE workshop
21.03.2011/AWG/Bangkok
Rauno RUISMÄKI (Nokia)

UMTS Forum Report 44
Mobile traffic forecasts 2010-2020
© UMTS Forum January 2011
Scope of the new UMTS Forum Report #44«Mobile traffic forecasts 2010-2020 »
The report covers:
► Main trends and drivers for Mobile Broadband (MBB) for years 2010-2020
► Collection of MBB deployment statistics
► The development of a model for the evolution of mobile traffic and services
► Global traffic forecasts and traffic forecasts for a representative Western European country

UMTS Forum Report 44
Mobile traffic forecasts 2010-2020
© UMTS Forum January 2011
Trends and drivers
UMTS Forum Report 44
Mobile traffic forecasts 2010-2020
© UMTS Forum January 2011
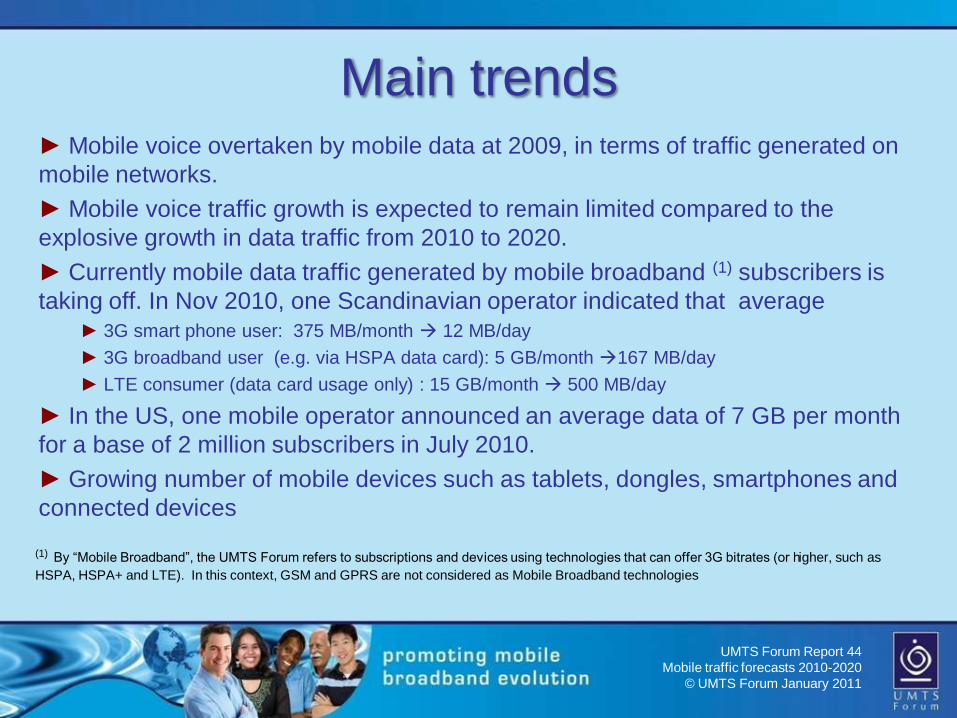
Main trends► Mobile voice overtaken by mobile data at 2009, in terms of traffic generated on
mobile networks.
► Mobile voice traffic growth is expected to remain limited compared to the
explosive growth in data traffic from 2010 to 2020.
► Currently mobile data traffic generated by mobile broadband (1) subscribers is
taking off. In Nov 2010, one Scandinavian operator indicated that average► 3G smart phone user: 375 MB/month 12 MB/day
► 3G broadband user (e.g. via HSPA data card): 5 GB/month 167 MB/day
► LTE consumer (data card usage only) : 15 GB/month 500 MB/day
► In the US, one mobile operator announced an average data of 7 GB per month
for a base of 2 million subscribers in July 2010.
► Growing number of mobile devices such as tablets, dongles, smartphones and
connected devices
(1) By “Mobile Broadband”, the UMTS Forum refers to subscriptions and devices using technologies that can offer 3G bitrates (or higher, such as
HSPA, HSPA+ and LTE). In this context, GSM and GPRS are not considered as Mobile Broadband technologies
UMTS Forum Report 44
Mobile traffic forecasts 2010-2020
© UMTS Forum January 2011
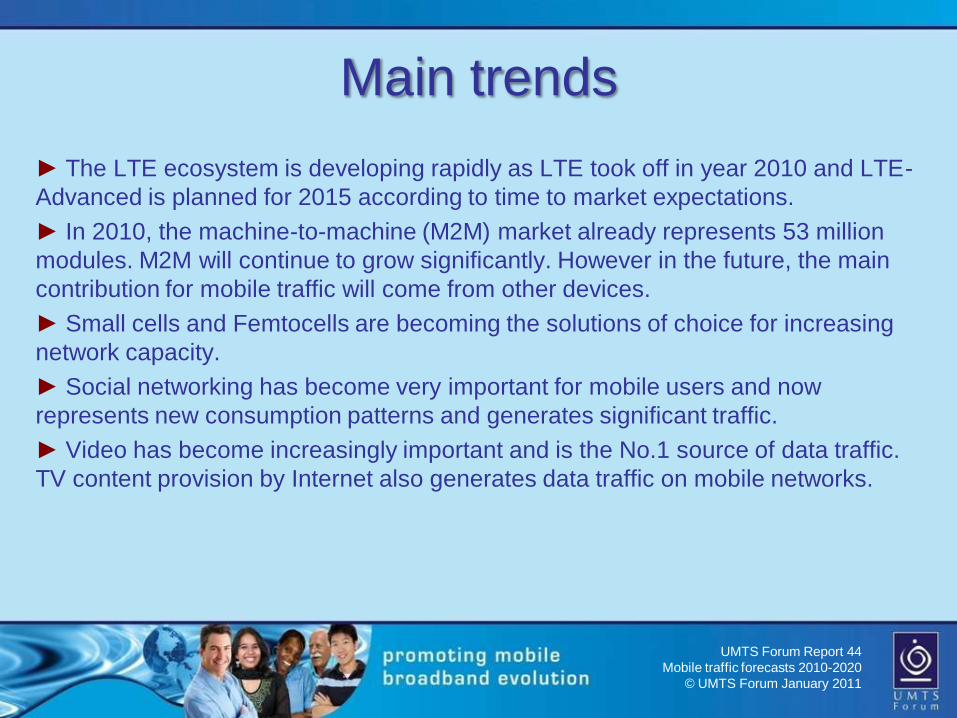
Main trends
► The LTE ecosystem is developing rapidly as LTE took off in year 2010 and LTE-
Advanced is planned for 2015 according to time to market expectations.
► In 2010, the machine-to-machine (M2M) market already represents 53 million
modules. M2M will continue to grow significantly. However in the future, the main
contribution for mobile traffic will come from other devices.
► Small cells and Femtocells are becoming the solutions of choice for increasing
network capacity.
► Social networking has become very important for mobile users and now
represents new consumption patterns and generates significant traffic.
► Video has become increasingly important and is the No.1 source of data traffic.
TV content provision by Internet also generates data traffic on mobile networks.
UMTS Forum Report 44
Mobile traffic forecasts 2010-2020
© UMTS Forum January 2011
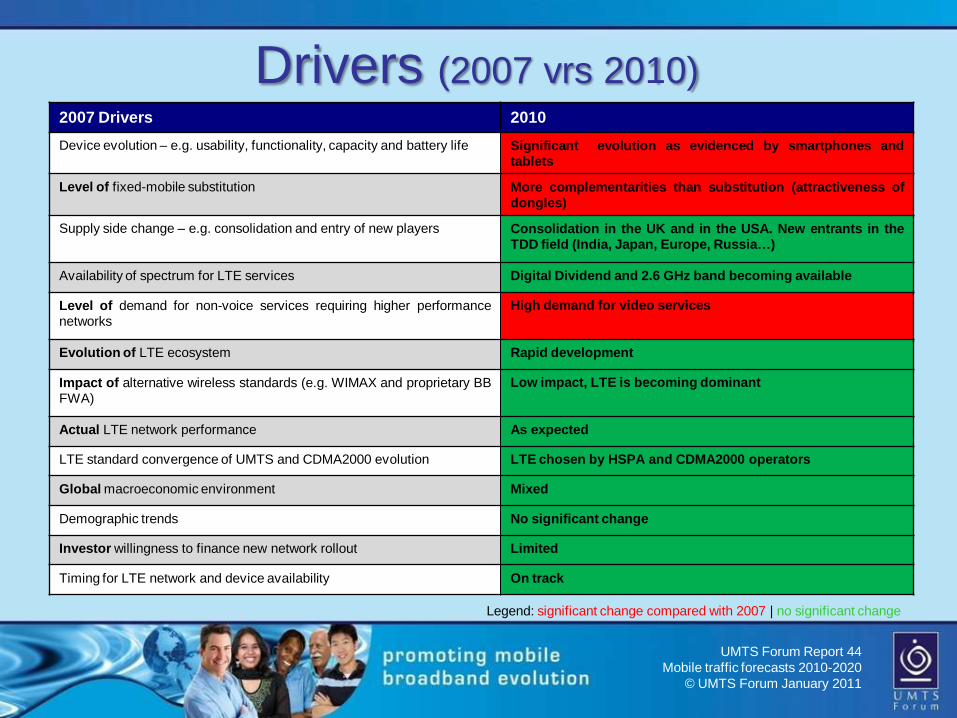
Drivers (2007 vrs 2010)2007 Drivers 2010
Device evolution – e.g. usability, functionality, capacity and battery life Significant evolution as evidenced by smartphones andtablets
Level of fixed-mobile substitution More complementarities than substitution (attractiveness ofdongles)
Supply side change – e.g. consolidation and entry of new players Consolidation in the UK and in the USA. New entrants in theTDD field (India, Japan, Europe, Russia…)
Availability of spectrum for LTE services Digital Dividend and 2.6 GHz band becoming available
Level of demand for non-voice services requiring higher performancenetworks
High demand for video services
Evolution of LTE ecosystem Rapid development
Impact of alternative wireless standards (e.g. WIMAX and proprietary BBFWA)
Low impact, LTE is becoming dominant
Actual LTE network performance As expected
LTE standard convergence of UMTS and CDMA2000 evolution LTE chosen by HSPA and CDMA2000 operators
Global macroeconomic environment Mixed
Demographic trends No significant change
Investor willingness to finance new network rollout Limited
Timing for LTE network and device availability On track
Legend: significant change compared with 2007 | no significant change
UMTS Forum Report 44
Mobile traffic forecasts 2010-2020
© UMTS Forum January 2011
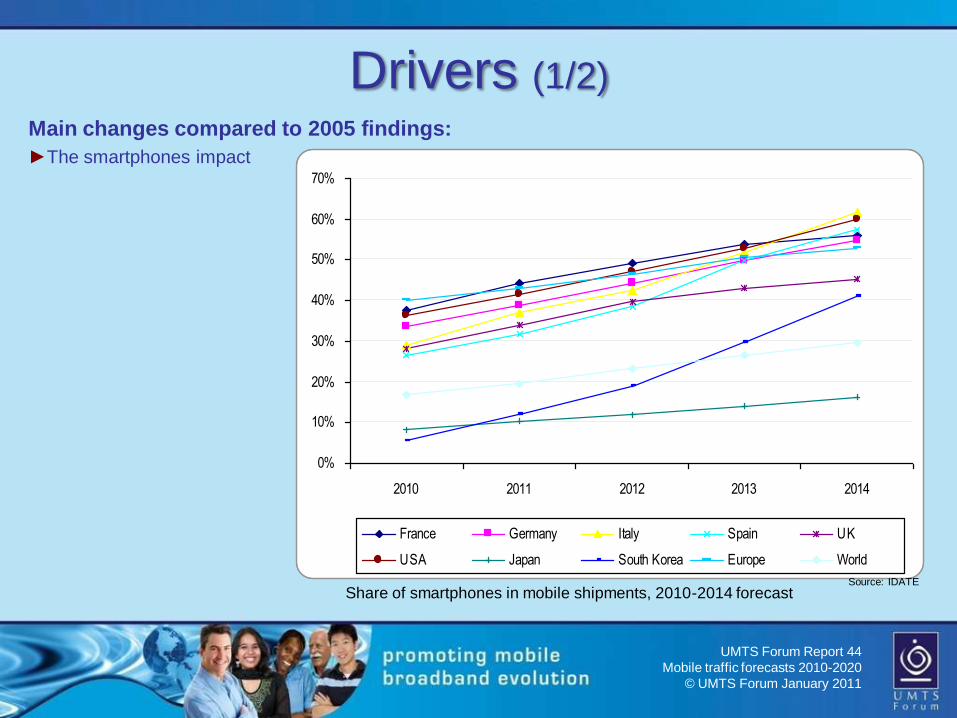
Drivers (1/2)
Main changes compared to 2005 findings:
►The smartphones impact
0%
10%
20%
30%
40%
50%
60%
70%
2010 2011 2012 2013 2014
France Germany Italy Spain UK
USA Japan South Korea Europe World
Source: IDATE
Share of smartphones in mobile shipments, 2010-2014 forecast
UMTS Forum Report 44
Mobile traffic forecasts 2010-2020
© UMTS Forum January 2011
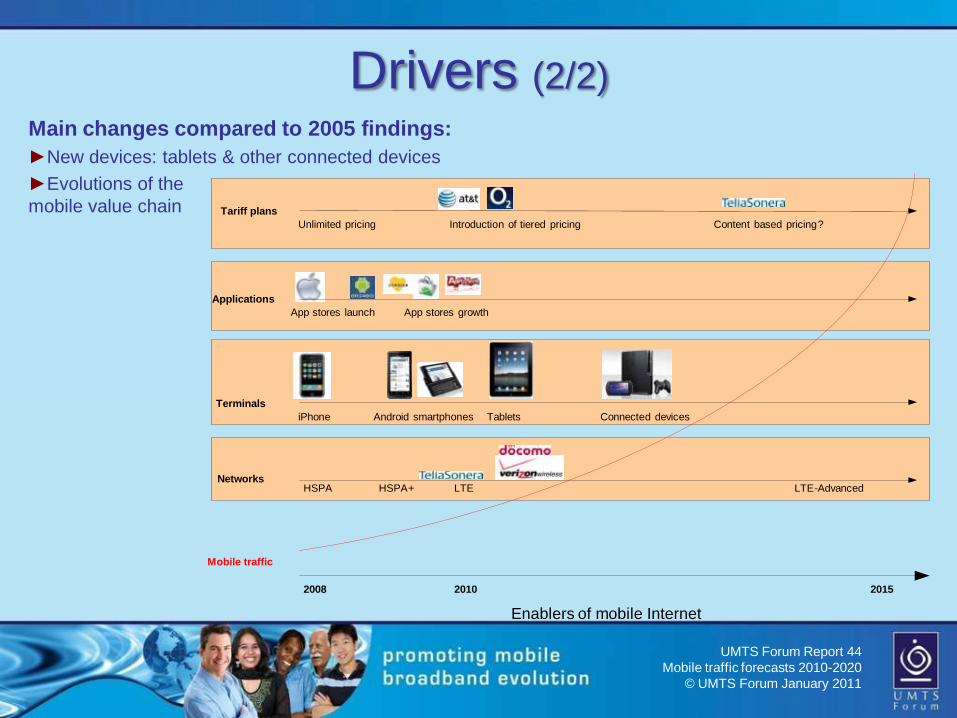
Drivers (2/2)
Main changes compared to 2005 findings:
►New devices: tablets & other connected devices
►Evolutions of the
mobile value chain
Enablers of mobile Internet
2008 2010 2015
Mobile traffic
Networks
Terminals
Applications
Tariff plans
HSPA HSPA+ LTE LTE-Advanced
App stores launch App stores growth
iPhone Android smartphones Tablets Connected devices
Unlimited pricing Introduction of tiered pricing Content based pricing?
UMTS Forum Report 44
Mobile traffic forecasts 2010-2020
© UMTS Forum January 2011
MBB-statistics of today
UMTS Forum Report 44
Mobile traffic forecasts 2010-2020
© UMTS Forum January 2011
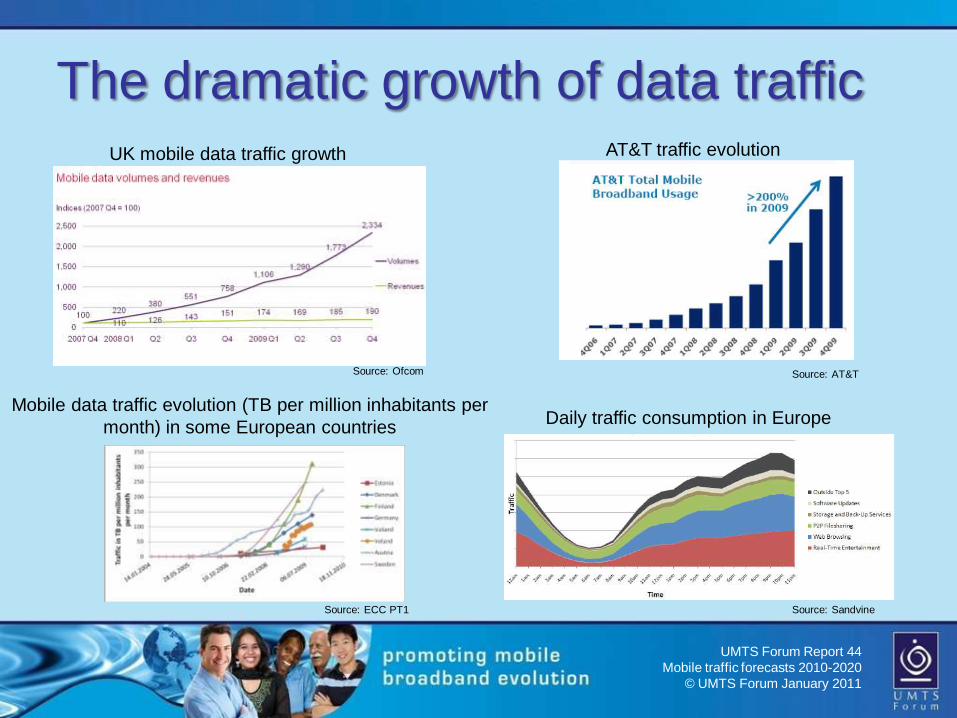
The dramatic growth of data traffic
AT&T traffic evolutionUK mobile data traffic growth
Source: Ofcom Source: AT&T
Mobile data traffic evolution (TB per million inhabitants per
month) in some European countries
Source: ECC PT1
Daily traffic consumption in Europe
Source: Sandvine
UMTS Forum Report 44
Mobile traffic forecasts 2010-2020
© UMTS Forum January 2011
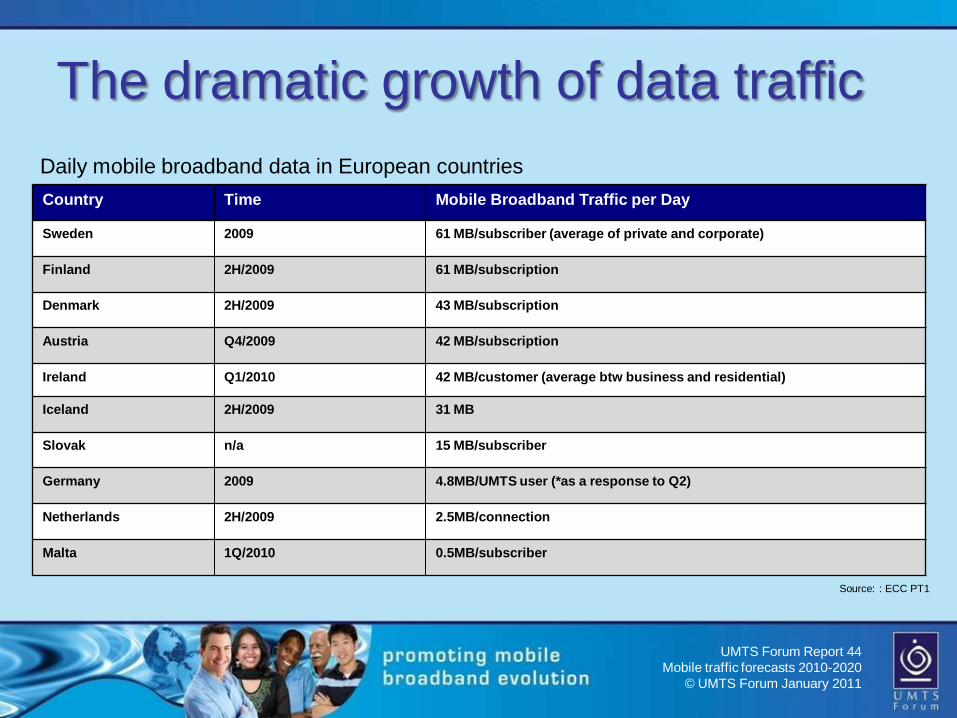
Daily mobile broadband data in European countries
Source: : ECC PT1
Country Time Mobile Broadband Traffic per Day
Sweden 2009 61 MB/subscriber (average of private and corporate)
Finland 2H/2009 61 MB/subscription
Denmark 2H/2009 43 MB/subscription
Austria Q4/2009 42 MB/subscription
Ireland Q1/2010 42 MB/customer (average btw business and residential)
Iceland 2H/2009 31 MB
Slovak n/a 15 MB/subscriber
Germany 2009 4.8MB/UMTS user (*as a response to Q2)
Netherlands 2H/2009 2.5MB/connection
Malta 1Q/2010 0.5MB/subscriber
The dramatic growth of data traffic
UMTS Forum Report 44
Mobile traffic forecasts 2010-2020
© UMTS Forum January 2011
Traffic forecasts
UMTS Forum Report 44
Mobile traffic forecasts 2010-2020
© UMTS Forum January 2011
Traffic forecasts (by equipment vendors)
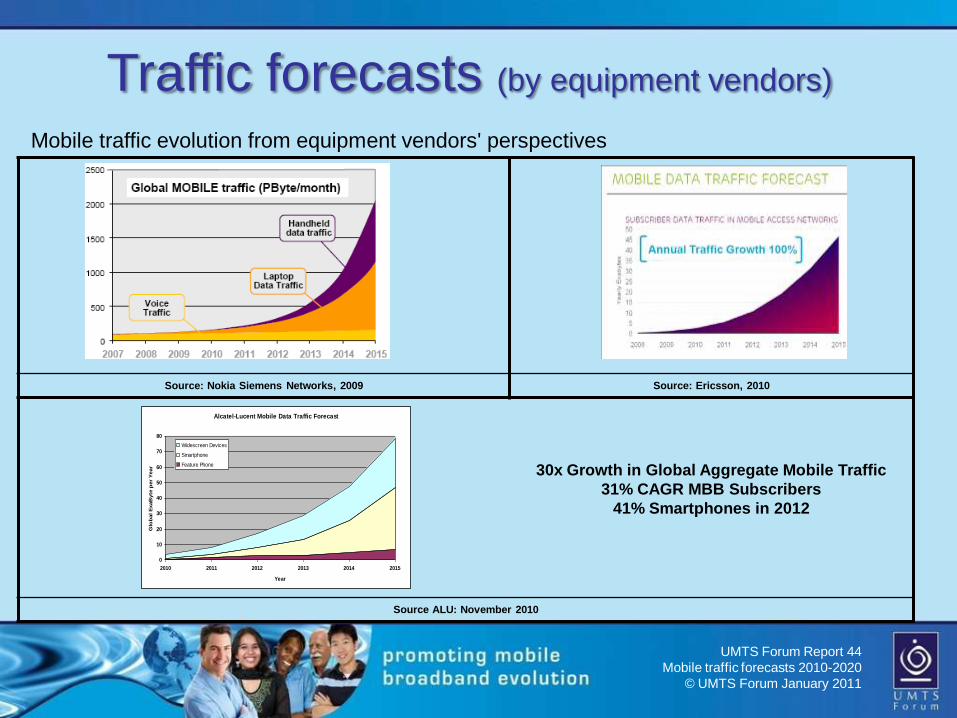
Mobile traffic evolution from equipment vendors' perspectives
Source: Nokia Siemens Networks, 2009 Source: Ericsson, 2010
30x Growth in Global Aggregate Mobile Traffic
31% CAGR MBB Subscribers
41% Smartphones in 2012
Source ALU: November 2010
Alcatel-Lucent Mobile Data Traffic Forecast
0
10
20
30
40
50
60
70
80
2010 2011 2012 2013 2014 2015
Year
Glo
bal E
xaB
yte
per
Year
Widescreen Devices
Smartphone
Feature Phone
UMTS Forum Report 44
Mobile traffic forecasts 2010-2020
© UMTS Forum January 2011
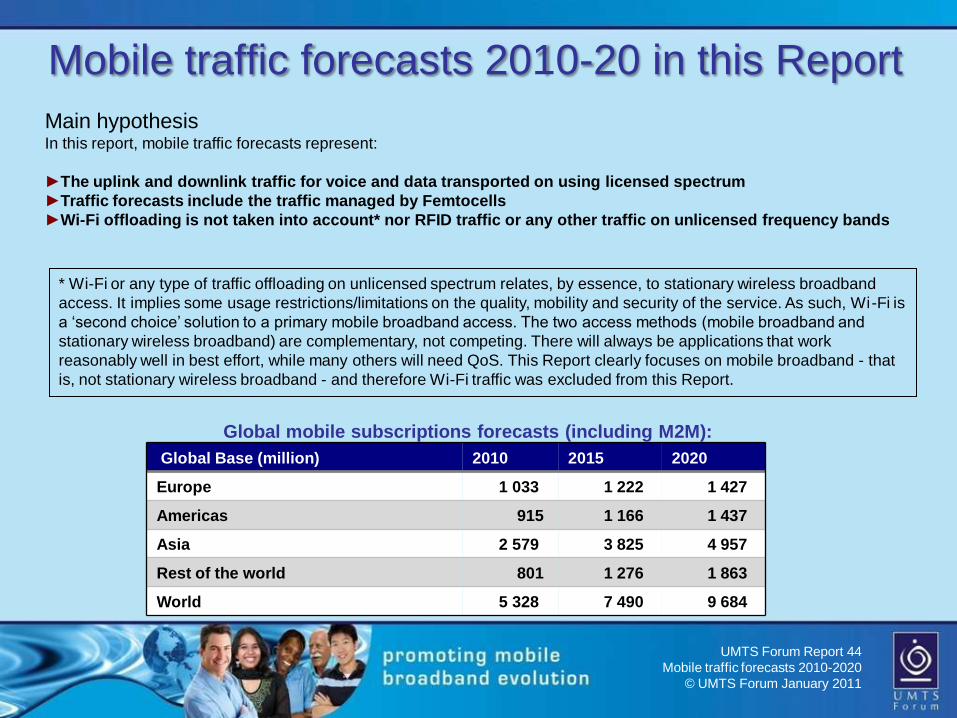
Global mobile subscriptions forecasts (including M2M):
Global Base (million) 2010 2015 2020
Europe 1 033 1 222 1 427
Americas 915 1 166 1 437
Asia 2 579 3 825 4 957
Rest of the world 801 1 276 1 863
World 5 328 7 490 9 684
Main hypothesisIn this report, mobile traffic forecasts represent:
►The uplink and downlink traffic for voice and data transported on using licensed spectrum
►Traffic forecasts include the traffic managed by Femtocells
►Wi-Fi offloading is not taken into account* nor RFID traffic or any other traffic on unlicensed frequency bands
* Wi-Fi or any type of traffic offloading on unlicensed spectrum relates, by essence, to stationary wireless broadband
access. It implies some usage restrictions/limitations on the quality, mobility and security of the service. As such, Wi-Fi is
a „second choice‟ solution to a primary mobile broadband access. The two access methods (mobile broadband and
stationary wireless broadband) are complementary, not competing. There will always be applications that work
reasonably well in best effort, while many others will need QoS. This Report clearly focuses on mobile broadband - that
is, not stationary wireless broadband - and therefore Wi-Fi traffic was excluded from this Report.
Mobile traffic forecasts 2010-20 in this Report
UMTS Forum Report 44
Mobile traffic forecasts 2010-2020
© UMTS Forum January 2011
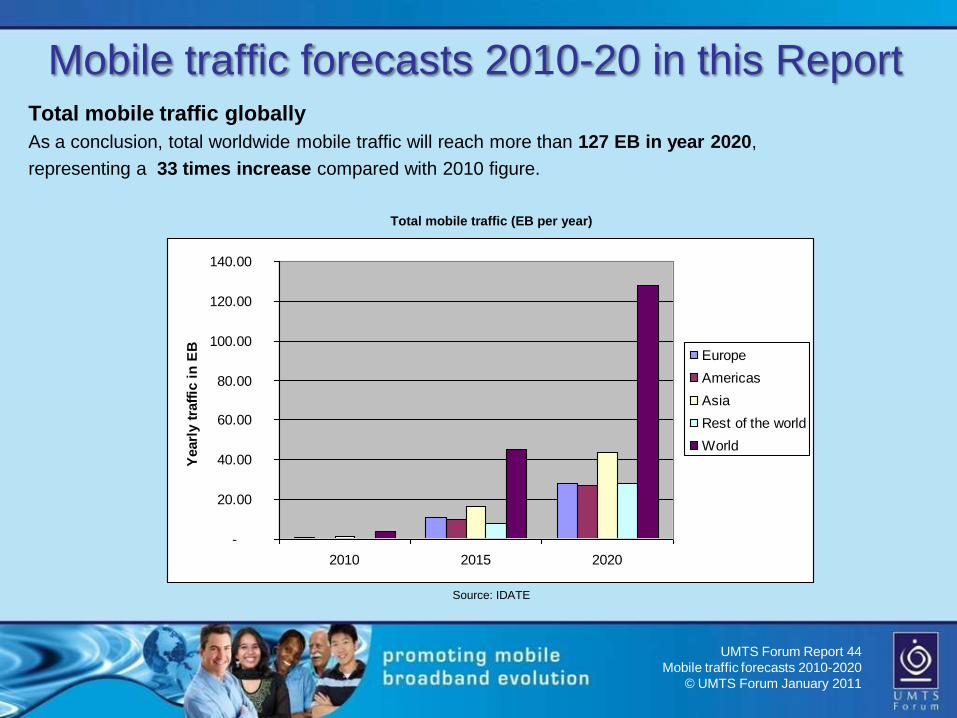
Total mobile traffic globally
As a conclusion, total worldwide mobile traffic will reach more than 127 EB in year 2020,
representing a 33 times increase compared with 2010 figure.
Total mobile traffic (EB per year)
-
20.00
40.00
60.00
80.00
100.00
120.00
140.00
2010 2015 2020
Yearl
y t
raff
ic i
n E
B
Europe
Americas
Asia
Rest of the world
World
Source: IDATE
Mobile traffic forecasts 2010-20 in this Report

UMTS Forum Report 44
Mobile traffic forecasts 2010-2020
© UMTS Forum January 2011
Main hypothesis - Traffic mixA Representative Western European country is considered as a country with
► 50 million population in 2010 and 50.2 million in 2020
► 62.6 million subscriptions in 2010 and 85.4 million subscriptions in 2020, respectively
Representative Western European Country
0
2000
4000
6000
8000
10000
12000
14000
16000
2010 2015 2020
MB
per
mo
nth
Low end phones
Mid-range smartphones
High-end smartphones
Dongles
Connected devices
M2M
Monthly traffic per device (representative Western European country):
Mobile traffic forecasts 2010-20 in this Report

UMTS Forum Report 44
Mobile traffic forecasts 2010-2020
© UMTS Forum January 2011
Total daily mobile traffic per subscription In 2020, daily traffic per Mobile Broadband subscription [1] in the representative Western European country
will stand at 294 MB as an average and at 503 MB for dongles only.
Finally, we anticipate total worldwide mobile traffic of 351 EB in 2025 representing a 174% increase
compared to 2020.
[1] According to the model used in this report, users of Mobile Broadband (MBB) subscriptions with high-end smartphones and
dongles will represent 31% of the subscriptions in 2020 and 63% of the mobile traffic
Daily mobile traffic per subscription 2010 2015 2020
Mobile Broadband (MB per day) 10 155 294
Dongles (MB per day) 26.7 265 503
Mobile traffic forecasts 2010-20 in this Report
UMTS Forum Report 44
Mobile traffic forecasts 2010-2020
© UMTS Forum January 2011
Annexes
UMTS Forum Report 44
Mobile traffic forecasts 2010-2020
© UMTS Forum January 2011
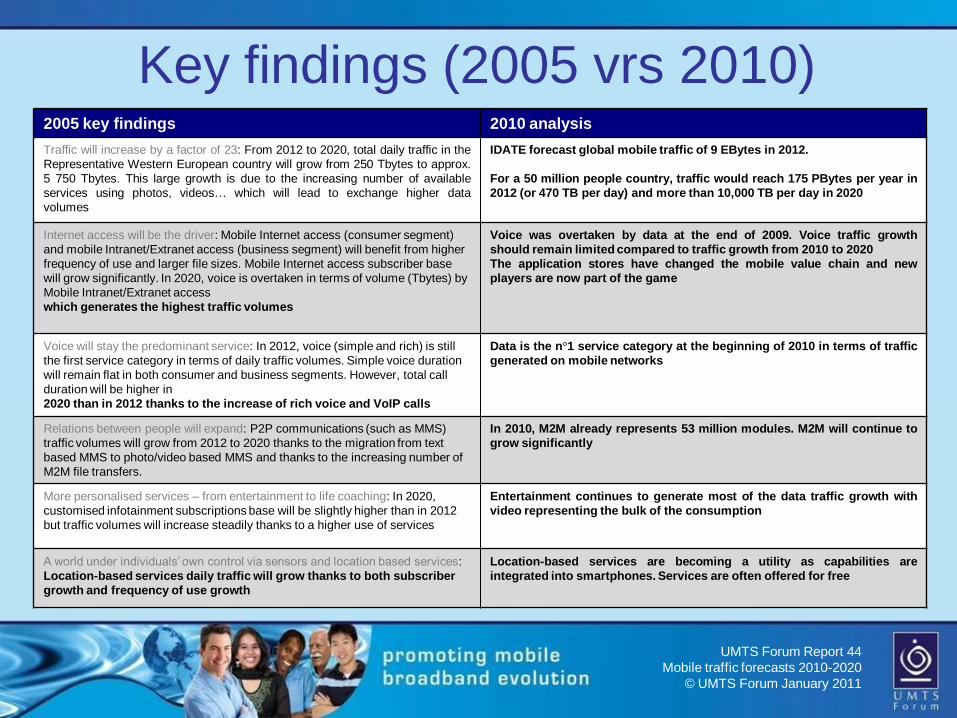
Key findings (2005 vrs 2010)2005 key findings 2010 analysis
Traffic will increase by a factor of 23: From 2012 to 2020, total daily traffic in the
Representative Western European country will grow from 250 Tbytes to approx.
5 750 Tbytes. This large growth is due to the increasing number of available
services using photos, videos… which will lead to exchange higher data
volumes
IDATE forecast global mobile traffic of 9 EBytes in 2012.
For a 50 million people country, traffic would reach 175 PBytes per year in
2012 (or 470 TB per day) and more than 10,000 TB per day in 2020
Internet access will be the driver: Mobile Internet access (consumer segment)
and mobile Intranet/Extranet access (business segment) will benefit from higher
frequency of use and larger file sizes. Mobile Internet access subscriber base
will grow significantly. In 2020, voice is overtaken in terms of volume (Tbytes) by
Mobile Intranet/Extranet access
which generates the highest traffic volumes
Voice was overtaken by data at the end of 2009. Voice traffic growth
should remain limited compared to traffic growth from 2010 to 2020
The application stores have changed the mobile value chain and new
players are now part of the game
Voice will stay the predominant service: In 2012, voice (simple and rich) is still
the first service category in terms of daily traffic volumes. Simple voice duration
will remain flat in both consumer and business segments. However, total call
duration will be higher in
2020 than in 2012 thanks to the increase of rich voice and VoIP calls
Data is the n°1 service category at the beginning of 2010 in terms of traffic
generated on mobile networks
Relations between people will expand: P2P communications (such as MMS)
traffic volumes will grow from 2012 to 2020 thanks to the migration from text
based MMS to photo/video based MMS and thanks to the increasing number of
M2M file transfers.
In 2010, M2M already represents 53 million modules. M2M will continue to
grow significantly
More personalised services – from entertainment to life coaching: In 2020,
customised infotainment subscriptions base will be slightly higher than in 2012
but traffic volumes will increase steadily thanks to a higher use of services
Entertainment continues to generate most of the data traffic growth with
video representing the bulk of the consumption
A world under individuals‟ own control via sensors and location based services:
Location-based services daily traffic will grow thanks to both subscriber
growth and frequency of use growth
Location-based services are becoming a utility as capabilities are
integrated into smartphones. Services are often offered for free
UMTS Forum Report 44
Mobile traffic forecasts 2010-2020
© UMTS Forum January 2011
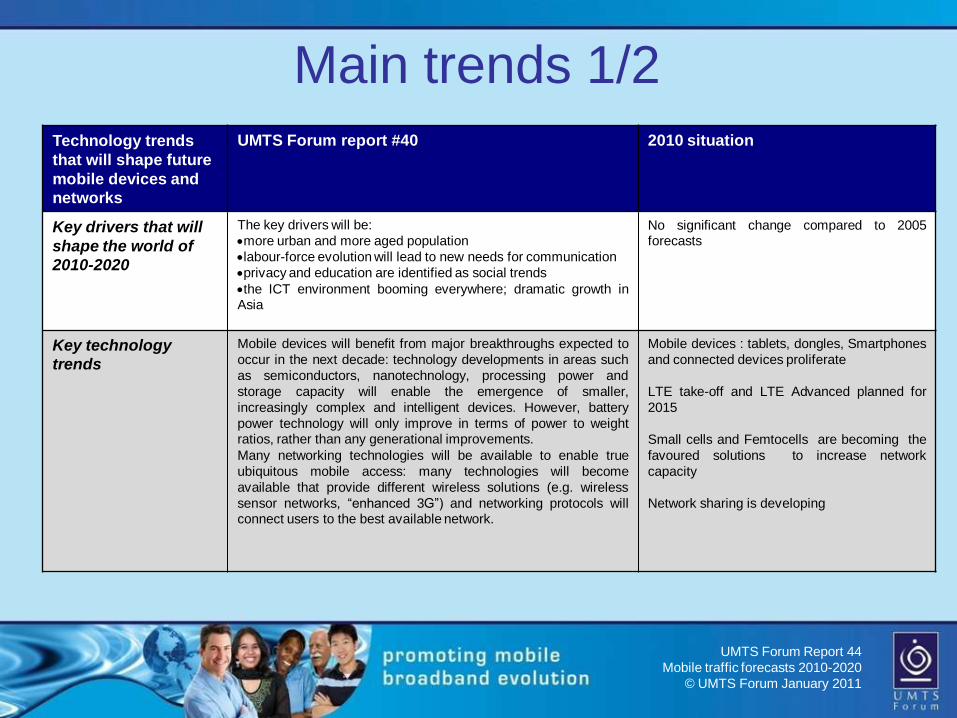
Main trends 1/2
Technology trends
that will shape future
mobile devices and
networks
UMTS Forum report #40 2010 situation
Key drivers that will
shape the world of
2010-2020
The key drivers will be:
more urban and more aged population
labour-force evolution will lead to new needs for communication
privacy and education are identified as social trends
the ICT environment booming everywhere; dramatic growth inAsia
No significant change compared to 2005forecasts
Key technology
trends
Mobile devices will benefit from major breakthroughs expected to
occur in the next decade: technology developments in areas such
as semiconductors, nanotechnology, processing power and
storage capacity will enable the emergence of smaller,
increasingly complex and intelligent devices. However, battery
power technology will only improve in terms of power to weightratios, rather than any generational improvements.
Many networking technologies will be available to enable true
ubiquitous mobile access: many technologies will become
available that provide different wireless solutions (e.g. wireless
sensor networks, “enhanced 3G”) and networking protocols willconnect users to the best available network.
Mobile devices : tablets, dongles, Smartphones
and connected devices proliferate
LTE take-off and LTE Advanced planned for
2015
Small cells and Femtocells are becoming the
favoured solutions to increase network
capacity
Network sharing is developing
UMTS Forum Report 44
Mobile traffic forecasts 2010-2020
© UMTS Forum January 2011
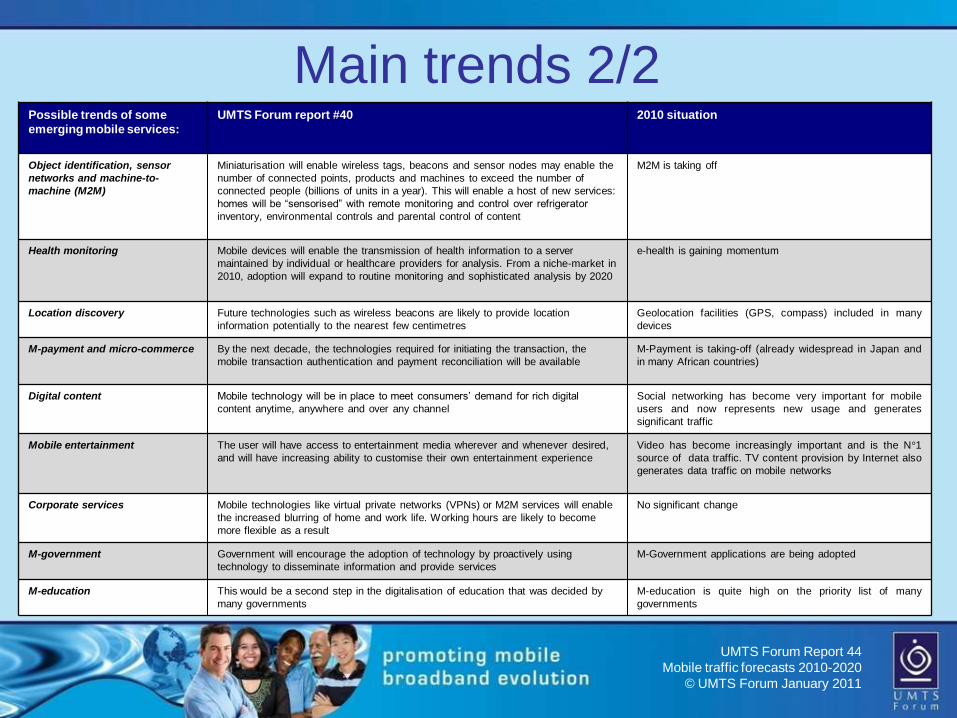
Main trends 2/2Possible trends of some
emerging mobile services:
UMTS Forum report #40 2010 situation
Object identification, sensor
networks and machine-to-
machine (M2M)
Miniaturisation will enable wireless tags, beacons and sensor nodes may enable the
number of connected points, products and machines to exceed the number of
connected people (billions of units in a year). This will enable a host of new services:
homes will be “sensorised” with remote monitoring and control over refrigerator
inventory, environmental controls and parental control of content
M2M is taking off
Health monitoring Mobile devices will enable the transmission of health information to a server
maintained by individual or healthcare providers for analysis. From a niche-market in
2010, adoption will expand to routine monitoring and sophisticated analysis by 2020
e-health is gaining momentum
Location discovery Future technologies such as wireless beacons are likely to provide location
information potentially to the nearest few centimetres
Geolocation facilities (GPS, compass) included in many
devices
M-payment and micro-commerce By the next decade, the technologies required for initiating the transaction, the
mobile transaction authentication and payment reconciliation will be available
M-Payment is taking-off (already widespread in Japan and
in many African countries)
Digital content Mobile technology will be in place to meet consumers‟ demand for rich digital
content anytime, anywhere and over any channel
Social networking has become very important for mobile
users and now represents new usage and generates
significant traffic
Mobile entertainment The user will have access to entertainment media wherever and whenever desired,
and will have increasing ability to customise their own entertainment experience
Video has become increasingly important and is the N°1
source of data traffic. TV content provision by Internet also
generates data traffic on mobile networks
Corporate services Mobile technologies like virtual private networks (VPNs) or M2M services will enable
the increased blurring of home and work life. Working hours are likely to become
more flexible as a result
No significant change
M-government Government will encourage the adoption of technology by proactively using
technology to disseminate information and provide services
M-Government applications are being adopted
M-education This would be a second step in the digitalisation of education that was decided by
many governments
M-education is quite high on the priority list of many
governments
UMTS Forum Report 44
Mobile traffic forecasts 2010-2020
© UMTS Forum January 2011
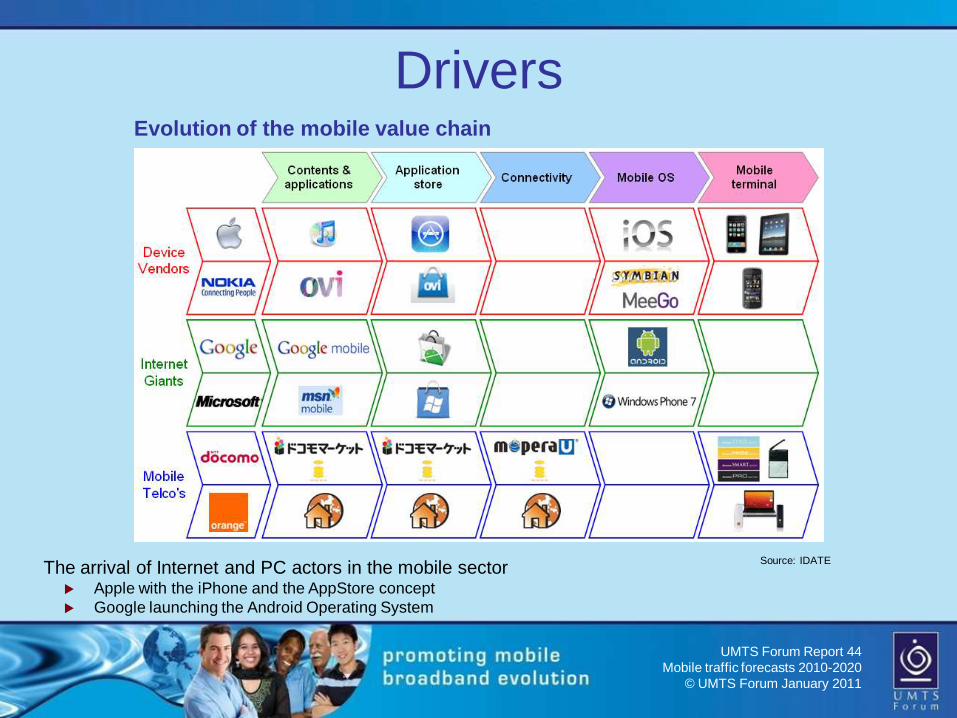
DriversEvolution of the mobile value chain
Source: IDATEThe arrival of Internet and PC actors in the mobile sector Apple with the iPhone and the AppStore concept
Google launching the Android Operating System
UMTS Forum Report 44
Mobile traffic forecasts 2010-2020
© UMTS Forum January 2011
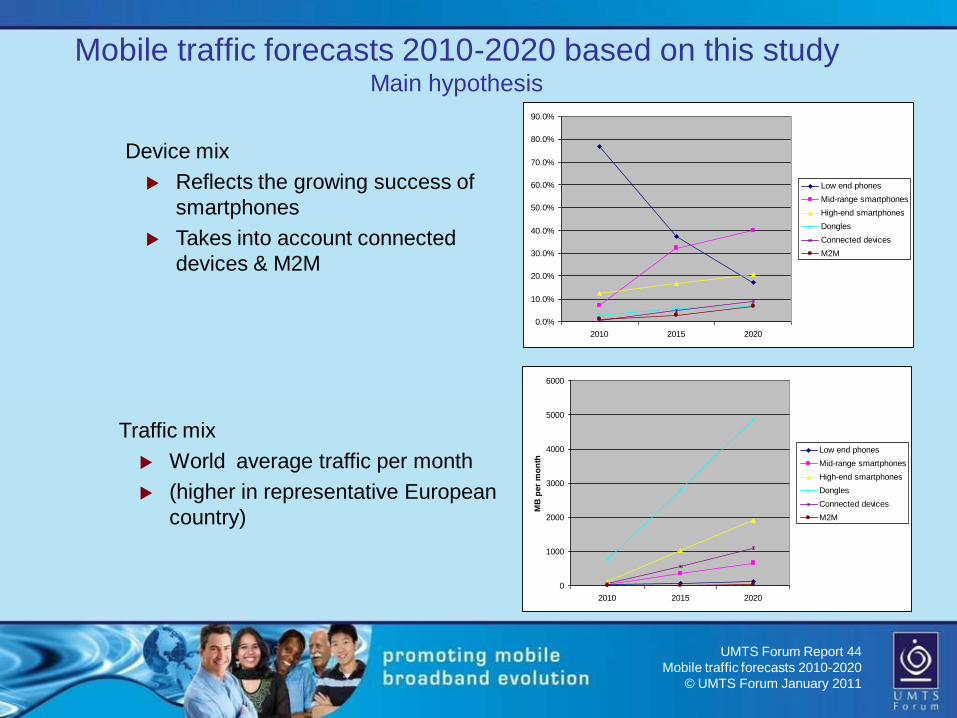
Mobile traffic forecasts 2010-2020 based on this study Main hypothesis
0.0%
10.0%
20.0%
30.0%
40.0%
50.0%
60.0%
70.0%
80.0%
90.0%
2010 2015 2020
Low end phones
Mid-range smartphones
High-end smartphones
Dongles
Connected devices
M2M
Device mix
Reflects the growing success of
smartphones
Takes into account connected
devices & M2M
Traffic mix
World average traffic per month
(higher in representative European
country)
0
1000
2000
3000
4000
5000
6000
2010 2015 2020
MB
per
mo
nth
Low end phones
Mid-range smartphones
High-end smartphones
Dongles
Connected devices
M2M