mobile world investment (mwg vn) buy · mobile world investment corp only accounts for anywhere...
TRANSCRIPT

July 13, 2016
Consu
mer
Dis
c.
Vie
tnam
THIS REPORT HAS BEEN PREPARED BY MAYBANK KIM ENG SECURITIES LIMITED.
SEE PAGE 17 FOR IMPORTANT DISCLOSURES AND ANALYST CERTIFICATIONS
Note: excluding Bach Hoa XANH, which is under testing Source: Company, MKE estimates
THAI Quang Trung, CFA [email protected] (84) 844 55 58 88 x 8180
Mobile World Investment (MWG VN)
Vietnam’s No. 1 Retailer
Clear vision to modernise Vietnam’s retail industry
Our recent meeting with Chairman Nguyen Duc Tai provided us with a lot
more confidence in the company’s vision to modernise the retail
industry. It is currently the market leader by revenues. We no longer
view MWG as a pure electronics/appliances specialist retailer. We think it
has the potential to be a retail giant, given its scalable human capital
and management information system.
We raise our TP by 71% because: (1) the company convincingly exceeded
its full-year store opening target for the thegioididong.com chain after
only four months (2) even more impressively, the DienmayXANH store
count exceeded our expectation, considering difficulties in finding
sizeable land (3) the company has reached a critical point where
economies of scale are working in favour of margins and productivity.
Our new DCF-based (WACC 10.3%, terminal growth 2%) TP of VND165,000
implies a reasonable12x FY16 PER. MWG is currently trading at a forward
PER of 10.0x, a 12% discount to regional peers.
Thegioididong.com still key
Despite concerns over overexpansion in the flagship thegioididong.com
stores, we argue that the room for growth via taking market share from
mom-and-pop stores is still significant enough for this to remain the key
business segment. We also argue in this report that the benefit from
market share growth outweighs moderate cannibalisation risks.
DienmayXANH a growth driver
Lack of sizeable land appears to be less of a problem for the
DienmayXANH chain than we expected. This should grow to account for
35% of total revenue in FY18E, from 28% currently.
Grocery retailing a question mark… still!
We conducted an in-depth field trip to review BachhoaXANH – the pilot
grocery retailing format. Despite the positive big picture described
above, we think it is too early to be overly bullish on this segment. We
are, however, not pessimistic and think this is still a promising area.
Share Price VND 132,000
12m Price Target VND 165,000 (+25%)
Previous Price Target VND 96,000
BUY
Price Performance
50
100
150
200
250
300
350
400
450
500
550
600
30,000
40,000
50,000
60,000
70,000
80,000
90,000
100,000
110,000
120,000
130,000
140,000
Jul-14 Oct-14 Jan-15 Apr-15 Jul-15 Oct-15 Jan-16 Apr-16
Mobile World - (LHS, VND) Mobile World / Vietnam Composite Index - (RHS, %)
-1M -3M -12M
Absolute (%) 40 71 77
Relative to index (%) 36 52 70
Source: FactSet
FYE Dec (VND b) FY14A FY15A FY16E FY17E FY18E
Revenue 15,757 25,253 42,788 57,465 69,497
EBITDA 923 1,519 2,611 3,456 4,351
Core net profit 668 1,072 1,988 2,534 3,036
Core EPS (VND) 4,965 7,650 13,214 15,949 18,602
Core EPS growth (%) 150.5 54.1 72.7 20.7 16.6
Net DPS (VND) 0 1,500 2,500 3,000 3,500
Core P/E (x) 26.6 17.3 10.0 8.3 7.1
P/BV (x) 12.5 7.8 4.8 3.3 2.4
Net dividend yield (%) 0.0 1.1 1.9 2.3 2.7
ROAE (%) 58.7 54.2 59.1 47.7 39.7
ROAA (%) 23.7 20.1 21.7 19.1 17.1
EV/EBITDA (x) 13.2 8.4 8.0 6.4 4.9
Net debt/equity (%) 27.5 68.9 25.5 16.2 net cash
Consensus net profit - - 1,441 2,006 2,550
MKE vs. Consensus (%) - - 38.0 26.3 19.1
0
20
40
60
80
100
VN
D t
rillio
n
Revenue breakdown
thegioididong.com DienmayXANH
Company Description
Statistics 52w high/low (VND) 3m avg turnover (USDm) Free float (%) Issued shares (m) Market capitalisation
Major shareholders: 36.0% 10.9% 8.3%
147
1.2
Mobile World Investment is Vietnam's no.1 retailer by revenue, currently specializing in consumer electronics (incl. mobiles) and household appliances
Founders & related parties Mekong Capital CDH Electric Bee Lim
132,000/59,000
38.1
VND19.4T USD868M

July 12, 2016 2
Mobile World Investment Corp
1. Investment thesis revisited
1.1 Clear vision: to modernise Vietnam’s retail landscape Our initiation report, “Smartphones and MORE”, on MWG dated in June
2015 focused primarily on the secular growth story of Vietnamese
smartphone users. We also hypothesized that MWG’s human capital and
management information system were both highly scalable and that the
company would “likely not be content with just selling
smartphones/tablets”.
At the time of writing, MWG has reportedly surpassed Vietnam’s previous
#1 retailer Co.opMart – a supermarket chain – in monthly revenue, per our
estimates, and is now also Vietnam’s #1 online retailer.
We met Chairman Nguyen Duc Tai last week and had a chance to discuss
what lies ahead for the company. We no longer see MWG as a pure
electronics/appliances retailer. We believe the piloting of grocery
retailing is only the beginning, and think the company has the potential to
become a retail giant.
We asked Mr. Tai if he was to take a one-year leave of absence, what
would be the first metric he would look at upon returning. His answer was
the market-wide modern retail penetration rate. This reveals two things:
The fact that his main concern would be market-related rather than
business-specific implies that he has confidence his company can run
on its own. This reinforces our prior belief, and indicates management
has ample room to focus on strategy development. Its customer-
centric workforce is also difficult to replicate in the Vietnam market,
which serves as an entry barrier.
The company has a clear vision to modernise the entire retail
industry. Mr. Tai further elaborated that the company’s room for
growth will start to narrow once the share of mom-and-pop stores in
shrinks to 20%. Until then, MWG will remain a pure retailer, but will
continue to look for mass-market segments to enter.
The company’s clear vision, backed by its recent convincing footprint
expansion, provided us with a lot more confidence in revising our FY16-18E
sales and earnings CAGR to 40% and 41%, respectively. More details on our
assumptions for each of MWG’s business lines will follow.
That said, we think there are short-term challenges for Bach Hoa XANH –
the company’s newest foray. In our recent store visit, we surveyed one of
the store managers as well as the local competitors in the neighbourhood
(such as Co.opFood, Satrafoods, VinMart+). While revenue per store has
grown encouragingly, we are neither overly bullish nor pessimistic on this
segment at this stage. This will also be addressed later.
1.2 Online retailing the next big thing Our initiation report discussed the high level of tech-savviness amongst
Vietnamese consumers. While this has translated into rising penetration
rates of portable consumer electronics (including smartphones, the focus
of MWG’s flagship thegioididong.com stores), shopping is yet to be a
frequent activity performed online by Vietnamese consumers.
There are several reasons, one of them being the lack of trust from
customers, as Mr. Tai put it. Anecdotally, there have been complaints
about product quality from pure online retailers, even with the well-
known Lazada. Also, a low banking penetration rate limits the number of
customers who can purchase via a credit card when required.
Online retailing in Vietnam still has a lot of room to grow. Data on market
sizing are varied and difficult to ascertain, but online retailing probably

July 12, 2016 3
Mobile World Investment Corp
only accounts for anywhere between less than 1% and about 2% of total
gross retail sales, according to an article on Channel NewsAsia. Even for
MWG, reportedly the #1 Internet retailer, online revenue has only
outgrown overall revenue by a small margin, and still accounts for only 6-
8% of total sales.
Given that Vietnamese consumers are tech-savvy but are still yet to be
totally receptive to online shopping, a change in their mind-set is needed
before online retailing takes off exponentially. Until it becomes the next
big thing, we believe MWG is well-positioned, and its current click-and-
mortar model makes economic sense. Here are the reasons:
The current 100-200sqm thegioididong.com store model remains
economically viable, even though its rapid expansion towards remote
areas has reduced sales per store (more on this to follow).
This is partly because for mid- and low-end smartphones
(ASP<USD500), there still appears to be strong demand from
customers to visit chained stores for reliable quality, credible pricing,
product diversity/availability, and physical testing.
Pure online retailers such as Tiki.vn and Lazada.vn have compelling
price advantages over premium products such as iPhone 6S or Samsung
Galaxy Note 5. For these products, the brand name speaks for itself,
and discounts can be meaningful because of the high price tag.
For mass-market customers with a low budget (e.g. below the
prevailing ASP of USD150), online shopping has proved risky, and
discounts from purchasing via pure online retailers is less compelling.
Overall, we still consider thegioididong.com to be the central business
line, and will address its outlook in detail later.
The physical expansion of both thegioididong.com and DienmayXANH
(i.e. consumer electronics and household appliances) can complement
online retailing and help to shorten delivery time for online
customers. By bringing their brand name closer to customers in
remote areas, promising quick delivery and even free returns, market
leaders such as MWG and FPTShop can change the Vietnamese mind-
set towards online retailing.
Last but not least, MWG – currently Vietnam’s #1 online retailer – has
already been on top of online retailing for years. Its
thegioididong.com website currently has about 30m monthly visits, up
from less than 20m a year earlier. The mobile apps for both
thegioididong.com and DienmayXanh are fairly fast and intuitive,
compared with apps from other retailers. This can create a powerful
platform, once other formats such as grocery retailing can be
launched online.
1.3 Economies of scale increase margins and productivity We think MWG has reached a point where economies of scale are starting
to result in higher margins and higher employee productivity.
July 12, 2016 4
Mobile World Investment Corp
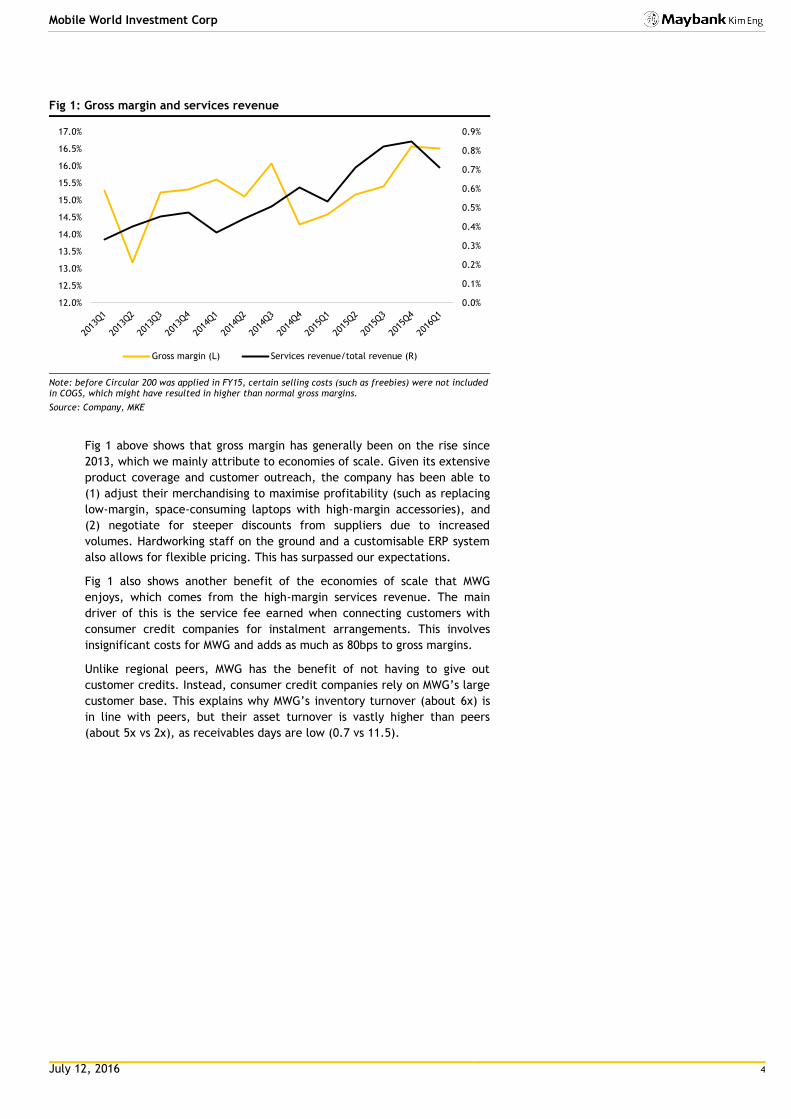
Fig 1: Gross margin and services revenue
Note: before Circular 200 was applied in FY15, certain selling costs (such as freebies) were not included in COGS, which might have resulted in higher than normal gross margins.
Source: Company, MKE
Fig 1 above shows that gross margin has generally been on the rise since
2013, which we mainly attribute to economies of scale. Given its extensive
product coverage and customer outreach, the company has been able to
(1) adjust their merchandising to maximise profitability (such as replacing
low-margin, space-consuming laptops with high-margin accessories), and
(2) negotiate for steeper discounts from suppliers due to increased
volumes. Hardworking staff on the ground and a customisable ERP system
also allows for flexible pricing. This has surpassed our expectations.
Fig 1 also shows another benefit of the economies of scale that MWG
enjoys, which comes from the high-margin services revenue. The main
driver of this is the service fee earned when connecting customers with
consumer credit companies for instalment arrangements. This involves
insignificant costs for MWG and adds as much as 80bps to gross margins.
Unlike regional peers, MWG has the benefit of not having to give out
customer credits. Instead, consumer credit companies rely on MWG’s large
customer base. This explains why MWG’s inventory turnover (about 6x) is
in line with peers, but their asset turnover is vastly higher than peers
(about 5x vs 2x), as receivables days are low (0.7 vs 11.5).
0.0%
0.1%
0.2%
0.3%
0.4%
0.5%
0.6%
0.7%
0.8%
0.9%
12.0%
12.5%
13.0%
13.5%
14.0%
14.5%
15.0%
15.5%
16.0%
16.5%
17.0%
Gross margin (L) Services revenue/total revenue (R)

July 12, 2016 5
Mobile World Investment Corp
Fig 2: Employees and sales per employee
Source: Company, MKE
Despite the rapid footprint expansion, MWG’s human capital and
management system appear to be scalable. Sales per employee have
steadily increased over the years, as can be seen from Fig 2.
Fig 3: ESOP and SG&A
Source: Company, MKE
Nevertheless, we note that the cost of having an increasingly productive
workforce is higher compensation. Our understanding from the Chairman is
that employees are of the second highest priority for the company, behind
customers.
In FY14-FY16E, the ESOP payout has been generous at the maximum 5%
allowed by law. In view of the debates amongst major shareholders, the
company has capped FY16 ESOP (payable in FY17E) at a maximum of 3%,
but we understand management expects SG&A to increase to compensate
employees for the foregone ESOP via cash. We have modelled SG&A in the
future accordingly, as seen in Fig 3.
-
50.0
100.0
150.0
200.0
250.0
0
2,000
4,000
6,000
8,000
10,000
12,000
14,000
16,000
18,000
FY12 FY13 FY14 1Q15 2Q15 3Q15 4Q15 1Q16V
ND
m p
ers
ons
Total employees at period end (L)
Sales per employee per month (R)
8.0%
9.0%
10.0%
11.0%
12.0%
13.0%
14.0%
0.0%
1.0%
2.0%
3.0%
4.0%
5.0%
6.0%
FY09 FY10 FY11 FY12 FY13 FY14 FY15 FY16E FY17E FY18E FY19E FYFYE
ESOP payout, % of outstanding shares (L) SG&A/sales (R)

July 12, 2016 6
Mobile World Investment Corp
2. Business model review and outlook
2.1 thegioididong.com: to gain share from mom-and-pops Fig 4 displays our macro and industry estimates. Note that per our
estimates, nationwide smartphone penetration (including rural and
mountainous areas) stood at 40% in 2015, slightly higher than 3G
penetration. This is lower than some other estimates available on the
public domain, and indicates that the market is neither too far away from,
nor nearing, saturation.
Fig 4: Macro and industry estimates
2014 2015 2016e 2017e 2018e 2019e 2020e 3yr CAGR 5yr CAGR
Total population (m) 90.7 91.7 92.7 93.6 94.5 95.5 96.4 1.0% 1.0%
Total urban population (m) 30.0 31.5 32.6 33.7 34.9 36.1 37.4 3.5% 3.5%
# of 3G/4G mobile subscriptions (m) 25.1 33.0 38.0 43.1 48.3 53.6 59.0 13.5% 12.3%
Penetration (%) 28% 36% 41.1% 46.1% 51.1% 56.2% 61.2%
Replacement cycle (years) 1.6 1.5 1.5 1.5 1.5 1.5 1.5
# of people using smartphones (m) 24.5 36.7 41.7 46.8 52.0 57.3 62.7 12.3% 11.3%
Penetration (%) 27% 40% 45% 50% 55% 60% 65%
# of mobile phones sold (m) 14 16 20 23 27 30 34 18.4% 16.1%
ASP (USD) 140 150 150 150 150 150 150 0.0% 0.0%
Market size (USDb) 1.9 2.4 3.0 3.4 4.0 4.5 5.1 18.4% 16.1%
Source: Company, General Statistics Office, Vietnam Telecommunications Authority, GfK, IDC, Euromonitor International (reproduced on public sources where applicable), MKE estimates
The following numbers might have led to confusion regarding smartphone
penetration:
In early 2015, over half of mobile phones sold in Vietnam were
smartphones, as noted by MWG. This does not indicate penetration
has already surpassed 50%, but only indicates that smartphones are
replacing feature phones in annual sales volumes.
Certain industry players and sources estimate the smartphone
penetration rate to be as high as 50-60%. We believe these samples
have been skewed towards the urban population, Internet users or
adults.
Growth trajectory: We expect smartphone penetration to hit 65% at
saturation, unchanged from our initial assumption in the initiation report.
This means the smartphone user population should continue to grow at a
5-year CAGR of about 11%. Given an assumed average replacement cycle
of 1.5 years, industry-wide sales should grow at a 5-year CAGR of about
16% (or 11% from new users joining the population, and roughly 5% from
incumbent users changing their phones).
Two important changes in our assumptions compared with our initiation
report last year are:
(1) We expect ASP to be flat going forward, which is less negative than
our previous assumption of a negative 5% CAGR due to economies of
scale. The reason for this is that the observed ASP for Vietnam (about
USD150) has seemingly overshot to the downside compared with
regional averages for emerging markets, per IDC data, probably due to
the proliferation of low-cost models from China and those locally
produced by Samsung. This should limit room for future ASP declines.
(2) Given the lower than expected ASP, the assumed replacement cycle is
lowered to 1.5 years, from 3.0 years.

July 12, 2016 7
Mobile World Investment Corp
MWG’s growth outlook: MWG’s strategy for thegioididong.com is to
expand towards remote areas and take market share from mom-and-pop
stores. This should lead to a growing market share, but lower average
sales per store. Same-store sales growth (SSSG) will also likely decline, as
cannibalisation has been seen to a moderate degree. Our review of the
economics below explains why the benefit of a higher market share
outweighs moderate cannibalisation risks.
We expect MWG to grow their thegioididong.com footprint at 1.5x the
growth of the overall market. Historically, this ratio has typically been 2-
3x. We also assume new stores to average VND1.5b in monthly sales, as
guided by management, down from about VND4b historically. Our new
SSSG assumption now stands at 5% annually, taking into account
cannibalisation.
This should lead MWG’s market share in smartphones to hover around 45-
50% in FY20 from 35% currently. By that time, mom-and-pop market share
should decline to about 20%, the saturation point for modern retail in this
market, as guided by Mr. Tai.
Economics: While store expansion has been extremely rapid in this
business segment, the cannibalisation risk is only moderate. Stores that
are open near to each other may still individually have positive economic
value-added, as long as (1) the immediate catchment area is sizeable
enough, with heavy traffic, and (2) it is physically inconvenient for
customers to go to the next nearest store outside of the cannibalised
zone, as is the case in many areas with undeveloped transport
infrastructure.
We believe undeveloped transport infrastructure has also resulted in
single-digit SSSG for MWG for a while, which seems counter-intuitive given
the secular growth story of smartphones. This is because many of the
existing mature stores have already secured the most prime locations, yet
can only manage to serve a limited catchment area, due to traffic
congestions to and from these stores. This is why we think the benefit
from increasing market share outweighs the cannibalisation risk.
Small-scale specialist electronics stores are also quite common in
neighbouring ASEAN countries with heavy traffic and/or high population
density, such as Indonesia (ERAA IJ, TRIO IJ), Thailand (SIM TB) or
Singapore (CHLG SP and EPIC SP).
Besides, the investment outlay for each store is quite minimal: (1) a new
store with VND1.5b in monthly sales should only require less than VND1b of
capex, instead of VND1.5b for a VND4b-per-month store, (2) operating
leases are signed for several years, but only a 3-month deposit is typically
required, (3) the ERP system has proved efficient in managing staff and
inventory at each store level.
It typically takes a year for a store to break even. Any store with more
than three months of negative EBITDA would be red-flagged.
The company did have to close shops in the past, mostly in FY13.
However, the losses from the closure of these have been minimal.
All in all, our forecast for the thegioididong.com business line is outlined
in Fig 5.

July 12, 2016 8
Mobile World Investment Corp
Fig 5: Sales and store opening forecasts - thegioididong.com
thegioididong.com business line FY16e FY17e FY18e FY19e FY20e 3yr CAGR 5yr CAGR
Revenue (VNDb) 30,357 38,139 44,465 51,575 59,406 28.9% 23.4%
SSSG - value (%) 5% 5% 5% 5% 5% 5.0% 5.0%
SSSG - volume (%) 5% 5% 5% 5% 5% 5.0% 5.0%
ASP growth (%) 0% 0% 0% 0% 0% 0.0% 0.0%
Store growth (%) 60% 24% 23% 20% 18% 34.9% 28.2%
Revenue growth (%) 46% 26% 17% 16% 15% 28.9% 23.4%
Existing stores (#) 564 904 1,124 1,384 1,654
New stores, net (#) 340 220 260 270 300
Year-end stores (#) 904 1,124 1,384 1,654 1,954 34.9% 28.2%
Source: MKE estimates
2.2 DienmayXANH: to modernise Vietnamese households Compared with thegioididong.com which focuses on smartphones,
DienmayXANH primarily sells non-portable “brown goods” (i.e. bulky
consumer electronics such as TVs, speakers) and “white goods” (i.e.
household appliances such as fridges, air-conditioners, washing machines,
etc). Compared with smartphones, these have longer replacement cycles
(>5 years) but lower penetration (20-40%) at present.
The economics of DienmayXANH lies in the bulky nature of the products. A
DienmayXANH store (500-1,000sqm) usually has lower competition from
chained stores in the neighbourhood than a thegioididong.com store, due
to land scarcity. Bulky items are also less subject to hand-carried
purchases from overseas, as is the case of portable consumer electronics.
We believe it is more difficult for new entrants to enter DienmayXANH’s
market segment, compared with that of thegioididong.com’s. We initially
had reservations over how quickly MWG can expand this segment, in view
of physical difficulties in finding sizeable locations.
The company has exceeded our expectation in FY16 so far. DienmayXANH
has risen to be on par with previous market leader Nguyen Kim (now partly
owned by Thailand’s Central Group), with about 10% in market share, and
has apparently taken market share from local provincial chains. We took a
look at the locations of the new DienmayXANH stores and are convinced
the company is top-notch at securing sizeable and prime locations.
When it comes to margins, economies of scale are, again, working in
favour of the company. On the one hand, DienmayXANH’s rising market
share should increase the company’s bargaining power. On the other hand,
the supply of non-portable consumer electronics and appliances should
continue to increase at a healthy rate, in view of the presence of Samsung
and LG in Vietnam, as well as regional trade agreements. This should give
MWG plenty of room for effective merchandising.
Online retailing, again, can serve to help supplement the growth of this
segment. To recall, our initiation report mentioned that we attempted to
place an order from DienmayXANH for home delivery via their mobile app.
Our experience with the purchase was very pleasant.
All in all, our forecasts for this segment are outlined in

July 12, 2016 9
Mobile World Investment Corp
Fig 6: Sales and store opening forecasts - DienmayXANH
DienmayXANH business line FY16e FY17e FY18e FY19e FY20e 3yr CAGR 5yr CAGR
Revenue (VNDb) 12,305 19,103 24,614 28,611 32,240 76.4% 48.4%
SSSG - value (%) 10% 10% 10% 10% 10% 10.0% 10.0%
SSSG - volume (%) 10% 10% 10% 10% 10% 10.0% 10.0%
ASP growth (%) 0% 0% 0% 0% 0% 0.0% 0.0%
Store growth (%) 87% 39% 11% 5% 2% 42.3% 25.4%
Revenue growth (%) 175% 55% 29% 16% 13% 76.4% 48.4%
Existing stores 69 129 179 199 209
New stores (net) 60 50 20 10 5
Year-end stores 129 179 199 209 214 107.6% 25.4%
Source: MKE estimates
2.3 BachhoaXANH: high potential but lots of work to do We conducted our site visit around Binh Tan/Tan Phu District where the
pilot BachhoaXANH stores are currently operating. Fig 7 below suggests
that grocery retailing via specialist chained stores is hardly an untapped
market in these densely populated districts.
Fig 7: Grocery specialist chained stores around Binh Tan/Tan Phu
Source: Company, MKE, Google Maps, Jul 2016
For Vinmart+, besides the two stores operational at the time of the survey
on the above map, there are apparently dozens of other stores slated for
opening, as can be seen from the Vinmart website.

July 12, 2016 10
Mobile World Investment Corp
Fig 8: VinMart+ existing & planned stores, Binh Tan/Tan Phu, HCMC
Source: vinmart.com
We compared a BachhoaXANH store in the area and a Satrafoods store 50m
away. The two have roughly comparable traffic, product availability and
pricing, except that the latter offers a limited amount of fresh meat.
The latter also has a slightly more high-end feel when it comes to lighting
and layout. Note, however, that the target market for both stores is the
mass-market consumers looking to move away from wet markets.
Fig 9: BachhoaXANH (left) vs Satrafoods (right)
Source: MKE

July 12, 2016 11
Mobile World Investment Corp
Challenges faced by Bach Hoa XANH at this early stage:
Difficulties in recruiting and retaining staff, given the long working
hours (6:00AM to 9:30PM) and the heavy workload. Turnover can be
high at the beginning.
Difficulties in competing with wet market prices. Usually a 50%
discount on fresh vegetables (which we understand are sourced from
Da Lat Province) has to be run for about a month upon the opening of
a new store to encourage traffic.
Merchandising is yet to be well-established. The offering of fresh
meat and fish is still yet to be seen.
That said, we think it is commendable that revenue per store has steadily
increased from less than USD10,000/month in Feb’16 to close to
USD50,000/month in June’16. We cross-checked with comparable
minimart chains and estimated that regional peers make over
USD80,000/store/month on average, while local market leader Co.opFood
makes between USD60,000-70,000/store/month.
Mr. Tai explains that revenue per store is an important metric, and has
been encouraging given the short timeframe, but is not the deciding factor
in rolling out this new concept. Revenue only forms the front-end of the
company’s retail model, and a decision to roll out a model can only be
made once the back-end is fully planned out.
Another factor for consideration, according to Mr. Tai, is the treatment of
leftover perishable inventory, which is not present in
electronics/appliances retailing. Even if revenues hit targets, the grocery
retailing format may not be rolled out if there is no systematic way to
treat this issue.
All in all, we are neither bullish nor pessimistic on this segment at this
stage. We like the idea, the market size (about USD60b per our
understanding from management and industry sources), and the existing
retail platform that the company has. We also view the increase in
revenue per store in 1H16 to be encouraging.
However, we do not think there is good reason to be bullish as yet, given
the short-term challenges. Overall, we think there is a 70% chance the
grocery model will be rolled out in FY17.
July 12, 2016 12
Mobile World Investment Corp
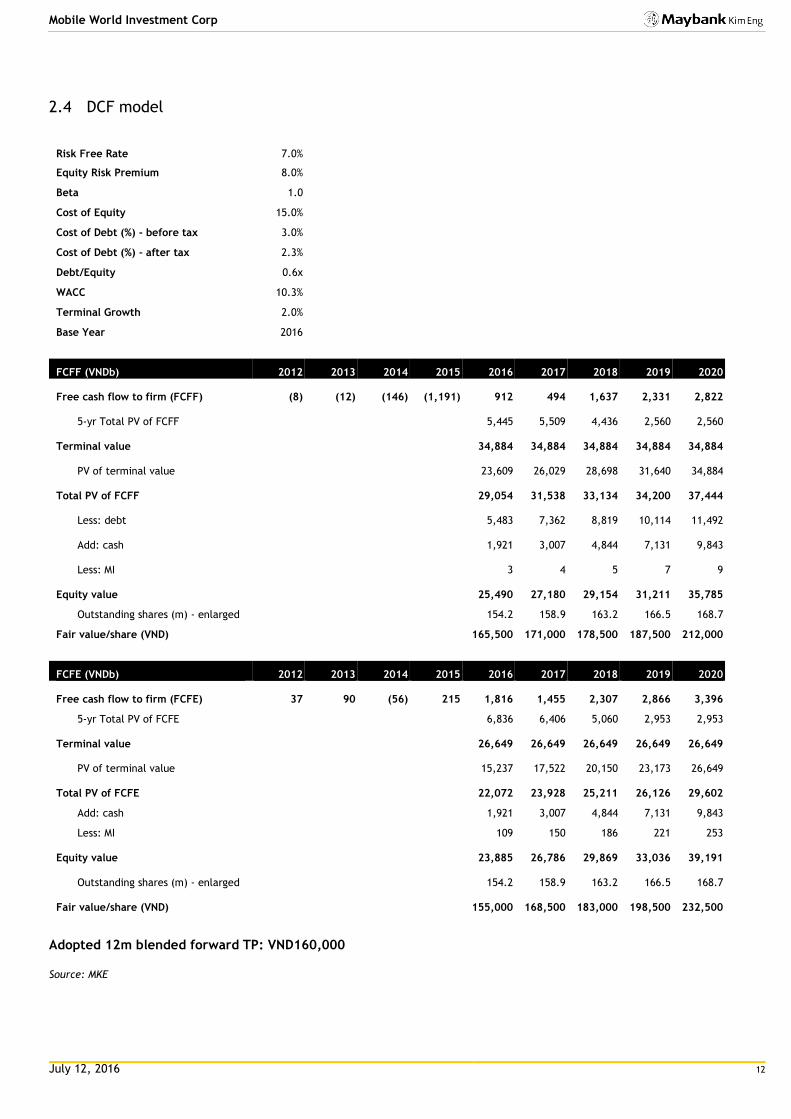
2.4 DCF model
Risk Free Rate 7.0%
Equity Risk Premium 8.0%
Beta 1.0
Cost of Equity 15.0%
Cost of Debt (%) - before tax 3.0%
Cost of Debt (%) - after tax 2.3%
Debt/Equity 0.6x
WACC 10.3%
Terminal Growth 2.0%
Base Year 2016
FCFF (VNDb) 2012 2013 2014 2015 2016 2017 2018 2019 2020
Free cash flow to firm (FCFF) (8) (12) (146) (1,191) 912
494
1,637 2,331 2,822
5-yr Total PV of FCFF 5,445
5,509
4,436 2,560 2,560
Terminal value 34,884
34,884
34,884 34,884 34,884
PV of terminal value 23,609
26,029
28,698 31,640 34,884
Total PV of FCFF 29,054
31,538
33,134 34,200 37,444
Less: debt 5,483
7,362
8,819 10,114 11,492
Add: cash 1,921
3,007
4,844 7,131 9,843
Less: MI 3
4
5 7 9
Equity value 25,490
27,180
29,154 31,211 35,785
Outstanding shares (m) - enlarged 154.2 158.9 163.2 166.5 168.7
Fair value/share (VND) 165,500 171,000 178,500 187,500 212,000
FCFE (VNDb) 2012 2013 2014 2015 2016 2017 2018 2019 2020
Free cash flow to firm (FCFE) 37 90 (56)
215
1,816
1,455
2,307 2,866 3,396
5-yr Total PV of FCFE 6,836 6,406 5,060 2,953 2,953
Terminal value
26,649
26,649
26,649 26,649 26,649
PV of terminal value
15,237
17,522
20,150 23,173 26,649
Total PV of FCFE
22,072
23,928
25,211 26,126 29,602
Add: cash 1,921 3,007 4,844 7,131 9,843
Less: MI 109 150 186 221 253
Equity value
23,885
26,786
29,869 33,036 39,191
Outstanding shares (m) - enlarged
154.2
158.9
163.2 166.5 168.7
Fair value/share (VND)
155,000
168,500
183,000 198,500 232,500
Adopted 12m blended forward TP: VND160,000 Source: MKE

July 12, 2016 13
Mobile World Investment Corp
2.5 Peers
thegioididong.com peers
Company Ticker Country PER Fwd PER
Fwd P/B
P/S EV/EBITDA
Erajaya Swasembada Tbk PT ERAA IJ Equity Indonesia 7.9 6.2 0.5 0.1 6.1 Trikomsel Oke Tbk PT TRIO IJ Equity Indonesia Challenger Technologies Ltd CHLG SP Equity Singapore 8.4 0.4 4.5 Epicentre Holdings Ltd EPIC SP Equity Singapore 0.1 Samart I-Mobile PCL SIM TB Equity Thailand 145.2 1.8 0.8 35.6
Median 8.2 75.7 1.2 0.3 6.1
DienmayXANH peers
Company Ticker Country PER Fwd PER
Fwd P/B
P/S EV/EBITDA
Sanlian Commercial Co Ltd 600898 CH Equity China 152.6 3.8 Suning Commerce Group Co Ltd 002024 CH Equity China 89.6 188.1 2.1 0.6 GOME Electrical Appliances Hol 493 HK Equity China 11.4 0.8 Electronic City Indonesia Tbk ECII IJ Equity Indonesia 86.6 0.4 4.5 Global Teleshop Tbk PT GLOB IJ Equity Indonesia 0.2 Bic Camera Inc 3048 JP Equity Japan 18.7 11.8 1.4 0.2 9.5 K's Holdings Corp 8282 JP Equity Japan 12.3 11.3 1.0 0.3 9.4 Yamada Denki Co Ltd 9831 JP Equity Japan 14.6 11.3 0.8 0.3 10.9 EDION Corp 2730 JP Equity Japan 14.7 9.6 0.1 7.1 Best Denki Co Ltd 8175 JP Equity Japan 10.6 0.1 9.1 LOTTE Himart Co Ltd 071840 KS Equity S. Korea 10.7 8.9 0.6 0.3 8.2 Sunfar Computer Co Ltd 6154 TT Equity Taiwan 13.3 0.2 4.7 Tsann Kuen Enterprise Co Ltd 2430 TT Equity Taiwan 14.4 0.2 4.2 Dixons Carphone PLC DC/ LN Equity UK 19.5 9.6 1.1 0.4 7.9 Best Buy Co Inc BBY US Equity US 10.9 10.5 2.2 0.3 3.6 Tran Anh Digital World JSC TAG VN Equity Vietnam 94.1 0.5 41.1
Median 14.7 11.3 1.1 0.3 8.1
BachhoaXANH peers
Company Ticker Country PER Fwd PER
P/S EV/EBITDA
Sumber Alfaria Trijaya Tbk PT AMRT IJ Equity Indonesia 35.3 38.6 0.5 9.5 UNY Group Holdings Co Ltd 8270 JP Equity Japan 0.2 7.6 FamilyMart Co Ltd 8028 JP Equity Japan 28.5 25.5 4.4 7.5 Lawson Inc 2651 JP Equity Japan 25.8 21.1 3.6 7.5 BGF retail Co Ltd 027410 KS Equity South Korea 33.2 28.8 1.2 14.9 Taiwan FamilyMart Co Ltd/Taiwa 5903 TT Equity Taiwan 36.3 32.6 0.8 13.4 Poplar Co Ltd 7601 JP Equity Japan 80.4 0.1 6.1
Median 34.3 28.8 0.8 7.6
MWG 13.9 10.0 0.8 8.4
Source: Bloomberg, MKE estimates

July 12, 2016 14
Mobile World Investment Corp
FYE 31 Dec FY14A FY15A FY16E FY17E FY18E
Key Metrics
P/E (reported) (x) 26.6 17.3 10.0 8.3 7.1
Core P/E (x) 26.6 17.3 10.0 8.3 7.1
P/BV (x) 12.5 7.8 4.8 3.3 2.4
P/NTA (x) 12.9 7.9 4.8 3.3 2.4
Net dividend yield (%) 0.0 1.1 1.9 2.3 2.7
FCF yield (%) nm nm 4.6 2.4 7.6
EV/EBITDA (x) 13.2 8.4 8.0 6.4 4.9
EV/EBIT (x) 15.1 9.6 8.9 7.3 5.9
INCOME STATEMENT (VND b)
Revenue 15,756.7 25,252.7 42,788.1 57,464.7 69,496.6
Gross profit 2,396.1 3,922.4 6,854.7 9,158.5 11,028.8
EBITDA 922.7 1,519.1 2,610.9 3,455.9 4,351.0
Depreciation (115.5) (196.2) (248.1) (430.2) (707.6)
Amortisation (0.9) (0.9) (0.9) (0.9) (0.9)
EBIT 806.3 1,322.0 2,361.9 3,024.9 3,642.6
Net interest income /(exp) (4.4) (38.0) (25.6) (16.3) (15.5)
Exceptionals 0.0 0.0 0.0 0.0 0.0
Other pretax income 66.3 101.7 150.0 160.0 170.0
Pretax profit 868.2 1,385.8 2,486.3 3,168.6 3,797.1
Income tax (194.5) (310.0) (497.3) (633.7) (759.4)
Minorities (5.6) (3.9) (1.0) (1.3) (1.5)
Reported net profit 668.1 1,071.9 1,988.0 2,533.6 3,036.2
Core net profit 668.1 1,071.9 1,988.0 2,533.6 3,036.2
BALANCE SHEET (VND b)
Cash & Short Term Investments 212.9 343.9 1,921.4 3,007.4 4,844.2
Accounts receivable 44.5 76.9 108.6 149.7 185.7
Inventory 2,195.3 4,932.7 5,965.1 7,993.0 9,642.8
Property, Plant & Equip (net) 388.3 826.9 1,433.8 2,358.7 2,901.1
Intangible assets 45.6 34.7 33.9 33.0 32.2
Other assets 520.6 1,050.6 1,602.5 1,978.4 2,347.3
Total assets 3,407.2 7,265.8 11,065.3 15,520.2 19,953.3
ST interest bearing debt 618.7 2,052.9 3,006.0 4,038.8 4,805.5
Accounts payable 981.8 1,971.3 2,476.9 3,322.7 4,013.2
LT interest bearing debt 0.0 0.0 0.0 0.0 0.0
Other liabilities 323.0 758.0 1,333.0 1,771.0 2,199.0
Total Liabilities 1,923.2 4,782.2 6,816.0 9,133.0 11,018.1
Shareholders Equity 1,475.0 2,481.9 4,246.7 6,383.2 8,929.7
Minority Interest 9.1 1.6 2.6 3.9 5.4
Total shareholder equity 1,484.0 2,483.6 4,249.4 6,387.1 8,935.1
Total liabilities and equity 3,407.2 7,265.8 11,065.3 15,520.2 19,953.3
CASH FLOW (VND b)
Pretax profit 868.2 1,385.8 2,486.3 3,168.6 3,797.1
Depreciation & amortisation 116.4 197.1 248.9 431.0 708.5
Adj net interest (income)/exp 21.3 38.9 87.2 106.5 136.6
Change in working capital (672.8) (2,060.9) (558.5) (1,223.1) (995.4)
Cash taxes paid (221.6) (196.0) (497.3) (633.7) (759.4)
Other operating cash flow 45.4 31.2 0.0 0.0 0.0
Cash flow from operations 120.8 (604.0) 1,766.7 1,849.2 2,887.4
Capex (266.4) (586.5) (855.0) (1,355.0) (1,250.0)
Free cash flow (145.6) (1,190.5) 911.7 494.2 1,637.4
Dividends paid (2.6) (1.8) (225.7) (397.2) (489.7)
Equity raised / (purchased) 11.6 (2.2) 0.0 46.3 43.6
Change in Debt 105.5 1,434.3 953.1 1,032.8 766.7
Other invest/financing cash flow (60.7) (108.8) (61.6) (90.2) (121.2)
Effect of exch rate changes 0.0 0.0 0.0 0.0 0.0
Net cash flow (91.8) 131.0 1,577.5 1,086.0 1,836.9

July 12, 2016 15
Mobile World Investment Corp
FYE 31 Dec FY14A FY15A FY16E FY17E FY18E
Key Ratios
Growth ratios (%)
Revenue growth 65.9 60.3 69.4 34.3 20.9
EBITDA growth 142.7 64.6 71.9 32.4 25.9
EBIT growth 133.1 64.0 78.7 28.1 20.4
Pretax growth 147.5 59.6 79.4 27.4 19.8
Reported net profit growth 161.4 60.4 85.5 27.4 19.8
Core net profit growth 161.4 60.4 85.5 27.4 19.8
Profitability ratios (%)
EBITDA margin 5.9 6.0 6.1 6.0 6.3
EBIT margin 5.1 5.2 5.5 5.3 5.2
Pretax profit margin 5.5 5.5 5.8 5.5 5.5
Payout ratio 0.0 19.6 18.9 18.8 18.8
DuPont analysis
Net profit margin (%) 4.2 4.2 4.6 4.4 4.4
Revenue/Assets (x) nm nm nm nm nm
Assets/Equity (x) 2.3 2.9 2.6 2.4 2.2
ROAE (%) 58.7 54.2 59.1 47.7 39.7
ROAA (%) 23.7 20.1 21.7 19.1 17.1
Liquidity & Efficiency
Cash conversion cycle 25.4 36.1 33.1 31.2 32.6
Days receivable outstanding 1.1 0.9 0.8 0.8 0.9
Days inventory outstanding 46.9 60.2 54.6 52.0 54.3
Days payables outstanding 22.6 24.9 22.3 21.6 22.6
Dividend cover (x) nm 5.1 5.3 5.3 5.3
Current ratio (x) 1.5 1.3 1.4 1.4 1.5
Leverage & Expense Analysis
Asset/Liability (x) 1.8 1.5 1.6 1.7 1.8
Net debt/equity (%) 27.5 68.9 25.5 16.2 net cash
Net interest cover (x) nm 34.8 92.1 nm nm
Debt/EBITDA (x) 0.7 1.4 1.2 1.2 1.1
Capex/revenue (%) 1.7 2.3 2.0 2.4 1.8
Net debt/ (net cash) 405.8 1,709.1 1,084.6 1,031.5 (38.7)
Source: Company; Maybank
July 12, 2016 16
Mobile World Investment Corp
Research Offices
REGIONAL
Sadiq CURRIMBHOY
Regional Head, Research & Economics
(65) 6231 5836 [email protected]
WONG Chew Hann, CA
Regional Head of Institutional Research
(603) 2297 8686 [email protected]
ONG Seng Yeow
Regional Head of Retail Research
(65) 6231 5839 [email protected]
TAN Sin Mui
Director of Research
(65) 6231 5849 [email protected]
ECONOMICS
Suhaimi ILIAS Chief Economist Singapore | Malaysia (603) 2297 8682 [email protected]
Luz LORENZO Philippines (63) 2 849 8836 [email protected]
Tim LEELAHAPHAN Thailand (66) 2658 6300 ext 1420 [email protected]
JUNIMAN Chief Economist, BII Indonesia (62) 21 29228888 ext 29682
STRATEGY
Sadiq CURRIMBHOY
Global Strategist
(65) 6231 5836 [email protected]
Willie CHAN
Hong Kong / Regional
(852) 2268 0631 [email protected]
MALAYSIA
WONG Chew Hann, CA Head of Research (603) 2297 8686 [email protected] • Strategy
Desmond CH’NG, ACA (603) 2297 8680 [email protected] • Banking & Finance
LIAW Thong Jung (603) 2297 8688 [email protected] • Oil & Gas Services- Regional
ONG Chee Ting, CA (603) 2297 8678 [email protected] • Plantations - Regional
Mohshin AZIZ (603) 2297 8692 [email protected] • Aviation - Regional • Petrochem
YIN Shao Yang, CPA (603) 2297 8916 [email protected] • Gaming – Regional • Media
TAN Chi Wei, CFA (603) 2297 8690 [email protected] • Power • Telcos
WONG Wei Sum, CFA (603) 2297 8679 [email protected] • Property
LEE Yen Ling (603) 2297 8691 [email protected] • Building Materials • Glove • Ports • Shipping
CHAI Li Shin, CFA (603) 2297 8684 [email protected] • Plantation • Construction & Infrastructure
Ivan YAP (603) 2297 8612 [email protected] • Automotive • Semiconductor • Technology
Kevin WONG (603) 2082 6824 [email protected] • REITs • Consumer Discretionary
LIEW Wei Han
(603) 2297 8676 [email protected] • Consumer Staples
LEE Cheng Hooi Regional Chartist (603) 2297 8694 [email protected]
Tee Sze Chiah Head of Retail Research (603) 2297 6858 [email protected]
HONG KONG / CHINA
Howard WONG Head of Research (852) 2268 0648 [email protected] • Oil & Gas - Regional
Benjamin HO (852) 2268 0632 [email protected] • Consumer & Auto
Jacqueline KO, CFA (852) 2268 0633 [email protected] • Consumer Staples & Durables
Ka Leong LO, CFA (852) 2268 0630 [email protected] • Consumer Discretionary & Auto
Mitchell KIM (852) 2268 0634 [email protected] • Internet & Telcos
Ning MA (852) 2268 0672 [email protected] • Insurance
Sonija LI, CFA, FRM (852) 2268 0641 [email protected] • Gaming
Stefan CHANG, CFA (852) 2268 0675 [email protected] • Technology – Regional
INDIA
Jigar SHAH Head of Research
(91) 22 6623 2632 [email protected]
• Oil & Gas • Automobile • Cement
Anubhav GUPTA
(91) 22 6623 2605 [email protected]
• Metal & Mining • Capital Goods • Property
Vishal MODI
(91) 22 6623 2607 [email protected]
• Banking & Financials
Abhijeet KUNDU
(91) 22 6623 2628 [email protected]
• Consumer
Neerav DALAL
(91) 22 6623 2606 [email protected]
• Software Technology • Telcos
SINGAPORE
Gregory YAP (65) 6231 5848 [email protected] • SMID Caps • Technology & Manufacturing • Telcos
YEAK Chee Keong, CFA (65) 6231 5842 [email protected] • Offshore & Marine
Derrick HENG, CFA (65) 6231 5843 [email protected] • Transport • Property • REITs (Office)
Joshua TAN (65) 6231 5850 [email protected] • REITs (Retail, Industrial)
John CHEONG, CFA (65) 6231 5845 [email protected] • Small & Mid Caps • Healthcare
Ng Li Hiang (65) 6231 5840 [email protected] • Banks
INDONESIA
Isnaputra ISKANDAR Head of Research (62) 21 8066 8680 [email protected] • Strategy • Metals & Mining • Cement
Rahmi MARINA (62) 21 8066 8689 [email protected] • Banking & Finance
Aurellia SETIABUDI (62) 21 8066 8691 [email protected] • Property
Pandu ANUGRAH (62) 21 8066 8688 [email protected] • Infra • Construction • Transport• Telcos
Janni ASMAN (62) 21 8066 8687 [email protected] • Cigarette • Healthcare • Retail
Adhi TASMIN (62) 21 8066 8694 [email protected] • Plantations
Anthony LUKMAWIJAYA (62) 21 8066 8690 [email protected] • Aviation
PHILIPPINES
Luz LORENZO Head of Research (63) 2 849 8836 [email protected] • Strategy • Utilities • Conglomerates • Telcos
Lovell SARREAL (63) 2 849 8841 [email protected] • Consumer • Media • Cement
Rommel RODRIGO (63) 2 849 8839 [email protected] • Conglomerates • Property • Gaming • Ports/ Logistics
Katherine TAN (63) 2 849 8843 [email protected] • Banks • Construction
Michael BENGSON (63) 2 849 8840 [email protected] • Conglomerates
Jaclyn JIMENEZ (63) 2 849 8842 [email protected] • Consumer
THAILAND
Maria LAPIZ Head of Institutional Research Dir (66) 2257 0250 | (66) 2658 6300 ext 1399 [email protected] • Consumer • Materials • Ind. Estates
Sittichai DUANGRATTANACHAYA (66) 2658 6300 ext 1393 [email protected] • Services Sector • Transport
Yupapan POLPORNPRASERT (66) 2658 6300 ext 1394 [email protected] • Oil & Gas
Tanawat RUENBANTERNG (66) 2658 6300 ext 1395 [email protected] • Banks & Diversified Financials
Sukit UDOMSIRIKUL Head of Retail Research (66) 2658 6300 ext 5090 [email protected]
Mayuree CHOWVIKRAN (66) 2658 6300 ext 1440 [email protected] • Strategy
Padon VANNARAT (66) 2658 6300 ext 1450 [email protected] • Strategy
Surachai PRAMUALCHAROENKIT (66) 2658 6300 ext 1470 [email protected] • Auto • Conmat • Contractor • Steel
Suttatip PEERASUB (66) 2658 6300 ext 1430 [email protected] • Media • Commerce
Sutthichai KUMWORACHAI (66) 2658 6300 ext 1400 [email protected] • Energy • Petrochem
Termporn TANTIVIVAT (66) 2658 6300 ext 1520 [email protected] • Property
Jaroonpan WATTANAWONG (66) 2658 6300 ext 1404 [email protected] • Transportation • Small cap
VIETNAM
LE Hong Lien, ACCA Head of Institutional Research (84) 8 44 555 888 x 8181 [email protected] • Strategy • Consumer • Diversified • Utilities
THAI Quang Trung, CFA, Deputy Manager, Institutional Research (84) 8 44 555 888 x 8180 [email protected] • Real Estate • Construction • Materials
Le Nguyen Nhat Chuyen (84) 8 44 555 888 x 8082 [email protected] • Oil & Gas
NGUYEN Thi Ngan Tuyen, Head of Retail Research (84) 8 44 555 888 x 8081 [email protected] • Food & Beverage • Oil&Gas • Banking
TRINH Thi Ngoc Diep (84) 4 44 555 888 x 8208 [email protected] • Technology • Utilities • Construction
PHAM Nhat Bich (84) 8 44 555 888 x 8083 [email protected] • Consumer • Manufacturing • Fishery
NGUYEN Thi Sony Tra Mi (84) 8 44 555 888 x 8084 [email protected] • Port operation • Pharmaceutical • Food & Beverage
TRUONG Quang Binh (84) 4 44 555 888 x 8087 [email protected] • Rubber plantation • Tyres and Tubes • Oil&Gas

July 12, 2016 17
Mobile World Investment Corp
APPENDIX I: TERMS FOR PROVISION OF REPORT, DISCLAIMERS AND DISCLOSURES
DISCLAIMERS
This research report is prepared for general circulation and for information purposes only and under no circumstances should it be considered or intended as an offer to sell or a solicitation of an offer to buy the securities referred to herein. Investors should note that values of such securities, if any, may fluctuate and that each security’s price or value may rise or fall. Opinions or recommendations contained herein are in form of technical ratings and fundamental ratings. Technical ratings may differ from fundamental ratings as technical valuations apply different methodologies and are purely based on price and volume-related information extracted from the relevant jurisdiction’s stock exchange in the equity analysis. Accordingly, investors’ returns may be less than the original sum invested. Past performance is not necessarily a guide to future performance. This report is not intended to provide personal investment advice and does not take into account the specific investment objectives, the financial situation and the particular needs of persons who may receive or read this report. Investors should therefore seek financial, legal and other advice regarding the appropriateness of investing in any securities or the investment strategies discussed or recommended in this report.
The information contained herein has been obtained from sources believed to be reliable but such sources have not been independently verified by Maybank Investment Bank Berhad, its subsidiary and affiliates (collectively, “MKE”) and consequently no representation is made as to the accuracy or completeness of this report by MKE and it should not be relied upon as such. Accordingly, MKE and its officers, directors, associates, connected parties and/or employees (collectively, “Representatives”) shall not be liable for any direct, indirect or consequential losses or damages that may arise from the use or reliance of this report. Any information, opinions or recommendations contained herein are subject to change at any time, without prior notice.
This report may contain forward looking statements which are often but not always identified by the use of words such as “anticipate”, “believe”, “estimate”, “intend”, “plan”, “expect”, “forecast”, “predict” and “project” and statements that an event or result “may”, “will”, “can”, “should”, “could” or “might” occur or be achieved and other similar expressions. Such forward looking statements are based on assumptions made and information currently available to us and are subject to certain risks and uncertainties that could cause the actual results to differ materially from those expressed in any forward looking statements. Readers are cautioned not to place undue relevance on these forward-looking statements. MKE expressly disclaims any obligation to update or revise any such forward looking statements to reflect new information, events or circumstances after the date of this publication or to reflect the occurrence of unanticipated events.
MKE and its officers, directors and employees, including persons involved in the preparation or issuance of this report, may, to the extent permitted by law, from time to time participate or invest in financing transactions with the issuer(s) of the securities mentioned in this report, perform services for or solicit business from such issuers, and/or have a position or holding, or other material interest, or effect transactions, in such securities or options thereon, or other investments related thereto. In addition, it may make markets in the securities mentioned in the material presented in this report. MKE may, to the extent permitted by law, act upon or use the information presented herein, or the research or analysis on which they are based, before the material is published. One or more directors, officers and/or employees of MKE may be a director of the issuers of the securities mentioned in this report.
This report is prepared for the use of MKE’s clients and may not be reproduced, altered in any way, transmitted to, copied or distributed to any other party in whole or in part in any form or manner without the prior express written consent of MKE and MKE and its Representatives accepts no liability whatsoever for the actions of third parties in this respect.
This report is not directed to or intended for distribution to or use by any person or entity who is a citizen or resident of or located in any locality, state, country or other jurisdiction where such distribution, publication, availability or use would be contrary to law or regulation. This report is for distribution only under such circumstances as may be permitted by applicable law. The securities described herein may not be eligible for sale in all jurisdictions or to certain categories of investors. Without prejudice to the foregoing, the reader is to note that additional disclaimers, warnings or qualifications may apply based on geographical location of the person or entity receiving this report.
Malaysia
Opinions or recommendations contained herein are in the form of technical ratings and fundamental ratings. Technical ratings may differ from fundamental ratings as technical valuations apply different methodologies and are purely based on price and volume-related information extracted from Bursa Malaysia Securities Berhad in the equity analysis.
Singapore
This report has been produced as of the date hereof and the information herein may be subject to change. Maybank Kim Eng Research Pte. Ltd. (“Maybank KERPL”) in Singapore has no obligation to update such information for any recipient. For distribution in Singapore, recipients of this report are to contact Maybank KERPL in Singapore in respect of any matters arising from, or in connection with, this report. If the recipient of this report is not an accredited investor, expert investor or institutional investor (as defined under Section 4A of the Singapore Securities and Futures Act), Maybank KERPL shall be legally liable for the contents of this report, with such liability being limited to the extent (if any) as permitted by law.
Thailand
The disclosure of the survey result of the Thai Institute of Directors Association (“IOD”) regarding corporate governance is made pursuant to the policy of the Office of the Securities and Exchange Commission. The survey of the IOD is based on the information of a company listed on the Stock Exchange of Thailand and the market for Alternative Investment disclosed to the public and able to be accessed by a general public investor. The result, therefore, is from the perspective of a third party. It is not an evaluation of operation and is not based on inside information. The survey result is as of the date appearing in the Corporate Governance Report of Thai Listed Companies. As a result, the survey may be changed after that date. Maybank Kim Eng Securities (Thailand) Public Company Limited (“MBKET”) does not confirm nor certify the accuracy of such survey result.
Except as specifically permitted, no part of this presentation may be reproduced or distributed in any manner without the prior written permission of MBKET. MBKET accepts no liability whatsoever for the actions of third parties in this respect.
US
This third-party research report is distributed in the United States (“US”) to Major US Institutional Investors (as defined in Rule 15a-6 under the Securities Exchange Act of 1934, as amended) only by Maybank Kim Eng Securities USA Inc (“Maybank KESUSA”), a broker-dealer registered in the US (registered under Section 15 of the Securities Exchange Act of 1934, as amended). All responsibility for the distribution of this report by Maybank KESUSA in the US shall be borne by Maybank KESUSA. All resulting transactions by a US person or entity should be effected through Maybank Kim Eng Securities USA Inc. This report is not directed at you if it is prohibited or restricted by any legislation or regulation in any jurisdiction from making it available to you. You should satisfy yourself before reading it that Maybank KESUSA is permitted to provide research material concerning investments to you under relevant legislation and regulations.
UK
This document is being distributed by Maybank Kim Eng Securities (London) Ltd (“Maybank KESL”) which is authorized and regulated, by the Financial Services Authority and is for Informational Purposes only. This document is not intended for distribution to anyone defined as a Retail Client under the Financial Services and Markets Act 2000 within the UK. Any inclusion of a third party link is for the recipients convenience only, and that the firm does not take any responsibility for its comments or accuracy, and that access to such links is at the individuals own risk. Nothing in this report should be considered as constituting legal, accounting or tax advice, and that for accurate guidance recipients should consult with their own independent tax advisers.

July 12, 2016 18
Mobile World Investment Corp
Disclosure of Interest
Malaysia: MKE and its Representatives may from time to time have positions or be materially interested in the securities referred to herein and may further act as market maker or may have assumed an underwriting commitment or deal with such securities and may also perform or seek to perform investment banking services, advisory and other services for or relating to those companies.
Singapore: As of 12 July 2016, Maybank KERPL and the covering analyst do not have any interest in any companies recommended in this research report.
Thailand: MBKET may have a business relationship with or may possibly be an issuer of derivative warrants on the securities /companies mentioned in the research report. Therefore, Investors should exercise their own judgment before making any investment decisions. MBKET, its associates, directors, connected parties and/or employees may from time to time have interests and/or underwriting commitments in the securities mentioned in this report.
Hong Kong: KESHK may have financial interests in relation to an issuer or a new listing applicant referred to as defined by the requirements under Paragraph 16.5(a) of the Hong Kong Code of Conduct for Persons Licensed by or Registered with the Securities and Futures Commission.
As of 12 July 2016, KESHK and the authoring analyst do not have any interest in any companies recommended in this research report.
MKE may have, within the last three years, served as manager or co-manager of a public offering of securities for, or currently may make a primary market in issues of, any or all of the entities mentioned in this report or may be providing, or have provided within the previous 12 months, significant advice or investment services in relation to the investment concerned or a related investment and may receive compensation for the services provided from the companies covered in this report.
OTHERS
Analyst Certification of Independence
The views expressed in this research report accurately reflect the analyst’s personal views about any and all of the subject securities or issuers; and no part of the research analyst’s compensation was, is or will be, directly or indirectly, related to the specific recommendations or views expressed in the report.
Reminder
Structured securities are complex instruments, typically involve a high degree of risk and are intended for sale only to sophisticated investors who are capable of understanding and assuming the risks involved. The market value of any structured security may be affected by changes in economic, financial and political factors (including, but not limited to, spot and forward interest and exchange rates), time to maturity, market conditions and volatility and the credit quality of any issuer or reference issuer. Any investor interested in purchasing a structured product should conduct its own analysis of the product and consult with its own professional advisers as to the risks involved in making such a purchase.
No part of this material may be copied, photocopied or duplicated in any form by any means or redistributed without the prior consent of MKE.
DISCLOSURES
Legal Entities Disclosures
Malaysia: This report is issued and distributed in Malaysia by Maybank Investment Bank Berhad (15938-H) which is a Participating Organization of Bursa Malaysia Berhad and a holder of Capital Markets and Services License issued by the Securities Commission in Malaysia. Singapore: This material is issued and distributed in Singapore by Maybank KERPL (Co. Reg No 197201256N) which is regulated by the Monetary Authority of Singapore. Indonesia: PT Kim Eng Securities (“PTKES”) (Reg. No. KEP-251/PM/1992) is a member of the Indonesia Stock Exchange and is regulated by the BAPEPAM LK. Thailand: MBKET (Reg. No.0107545000314) is a member of the Stock Exchange of Thailand and is regulated by the Ministry of Finance and the Securities and Exchange Commission. Philippines: Maybank ATRKES (Reg. No.01-2004-00019) is a member of the Philippines Stock Exchange and is regulated by the Securities and Exchange Commission. Vietnam: Maybank Kim Eng Securities JSC (License Number: 71/UBCK-GP) is licensed under the State Securities Commission of Vietnam.Hong Kong: KESHK (Central Entity No AAD284) is regulated by the Securities and Futures Commission. India: Kim Eng Securities India Private Limited (“KESI”) is a participant of the National Stock Exchange of India Limited (Reg No: INF/INB 231452435) and the Bombay Stock Exchange (Reg. No. INF/INB 011452431) and is regulated by Securities and Exchange Board of India. KESI is also registered with SEBI as Category 1 Merchant Banker (Reg. No. INM 000011708) US: Maybank KESUSA is a member of/ and is authorized and regulated by the FINRA – Broker ID 27861. UK: Maybank KESL (Reg No 2377538) is authorized and regulated by the Financial Services Authority.

July 12, 2016 19
Mobile World Investment Corp
Historical recommendations and target price: Mobile World Investment Corp (MWG VN)
Definition of Ratings
Maybank Kim Eng Research uses the following rating system
BUY Return is expected to be above 10% in the next 12 months (excluding dividends)
HOLD Return is expected to be between - 10% to +10% in the next 12 months (excluding dividends)
SELL Return is expected to be below -10% in the next 12 months (excluding dividends)
Applicability of Ratings
The respective analyst maintains a coverage universe of stocks, the list of which may be adjusted according to needs. Investment ratings are only applicable to the stocks which form part of the coverage universe. Reports on companies which are not part of the coverage do not carry investment ratings as we do not actively follow developments in these companies.
40,000.0
60,000.0
80,000.0
100,000.0
120,000.0
140,000.0
Jan-15 Apr-15 Jul-15 Oct-15 Jan-16 Apr-16 Jul-16 Mobile World Investment Corp
15 Jun Buy : d 91,000
11 Aug Buy : d 88,000
3 Mar Buy : d 96,000
July 12, 2016 20
Mobile World Investment Corp
Malaysia Maybank Investment Bank Berhad
(A Participating Organisation of
Bursa Malaysia Securities Berhad)
33rd Floor, Menara Maybank,
100 Jalan Tun Perak,
50050 Kuala Lumpur
Tel: (603) 2059 1888;
Fax: (603) 2078 4194
Singapore Maybank Kim Eng Securities Pte Ltd
Maybank Kim Eng Research Pte Ltd
50 North Canal Road
Singapore 059304
Tel: (65) 6336 9090
London Maybank Kim Eng Securities
(London) Ltd
PNB House
77 Queen Victoria Street
London EC4V 4AY, UK
Tel: (44) 20 7332 0221
Fax: (44) 20 7332 0302
New York Maybank Kim Eng Securities USA
Inc
777 Third Avenue, 21st Floor
New York, NY 10017, U.S.A.
Tel: (212) 688 8886
Fax: (212) 688 3500
Stockbroking Business:
Level 8, Tower C, Dataran Maybank,
No.1, Jalan Maarof
59000 Kuala Lumpur
Tel: (603) 2297 8888
Fax: (603) 2282 5136
Hong Kong Kim Eng Securities (HK) Ltd
Level 30,
Three Pacific Place,
1 Queen’s Road East,
Hong Kong
Tel: (852) 2268 0800
Fax: (852) 2877 0104
Indonesia PT Maybank Kim Eng Securities
Sentral Senayan III, 22nd Floor
Jl. Asia Afrika No. 8
Gelora Bung Karno, Senayan
Jakarta 10270, Indonesia
Tel: (62) 21 2557 1188
Fax: (62) 21 2557 1189
India Kim Eng Securities India Pvt Ltd
2nd Floor, The International,
16, Maharishi Karve Road,
Churchgate Station,
Mumbai City - 400 020, India
Tel: (91) 22 6623 2600
Fax: (91) 22 6623 2604
Philippines Maybank ATR Kim Eng Securities Inc.
17/F, Tower One & Exchange Plaza
Ayala Triangle, Ayala Avenue
Makati City, Philippines 1200
Tel: (63) 2 849 8888
Fax: (63) 2 848 5738
Thailand Maybank Kim Eng Securities
(Thailand) Public Company Limited
999/9 The Offices at Central World,
20th - 21st Floor,
Rama 1 Road Pathumwan,
Bangkok 10330, Thailand
Tel: (66) 2 658 6817 (sales)
Tel: (66) 2 658 6801 (research)
Vietnam Maybank Kim Eng Securities Limited
4A-15+16 Floor Vincom Center Dong
Khoi, 72 Le Thanh Ton St. District 1
Ho Chi Minh City, Vietnam
Tel : (84) 844 555 888
Fax : (84) 8 38 271 030
Saudi Arabia In association with
Anfaal Capital
Villa 47, Tujjar Jeddah
Prince Mohammed bin Abdulaziz
Street P.O. Box 126575
Jeddah 21352
Tel: (966) 2 6068686
Fax: (966) 26068787
South Asia Sales Trading Kevin Foy
Regional Head Sales Trading
Tel: (65) 6336-5157
US Toll Free: 1-866-406-7447
North Asia Sales Trading Andrew Lee
Tel: (852) 2268 0283
US Toll Free: 1 877 837 7635
Malaysia Rommel Jacob [email protected] Tel: (603) 2717 5152
Thailand Tanasak Krishnasreni [email protected] Tel: (66)2 658 6820
Indonesia Harianto Liong [email protected] Tel: (62) 21 2557 1177
New York Andrew Dacey [email protected] Tel: (212) 688 2956
India Manish Modi [email protected] Tel: (91)-22-6623-2601
Vietnam Tien Nguyen [email protected]
Tel: (84) 44 555 888 x8079
Philippines Keith Roy [email protected] Tel: (63) 2 848-5288
www.maybank-ke.com | www.maybank-keresearch.com