mobility, economic opportunity, and new york city ... · mobility, economic opportunity and new...
TRANSCRIPT

Mobility, Economic Opportunity
and New York City Neighborhoods
Sarah M. Kaufman, Mitchell L. Moss,
Jorge Hernandez and Justin Tyndall
Updated November 2015
with support from

Mobililty, Economic Opportunity and New York City Neighborhoods
This report was prepared with the assistance of Richard Dunks, Emily Rhodes, Ashley Smith and
Jenny O’Connell. The staff of the Metropolitan Transportation Authority, New York City
Department of Transportation and Riders Alliance made valuable comments and suggestions.
The accompanying map on the NYU Rudin Center’s website (www.NYURudinCenter.com) was
created by Jeff Ferzoco (linepointpath) and Richard Dunks (Datapolitan).
This research was carried out with the support of the Rockefeller Foundation and Google.
The Rudin Center for Transportation at the NYU Wagner School aims to strengthen our
understanding of all modes of transportation through research, public forums, and educational
programs. The Center draws upon faculty, students, and visiting scholars at NYU. Current areas
of inquiry include:
§ The flow of people, goods and information in and through New York City
§ Information technology and transportation systems
§ Inequality and access to employment
§ Urban bike share systems
§ The future of supercommuting
The Rudin Center was named in recognition of a gift from civic leader Lewis Rudin and receives
support from leading firms in transportation, finance, and communications. The director of the
Center is Mitchell L. Moss, Henry Hart Rice Professor of Urban Policy and Planning.
295 LAFAYETTE STREET [email protected] NEW YORK, NY 10012 FACEBOOK.COM/NYURUDINCENTER 212.992.9865 @NYURUDIN

Mobility, Economic Opportunity and NYC Neighborhoods 3
CONTENTS
Key Findings and Recommendations ........................................................................................................... 4
Executive Summary ..................................................................................................................................... 7
Related Literature ...................................................................................................................................... 13
Methodology ............................................................................................................................................. 16
Neighborhood Rankings ............................................................................................................................. 21
Recommendations ..................................................................................................................................... 33
Conclusion ................................................................................................................................................. 39

KEY FINDINGS AND RECOMMENDATIONS
Of the top 20 neighborhoods for job access, 18 are located in Manhattan, with an average of 4,128,263 jobs accessible within one hour on transit.
Highest and Lowest Transit Access Neighborhoods (with rank/177)
Manhattan North Chelsea (1) é ê Fort George (90)
Bronx Tremont (68) é ê City Island (172)
Brooklyn Boerum Hill (East)/ Park Slope (North) (24) é ê East New York (South) (169)
Queens Briarwood/Jamaica Center (9) é ê Breezy Point (177)
Staten Island Arrochar/Shore Acres (141) é ê South Staten Island (176)
Low transit access typically leads to a car commute.
The percentage of people who commute by private car increased from 2% in high-‐access areas to 80% in the city’s lowest-‐access areas in Staten Island and Queens. In most of the highest transit access areas, less than ten percent of commuters travel by private car.
In 40 neighborhoods (23%), walking is a more common commute mode than driving.
In 134 neighborhoods (76%), public transportation remained the primary commute mode.
Mobility, Economic Opportunity and NYC Neighborhoods 5
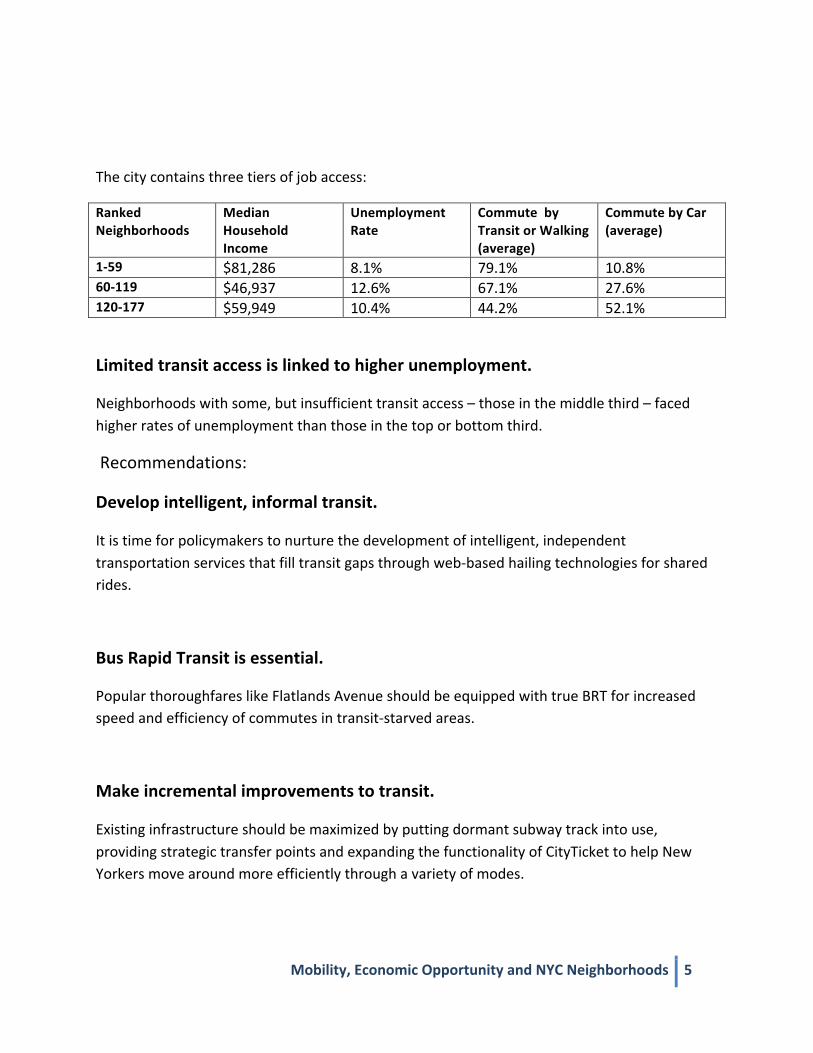
The city contains three tiers of job access:
Ranked Neighborhoods
Median Household Income
Unemployment Rate
Commute by Transit or Walking (average)
Commute by Car (average)
1-‐59 $81,286 8.1% 79.1% 10.8% 60-‐119 $46,937 12.6% 67.1% 27.6% 120-‐177 $59,949 10.4% 44.2% 52.1%
Limited transit access is linked to higher unemployment.
Neighborhoods with some, but insufficient transit access – those in the middle third – faced higher rates of unemployment than those in the top or bottom third.
Recommendations:
Develop intelligent, informal transit.
It is time for policymakers to nurture the development of intelligent, independent transportation services that fill transit gaps through web-‐based hailing technologies for shared rides.
Bus Rapid Transit is essential.
Popular thoroughfares like Flatlands Avenue should be equipped with true BRT for increased speed and efficiency of commutes in transit-‐starved areas.
Make incremental improvements to transit.
Existing infrastructure should be maximized by putting dormant subway track into use, providing strategic transfer points and expanding the functionality of CityTicket to help New Yorkers move around more efficiently through a variety of modes.

Foster smart, efficient workplaces.
More New Yorkers should be able to work remotely when possible. Policymakers should incentivize workplaces to allow employees to work from neighborhood office centers, reducing commute needs and congestion in traffic and transit.
Mobility, Economic Opportunity and NYC Neighborhoods 7
EXECUTIVE SUMMARY Although public transit provides access to jobs throughout the New York City region,
there are substantial inequalities in access among neighborhoods. By focusing on the
neighborhood level, the NYU Rudin Center for Transportation has identified communities that
are substantially underserved by the public transportation system.
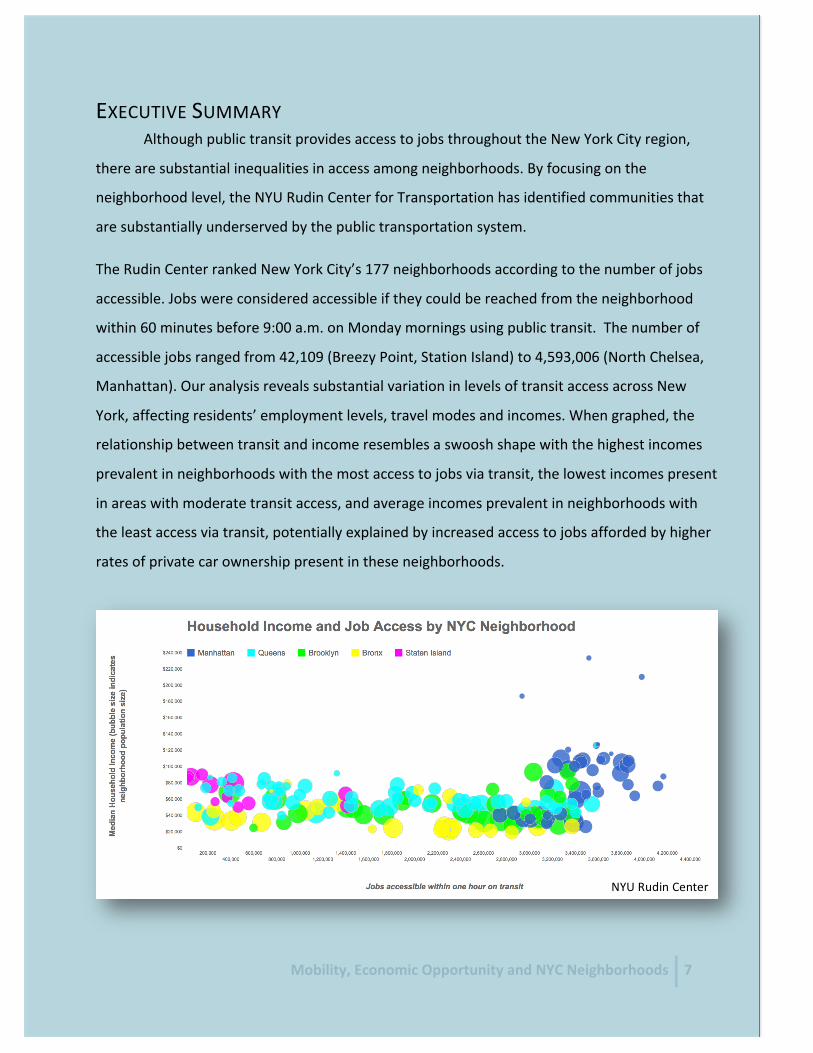
The Rudin Center ranked New York City’s 177 neighborhoods according to the number of jobs
accessible. Jobs were considered accessible if they could be reached from the neighborhood
within 60 minutes before 9:00 a.m. on Monday mornings using public transit. The number of
accessible jobs ranged from 42,109 (Breezy Point, Station Island) to 4,593,006 (North Chelsea,
Manhattan). Our analysis reveals substantial variation in levels of transit access across New
York, affecting residents’ employment levels, travel modes and incomes. When graphed, the
relationship between transit and income resembles a swoosh shape with the highest incomes
prevalent in neighborhoods with the most access to jobs via transit, the lowest incomes present
in areas with moderate transit access, and average incomes prevalent in neighborhoods with
the least access via transit, potentially explained by increased access to jobs afforded by higher
rates of private car ownership present in these neighborhoods.
NYU Rudin Center
This chart is also available in interactive form: http://bit.ly/RudinJobAccess
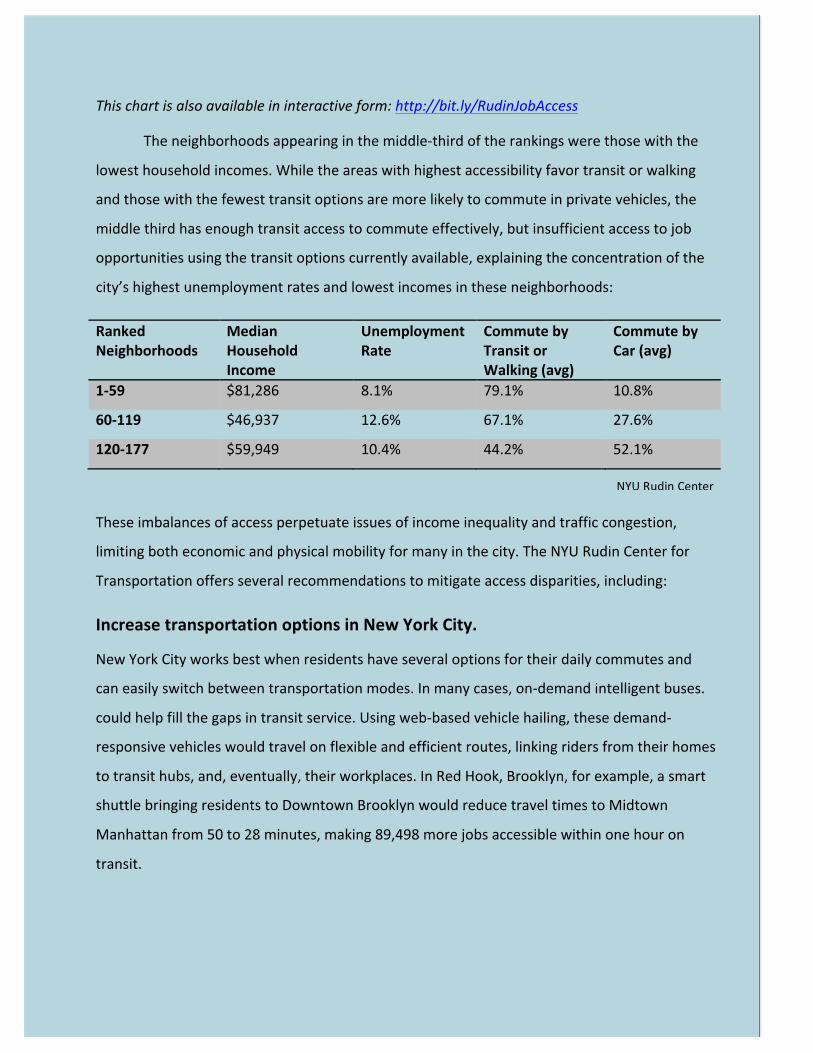
The neighborhoods appearing in the middle-‐third of the rankings were those with the
lowest household incomes. While the areas with highest accessibility favor transit or walking
and those with the fewest transit options are more likely to commute in private vehicles, the
middle third has enough transit access to commute effectively, but insufficient access to job
opportunities using the transit options currently available, explaining the concentration of the
city’s highest unemployment rates and lowest incomes in these neighborhoods:
Ranked Neighborhoods
Median Household Income
Unemployment Rate
Commute by Transit or Walking (avg)
Commute by Car (avg)
1-‐59 $81,286 8.1% 79.1% 10.8%
60-‐119 $46,937 12.6% 67.1% 27.6%
120-‐177 $59,949 10.4% 44.2% 52.1%
These imbalances of access perpetuate issues of income inequality and traffic congestion,
limiting both economic and physical mobility for many in the city. The NYU Rudin Center for
Transportation offers several recommendations to mitigate access disparities, including:
Increase transportation options in New York City.
New York City works best when residents have several options for their daily commutes and
can easily switch between transportation modes. In many cases, on-‐demand intelligent buses.
could help fill the gaps in transit service. Using web-‐based vehicle hailing, these demand-‐
responsive vehicles would travel on flexible and efficient routes, linking riders from their homes
to transit hubs, and, eventually, their workplaces. In Red Hook, Brooklyn, for example, a smart
shuttle bringing residents to Downtown Brooklyn would reduce travel times to Midtown
Manhattan from 50 to 28 minutes, making 89,498 more jobs accessible within one hour on
transit.
NYU Rudin Center

Mobility, Economic Opportunity and NYC Neighborhoods 9
Improve roadways with Bus Rapid Transit.
As previously recommended by a study from Pratt Center for Community Development, the
Rudin Center recommends the development of Bus Rapid Transit on several corridors in New
York City. Flatlands Avenue and Kings Highway in Brooklyn are an ideal location, with 32,000
bus riders daily, bus speeds 71% slower than car traffic along the same routes, and sufficient
width to accomodate a protected bus lane. Bus Rapid Transit would likely be increase bus
speeds significantly, providing thousands of New Yorkers with improved access job
opportunities both at hospitals along the route and through multiple connections to subways
along the route.
Maximize the efficiency of the existing transportation system.
Because New York City’s landscape makes it extremely difficult to build new infrastructure, the
Metropolitan Transportation Authority should seek to improve upon existing resources, from
bringing unused tracks online to building out simple transfers. In particular, CityTicket should be
extended to weekday usage, allowing New York City residents to ride commuter rail at a
discount. In Norwood, in the Bronx, residents’ commutes would be reduced from 48 to 33 minutes
to Midtown Manhattan when using Metro-‐North, increasing the number of jobs within one hour on
public transit by 527,819. In addition, employing demand-‐responsive tools to make Access-‐A-‐Ride
paratransit systems more efficient would greatly assist the 170,000 New Yorkers who rely on it.
Encourage remote work.
Due to advances in telecommunications, many information-‐based jobs can be conducted
remotely. If policymakers incentivize workforce distribution (to places like neighborhood office
centers and co-‐working spaces), employees will reach their places of work more easily, the
productive workday will be expanded without the hassle of commuting, workers in more
isolated locations will have access to more job opportunities, and crowding on transit will be
reduced. Approximately four percent of New Yorkers work from home; that number may
increase significantly with the advent of the new citywide wi-‐fi system.
By focusing on underserved areas of the New York City job market, new policies and
services can increase economic opportunity for New Yorkers, and ensure that the
transportation system is fully leveraged to connect workers with jobs. These improvements will
benefit all New Yorkers’ access to job opportunities and economic mobility.

Mobility, Economic Opportunity and NYC Neighborhoods 11
INTRODUCTION
The ability of a public transportation network to physically link residents to jobs has
become a central point of concern for urban policy in an era of uneven unemployment and
rapidly changing job markets. The economy of New York City is unique in North America due to
the high modal share of public transportation. Here, 56 percent of the population uses transit
to reach work and an individual’s ability to access a job is largely a function of how well their
neighborhood is served by the public transportation system. This report presents direct
measurements of job access in New York City and contrasts the levels of access that are
experienced in the city’s many neighborhoods.
The NYU Rudin Center analyzed and ranked 177 New York City neighborhoods’ access to
job opportunities, household income and population size. Drawing on census data and the
Google Maps Routing Application Programming Interface, the rankings reflect the number of
jobs available within one hour on public transportation. A commute time of one hour or less
was based on prior research that commuters prefer to travel less than one hour.
The data show that mass transit access is associated with job opportunities and
household income levels in most New York City neighborhoods:
NYU Rudin Center
This chart is also available in interactive form: http://bit.ly/RudinJobAccess
The number of accessible jobs ranged from 42,109 (Breezy Point, Station Island) to
4,593,006 (North Chelsea, Manhattan). Our analysis reveals substantial variation in levels of
transit access across New York, affecting residents’ employment levels, travel modes and
incomes. When graphed, the relationship between transit and income resembles a swoosh
shape with the highest incomes prevalent in neighborhoods with the most access to jobs via
transit, the lowest incomes present in areas with moderate transit access, and average incomes
prevalent in neighborhoods with the least access via transit, potentially explained by increased
access to jobs afforded by higher rates of private car ownership present in these
neighborhoods.
The economic opportunities in neighborhoods without multiple transportation options
are shown to be tangibly inferior to areas with denser public transit services. By focusing on
these underserved areas of the New York City job market, we can implement new policies and
services to increase economic opportunity for New Yorkers, and ensure the transportation
system is fully leveraged to connect workers with jobs. To improve economic opportunities
citywide, the NYU Rudin Center recommends that policymakers increase the number of
transportation modal options across the city, maximize use of existing transportation
infrastructure, and foster the ability to work remotely. These solutions will benefit all New
Yorkers’ access to job opportunities and economic improvement.
Mobility, Economic Opportunity and NYC Neighborhoods 13
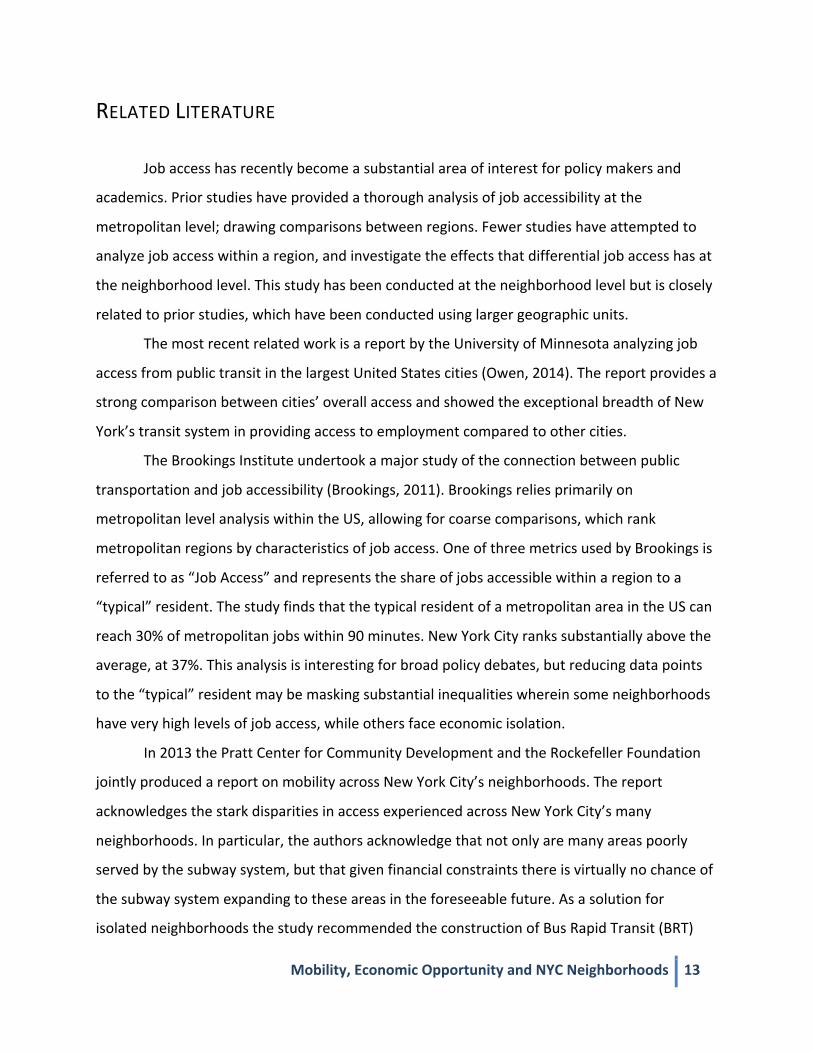
RELATED LITERATURE
Job access has recently become a substantial area of interest for policy makers and
academics. Prior studies have provided a thorough analysis of job accessibility at the
metropolitan level; drawing comparisons between regions. Fewer studies have attempted to
analyze job access within a region, and investigate the effects that differential job access has at
the neighborhood level. This study has been conducted at the neighborhood level but is closely
related to prior studies, which have been conducted using larger geographic units.
The most recent related work is a report by the University of Minnesota analyzing job
access from public transit in the largest United States cities (Owen, 2014). The report provides a
strong comparison between cities’ overall access and showed the exceptional breadth of New
York’s transit system in providing access to employment compared to other cities.
The Brookings Institute undertook a major study of the connection between public
transportation and job accessibility (Brookings, 2011). Brookings relies primarily on
metropolitan level analysis within the US, allowing for coarse comparisons, which rank
metropolitan regions by characteristics of job access. One of three metrics used by Brookings is
referred to as “Job Access” and represents the share of jobs accessible within a region to a
“typical” resident. The study finds that the typical resident of a metropolitan area in the US can
reach 30% of metropolitan jobs within 90 minutes. New York City ranks substantially above the
average, at 37%. This analysis is interesting for broad policy debates, but reducing data points
to the “typical” resident may be masking substantial inequalities wherein some neighborhoods
have very high levels of job access, while others face economic isolation.
In 2013 the Pratt Center for Community Development and the Rockefeller Foundation
jointly produced a report on mobility across New York City’s neighborhoods. The report
acknowledges the stark disparities in access experienced across New York City’s many
neighborhoods. In particular, the authors acknowledge that not only are many areas poorly
served by the subway system, but that given financial constraints there is virtually no chance of
the subway system expanding to these areas in the foreseeable future. As a solution for
isolated neighborhoods the study recommended the construction of Bus Rapid Transit (BRT)
infrastructure to increase accessibility. The choice to compare accessibility across
neighborhoods is a surprisingly uncommon approach in the related literature. The current study
will embrace this approach to investigating job access.
The Urban Institute released a study in 2014 entitled Driving to Opportunity, which took
a thorough look at the connection between household location, transportation, and
employment outcomes. The report finds that the ability for households to access job markets
leads to improved economic outcomes. The authors claim that the best way to increase job
access for low-‐income households is to increase their level of automobile ownership. The data
is able to demonstrate that car ownership is highly correlated with positive employment
outcomes. The evidence presented in the study indicates that car ownership will improve job
access for the marginal household; however, it seems unlikely this finding could be used as the
basis of policy. Increasing the number of cars used within a region will slow down all road users
due to congestion, potentially wiping out the gains that are accruing to the households who
gain cars. In contrast, increasing the capacity of the public transportation system as a way to
increase job access for low-‐income families does not suffer from this pitfall.
A thorough attempt to modeling job access in metropolitan regions is provided by
Prud’homme and Lee (1999). The authors suggest that the optimal size of a city is a function of
the quality of its transportation planning. As cities grow they increase total jobs available but
traffic congestion increases simultaneously, cities that are successful in combating congestion
will therefore have a larger ‘optimal’ size, and will be able to supply more jobs to typical
residents. Prud’homme and Lee (1999), looking at a sample of French cities, find a general link
between the productivity of residents and the number of jobs that residents have access to
within 60 minutes. Cox (2014) recently provided a discussion of how these findings should be
understood in an international context.
Several authors have referred to a general link between public transportation access
and the ability to find employment. Thomas Sanchez provides US case studies which directly
look at transit characteristics – such as the nearness to a bus or subway stop, or transit
frequency – and relates transportation access to lower levels of unemployment (Sanchez 1999;
Sanchez et al. 2004). O’Regan and Quigley provide a series of papers on the connection

Mobility, Economic Opportunity and NYC Neighborhoods 15
between neighborhood accessibility and youth employment rates, but elect for a definition of
access which is “broadly defined to include traditional measures of geographical distance, as
well as measures of social isolation and social access” (O’Regan and Quigley 1998; see also
O’Regan and Quigley 1996).
Whereas previous studies rely on proxies and heuristics to contrast job access between
neighborhoods, this report will suggest methods that directly measure the number of jobs
accessible to a given neighborhood and investigate how differentials in job access may translate
into differentials in neighborhood conditions and the opportunities of individuals.
References: Andersson, Fredrik; Haltiwanger, John C.; Kutzbach, Mark J.; Pollakowski, Henry O.; and Weinberg, Daniel H. (2014). Job Displacement and The Duration Of Joblessness: The Role of Spatial Mismatch, U.S. Bureau of the Census.
Brookings: Metropolitan Policy Program. (2011). Missed Opportunity: Transit and Jobs in Metropolitan America. Metropolitan Infrastructure Initiative Series and Metropolitan Opportunity Series. Cox, W. (2014). America’s Accessible Cities. Huffington Post, Urban Progress. September 4, 2014. O’Regan, K.M.; Quigley, J.M. (1996). Teenage Employment and the Spatial Isolation of Minority and Poverty Households. The Journal of Human Resources, 31:3. O’Regan, K.M.; Quigley, J.M. (1998). Where Youth Live: Economic Effects of Urban Space on Employment Prospects. Urban Studies, 35:7. Owen, Andrew and Levinson, David. (2014) “Access Across America: Transit 2014,” University of Minnesota, Center for Transportation Studies. Pratt Center for Community Development & Rockefeller Foundation. (2013). Mobility and Equity for New York’s Transit-‐Starved Neighborhoods: The Case for Full-‐Featured Bus Rapid Transit. Prud’homme, R.; Lee, C.W. (1999). Size, Sprawl, Speed and the Efficiency of Cities. Urban Studies, 36:11.

Sanchez, T.W. (1999). The Connection Between Public Transit and Employment: The Cases of Portland and Atlanta. Journal of the American Planning Association, 65:3. Sanchez, T.W.; Shen, Q.; Peng, Zhong-‐Ren. (2004). Transit Mobility, Jobs Access and Low-‐income Labour Participation in US Metropolitan Areas. Urban Studies, 41:7.
METHODOLOGY
DATA SOURCES Routing: Google Maps Application Programming Interface Google integrates local public transportation service information into its online mapping
service for estimates of travel times between origins and destinations. Google Inc. provides
access to the back end of their Google Maps service, through the Google Maps Application
Programing Interface (API). The API can be queried with origin and destination pairs to output
the estimated travel time according to Google’s algorithm. This project utilized this service to
generate a data set containing all zip code-‐level travel times in the region, which originated in
New York City and terminated anywhere in the New York, New Jersey, Connecticut region.
For this project, the precise start and end locations of each trip are assumed to be the
geographic center of the specific zip code. Google will estimate a walk time from the center of
the zip code to the initial transit connection (e.g., subway station or bus stop) and consider the
walk time as a component of the total trip time. Similarly, the conclusion of the trip terminates
in a walk to the center of the destination zip code. This means that travel times will be
dependent on how close a zip code’s geographic center is to a transit stop; this may be a more
valid assumption for some zip codes more than others. This project looks at a 60-‐minute time
horizon, meaning the initial and final minutes spent walking will only be a small component of
total trip time at this threshold.
Specific assumptions present in the resulting data set are as follows:
• For zip code 10035–East Harlem (North)–the centroid calculated by Google is
placed on Randalls Island, which is contained within the eastern bound of the zip

Mobility, Economic Opportunity and NYC Neighborhoods 17
code; however, the population center of this neighborhood is located on
Manhattan Island. Rather than using the centroid in this instance, the
origin/destination point is set at 122nd Street and 3rd Ave, which is the
geographic center of the Manhattan portion of this zip code.
• For zip code 10033, the centroid, which Google places in the Hudson River, is
instead assumed to be at 181st Street and Broadway.
• For zip code 11234, the centroid for zip code 11234, which is cited in an
inaccessible marsh area adjacent to Belt Parkway, is moved to the center of the
zip code’s developed area at Avenue M and 55th Street.
A second assumption deals with the public transit options contained within Google’s
algorithm. Public transit travel times are to some extent contingent on the time of day the trip
is made. The time parameter is set assuming the trip is completed on a Monday morning, and
allows the traveler to reach their destination by 9:00 a.m. In accordance with this project’s
focus on public transportation service and mobility, the trip must be completed through either
walking, public transportation services or both. The possible public transportation options
available through Google’s algorithm in the New York City region include: New York City
Subway, PATH train, Long Island Rail Road, Metro North Railroad, New Jersey Transit Rail, MTA
Bus Company, MTA New York City Transit services, Staten Island Ferry, Nassau Inter-‐County
Express bus service, Rockland County Department of Transportation services, and the
Downtown Alliance shuttle bus. Rarely, Google’s algorithm will include short taxi trips when
public transportation and walking cannot provide a reasonably convenient route. This can occur
in areas where public transportation coverage is sparse, particularly in zip codes outside of New
York City. These instances are rare, and only affect destination zip codes with relatively low job
counts, meaning the effect of allowing taxi trips on overall job counts will be very low; however,
it is worth noting that the maps produced by this report may display a zip code as accessible,
when in fact this only holds true when the commuter is allowed use of a taxi.
In rare instances during automated data collection Google’s servers were unable to
return a commute time estimate for a given route due to technical reasons. There has been
every effort made to catch these instances and input the travel time manually. The number of
missed observations is low, and will not meaningfully affect the trends presented in this report.
U.S. Census, 2008-‐2012 American Community Survey: Data for neighborhood demographics is taken exclusively from the 2008-‐2012 American
Community Survey (ACS) Five-‐Year Estimate Data at the level of Zip Code Tabulation Areas
(ZCTAs). ZCTAs are delineated by the Census Bureau. Although the documentation on
supported geographies for the 2008-‐2012 5 Year ACS does not list ZCTAs, they are listed for the
previous set and were applied to this ACS for this research.
The Census Bureau aggregates the demographic data from the ACS by ZCTA and makes
that data available. The data for this report was accessed through the Application Programmer
Interface (API). In most cases, the data in this report is exactly as reported by the ACS. However,
in some cases, these assumptions were made:
• For the total number of unemployed persons 16 or over in the labor force by race, the
number had to be summed together from constituent variables (unemployed white
males 16 to 64 in the labor force, unemployed white males 65 or over in the labor force,
unemployed white females 16 to 64 in the labor force, unemployed white females 65
and over in the labor force).
• For education level attained, the NYU Rudin Center only listed degrees attained, and not
“some high school,” “some college,” and so forth.
It should be noted that the Census estimates do not account for margin of error. The Census
publishes a comprehensive methodology for calculating margins of errors. In cases where ZCTA
level data is unavailable, census tract data is cross-‐walked to conform to ZCTA boundaries using
an allocation algorithm provided by the Missouri Census Data Center.
U.S. Census, 2013 LEHD Origin-‐Destination Employment Statistics:

Mobility, Economic Opportunity and NYC Neighborhoods 19
The US Census releases a series of data products concerning workforce characteristics
known as Longitudinal Employer-‐Household Dynamics (LEHD) data sets. One of these products
is the LEHD Origin-‐Destination Employment Statistics (LODES) dataset that provides
employment counts by subcategories at the census block level. LODES provides a level of detail
regarding employment that is not available in either the Decennial Census or the American
Community Survey. LODES data has been “cross-‐walked” from census blocks to zip codes using
the Missouri Census Data Center tool described above. Because census blocks are even smaller
than the census tracts used for demographic data, there is essentially no loss of precision due
to cross-‐walking to the much larger zip code level. LODES is released annually, this report uses
the most recent data release, which presents information for 2013.
PROCESSING Data points from the three aforementioned sources are merged together to create a
single observation for each zip code in New York City. LODES data has been downloaded for all
of New York State, New Jersey, and Connecticut; this allows job counts to be assigned to zip
codes for the entire region. Google routing data is collected for journeys originating within a zip
code in New York City, but ending in any zip code within the larger region. American
Community Survey data is collected for New York City only.
New York City fully contains 186 Zip Code Tabulation Areas (ZCTAs) as defined in the
2010 US Census. In this work, ZCTAs are only included as a unit of observation if they contain a
population of at least 2,500 persons according to the 2008-‐2012 American Community Survey.
The population threshold is used to ensure accurate demographic data exists within the zip
code (unlike park areas), and to avoid small areas that would not be representative of a larger
neighborhood. Of the 186 zip codes, 177 have a population of at least 2,500.
All 177 zip codes have been assigned a neighborhood name to improve the readability
of the report. These names are not meant to be definitive but to conform as closely as possible
to common neighborhood boundary definitions in New York City. Several zip codes straddle the
boundaries of multiple neighborhoods, and names have been chosen to reflect this as clearly as
possible.
The analysis in this report assigns a 60 minute commute cutoff as a way to measure
“accessible” jobs, reflecting extensive literature showing 60 minutes as the preferred cutoff for
travel times. The analysis limits travel to 60 minutes by taking the generated list of all zip codes
reachable within 60 minutes and summing job totals across all reachable zip codes, including
the origin zip code.

Mobility, Economic Opportunity and NYC Neighborhoods 21
NEIGHBORHOOD RANKINGS
The NYU Rudin Center ranked New York City’s 177 neighborhoods by the number of jobs
accessible within one hour on public transit during a rush-‐hour commute. The overall outcome
depicts a strong link between income and access to job opportunities:
This chart is also available in interactive form: http://bit.ly/RudinJobAccess
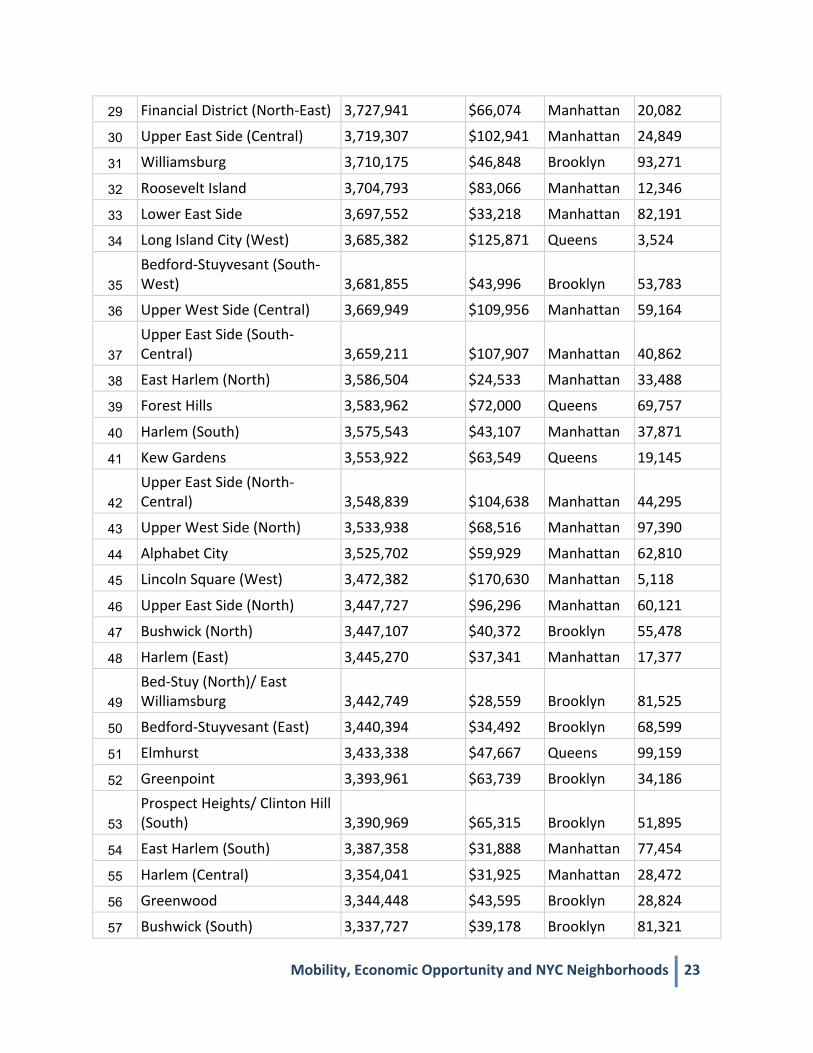
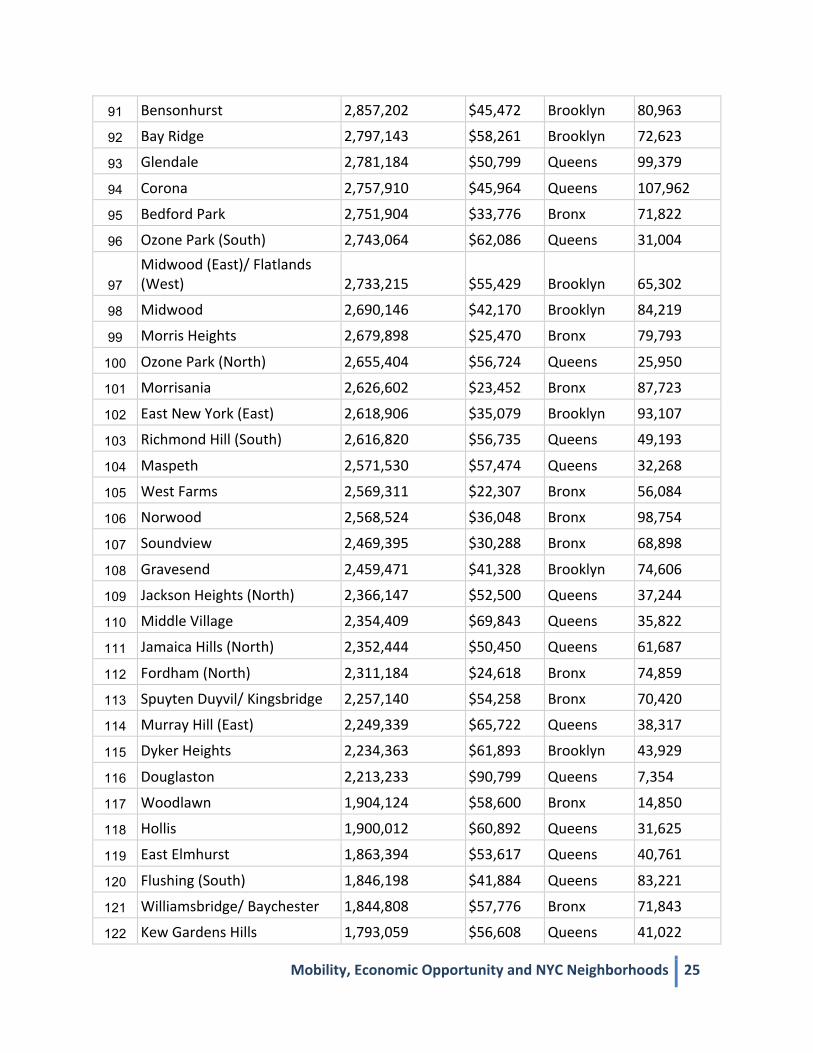
The following pages show the detailed results of the NYU Rudin Center’s neighborhood
ranking analysis. Although the neighborhoods of origin are all located within New York City, the
jobs are not limited to the city’s borders; in fact, many jobs in Long Island and northern New
Jersey are highly accessible from parts of Manhattan and the outer boroughs. The
neighborhoods, which were delineated by zip code, are also listed with their median household
incomes and population counts for additional context. A discussion of these rankings follows
the listing.
NYU Rudin Center

NEIGHBORHOOD RANKINGS BY NUMBER OF JOBS ACCESSIBLE WITHIN ONE HOUR
Rank Neighborhood Jobs Accessible Median Income Borough Population
1 Chelsea (North) 4,593,006 $81,671 Manhattan 21,966
2 Hell's Kitchen (South) 4,542,251 $104,635 Manhattan 7,021
3 Hell's Kitchen (Central) 4,389,002 $66,599 Manhattan 23,132
4 Chelsea (South) 4,297,411 $104,238 Manhattan 52,167
5 Midtown (North-‐East) 4,189,691 $109,019 Manhattan 29,618
6 Midtown East (South) 4,180,797 $100,652 Manhattan 16,129
7 Tribeca (South) 4,155,674 $216,037 Manhattan 6,525
8 Tribeca (North) 4,122,632 $83,725 Manhattan 26,065
9 Briarwood/ Jamaica Center 4,119,763 $53,041 Queens 53,542
10 Hell's Kitchen (North) 4,113,415 $84,424 Manhattan 38,394
11 East Village/ Midtown (South) 4,047,421 $92,540 Manhattan 57,310
12 Woodside 4,026,663 $49,886 Queens 86,316
13 SoHo 4,018,809 $86,594 Manhattan 26,145
14 Midtown (South-‐East) 4,010,138 $97,955 Manhattan 30,670
15 Upper East Side (South) 3,987,897 $115,519 Manhattan 32,797
16 Upper West Side (North-‐East) 3,981,379 $103,534 Manhattan 61,315
17 Central Harlem/ Morningside Heights 3,979,548 $37,872 Manhattan 62,617
18 Kips Bay/ Murray Hill 3,970,556 $105,324 Manhattan 51,196
19 West Village 3,930,940 $108,483 Manhattan 30,597
20 Financial District (West) 3,908,266 $119,274 Manhattan 2,507
21 Financial District (South) 3,857,633 $129,313 Manhattan 2,807
22 Financial District (East) 3,855,442 $124,670 Manhattan 6,822
23 Long Island City (Central) 3,854,725 $47,142 Queens 25,537
24 Boerum Hill (East)/ Park Slope (North) 3,832,900 $81,862 Brooklyn 38,787
25 Sunnyside 3,811,568 $56,059 Queens 25,729
26 Battery Park City (North) 3,776,445 $230,952 Manhattan 6,217
27 Battery Park City (South) 3,757,781 $129,574 Manhattan 8,685
28 Brooklyn Heights/Dumbo 3,732,698 $95,369 Brooklyn 54,668
Mobility, Economic Opportunity and NYC Neighborhoods 23
29 Financial District (North-‐East) 3,727,941 $66,074 Manhattan 20,082
30 Upper East Side (Central) 3,719,307 $102,941 Manhattan 24,849
31 Williamsburg 3,710,175 $46,848 Brooklyn 93,271
32 Roosevelt Island 3,704,793 $83,066 Manhattan 12,346
33 Lower East Side 3,697,552 $33,218 Manhattan 82,191
34 Long Island City (West) 3,685,382 $125,871 Queens 3,524
35 Bedford-‐Stuyvesant (South-‐West) 3,681,855 $43,996 Brooklyn 53,783
36 Upper West Side (Central) 3,669,949 $109,956 Manhattan 59,164
37 Upper East Side (South-‐Central) 3,659,211 $107,907 Manhattan 40,862
38 East Harlem (North) 3,586,504 $24,533 Manhattan 33,488
39 Forest Hills 3,583,962 $72,000 Queens 69,757
40 Harlem (South) 3,575,543 $43,107 Manhattan 37,871
41 Kew Gardens 3,553,922 $63,549 Queens 19,145
42 Upper East Side (North-‐Central) 3,548,839 $104,638 Manhattan 44,295
43 Upper West Side (North) 3,533,938 $68,516 Manhattan 97,390
44 Alphabet City 3,525,702 $59,929 Manhattan 62,810
45 Lincoln Square (West) 3,472,382 $170,630 Manhattan 5,118
46 Upper East Side (North) 3,447,727 $96,296 Manhattan 60,121
47 Bushwick (North) 3,447,107 $40,372 Brooklyn 55,478
48 Harlem (East) 3,445,270 $37,341 Manhattan 17,377
49 Bed-‐Stuy (North)/ East Williamsburg 3,442,749 $28,559 Brooklyn 81,525
50 Bedford-‐Stuyvesant (East) 3,440,394 $34,492 Brooklyn 68,599
51 Elmhurst 3,433,338 $47,667 Queens 99,159
52 Greenpoint 3,393,961 $63,739 Brooklyn 34,186
53 Prospect Heights/ Clinton Hill (South) 3,390,969 $65,315 Brooklyn 51,895
54 East Harlem (South) 3,387,358 $31,888 Manhattan 77,454
55 Harlem (Central) 3,354,041 $31,925 Manhattan 28,472
56 Greenwood 3,344,448 $43,595 Brooklyn 28,824
57 Bushwick (South) 3,337,727 $39,178 Brooklyn 81,321

58 Astoria (East) 3,332,220 $55,129 Queens 37,745
59 Harlem (West) 3,321,673 $37,655 Manhattan 59,092
60 Prospect Lefferts Gardens 3,306,723 $42,922 Brooklyn 59,182
61 Jackson Heights (South) 3,283,739 $48,683 Queens 63,320
62 Washington Heights (South) 3,264,292 $34,568 Manhattan 59,374
63 Inwood 3,247,006 $41,171 Manhattan 41,510
64 Sunset Park 3,243,139 $37,580 Brooklyn 103,089
65 Astoria (North) 3,232,285 $49,924 Queens 34,529
66 Crown Heights (East) 3,231,258 $34,794 Brooklyn 62,059
67 Richmond Hill (North) 3,230,753 $60,691 Queens 36,828
68 Tremont 3,227,508 $24,949 Bronx 70,282
69 Astoria (Central) 3,224,075 $48,720 Queens 36,869
70 Mott Haven/Port Morris 3,220,643 $20,232 Bronx 38,089
71 Washington Heights (North) 3,213,165 $41,556 Manhattan 58,710
72 Carroll Gardens/ Red Hook 3,168,829 $78,174 Brooklyn 34,137
73 Longwood (South) 3,166,291 $22,609 Bronx 38,576
74 Highbridge 3,161,446 $25,979 Bronx 74,931
75 East New York (West) 3,144,455 $32,945 Brooklyn 92,491
76 Park Slope 3,141,054 $95,654 Brooklyn 68,891
77 Clinton Hill (North) 3,131,067 $44,688 Brooklyn 43,002
78 Melrose/Mott Haven 3,111,160 $26,754 Bronx 47,069
79 Longwood (North) 3,098,160 $24,461 Bronx 47,977
80 Bayside 3,088,406 $75,335 Queens 30,597
81 Rego Park 3,085,494 $52,532 Queens 42,297
82 Ditmars Steinway 3,076,774 $57,525 Queens 36,190
83 Harlem (North-‐East) 3,073,253 $33,595 Manhattan 26,577
84 Woodhaven 3,058,310 $60,897 Queens 42,588
85 Borough Park 3,055,478 $34,316 Brooklyn 96,971
86 Kensington 3,042,770 $52,445 Brooklyn 74,758
87 Brownsville 3,004,774 $28,348 Brooklyn 84,520
88 Ditmas Park 2,996,310 $40,734 Brooklyn 98,325
89 Laurelton 2,885,555 $78,667 Queens 40,385
90 Fort George 2,882,590 $42,721 Manhattan 44,825
Mobility, Economic Opportunity and NYC Neighborhoods 25
91 Bensonhurst 2,857,202 $45,472 Brooklyn 80,963
92 Bay Ridge 2,797,143 $58,261 Brooklyn 72,623
93 Glendale 2,781,184 $50,799 Queens 99,379
94 Corona 2,757,910 $45,964 Queens 107,962
95 Bedford Park 2,751,904 $33,776 Bronx 71,822
96 Ozone Park (South) 2,743,064 $62,086 Queens 31,004
97 Midwood (East)/ Flatlands (West) 2,733,215 $55,429 Brooklyn 65,302
98 Midwood 2,690,146 $42,170 Brooklyn 84,219
99 Morris Heights 2,679,898 $25,470 Bronx 79,793
100 Ozone Park (North) 2,655,404 $56,724 Queens 25,950
101 Morrisania 2,626,602 $23,452 Bronx 87,723
102 East New York (East) 2,618,906 $35,079 Brooklyn 93,107
103 Richmond Hill (South) 2,616,820 $56,735 Queens 49,193
104 Maspeth 2,571,530 $57,474 Queens 32,268
105 West Farms 2,569,311 $22,307 Bronx 56,084
106 Norwood 2,568,524 $36,048 Bronx 98,754
107 Soundview 2,469,395 $30,288 Bronx 68,898
108 Gravesend 2,459,471 $41,328 Brooklyn 74,606
109 Jackson Heights (North) 2,366,147 $52,500 Queens 37,244
110 Middle Village 2,354,409 $69,843 Queens 35,822
111 Jamaica Hills (North) 2,352,444 $50,450 Queens 61,687
112 Fordham (North) 2,311,184 $24,618 Bronx 74,859
113 Spuyten Duyvil/ Kingsbridge 2,257,140 $54,258 Bronx 70,420
114 Murray Hill (East) 2,249,339 $65,722 Queens 38,317
115 Dyker Heights 2,234,363 $61,893 Brooklyn 43,929
116 Douglaston 2,213,233 $90,799 Queens 7,354
117 Woodlawn 1,904,124 $58,600 Bronx 14,850
118 Hollis 1,900,012 $60,892 Queens 31,625
119 East Elmhurst 1,863,394 $53,617 Queens 40,761
120 Flushing (South) 1,846,198 $41,884 Queens 83,221
121 Williamsbridge/ Baychester 1,844,808 $57,776 Bronx 71,843
122 Kew Gardens Hills 1,793,059 $56,608 Queens 41,022

123 Hunts Point 1,748,490 $25,676 Bronx 12,519
124 Manhattan Beach 1,587,191 $41,639 Brooklyn 74,630
125 Rosedale 1,539,656 $84,824 Queens 33,280
126 Bath Beach 1,534,141 $43,398 Brooklyn 83,156
127 Canarsie 1,524,134 $61,061 Brooklyn 97,217
128 Flushing (Central) 1,521,194 $46,566 Queens 56,258
129 Whitestone 1,479,598 $71,978 Queens 40,872
130 East Flatbush 1,446,428 $48,400 Brooklyn 79,572
131 Jamaica Hills (South) 1,443,063 $42,887 Queens 32,821
132 College Point 1,285,768 $58,465 Queens 23,037
133 Sheepshead Bay 1,270,116 $51,725 Brooklyn 81,030
134 Fresh Meadows (South) 1,248,244 $71,350 Queens 13,499
135 South Ozone Park (West) 1,201,171 $59,832 Queens 48,449
136 South Ozone Park (East) 1,164,868 $62,114 Queens 17,636
137 Coney Island 1,120,071 $27,481 Brooklyn 42,535
138 Queens Village (North) 1,104,744 $69,330 Queens 20,307
139 Parkchester/ Van Nest 1,097,589 $45,864 Bronx 77,369
140 Fresh Meadows/ Utopia 1,066,412 $55,492 Queens 41,924
141 Arrochar/Shore Acres 1,062,189 $70,758 Staten Island 42,006
142 Hammels 1,033,867 $50,570 Queens 11,335
143 Stapleton/Clifton 977,862 $53,168 Staten Island 43,084
144 Morris Park 972,229 $52,347 Bronx 51,730
145 Oakland Gardens 920,930 $72,909 Queens 34,751
146 Bay Terrace 889,208 $76,183 Queens 19,865
147 Bellaire 865,057 $68,890 Queens 28,311
148 Bellerose/Floral Park 727,542 $82,301 Queens 19,575
149 Howard Beach 726,623 $66,790 Queens 28,094
150 Hollis Hills 726,295 $70,108 Queens 24,877
151 Riverdale/ Fieldston 713,734 $71,798 Bronx 22,030
152 St. Albans 713,520 $70,672 Queens 37,176
153 Glen Oaks 684,920 $81,709 Queens 14,500

Mobility, Economic Opportunity and NYC Neighborhoods 27
154 Springfield Gardens/Rochdale 629,016 $59,229 Queens 62,809
155 Arverne 569,033 $43,354 Queens 17,674
156 Cambria Heights 485,002 $83,099 Queens 18,722
157 Edenwald 468,871 $44,012 Bronx 70,609
158 Little Neck 468,367 $82,332 Queens 17,865
159 Clason Point 449,405 $35,866 Bronx 58,660
160 West Staten Island 377,103 $77,242 Staten Island 87,276
161 Far Rockaway 271,012 $39,409 Queens 61,091
162 Co-‐Op City 267,187 $43,629 Bronx 43,231
163 Belle Harbor 241,161 $76,944 Queens 21,725
164 Throggs Neck 233,590 $65,450 Bronx 44,862
165 Port Richmond 220,249 $61,925 Staten Island 25,227
166 Oakwood 201,473 $75,807 Staten Island 55,902
167 Flatlands 201,422 $68,431 Brooklyn 94,259
168 North Staten Island 181,994 $56,848 Staten Island 38,885
169 East New York (South) 180,235 $26,275 Brooklyn 12,879
170 Great Kills 180,062 $88,075 Staten Island 28,939
171 Elm Park 151,435 $56,841 Staten Island 16,811
172 City Island 100,000 $70,078 Bronx 4,248
173 Mariners Harbor 94,405 $51,537 Staten Island 24,537
174 Annadale/Arden Heights 63,657 $85,324 Staten Island 60,081
175 Tottenville 60,135 $86,457 Staten Island 14,829
176 South Staten Island 46,509 $86,297 Staten Island 32,646
177 Breezy Point 42,623 $87,636 Queens 4,223

DISCUSSION OF RANKINGS
Several factors are evident from the data:
Income and access are related at the top and bottom of the rankings. Specific neighborhoods exemplify a close relationship between access and economic
standing: Tribeca in Manhattan is ranked seventh in job access, and has the second-‐highest
median household income in the city ($210,125). Unemployment is at a low 5%, and 77% of
working residents commute either by public transportation or walking. The neighborhood
enjoys seamless access to job opportunities and reflects this factor in its high employment rates
and incomes.
The southern end of East New York, in the southeastern section of Brooklyn, has a
median income of $26,275, an unemployment rate of 14%, and a low job access rank
(169/177). The neighborhood’s major housing complex, Spring Creek Towers, sits 15 minutes by
bus from the nearest subway station. Residents of East New York lack ready access to job
opportunities for economic improvement due to expensive and time-‐intensive commutes.
However, the relationship between transit access and income is not always evident;
some neighborhoods within this study are outliers. These neighborhoods show above-‐average
incomes despite limited mass transit access. Tottenville (Staten Island), for example, is a small
neighborhood (population of 14,829) with very limited transit access (rank 175/177), a median
household income of $86,457 and a low unemployment rate of 6%. In Tottenville, most working
residents commute by private car (80%) and only 17% commute by public transportation. In
outlier neighborhoods like Tottenville, private cars give residents increased access to job
opportunities that would not be accessible via transit, explaining the higher than average
median income.
Another outlier is the Queens neighborhood of Briarwood-‐Jamaica Center, ranked at
number nine. The area is situated far from the Manhattan neighborhoods comprising the
remaining top ten ranked neighborhoods. However, the Jamaica transit hub is located within
this zip code, giving local residents express commutes to jobs in Manhattan, Long Island and as
Mobility, Economic Opportunity and NYC Neighborhoods 29
far as New Jersey. In addition, the area is situated adjacent to John F. Kennedy airport, which
employs 69,000 people. In Briarwood-‐Jamaica Center, 67% of residents commute by public
transit, taking advantage of relatively easy access to 4,119,763 jobs within one hour.
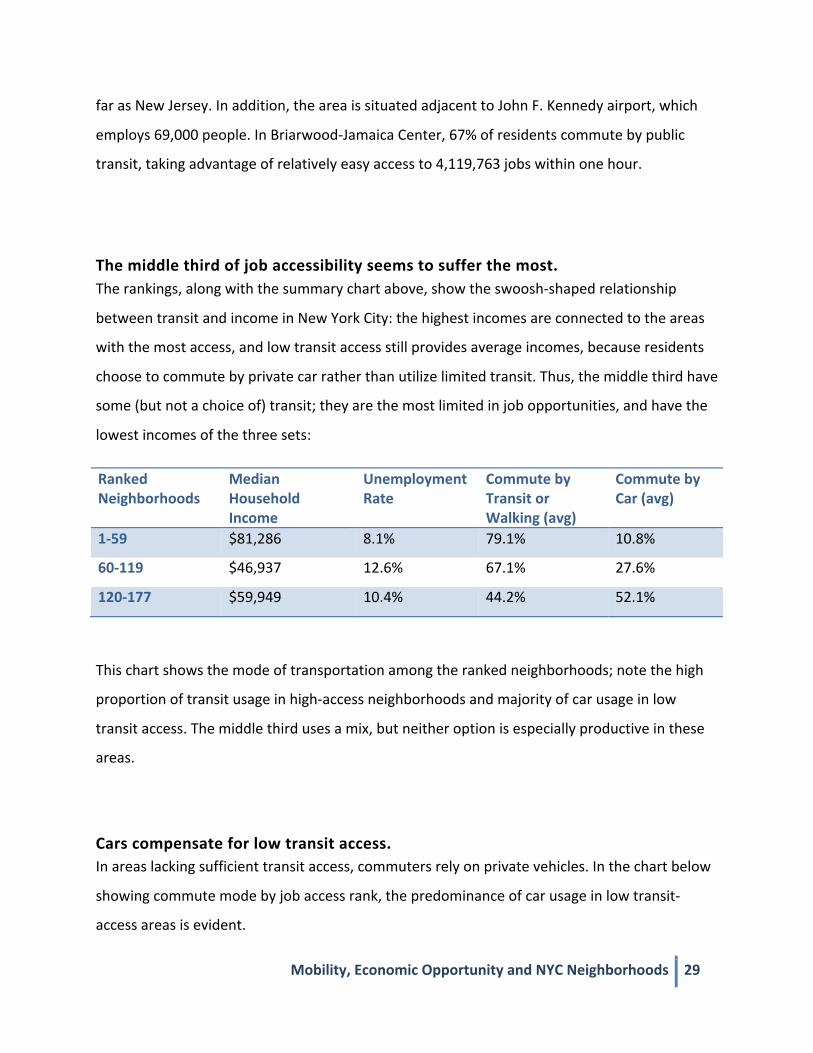
The middle third of job accessibility seems to suffer the most. The rankings, along with the summary chart above, show the swoosh-‐shaped relationship
between transit and income in New York City: the highest incomes are connected to the areas
with the most access, and low transit access still provides average incomes, because residents
choose to commute by private car rather than utilize limited transit. Thus, the middle third have
some (but not a choice of) transit; they are the most limited in job opportunities, and have the
lowest incomes of the three sets:
Ranked Neighborhoods
Median Household Income
Unemployment Rate
Commute by Transit or Walking (avg)
Commute by Car (avg)
1-‐59 $81,286 8.1% 79.1% 10.8%
60-‐119 $46,937 12.6% 67.1% 27.6%
120-‐177 $59,949 10.4% 44.2% 52.1%
This chart shows the mode of transportation among the ranked neighborhoods; note the high
proportion of transit usage in high-‐access neighborhoods and majority of car usage in low
transit access. The middle third uses a mix, but neither option is especially productive in these
areas.
Cars compensate for low transit access. In areas lacking sufficient transit access, commuters rely on private vehicles. In the chart below
showing commute mode by job access rank, the predominance of car usage in low transit-‐
access areas is evident.

Greater transit access also diversifies modes of commuting. In neighborhoods with dense
transit access, other commuting modes, including walking, cycling and telecommuting are also
prominent. This diversification of commute modes demonstrates the increased access to job
opportunities afforded in these areas through multiple means of access.
Mobility, Economic Opportunity and NYC Neighborhoods 31
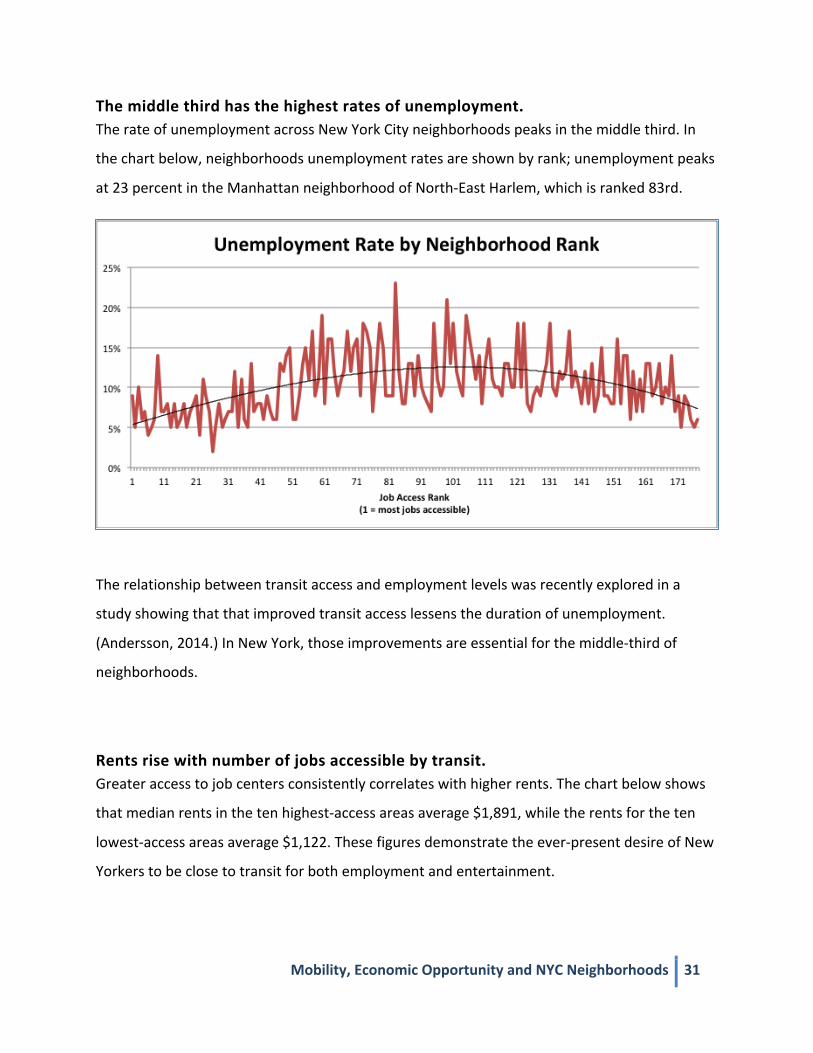
The middle third has the highest rates of unemployment. The rate of unemployment across New York City neighborhoods peaks in the middle third. In
the chart below, neighborhoods unemployment rates are shown by rank; unemployment peaks
at 23 percent in the Manhattan neighborhood of North-‐East Harlem, which is ranked 83rd.
The relationship between transit access and employment levels was recently explored in a
study showing that that improved transit access lessens the duration of unemployment.
(Andersson, 2014.) In New York, those improvements are essential for the middle-‐third of
neighborhoods.
Rents rise with number of jobs accessible by transit. Greater access to job centers consistently correlates with higher rents. The chart below shows
that median rents in the ten highest-‐access areas average $1,891, while the rents for the ten
lowest-‐access areas average $1,122. These figures demonstrate the ever-‐present desire of New
Yorkers to be close to transit for both employment and entertainment.
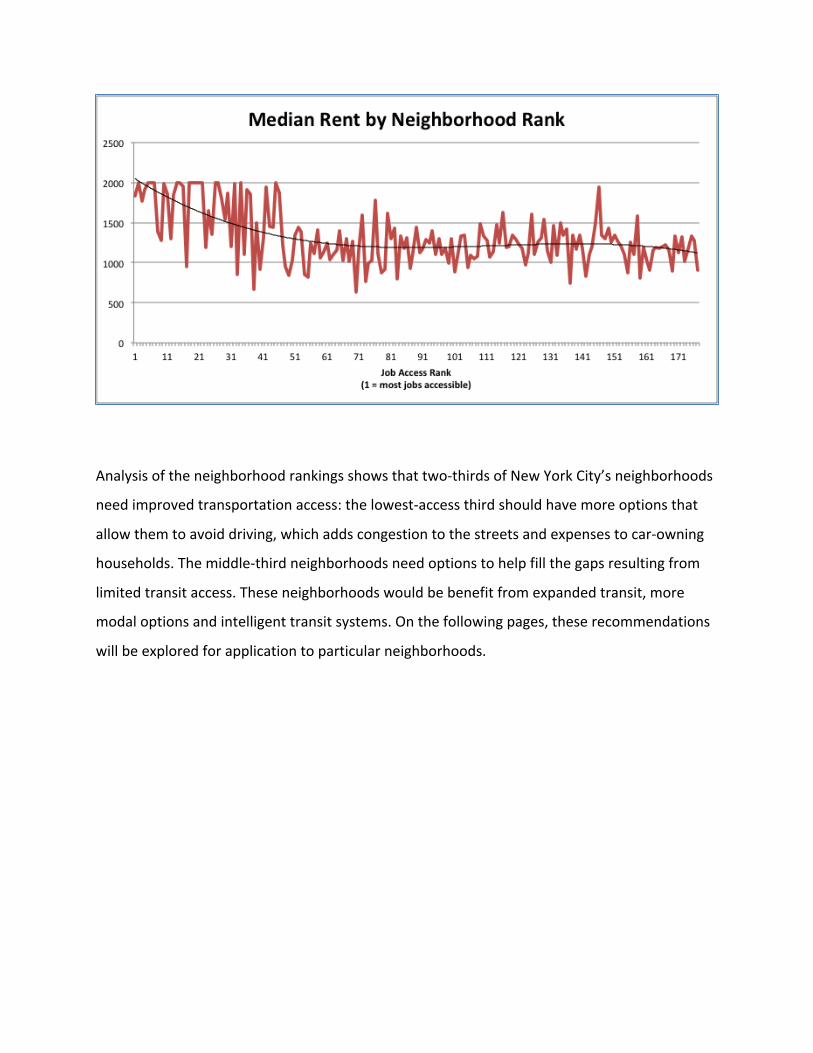
Analysis of the neighborhood rankings shows that two-‐thirds of New York City’s neighborhoods
need improved transportation access: the lowest-‐access third should have more options that
allow them to avoid driving, which adds congestion to the streets and expenses to car-‐owning
households. The middle-‐third neighborhoods need options to help fill the gaps resulting from
limited transit access. These neighborhoods would be benefit from expanded transit, more
modal options and intelligent transit systems. On the following pages, these recommendations
will be explored for application to particular neighborhoods.
Mobility, Economic Opportunity and NYC Neighborhoods 33
RECOMMENDATIONS To improve access to employment opportunities, the NYU Rudin Center recommends these
infrastructure and policy modifications:
Increase the number of transportation modal options across the city. New York City works best when residents have several options for their daily commutes and
can easily switch between transportation modes. This speaks to both the adaptability of New
Yorkers and the presence of subways, buses, taxis, sidewalks, cars and car shares, bikes and
bike share. However, many of these options are not available in concentration citywide; to
improve economic opportunity, New Yorkers need several modes regularly available.
Specifically:
Develop smart bus systems that transport clusters of New Yorkers from low-‐access
neighborhoods to transit hubs.
These dynamic, 12-‐passenger buses should be
summoned via smartphone or text message and be
able to accept multiple forms of payment: cash,
MetroCards, credit cards, and Apple and Google Pay.
These demand-‐responsive buses, which can augment
the existing transit and dollar van systems, will be
public-‐private partnerships. They may be operated by
systems like Bridj, which is already transporting
commuters through Boston.1 Bridj uses search and
social data to refine bus routes according to user needs,
and could serve as a valuable model for intelligent
transit in the future. In New York, the NYU Rudin Center recommends smart buses for these
neighborhoods in particular:
1 Seelye, Katharine Q. “To Lure Bostonians, New ‘Pop-‐Up’ Bus Service Learns Riders’ Rhythms,” The New York Times, June 4, 2014.
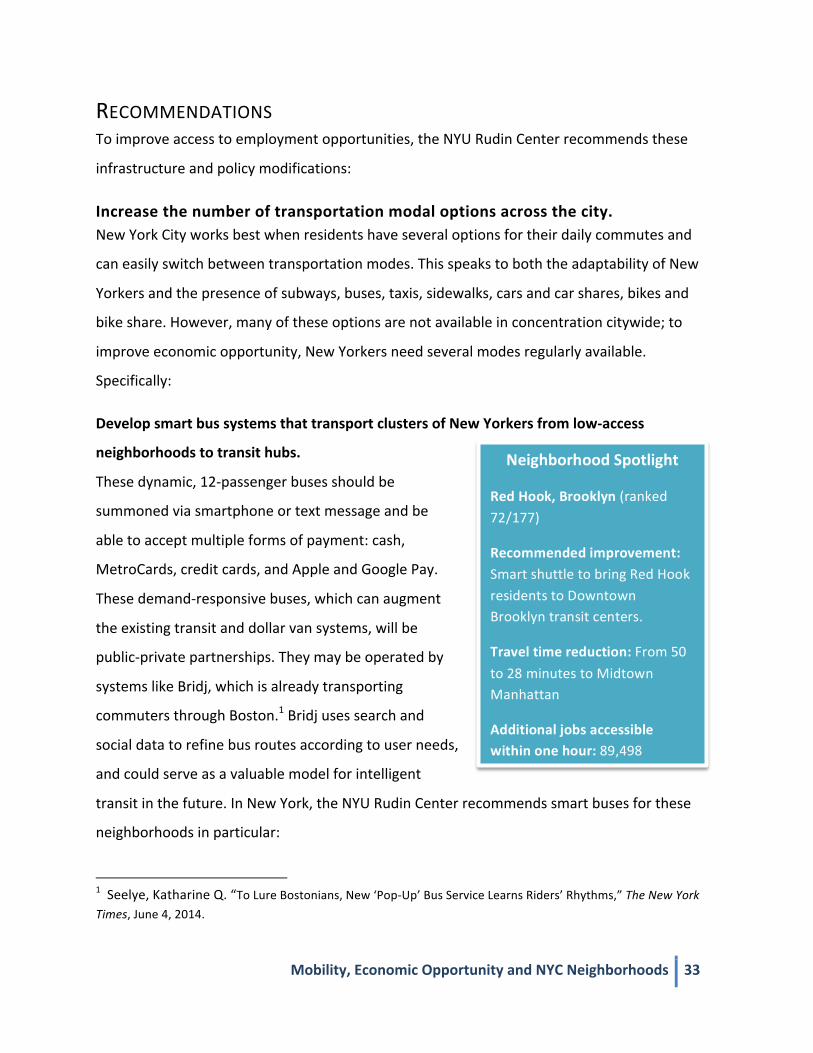
Neighborhood Spotlight
Red Hook, Brooklyn (ranked 72/177)
Recommended improvement: Smart shuttle to bring Red Hook residents to Downtown Brooklyn transit centers.
Travel time reduction: From 50 to 28 minutes to Midtown Manhattan
Additional jobs accessible within one hour: 89,498

• From Red Hook and Bay Ridge in Brooklyn to the Downtown Brooklyn transit hubs
• Whitestone and Maspeth in Queens and Throggs Neck in the Bronx to East Midtown Manhattan
• Hunts Point in the Bronx to transit connections at 149th Street and Grand Concourse
Smart buses will carry commuters to transit quickly, which will reduce their travel time to job
centers. This new mode will also help them avoid driving, which will mitigate congestion on city
roadways and reduce household expenses. New York City should nurture development of these
alternate modes of transportation by allowing and encouraging them to operate in low-‐transit
areas.
Expand vehicle-‐share options, including car and bike shares.
With access to vehicles when New Yorkers need them, transportation around the city will be
vastly improved. Resources like Car2Go can transport residents from low-‐transit areas to
transit-‐dense locations with the convenience of car travel, without contributing to congestion
in central business districts. Citi Bike share and related bicycle infrastructure also improves
transportation options while providing an active transport mode. These sharing modes are
becoming essential segments in New York’s transportation landscape, and their expansion
should be encouraged for reduced congestion,
increased health, and increased access to employment.
Build Bus Rapid Transit in key corridors.
New York City’s Select Bus Service, its variation on Bus
Rapid Transit, has been markedly successful in its
current buildouts. However, a true Bus Rapid Transit
system – with exclusive lanes, pre-‐boarding fare
payment and traffic signal priority – should be built out
Neighborhood Spotlight
East New York (South), Brooklyn (ranked 169/177)
Recommended improvement: Incorporate the BM5 bus, which currently runs from Spring Creek Towers to Manhattan, into a Bus Rapid Transit route along Woodhaven Blvd.
Travel time reduction: From 48 to 36 minutes to Midtown Manhattan
Additional jobs accessible within one hour: 1,328,088

Mobility, Economic Opportunity and NYC Neighborhoods 35
in key locations, including Flatlands Avenue: A BRT corridor should start at Spring Creek Towers,
follow Flatlands Avenue across the lower midsection of Brooklyn, stop at the hospital cluster on
8th Avenue and 62nd Street, and end at Industry City in Sunset Park. This route will connect
riders with the B, D, F, L, N, Q and R trains, and jobs throughout Brooklyn’s growing health care
industry and burgeoning Sunset Park innovation hub. This route, along the B82 line, is currently
being planned, and should be implemented considering riders’ concerns about on-‐time
performance.2
Support informal transportation networks.
Many New York City commuters rely on “unofficial” transportation networks. Dollar vans, which
carry up to 120,000 passengers every day, fill in transit gaps throughout Brooklyn and Queens,
often with 45-‐60 vans an hour running through corridors where buses only pass through four
times an hour.3 More formalized non-‐public transportation systems also support large numbers
of riders: for example, the Senior Citizen Transportation Program at Coney Island’s Jewish
Community Center, provides 5,400 riders free trips throughout Brooklyn annually.4 This JCC
transportation resource is sponsored by the Federal Transit Administration, New York State
Department of Transportation, and New York City Departments of the Aging and Youth and
Community Development. However, both the JCC program and the dollar vans are not affiliated
officially, or integrated fully, with the New York City transportation landscape. Policymakers
should work to integrate these services with existing resources to ensure transportation access
across the city through both formal and informal mechanisms.
2 South Brooklyn SBS Feedback Portal. http://nycdotfeedbackportals.nyc/south-‐brooklyn-‐sbs/south-‐brooklyn-‐sbs-‐project-‐area 3 Margonelli, Lisa. “The (Illegal) Private Bus System That Works,” The Atlantic, October 5, 2011. 4 Jewish Community Council of Greater Coney Island: Senior Transportation. Accessed November 12, 2014. http://www.jccgci.org/services/senior-‐services/senior-‐transportation/

More modes will increase the likelihood that New Yorkers can reach their jobs on time, will
alleviate congestion, and increase the number of jobs accessible from residences.
Encourage remote work.
Many information-‐based jobs can now be conducted anywhere, and can and should be more
evenly distributed across New York City. If policymakers incentivize distributing the workforce
(to places like neighborhood libraries and co-‐working spaces), employees will reach their places
of work more easily, the productive workday will be expanded without the hassle of
commuting, and workers in more isolated locations will have access to more job opportunities.
Approximately four percent of New Yorkers work from home; that number is as high as 10
percent in the West Village and the Upper West Side, despite those neighborhoods’ dense
transportation access. Because New York City will soon have citywide free wi-‐fi, working
remotely will now be even simpler.5 These employees are reducing congestion on transit and in
traffic, and can work as needs arise, rather than during traditional business hours, which are
becoming increasingly irrelevant. Working remotely will be beneficial to employees, employers,
and New York’s transportation system.
Maximize the existing system. Although New York’s landscape makes it extremely difficult to build new infrastructure, the
Metropolitan Transportation Authority should seek to improve upon existing resources:
Revitalize unused tracks and build essential transfers.
• Revitalize express service on the #5 track between 180th Streets and Nereid Avenue in
the Bronx using dormant tracks and platforms. This express capacity, which
5 Engel, Evan. “NYC announces free city-‐wide Wi-‐Fi with next-‐gen pay phones,” Mashable.com. November 17, 2014.

Mobility, Economic Opportunity and NYC Neighborhoods 37
complements #2 train service, has been discontinued, but should be re-‐opened to
shorten commutes between the Bronx and Manhattan.
• Opening key transfer points to walking transfers will help lower-‐income New Yorkers
maximize their use of the subway system. These out-‐of-‐system transfers, often to
subway entrances two blocks away, are free to residents with unlimited MetroCards,
but require a new payment from pay-‐per-‐ride users. Because lower-‐income New Yorkers
are unlikely to purchase unlimited cards, they are unable to take advantage of the
system’s discounts. This policy decision severely limits lower-‐income New Yorkers’ use
of the subway system, elongating trips and challenging these riders. Building a free
transfer in South Williamsburg between the G and J/M trains at Broadway and Lorimer
will help the 2,000 riders who use this transfer every day6, including many from East
New York, an area already lacking rapid transit
service.
These adjustments should be included in the MTA’s next
capital plan to improve the system incrementally for
thousands of New Yorkers.
Expand CityTicket to make commuter railroads more inclusive.
The CityTicket, which allows riders to take Metro-‐North
and Long Island Rail Roads within New York City at a
reduced rate, is currently limited to weekends. While the
railroads operate at maximum capacity during rush
hours, they should be available to city residents off-‐peak
on weekdays. This option would allow city residents in
6 “Review of the G Line,” MTA New York City Transit. July 10, 2013. http://web.mta.info/nyct/service/G_LineReview_7_10_13.pdf
Neighborhood Spotlight
Norwood, Bronx (ranked 106/177)
Recommended improvement: Expand the CityTicket to weekdays, allowing NYC residents to ride commuter rail at a discount; Norwood residents would board Metro-‐North at the Williams Bridge Station.
Travel time reduction: From 48 to 33 minutes to Midtown Manhattan (versus subway alone)
Additional jobs accessible within one hour: 527,819
subway-‐sparse areas to ride the railroads to their workplaces often in half the time, giving them
access to more job opportunities and maximizing revenue on in-‐service trains.
Rapidly expand wireless access on subways.
As subway stations are lit with wireless access for customer use, pairing Transit Wireless’ work
with ongoing track work should accelerate the program. With internet and mobile phone
service in more subway stations, commutes will become more productive, and subway agents
will become more informed about the system’s status.
Mobility, Economic Opportunity and NYC Neighborhoods 39
CONCLUSION It is evident that the varied levels of transit access across New York affect residents’
employment levels, travel modes and incomes. Reduced transit access is correlated with higher
rates of unemployment, and low transit access typically causes residents to drive to work in
privately-‐owned vehicles. These imbalances perpetuate issues of income inequality and traffic
congestion, limiting both economic and physical mobility for many in the city.
By improving transportation access across New York City, policymakers can help to
improve the standing of those residents with insufficient modes to reach significant numbers of
job opportunities. More job opportunities will lead to greater upward economic mobility.
To improve citywide transportation access, the NYU Rudin Center recommends:
New York City policymakers must increase the number of transportation modes
available to residents across the city. This includes championing the development of new
modes, such as intelligent bus systems; incentivizing expansion of emerging modes, including
vehicle and bike shares; working toward the buildout of existing modes, including Bus Rapid
Transit; and supporting the functions of informal transportation networks like dollar-‐vans.
Transportation infrastructure is unwieldy to build, so New York City policymakers must
maximize use of the existing transportation landscape: unused infrastructure should be
revitalized, policies should encourage use of all modes, and wireless access should be rapidly
deployed throughout the subway system to make commute times more productive. By
improving existing transportation resources and expanding them citywide, all New Yorkers will
benefit from increased access to job opportunities and thus from greater economic mobility.