mobilizing ecologies: participation and intermodality to build coalitions pro-sustainable transport...
TRANSCRIPT

Mobilizing ecologies: Participation and Intermodality to Build Coalitions Pro-
Sustainable Transport & BRTALC Center for BRT Excellence
Dr. Lake Sagaris 12 January 2016
Post-Doctoral Fellow and Adjunct ProfessorBus Rapid Transit Centre of Excellence
Centro de Desarrollo Urbano SustentableFacultad de Ingeniería - Pontificia Universidad Católica de Chile
http://www.brt.cl/http://cedeus.cl/

Itinerary
1. Methods & definitions: Rethinking social sustainability and transport
2. Ecologies of Modes3. Ecologies of Actors4. Final reflections
Prueba de parrilla para bicis, Santiago, Buses Vule, 21-VIII-2015

1. Rethinking social sustainability and transport

In a context of urgency…social sustainability
Global warming, but also
Health (obesity, happiness, clean air and water, freedom from noise)
Inclusion, Access, Equity (political, social and economic rights)
Complex governance systems and barriers to change

Central dilemma: How to change?
The very old saying ‘you can take a horse to water but you can’t make it drink’ must have been coined by people at the sharp end of sustainable transport. Globally we are drowning in excellent material. [We know plenty about] how to produce huge gains for quality of life, health, community, air quality, poverty and accessibility, reduce death and injury on the roads and create lively, viable communities. All these topics have been covered in detail in our last 20 years. The reality is we are just not doing it. John Whitelegg, editorial, World Transport Policy & Practice (2014)
We know a lot, but we’re not achieving enough…

Start from new positionality: outside the transport system,
looking in from the city

Redefining the QUESTION: not (only) how to move more people better, but…
How to make them healthier, happier, more active, more equal
Guarantee equal access to political, social and economic rights
Contribute to resilience (ability to recover from threats and disasters) and sustainability (social, economic and environmental)

Not only work-related, but other kinds of trip purpose
Not only “average” (male) user, but the outliers, girls and women, from 8-80 years
Diverse modes, each with own “niche”, a combination of purpose, capacity, price, and distance
Planning shift 1: not for averages but for “outliers”, those most vulnerable, least served

Planning shift 2: Backcasting for sustainability
Rather than projecting past trends into the future, establishes specific targets and then works towards them, usually within a scenario development approach
Better understanding of how people can shape more or less desirable futures (Hickman and Banister 2014, pp. 79-83).
Examples Visioning and Backcasting for Transport, VIBAT, Canada, India, the UK, Australia and China.
Planning for targets can help build “trend-break futures” (Hickman and Banister 2014, p. 81).

Roads as social spaces

Inequalities and transport: on the road
Modal distribution, some cities (%)
CityWalk/Cycle/Public Transport
Car
Beijing* 95 5
Havana* 84 6
Hong Kong 84 16
Santiago (Chile) 65 22
Buenos Aires* 69 24
Amsterdam 67 34
Sao Paulo 66 34
New York 62 32
Delhi 57 29
Copenhagen 51 49
London (UK) 50 50
Toronto 42 58
Chicago 12 88
Although walking, cycling and public transport are majority modes, cars
use 90% or more of road space, producing noise, air and water
pollution, premature deaths and terrible illnesses.
Santiago modal share
Bicycle: 4% (2012), +today Walking: 35%
Public transport: 26% Private (motorized): 26%
Fuente: http://www.sectra.gob.cl/Indicadores_de_Movilidad/Indicadores/viajes_modo.html (27-III-2013)
Inequality on roads and sidewalks

Number 1 killer of children and youth (Comisión Nacional de Seguridad de Tránsito)

vs. Roads as multi-purpose, nourishing
socially essential, public and civic places

“Livable” StreetsAppleyard, San Francisco, 1970,1981
Mientras menos automóviles pasan por tu calle, más personas conocerás, más relaciones sociales tendrás, más lugares para
jugar, interactuar, ser feliz...

the street as public space
Streets
% of urban territory
“Developed”
New York, 22%
London, 23%
Tokyo, 24%
Paris, 25%.
“Developing”
Shanghai, 7.5%
Bangkok, 11.4%
Delhi, 21%
Sao Paulo, 21%.
(Vasconcellos, 2001)
Green space Optimo:
40 m2/capita
Mínimo internacional (WHO): 9m2/cap.
Berlín: 60.0 m2/cap. Curitiba: 51.0 m2/cap. Córdoba: 9.6 m2/cap. Madrid:7.0 m2/cap.
Santiago: 3.2 m2/cap. Sao Paulo: 2.7 m2/cap.

Livability (creativity, income, environmental services)
Art Recycling Service

2. An ecology of modes

“Intermodality”
Multimodality: The presence of different transport modes, usually with little or no coordination among them.
Intermodality: The seamless integration of diverse motorised and active transport systems that are socially, environmentally and economically sustainable - as a response to human diversity and needs. “Integration” refers to social inclusion, physical information and fares, and considers hubs and links as strategic points.

Forms of bike-bus integrationMain Measures Examples
Strong information and promotion / behaviour change, usually combined agency and civil society effort.
1 Bike parking at train and bus stops Bogotá, Munich, Amsterdam
2 Bike racks on buses Mainly North American cities3 Bikes on rail cars Common in Europe, off-peak US4 Bike rentals The Netherlands, tourism
5 Public bike systems Netherlands, Germany, Copenhagen
6 Bikesharing, some fare-integration Paris, Santiago, Barcelona, etc.
7 Bike routes connecting to public transport stations/stops
Netherlands, Germany, Denmark
9 Shared bus-bike-tram lanes France, Belgium, Germany, UK10 Cycle Taxis/Rickshaws/Smartphoneapp India
Source: Godefrooij et al., 2009; Pucher and Buehler 2012; observations in diverse cities; presentations Velo-City conferences (2012 Vancouver, 2015 Nantes).

+ Medium trips (5-15 km), BRT-Metro
Distance, density and trip purpose
0 km 10-15 km5 km
Many people /m2
Few people /
m2
More people /
m2
Low density, long distances, Private car
Medium and high densities + short trips (0-10 km), walking and cycling (bicitaxis, bikeshare, tricycles)
central
outskirts/ruralKEYWalk
Cycle
Public transport
Car

Relocate daily services within walking and cycling distances
CYCLE-BUS-METRO: University, work, main needs, higher density
WALK-CYCLE: School, corner store, urban
orchards, primary health, cycle-share (not only
bikes).
CARS-CARSHARE-AUTO-RICKSHAW: longer, lower density trips, (peri-urban,
rural)
50%?
40%?
10%?
IN 2012 Walk (35%); + Cycles (4%) = 39%Bus-Metro 26%Car 26% % Trips 90%
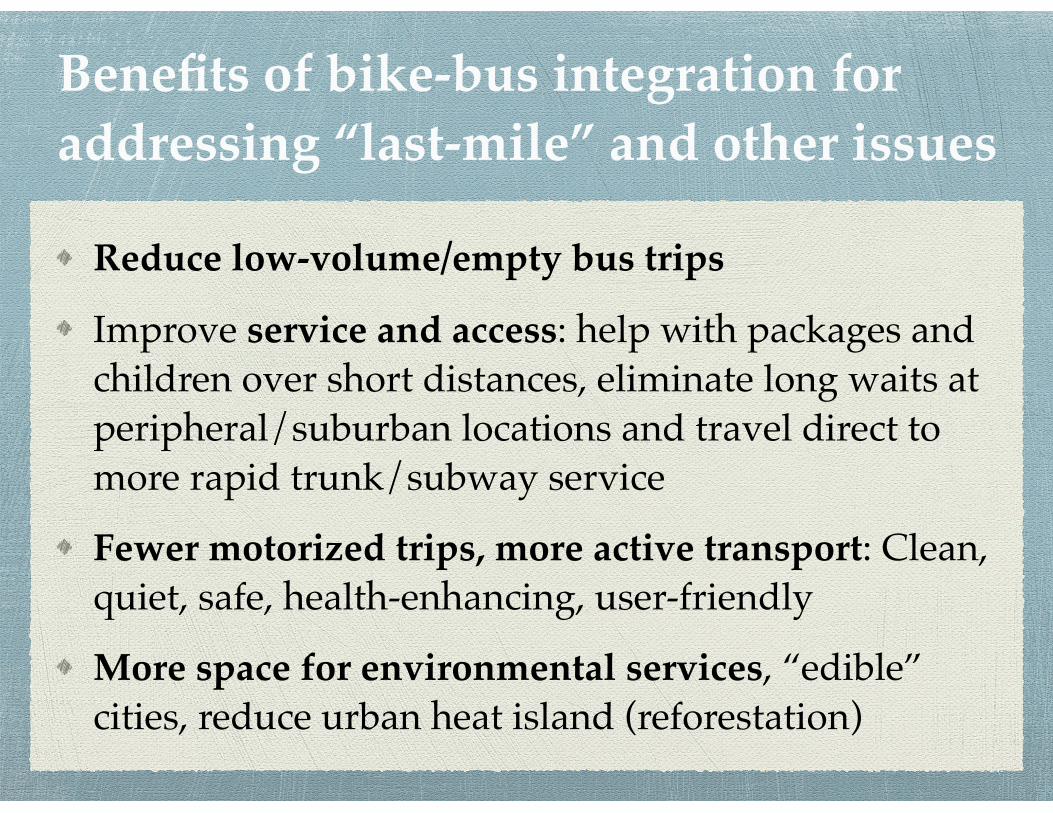
Benefits of bike-bus integration for addressing “last-mile” and other issues
Reduce low-volume/empty bus trips
Improve service and access: help with packages and children over short distances, eliminate long waits at peripheral/suburban locations and travel direct to more rapid trunk/subway service
Fewer motorized trips, more active transport: Clean, quiet, safe, health-enhancing, user-friendly
More space for environmental services, “edible” cities, reduce urban heat island (reforestation)

Implications
Planning to meet evidence-based targets relevant for public education, deliberative participation, and other debates that can move sustainable planning forward

Potential modal shift targets: % of trips
Well over half and up to 75% of car trips in the Bay area (above) and
Metro Santiago (below) more
suited to walking and
cycling
For Peer Review
16
FIGURE 1. Total number of automobile trips in the Bay Area (top) and Santiago (bottom) suitable for mode shifting based on distance thresholds.
FIGURE 2. Proportion of automobile trips in the Bay Area (top) and Santiago (bottom) suitable for mode shifting based on distance thresholds.
Page 16 of 24
http://mc.manuscriptcentral.com/jper
Journal of Planning Education and Research
123456789101112131415161718192021222324252627282930313233343536373839404142434445464748495051525354555657585960

Potential for modal shift targets
For Peer Review
17
TABLE 4. Mode shift targets in the San Francisco Bay Area and Santiago de Chile.
Share of trips (%) Current mode
share (%) < 2 km 2 – 8 km > 8 km Target modal share (2020)
San Francisco Bay Area Automobile 71.5 23.4 44.8 31.7 12.9 Walking 19.3 96.3 3.7 0.03 37.7 Bike 2.1 47.7 46.8 5.5 36.7 Public transit 6.0 16.0 39.8 44.2 12.9 Santiago Metropolitan Region Automobile 25.6 21.6 42.0 36.2 13.3 Walking 34.4 95.8 3.8 0.39 46.6 Bike 4.0 62.8 32.4 4.8 26.7 Public transit 29.4 8.9 39.3 51.7 13.3 Source: Data from California Department of Transportation (2013) and SECTRA and Universidad Alberto Hurtado (2014). Estimates of potential for modal shift described in text.
As Table 4 indicates, both cities show substantial potential for shifting modal share according
to distance. The relative similarity of both the existing distribution of trips and the mode share
targets was unexpected. Clearly, however, the distance between the current situation and the goal
is much larger for the Bay Area, meaning that efforts to engender sustainable transport will be
much more difficult in developed contexts. These are not absolute figures, but they do give a
sense of the magnitude of the possible shift, and therefore the potential benefits from backcasting
to this target. It would be absurd to argue or worse try to enforce a policy arbitrarily requiring all
trips of a specific length to be realized using a specific mode. On the other hand, the analysis
points to the substantial potential for strategies relating to behavioral change, economic
incentives, land use, and the built environment applied in the context of collaborative planning
approaches, to achieve these shifts. We discuss these possibilities in the concluding section.
5.0 IMPLICATIONS FOR PLANNING: ENGAGEMENT, DISTRIBUTION OF ROADSPACE, LOCATION AND LAND USE Crucial issues of intermodality and integration come to the fore when sustainable transport is
analyzed from a social, as well as an economic and environmental perspective. The analysis of
travel data for the Bay Area and Santiago metropolitan regions presented here indicates that for
Page 17 of 24
http://mc.manuscriptcentral.com/jper
Journal of Planning Education and Research
123456789101112131415161718192021222324252627282930313233343536373839404142434445464748495051525354555657585960

Eg. Can nourish planning debates and decisions with simple, easily understood evidence
Public interest in solutions to congestion can consider that almost half of car trips (Santiago) are under 5 km, rethink distribution of road space.
Walkability/cycle-inclusion strategies are health, small business, and transport opportunities
Meeting the “first/last km” challenge for public transport: With diverse bicycle/tricycle/electric-assisted combinations highly efficient, sustainable in all 3 dimensions.

Implications for equity & sustainability
Comfortable, cheap Walk-Bike-Public Transport integration is essential to car-free lifestyle, which is most sustainable

Governance & spatial planning
Regional transport authorities planning inter modally (eg. Transport for London), in charge of sidewalks, key roads, cycling, bus, train and other transport facilities
Shift from planning car-free streets to car-free, walking-cycling priority areas (3x3 km, 5x5 km, 8x8 km) linked by public transport?

3. An ecology of actors

Based on success in
cycle inclusionSantiago RM, 2006-2012
Cycling modal share doubledImage went from obsolete and
poor to trendy and “in”Cyclepaths quadrupled
Women’s share upCyclists rising 20-25% main paths

Planning and participation today
Today, what little citizen participation there is in transport usually occurs at the project level, and is often too little, too late
We don’t pay enough attention to participation at the planning level: the process to define the consensuses necessary to get the most out of public transport

In the planning system
Different views from different disciplines

Linear view of change
Citizens with good ideas
Technical staff
PoliticiansChange (laws, regulations,
procedures, policies, programs, projects)
Implem
entation
Technical staffX

Nacional
Regional
Local
Regional


The importance of civil society (organized citizens)

And the kind of “participation”Susskind et al. 1983.
Conflicto Paternalismo Coproducción

Paternalism: Predominant today (in Chile) . It is sterile.
Delivers informationControlsImposes
Power¡Yes!
Citizens

Conflict: opens doors (opportunity)
Individual and collective learning and development
Capacity for change
Builds autonomous active citizens
Power
¡No!Citizens
Coordinadora No a la Costanera Norte, movimientos de Aisén, Freirina, movimiento estudiantil, otros.

More fruitful:
Co-produce, collaborate
Power
DeliberationDiversityInterdependence (Booher & Innes 2002)
I understand
Builds strategic convictionSystemic changeCredibility and continuity
Mesa Ciudadanía - Gobierno para el Plan de Ciclo Rutas del Bicentenario
(2007-2010), con asesoría holandesa.

Nested scales: Personal, social, political
Changes the individualChanges the groupInfluences the communityInteractions at global and national scalesThe world in the local

Understand we are an “ecology” of actors
Diverse
Interdependent
With different profiles, leaderships, strategies and organizations, and some common objectives

4. Final reflections

A diverse, complex, robust ecology of citizen organizations is vital to shifting toward sustainability
How robust is our ecology of citizens for BRT and public transport?

Urban measures •US$48 million fund for cycling infrastructure
• Training in traffic calming and other diverse measures
• Training in quality infrastructure, standards
•Vision beyond cycle pathsCycling
economy • More bikes for women,
cargo, packaging, etc. • Better trained consultants for
design and planning •Studies tendered for
bikeshare
Behavioural change
•Training in civil society and participatory methods
• Design, testing and ongoing realization of women’s cycling school •More diverse media presence
•Links with culture, gender, recyclers, and other
Moving beyond lists of competing measures…

Urban measures
Cycling economy
Behavioural change
To focus on the crucial balance between systemic elements

Government: regional & local
Private sector
Civil Society
And actors

A century of car-centred planning
Economy deeply linked with banks, tourism,
manufacturing, etc.
Billions in advertising and associated behavioural
modification efforts
Automobility and increasingly cycle-inclusion…
All work together very effectively

Urban measures: some
segregated busways, few complete grids
(none?)
Economy (new jobs, direct and
indirect) ???
Customer “information”,
few efforts to excite, seduce, attract, win
hearts
BRT


Policy implications: for more sustainable transport we need to
Partner with cyclists, walkers and other sustainable transport users
Build powerful alliances with health, environmental and social justice actors
Build robust civil society ecologies
Consider complementary modes and diverse business models

Implications for research
We need to know more about social sustainability, especially the politics of sustainability and social justice, as they relate to cities and “transport-sheds”
We should complement models using simple causality models with complex causality approaches
We need to take civil society organization and participatory theory and practice more seriously.
We need more attention to real-life experiments in the living laboratories of our own cities-regions
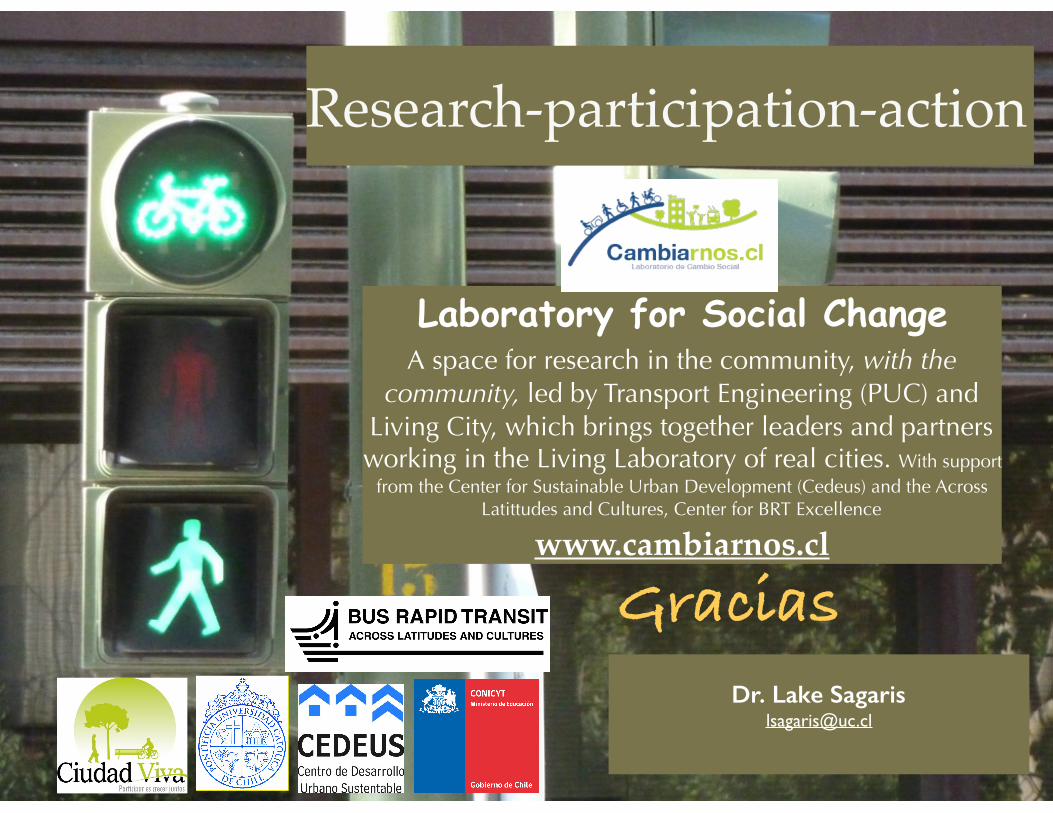
Laboratory for Social Change A space for research in the community, with the
community, led by Transport Engineering (PUC) and Living City, which brings together leaders and partners working in the Living Laboratory of real cities. With support
from the Center for Sustainable Urban Development (Cedeus) and the Across Latittudes and Cultures, Center for BRT Excellence
www.cambiarnos.cl
Gracias
Research-participation-action
Dr. Lake Sagaris [email protected]