mode of dye loading affects staining outcomes of fluorescent dyes in astrocytes exposed to...
TRANSCRIPT

C A R B O N 4 8 ( 2 0 1 0 ) 7 3 0 – 7 4 3
. sc iencedi rec t .com
avai lab le at wwwjournal homepage: www.elsev ier .com/ locate /carbon
Mode of dye loading affects staining outcomes of fluorescentdyes in astrocytes exposed to multiwalled carbon nanotubes
Xiao Chen a,*, Hermann J. Schluesener b
a School of Pharmacy, Tongji Medical College, Huazhong University of Science and Technology, Hangkong Road 13, 430030 Wuhan, Chinab Institute of Brain Research, University of Tuebingen, Calwerstraße 3, 72076 Tuebingen, Germany
A R T I C L E I N F O
Article history:
Received 19 May 2009
Accepted 12 October 2009
Available online 17 October 2009
0008-6223/$ - see front matter � 2009 Elsevidoi:10.1016/j.carbon.2009.10.020
* Corresponding author: Fax: +49 7071 29 484E-mail address: [email protected] (
A B S T R A C T
The effects of multiwalled carbon nanotubes (MWCNTs) and fullerene C60 (C60) on staining
of rat astrocytes by 5,5 0,6,6 0-tetrachloro-1,1 0,3,3 0-tetraethylbenzimidazolcarbocyanine
iodide (JC-1), 3,3 0-dihexyloxacarbocyanine, iodide (DiOC6(3)), rhodamine 123 (Rho 123)
and fluorescein diacetate (FDA) were investigated. Probe indications were characterized
and probe staining performed both in an ‘‘in situ’’ and ‘‘ex situ’’ manner on MWCNTs- or
C60-exposed cells were analyzed by flow cytometry. JC-1 and DiOC6(3) staining were found
good indicators of mitochondrial membrane potential (DWm). While DWm contributed to
Rho 123 uptake, intracellular accumulation of Rho 123 was largely determined by the func-
tion of P-glycoprotein, a cell membrane bound efflux protein. Multidrug-resistance associ-
ated protein, another efflux protein, was found to determine cellular FDA staining.
Decreased JC-1 and DiOC6(3) uptake were observed in MWCNTs-exposed cells but could
not be attributed to DWm disruption. In contrast, cellular staining of Rho 123 and FDA
was enhanced after MWCNT exposure. Mode of dye loading was found to significantly
affect the outcome of cellular dye staining after MWCNT exposure. Compared with
MWCNTs, C60 generally exerted insignificant influence on the staining of all probes. The
possible reasons for these findings and their implications are discussed.
� 2009 Elsevier Ltd. All rights reserved.
1. Introduction
Carbon based nanomaterials, due to their unique physical–
chemical and biological properties are now believed to hold
great promise for novel applications in the biomedical arena.
Among the various carbon based nanomaterials, carbon
nanotubes (CNTs), including single-walled carbon nanotubes
(SWCNTs) and multiwalled carbon nanotubes (MWCNTs),
have shown enormous potential and attracted most atten-
tion. Neuroscience is a field where the potential of CNTs is
most extensively explored and CNTs–neuron interaction is a
particular hot spot of interest. CNTs have been shown to be
a favorable substrate for neuronal growth, differentiation
and long term survival [1–3]. It has also been demonstrated
er Ltd. All rights reserved
6.X. Chen).
that CNTs could modulate electrical behavior of neurons in
culture [4,5]. Thus, CNTs are considered promising candidates
for development of novel neural prostheses to treat CNS trau-
matic injury and diseases like Parkinson’s disease. Recently,
they were also proposed as novel carriers of drugs for central
nervous system (CNS) disease and for cancer therapy [6–8].
Compared to the keen interest that CNTs–neuronal interac-
tion has received, far less attention has so far been given to
other components of the CNS. Astrocytes, or astroglial cells,
are a dominant component of the glial cell family that pro-
vides structural support for the CNS and outnumber neurons
by about 10-fold in the human brain. Astrocytes are now
widely recognized as highly active components of the CNS.
Besides providing structural and metabolic support for
.
C A R B O N 4 8 ( 2 0 1 0 ) 7 3 0 – 7 4 3 731
neurons, astrocytes perform such functions as helping to
maintain the blood brain barrier, modulating synapse produc-
tion and synaptic transmission and regulating transmitter
uptake and release, to name a few [9,10]. They also play
instrumental roles in cerebral innate immunity, regulation
of neural stem cells and CNS repair post injury [11–13]. If
CNTs were to be introduced into the CNS, the interactions be-
tween CNTs and astrocytes must be elucidated to ensure
safety. For this purpose, we investigated the effects of
MWCNT exposure on a rat astrocyte cell line.
Monitoring of cell viability is a regular but essential part of
work in any cell based study on nanomaterials’ biology. The
influence of MWCNTs on cell viability is the foremost ques-
tion to be answered before any further investigation. Use of
several regular dyes, like MTT (3-(4,5-dimethylthiazol-2-yl)-
2,5-diphenyltetrazolium bromide), resazurin and neutral red
to assess cell viability in the presence of CNTs has been doc-
umented. These methods assay cell viability by measuring
the amount of dye in cell lysate or culture medium and the is-
sue of interference due to extracellular CNTs–dye interaction
has been raised [14–16]. Fluorescent probe staining in combi-
nation with flow cytometry provides another assay which by
virtue of its working mechanism is able to detect changes
within a single cell and may avoid interference from outside.
In the present study, we used this approach to analyze astro-
cyte viability after MWCNT exposure. Mitochondrial mem-
brane potential (DWm) and cell membrane integrity are
important indicators of cell viability. DWm disturbance and
compromised cell membrane integrity are often reported con-
sequences of nanomaterial exposure [17,18]. Thus, we com-
pared the staining of three fluorescent probes in evaluation
of astrocyte DWm, including 5,5 0,6,6 0-tetrachloro-1,1 0,3,3 0-tet-
raethylbenzimidazolcarbocyanine iodide (JC-1), 3,30-dihexyl-
oxacarbocyanine, iodide (DiOC6(3)) and rhodamine 123 (Rho
123). Staining of fluorescein diacetate (FDA) and propidium io-
dide (PI) were used to assess cell membrane integrity. Probe
indications were first characterized using tool drugs. Probe
staining of MWCNTs-exposed cells was carried out both in
an ‘‘in situ’’ and ‘‘ex situ’’ manner. As a comparison with
MWCNTs, staining analysis using the same set of probes
was also performed on cells exposed to fullerene C60 (C60),
another carbon based nanomaterial. Striking differences in
staining outcomes were observed both between the two
staining modes and between the two carbon allotropes. The
possible reasons for these phenomena and their implications
were discussed.
2. Experimental
2.1. Chemicals and reagents
JC-1, DiOC6(3), Rho 123, FDA and PI were provided by Sigma–
Aldrich, USA. Probe stock solutions were prepared as follows
and stored at �20 �C: 2.5 mg/ml JC-1 in dimethyl sulfoxide
(DMSO), 0.1 mM DiOC6(3) in DMSO, 0.1 mM Rho 123 in meth-
anol, 1.5 mg/ml FDA in acetone and 1.0 mg/ml PI in Dulbecco’s
phosphate-buffered saline (DPBS). Loading solutions were
prepared by diluting stock with culture medium. Carbonyl
cyanide m-chlorophenylhydrazone (CCCP), a mitochondrial
uncoupling agent, was used to depolarize the mitochondrial
membrane. Valinomycin, a K+ ionophore was used in combi-
nation with potassium chloride to depolarize the plasma
membrane. Verapamil hydrochloride and indomethacin from
Sigma–Aldrich were used to block efflux of Rho 123 and fluo-
rescein. Roswell Park Memorial Institute (RPMI 1640) culture
medium with glutamine, with or without phenol red, DPBS,
0.05% trypsin–EDTA (ethylenediaminetetraacetic acid) solu-
tion, penicillin–streptomycin, fetal bovine serum (FBS) and
bovine serum albumin (BSA) were from Invitrogen Life Sci-
ence, USA. Mouse anti-Glial Fibrillary Acidic Protein (GFAP)
monoclonal antibody (MAB3402) was from CHEMICON Inter-
national, Inc., R-phycoerythrin (RPE) labeled rabbit polyclonal
F(ab 0)2 anti-mouse IgG, (STAR 12A) was from AbD SeroTec,
Inc., Accutase for detaching cells was provided by PAA Labo-
ratories GmbH, Germany. Other chemicals were all from Sig-
ma–Aldrich if not indicated otherwise.
2.2. Dispersion and characterization of MWCNTs and C60in suspension
MWCNTs were obtained from Sigma–Aldrich, USA. The
MWCNTs were manufactured through chemical vapor depo-
sition (CVD) followed by hydrochloride demineralization.
MWCNT density was �2.1 g/ml at 25 �C; purity was >99%
and the impurities were total metal. Particle dimensions were
the following: length 2.5–20 lm, diameter 6–13 nm, average
wall thickness 7–13 graphene layers, surface area �220 m2/g.
C60 (>99% purity) particles manufactured through an electric
arc process were provided by PlasmaChem GmbH, Berlin, Ger-
many. The main impurities was other fullerenes like C70.
Stock suspensions (1250 lg/ml) of MWCNTs and C60 were
prepared in RPMI 1640 culture medium without phenol red
supplemented by 5% fetal bovine serum. Sonication for
10 min using a Sonopuls HD 70 ultrasonic probe (Bandelin,
Berlin, Germany) at a setting of 40% power and 60% cycle
was performed to disperse MWCNTs and C60. Ice bath was
used to avoid overheating. MWCNTs and C60 in stock suspen-
sions were centrifuged, washed with distilled water and des-
iccated. Morphological characterization was then performed
by regular transmission electron microscopy (TEM) (Zeiss
EN10A) and scanning electron microscopy (SEM) (Zeiss
DSM962). For cell exposure experiments, the stock suspension
was serially diluted with culture medium to prepare working
suspensions of 62.5, 31.25, 15.6, 7.8 and 3.9 lg/ml. Stock and
working suspensions were stored at 4 �C. Working suspen-
sions were sonicated at a 50% power and 70% cycle setting
for 3 min and immediately used for cell exposure.
2.3. Culture and characterization of cell line Astro 1
Astro 1 cells, a rat astrocyte cell line, were grown in a 162 cm2
cell culture flask (Corning Inc., NY, USA) at 37 �C in a humid-
ified environment of 5% CO2. Once 80–90% confluence was
reached, cells were detached by trypsin–EDTA either for sub-
sequent experiments or cell passaging. Cells grown in 12-well
plates (Corning Inc., NY, USA) were used in all nanomaterial
exposure and probe staining experiments. Immunofluores-
cent staining of GFAP, a cytoskeleton protein specific to glial
cells, was performed for cytological identification of Astro 1

732 C A R B O N 4 8 ( 2 0 1 0 ) 7 3 0 – 7 4 3
cells. Briefly, Astro 1 cells grown on chamber slides were fixed
with 4% paraformaldehyde and permeabilized with 0.1% Tri-
ton X-100. Non-specific antibody binding sites were blocked
by 0.5% BSA in DPBS. Cells were then sequentially incubated
with 5 lg/ml mouse anti-GFAP monoclonal antibody and
RPE labeled rabbit polyclonal F(ab 0)2 anti-mouse IgG. Follow-
ing staining, cells were observed and photographed using a
fluorescent microscope (F-View Soft Imaging System BX 60,
OLYMPUS, Japan). Cytoplasmic distribution of GFAP fluores-
cence is shown in Fig. 1.
2.4. Cell staining of fluorescent probes andcharacterization of probe indications
2.4.1. Rho 123Rho 123 is a lipophilic cationic dye which, after entering the
cells probably through passive diffusion, accumulates in the
mitochondrial matrix in proportion to DWm [19]. Loss of mito-
chondrial integrity or opening of the permeability transition
pore channel results in leakage of the probe from mitochon-
dria and consequent decrease of fluorescence. Therefore, cel-
lular fluorescence of Rho 123 was frequently measured for
assessment of DWm. Besides DWm, nevertheless, in certain cell
types there exists another determinant of Rho 123 accumula-
tion. P-glycoprotein (Pgp) is a transmembrane protein which
is expressed by a variety of cell types, e.g. epithelial cells of
the gastrointestine, renal tubular cells, endothelial cells in
various organs and notably astroglial cells [20]. Pgp functions
as an adenosine triphosphate (ATP)-dependent efflux pump
that extrudes lipophilic compounds out of the cells. Rho 123
is a well known substrate of Pgp and Pgp activity can be mea-
sured by efflux of the dye which can be blocked by verapamil
[20–22].
Rho 123 staining in Astro 1 cells in relation to DWm was
characterized by performing dye loading following mitochon-
drial depolarization. Briefly, Astro 1 cells were treated with
CCCP (5, 10 and 30 lg/ml in culture medium) for 20 min, fol-
lowed by 30 min incubation with Rho 123 loading solution
Fig. 1 – Immunofluorescent staining of GFAP in Astro 1 cells.
(0.5 lM) containing the same concentrations of CCCP. For evi-
dence of Pgp efflux activity in Astro 1 cell membrane, cells
were first loaded with 0.5 lM Rho 123 for 30 min and then left
in Rho 123 free culture medium containing 10 lM verapamil
for 1 h. Flow cytometry was performed immediately after
incubation.
2.4.2. DiOC6(3)DiOC6(3) is a cyanine derivative which can accumulate in
mitochondria following DWm, and DiOC6(3) staining has been
reported to be a successful indicator of DWm in several cell
types [23]. It also has been demonstrated that other cellular
membrane structures such as the plasma membrane, the
endoplasmic reticulum membrane also contribute to cellular
uptake of DiOC6(3) [24]. DiOC6(3) staining has been used for
measurement of plasma membrane potential (PMP) after dis-
sipation of DWm [25,26]. To correlate DiOC6(3) staining with
DWm in Astro 1 cells, staining was performed following DWm
disruption. Briefly, Astro 1 cells were treated with CCCP
(5, 10, 20 and 30 lg/ml) for 20 min, followed by 30 min incuba-
tion with DiOC6(3) loading solution (0.1 lM) containing the
same concentrations of CCCP. To determine the contribution
of PMP to DiOC6(3) staining, 150 mM KCl in combination with
1 lM valinomycin was added into DiOC6(3) loading solution to
dissipate PMP [26]. Cells were lifted and analyzed by flow
cytometry immediately after dye loading.
2.4.3. JC-1JC-1 is a lipophilic, cationic metachromatic dye that accumu-
lates in mitochondria according to DWm as J-aggregates that
emit at 590 nm (orange red fluorescence) when excited at
490 nm. In the case of mitochondrial membrane collapse
and DWm dissipation, J-aggregates are released into the cyto-
plasm and transform into monomers that emit at 527 nm
(green fluorescence). Thus, the shift of fluorescence between
green and orange red reflects the change in DWm [27]. To cor-
relate JC-1 staining with DWm in Astro 1 cells, cell staining was
performed following DWm disruption. Cells were first treated
with CCCP (5, 10 and 30 lg/ml) for 20 min, followed by
30 min incubation with JC-1 loading solution (2.5 lg/ml) con-
taining the same concentrations of CCCP. The cells were then
lifted for fluorescence measurement by flow cytometry.
2.4.4. FDAFDA is a non-fluorescent esterized derivative of fluorescein.
A non-polar compound, FDA can passively diffuse into in-
tact cells and be hydrolyzed by cytoplasmic non-specific
esterase into fluorescein that stains cells fluorescently [28].
Non-viable cells that lose esterase activity will not be fluo-
rescent. Cells that maintain esterase activity but lose plas-
ma membrane integrity will leak fluorescein and therefore
lose cellular fluorescence rapidly. Thus, intracellular content
of fluorescein derived from FDA hydrolysis is often assayed
as an indicator of cell viability. However, there exists an-
other determinant of intracellular accumulation of fluores-
cein. Multidrug-resistance associated protein (MRP) is
another type of membrane bound efflux protein that be-
longs to the same protein family as Pgp. A variety of cell
types including astrocyte have been found to express MRP
[29–31]. Fluorescein is a reported substrate of MRP and

C A R B O N 4 8 ( 2 0 1 0 ) 7 3 0 – 7 4 3 733
intra- and/or extra-cellular fluorescein is often monitored
for assessment of MRP efflux function [32,33].
CCCP is a cytotoxicant. The effect of CCCP on FDA staining
was also examined. Briefly, Astro 1 cells were treated with
CCCP (5, 10 and 30 lg/ml) for 20 min, followed by 30 min incu-
bation with FDA loading solution (1.5 lg/ml) containing the
same concentrations of CCCP. For evidence of MRP efflux
activity in the cell membrane, the cells were loaded with
1.5 lg/ml FDA for 20 min and then left in FDA free culture
medium containing 50 lM indomethacin, a specific MRP
blocker, for 1 h to allow efflux. The cells were lifted for flow
cytometry immediately after incubation.
2.5. Cell exposure to MWCNTs and C60 and staining byfluorescent probes
Astro 1 cells grown in 12-well plates with >90% confluence
were exposed to 1.0 ml/well of MWCNT or C60 working sus-
pension for 24 h at 37 �C in a humidified atmosphere of 5%
CO2. MWCNT or C60 suspension was then removed and cells
were respectively stained by Rho 123, DiOC6(3), JC-1 and FDA
following washing with DPBS. Two modes of staining were
adopted. The first mode was to stain the cells in situ, wherein
cells were left in the plates and incubated with 1 ml/well
probe loading solution at 37 �C for 30 min before being lifted
for flow cytometry. In the second mode cells were stained
ex situ, wherein cells were lifted from the plates and re-sus-
pended in 1 ml per sample probe loading solution and incu-
bated for 30 min at 37 �C before flow cytometry.
All samples for flow cytometry were washed, pelleted and
re-suspended in 200 ll of buffer solution (1% BSA in DPBS).
Wherever probe fluorescence compatibility allowed double
staining, PI was added to each sample at a final concentration
of 0.5 lg/ml 5 min before flow cytometry.
2.6. Internalization of MWCNTs and C60 by Astro 1 cells
Uptake of MWCNTs and C60 by several other cell types has
been reported [34–37]. To determine intracellular location
and modality of MWCNTs and C60, cells were observed by
TEM after 24-h exposure to MWCNTs and C60 (15.6 lg/ml).
Briefly, MWCNT or C60 suspension was removed at the end
of 24-h exposure and cells were fixed with 2.5% glutaralde-
hyde. Cells were then scraped off, pelleted and post-fixed
with 1% osmium tetroxide. After dehydration in graded etha-
nol solution, cell pellets were embedded in resin. Thin sec-
tions (80 nM) were cut and mounted on copper grids.
Images were collected by a Zeiss EN10A electron microscope.
MWCNTs and C60 may also associate with cells by contact
with the cell membrane [38]. Flow cytometry side scatter
(SSC) signal was analyzed to quantitatively evaluate MWCNTs
and C60 internalization or association with cell membrane as
SSC is proportional to cell granularity and membrane
roughness.
2.7. Data acquirement, analysis and statistics
Flow cytometry data were acquired by a FACScan flow cytom-
eter equipped with CellQuest software (BD Biosciences,
Mountain View, CA) and analyzed using WinMDI 2.9 software.
Experiments characterizing probe indication were carried out
twice in duplicates for each probe. All cell exposure analyses
were performed 3· in duplicates. Fluorescence of 10,000
events per sample was measured. Fluorescence of Rho 123,
DiOC6(3) and FDA were acquired in FL-1 channel. JC-1 mono-
mer fluorescence was acquired in FL-1 channel and J-aggre-
gate fluorescence in FL-2 channel. PI fluorescence was
acquired in FL-3 channel. All data were acquired on a log
scale. Except for JC-1, geometric mean (GM) of each sample
was calculated to represent fluorescence intensity. For analy-
sis of JC-1 staining, data were converted to linear scale and
fluorescence intensity was quantified as arithmetic mean
(AM). Ratio of J-aggregate fluorescence (red) versus JC-1
monomer fluorescence (green) i.e. Ratio(Red/Green) was calcu-
lated as index of DWm for each sample. All data were normal-
ized by calculating the value of Percent Control. In the case of
JC-1, Percent Control = (MWCNT or C60 sample Ratio(Red/Green)/
control Ratio(Red/Green)) · 100%. For all other probes, Percent
Control = (MWCNTs or C60 sample GM/control GM) · 100%. Fi-
nal data were expressed as mean ± standard deviation and
two-tailed unpaired Student’s t-test was carried out for statis-
tical analysis. Significance was assumed for p values <0.05.
3. Results
3.1. Dispersion and characterization of MWCNTs and C60in culture medium
The application of sonication was found to effectively dis-
perse MWCNTs and C60 in suspension. When MWCNT and
C60 working suspensions were added to the cells in 12-well
plates, a few aggregates could be observed by light micros-
copy (not shown). MWCNTs and C60 in culture medium were
characterized by TEM and SEM (Fig. 2). Single fiber-like
MWCNTs could be seen but a large proportion of MWCNTs
were twisted together to form bundles or tangles while fuller-
ene C60 particles tended to aggregate into an amorphous
mass.
3.2. Indications of probes in staining of Astro 1 cells
3.2.1. Rho 123Depolarization of mitochondria with 5 lg/ml CCCP decreased
Rho 123 staining (Fig. 3A), suggesting DWm contributed to Rho
123 staining. However, increasing CCCP concentration did not
further reduce but instead enhanced Rho 123 staining. Cells
even displayed stronger-than-control fluorescence at 30 lg/
ml of CCCP. This phenomenon suggested there were mecha-
nisms other than DWm which determined retention of Rho
123 in Astro 1 cells. To test if there was Pgp efflux activity in
the Astro 1 cell membrane, Rho 123 loaded cells were incu-
bated with verapamil. Fluorescence intensity of 10 lM verap-
amil treated cells was an order of magnitude higher than that
of control (Fig. 3B), indicating blocked efflux of Rho 123 via
Pgp.
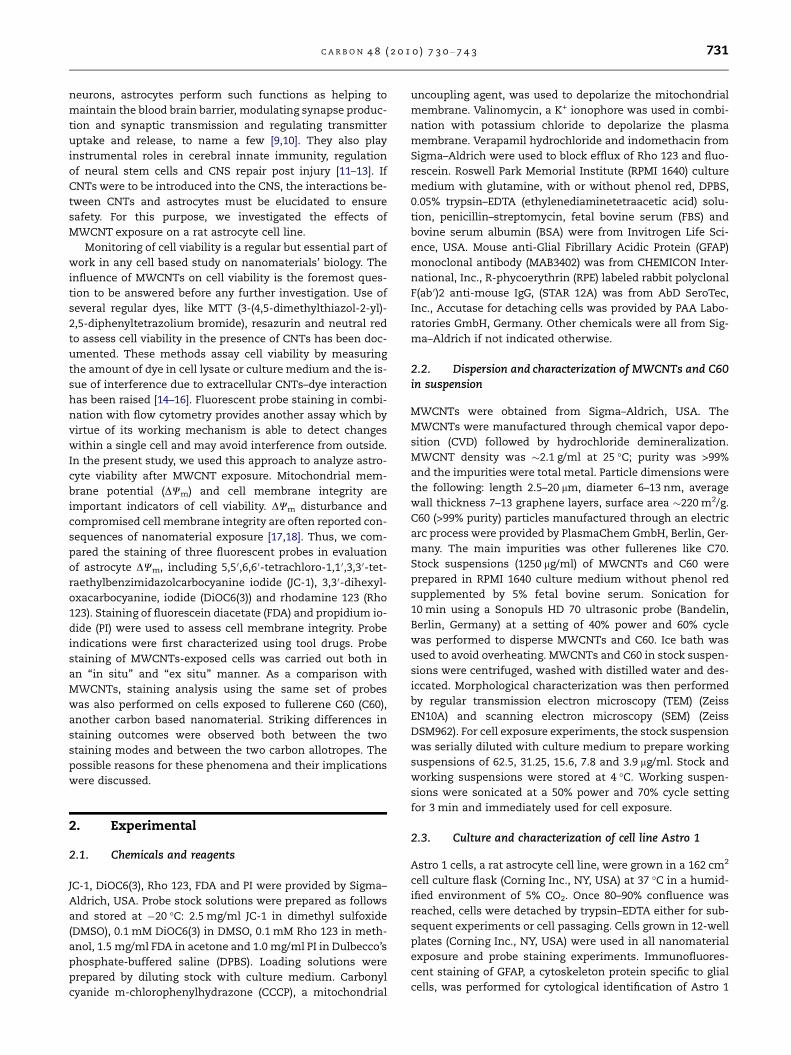
3.2.2. DiOC6(3)CCCP dose-dependently decreased DiOC6(3) staining (Fig. 4A).
Depolarization of the cell membrane by 150 mM KCl in

Fig. 2 – MWCNTs and C60 observed by SEM (A and C) and TEM (B and D).
Fig. 3 – (A) Intensity of cellular Rho 123 staining after CCCP treatment. (B) Intensity of cellular Rho 123 fluorescence after
30 min of incubation with Rho 123 free culture medium containing 10 lM verapamil. (NS: no staining control).
734 C A R B O N 4 8 ( 2 0 1 0 ) 7 3 0 – 7 4 3
combination with 1 lM valinomycin decreased DiOC6(3)
staining, but to a lesser extent than 20 lg/ml CCCP (Fig. 4B).
Dissipation of both DWm and PMP led to maximum reduction,
but not complete abrogation of DiOC6(3) staining. The results
suggested that both DWm and PMP contributed to DiOC6(3)
staining of Astro 1 cells, with DWm taking the lion’s share.
3.2.3. JC-1CCCP led to a dose-dependent decrease in J-aggregate fluores-
cence (red) and concomitant increase in JC-1 monomer fluo-
rescence (green) (Fig. 5). The red-to-green shift in cellular
fluorescence which reflected alteration of DWm was quantified
as the value of Ratio(Red/Green). Ratio(Red/Green) dropped with the
increase of CCCP concentration, indicating good correspon-
dence with DWm.
3.2.4. FDAMore than 10% of the cell population lost FDA staining at all
concentrations of CCCP (Fig. 6A–D). Fluorescence appreciably
increased in the majority of cell population at 5 and 10 lg/ml
of CCCP but dropped back at 30 lg/ml of CCCP. The data sug-
gested CCCP affected release of intracellular fluorescein
resulting in increased fluorescein retention. At high concen-
tration of CCCP, intracellular esterase activity may be
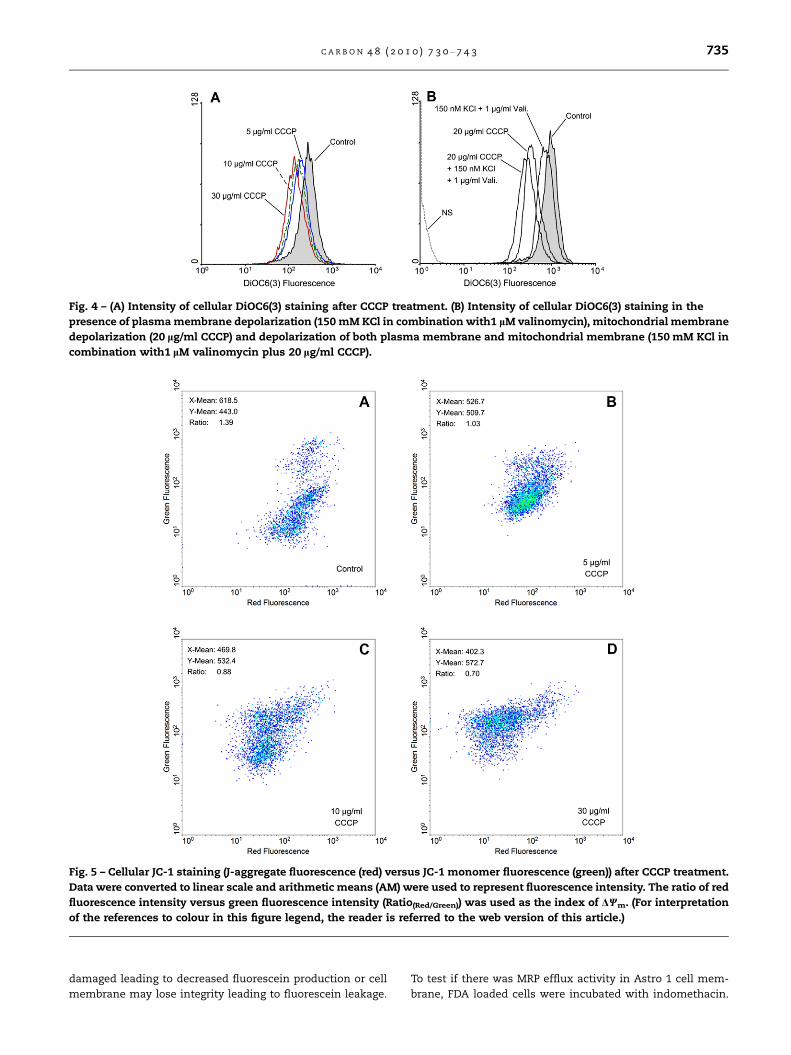
Fig. 5 – Cellular JC-1 staining (J-aggregate fluorescence (red) versus JC-1 monomer fluorescence (green)) after CCCP treatment.
Data were converted to linear scale and arithmetic means (AM) were used to represent fluorescence intensity. The ratio of red
fluorescence intensity versus green fluorescence intensity (Ratio(Red/Green)) was used as the index of DWm. (For interpretation
of the references to colour in this figure legend, the reader is referred to the web version of this article.)
Fig. 4 – (A) Intensity of cellular DiOC6(3) staining after CCCP treatment. (B) Intensity of cellular DiOC6(3) staining in the
presence of plasma membrane depolarization (150 mM KCl in combination with1 lM valinomycin), mitochondrial membrane
depolarization (20 lg/ml CCCP) and depolarization of both plasma membrane and mitochondrial membrane (150 mM KCl in
combination with1 lM valinomycin plus 20 lg/ml CCCP).
C A R B O N 4 8 ( 2 0 1 0 ) 7 3 0 – 7 4 3 735
damaged leading to decreased fluorescein production or cell
membrane may lose integrity leading to fluorescein leakage.
To test if there was MRP efflux activity in Astro 1 cell mem-
brane, FDA loaded cells were incubated with indomethacin.

Fig. 6 – (A–D) Cellular FDA staining after CCCP treatment. Geometric means (GM) were used to represent cellular fluorescence
intensity. (E) Fluorescence intensity of FDA loaded cells after 60 min of incubation with FDA free culture medium containing
50 lM indomethacin.
736 C A R B O N 4 8 ( 2 0 1 0 ) 7 3 0 – 7 4 3
Cells treated with 50 lM indomethacin displayed a marked in-
crease in cellular fluorescence (Fig. 6E), indicating blocked ef-
flux of fluorescein via MRP1.
3.3. Probe staining after exposure of MWCNTs and C60
3.3.1. Rho 123–PIDensity plots of Rho 123–PI double staining after MWCNT
exposure at concentrations of 15.6, 31.25 and 62.5 lg/ml are
shown in Fig. 7A–H. PI staining only slightly increased in
MWCNTs-exposed cells, stained either in situ or ex situ
(Fig. 7A–H), suggesting most Astro 1 cells maintained cell
membrane integrity in the presence of MWCNTs. When stain-
ing was performed in situ, cell population displayed a shift to-
wards higher Rho 123 fluorescence (Fig. 7A–D), whereas no
remarkable shift of cell population was observed under ex
situ staining condition (Fig. 7E–H). Statistical analysis showed
a dose-dependent increase of Rho 123 staining in cells stained
in situ but none in cells stained ex situ (Fig. 7M). The data sug-
gested MWCNTs appeared not to affect cellular uptake of Rho
123. Yet, release of intracellular Rho 123 might be impeded by
MWCNTs leading to increased Rho 123 retention and this ef-
fect was associated with mode of dye loading.
Compared with MWCNTs, the majority of cell population
exposed to C60 within the same concentration range dis-
played little variance in Rho 123 staining, indicating little
influence on Rho 123 uptake and release. Typical fluorescence
density plots of in situ staining were shown in Fig. 7I–L and
statistics shown in Fig. 7M. Note that at high concentration
of C60 (31.25 and 62.5 lg/ml), a portion of cells could display
low Rho 123 fluorescence and high PI fluorescence (arrow
marked), indicating necrosis.
3.3.2. DiOC6(3)Histograms of DiOC6(3) staining following MWCNT exposure
at concentrations of 15.6, 31.25 and 62.5 lg/ml are shown in
Fig. 8A and B. MWCNTs-exposed cells, either stained in situ
or ex situ, displayed reduced DiOC6(3) staining, as evi-
denced by the shift of histogram towards lower fluores-
cence. However, reduction of staining was far more
precipitous under in situ staining condition. Statistical anal-
ysis showed a dose-dependent decrease of DiOC6(3) stain-
ing in MWCNTs-exposed cells stained either way (Fig. 8D).
Decrease of statistical significance was observed even at
the lowest MWCNT concentration (3.9 lg/ml) when cells
were stained in situ, but was not seen until MWCNT con-
centration reached 15.6 lg/ml under ex situ staining condi-
tion. The results suggested that MWCNTs impeded cellular
uptake of DiOC6(3), the extent of which was affected by
the mode of dye loading.
In comparison with MWCNTs, C60 appeared to have minor
influence on DiOC6(3) staining. Typical fluorescence histo-
grams of in situ staining were shown in Fig. 8C and statistics
shown in Fig. 8D. It can be seen that decrease in DiOC6(3)

Fig. 7 – In situ (A–D) and ex situ (E–H) Rho 123–PI double staining of Astro 1 cells after 24 h of MWCNT exposure. (I–L) In situ
Rho 123–PI double staining after 24 h of C60 exposure (Arrow marked: cells with low Rho 123 fluorescence and high PI
fluorescence). GM values were used to represent fluorescence intensity. (M) Statistical analysis of cellular Rho 123 staining.
Values of Percent Control ((sample GM/control GM) · 100%) were calculated. Values are means ± standard deviation (n = 6,
and #p < 0.05, ##p < 0.01).
C A R B O N 4 8 ( 2 0 1 0 ) 7 3 0 – 7 4 3 737
staining of statistic significance only occurred after C60
concentration reached 31.25 lg/ml and the decrease was of
a much less magnitude than seen with MWCNTs of the same
concentration.
3.3.3. JC-1Density plots of JC-1 staining after 24 h MWCNT exposure at
concentrations of 3.9 and 31.25 lg/ml are illustrated in Fig. 9
(red fluorescence versus green fluorescence). When cells were
stained in situ, cell populations exhibited a more scattered
distribution of fluorescence and a conspicuous shift towards
both lower red fluorescence and lower green fluorescence
was observed (Fig. 9A–C), whereas cell populations were con-
centrated and displayed minor shift when the cells were
stained ex situ (Fig. 9D–F). Statistical analysis of red fluores-
cence (RF) showed a dose-dependent decrease of intracellular
J-aggregates under either staining condition, but the decrease
was more acute in cells stained in situ (Fig. 9J, dashed lines).
Ratio(Red/Green) values also decreased under either staining
condition (Fig. 9A–F). However, decrease of statistical signifi-
cance was not observed until the highest MWCNT concentra-
tion (62.5 lg/ml) under ex situ condition, but was seen

Fig. 8 – In situ (A) and ex situ (B) DiOC6(3) staining of Astro 1 cells after 24 h of MWCNT exposure. (C) In situ DiOC6(3) staining
after 24 h of C60 exposure. (D) Statistical analysis of cellular DiOC6(3) fluorescence intensity. GM values were used to
represent fluorescence intensity. Values of Percent Control were calculated by dividing sample GM by control GM. Values are
means ± standard deviation (n = 6, , ## and **p < 0.01).
738 C A R B O N 4 8 ( 2 0 1 0 ) 7 3 0 – 7 4 3
starting from 7.8 lg/ml of MWCNTs under in situ condition
(Fig. 9J, solid lines). The results suggested that MWCNT expo-
sure had little effect on DWm of Astro 1 cells. However,
MWCNTs reduced cellular uptake of JC-1, the extent of which
was associated with the mode of dye loading.
Compared with MWCNTs-exposed cells, C60-exposed cells
exhibited a more concentrated fluorescence distribution and
there was no major shift of cell population. See Fig. 9G–I for
typical density plots of in situ staining. Though decrease in
RF and Ratio(Red/Green) were of statistical significance at all
C60 concentrations, the extent of decrease was far lesser than
seen with MWCNTs. RF was 88.1% of control and Ratio(Red/
Green) was 92.7% of control at the highest C60 concentration
(62.5 lg/ml) (Fig. 9K). The data indicated that C60 had minor
influence on JC-1 uptake and DWm.
3.3.4. FDAHistograms of FDA staining after MWCNT exposure at con-
centrations of 15.6, 31.25 and 62.5 lg/ml are shown in
Fig. 10A and B. Shift of histogram towards higher fluorescence
was observed irrespective of mode of dye loading and there
was a substantial overlapping of histograms. Statistics
showed significant enhancement of cellular fluorescence at
most concentrations of MWCNTs suggesting increased fluo-
rescein accumulation, but there lacked a clear dose–effect
relation (Fig. 10D). The data indicated that MWCNTs appeared
not to interfere with cellular FDA uptake and not to compro-
mise intracellular esterase activity and cell membrane integ-
rity. The increased fluorescein accumulation might result
from impeded release by MWCNTs or possible MWCNTs–fluo-
rescein interaction.
In comparison with MWCNTs, C60 at most concentrations
exerted little influence on FDA staining. Noticeable decrease
in staining was only observed at 62.5 lg/ml of C60 (87.3% of
control). See Fig. 10C for typical histograms and Fig. 10D for
statistics.
3.4. Internalization of MWCNTs and C60 by Astro 1 cells
MWCNTs- and C60-like material in cytoplasmic vacuoles was
identified by TEM. MWCNTs in the vacuoles were found ar-
ranged in ‘‘flocky balls’’ (Fig. 11A and B) while C60 were aggre-
gated as an amorphous dense mass (Fig. 11C and D).
Morphologies of intracellular MWCNTs and C60 resembled
their extracellular counterparts (compare with Fig. 2). SSC of
MWCNTs- and C60- exposed cells both increased in a dose-
dependent manner (Fig. 11E), suggesting increased uptake
or cell association of MWCNTs or C60.

Fig. 9 – (A–F) In situ (A–C) and ex situ (D–F) JC-1 staining of Astro 1 cells after 24 h of MWCNT exposure (J-aggregate
fluorescence (red) versus JC-1 monomer fluorescence (green)). (G–I) In situ JC-1staining after 24 h of C60 exposure. Data were
converted to linear scale and AM values were used to represent fluorescence intensity. Ratio(Red/Green) was used as the index
of DWm. Statistical analysis of red fluorescence (RF) and Ratio(Red/Green)) in MWCNTs-exposed cells (J) and C60-exposed cells (K).
Values of Percent Control ((sample AM/control AM) · 100%, or (sample Ratio(Red/Green)/control Ratio(Red/Green)) · 100%) were
calculated Values are means ± standard deviation (n = 6, , ## and **p < 0.01). (For interpretation of the references to colour in
this figure legend, the reader is referred to the web version of this article.).
C A R B O N 4 8 ( 2 0 1 0 ) 7 3 0 – 7 4 3 739

Fig. 10 – In situ (A) and ex situ (B) FDA staining of Astro 1 cells after 24 h of MWCNT exposure. (C) In situ FDA staining after
24 h of C60 exposure. (D) Statistics of FDA staining. GM values were used to represent fluorescence intensity. Values of
Percent Control were calculated by dividing sample GM by control GM. Values are means ± standard deviation (n = 6, # and
*p < 0.05, , ## and **p < 0.01).
740 C A R B O N 4 8 ( 2 0 1 0 ) 7 3 0 – 7 4 3
4. Discussion
In the present study, effects of MWCNTs and C60 on supravi-
tal staining of astrocytes by fluorescent probes were analyzed
and staining profile of each probe presented. For interpreta-
tion of these findings, indications of each probe were first
characterized using tool drugs. Three out of these probes i.e.
Rho 123, DiOC6(3) and JC-1 are commonly used for assay of
DWm. Thus, CCCP, a specific disruptor of DWm was used to cor-
relate staining of the three probes to DWm. Results are sum-
marized in Fig. 12. Cellular staining of DiOC6(3) and
Ratio(Red/Green) of JC-1 staining responded well to CCCP in-
duced disruption of DWm, both decreasing in a dose-depen-
dent manner manifested by nearly superposing dose–effect
curves. The data suggested that DiOC6(3) and JC-1 staining
were good indicators of DWm in Astro 1 cells. Rho 123 staining
in Astro 1 cells showed a different pattern not in line with
mitochondrial depolarization. Low concentration (5 lg/ml) of
CCCP reduced Rho 123 staining, to a similar degree as in the
case of DiOC6(3) and JC-1. As CCCP concentration increased,
however, Rho 123 staining intensified instead of further
reduction, with stronger-than-control staining at 30 lg/ml of
CCCP. These phenomena indicated that DWm contributed to
Rho 123 uptake by Astro 1 cells, but there exist other determi-
nants of intracellular Rho 123 accumulation which could
override DWm. Astrocytes are known to express Pgp efflux
function and Rho 123 is a well known substrate of Pgp. Efflux
of Rho 123 via Pgp by Astro 1 cell is indicated by the verapamil
test (Fig. 3B). Pgp functions in an ATP-dependent manner and
cellular ATP production is closely related to DWm. Thus, high
concentrations of CCCP might dissipate DWm, reducing mito-
chondrial accumulation of Rho 123 but increasing Rho 123
retention in the cytoplasm, possibly due to ATP depletion
and an ensuing compromise of Pgp efflux function.
FDA staining in Astro1 cells was also characterized using
CCCP. A remarkable increase in cellular fluorescence was ob-
served at 5 lg/ml of CCCP. As CCCP concentration increased,
however, cellular fluorescence lessened with a marked drop
at 30 lg/ml of CCCP (Fig. 12). FDA is hydrolyzed by intracellu-
lar esterase into fluorescein which renders the cells fluores-
cent. Determinants of intracellular fluorescein content
include esterase activity, efflux via MRP (another type of
ATP-dependent efflux protein) and cell membrane integrity.
Efflux of fluorescein via MRP is indicated by the indomethacin
test (Fig. 6E). Based on the above results, it can be inferred that
CCCP at all concentrations might compromise release of
intracellular fluorescein probably via MRP, resulting in in-
creased retention of fluorescein. Yet, high concentration of
CCCP might damage esterase activity or cell membrane integ-
rity, leading to reduced fluorescein production or leakage of
fluorescein.
MWCNTs-exposed Astro 1 cells were stained with the
probes, each in two modes of dye loading i.e. in situ and ex
situ. Staining data of Rho 123 (Fig. 7), DiOC6(3) (Fig. 8), JC-1
(Fig. 9) and FDA (Fig. 10) clearly showed that mode of dye load-
ing could significantly affect the outcome of cell staining. The

Fig. 11 – MWCNTs (A and B) and C60 (C and D) in cytoplasmic vacuoles identified by TEM. (E) Statistics of SSC after 24 h of
MWCNT and C60 exposure. GM values were used to represent signal intensity. Values of Percent Control were calculated by
dividing sample GM by control GM. Values are means ± standard deviation (n = 6, and ##p < 0.01).
Fig. 12 – Effects of CCCP on cellular staining of JC-1, DiOC6(3),
Rho 123 and FDA. For DiOC6(3), Rho 123 and FDA, GM values
were used to represent fluorescence intensity and values of
Percent Control were calculated by dividing sample GM by
control GM. For JC-1, Ratio(Red/Green) values were used to
indicate DWm and values of Percent Control were calculated
by dividing sample Ratio(Red/Green) with control Ratio(Red/
Green). Values are means ± standard deviation (n = 4).
C A R B O N 4 8 ( 2 0 1 0 ) 7 3 0 – 7 4 3 741
underlying reasons for this phenomenon are given as follows.
Under in situ condition, cells are attached to the plate surface
with cell body spread out in a flattened morphology with the
bottom side in contact with the plate surface and top side in
contact with culture medium. Substance exchange between
the cells and culture medium is supposed to be primarily
through the top side portion of the cell membrane. Intensity
of cellular dye staining is largely a function of dye uptake ver-
sus dye release through this portion of the cell membrane. It is
especially the case, when cells reach confluence and form a
monolayer. When there are MWCNTs in culture medium,
the top side of a cell is exposed to MWCNTs and uptake of dyes
(DiOC6(3), JC-1) or release of dyes (Rho 123, fluorescein)
through this portion of the cell membrane can be affected.
Since MWCNTs are not water soluble, the bottom side of cell
should be largely unaffected. Under ex situ condition, cells
are suspended in culture medium in a spherical shape. The
bottom side of a cell, which is little affected by MWCNTs under
in situ condition, is exposed and free to exchange with culture
medium. Dye uptake and release through the unaffected por-
tion of cell membrane might, at least partly, explain the re-
sults of ex situ probe staining. It should also be noted that
ex situ cells may have cell surface Pgp damaged by the effect
of trypsin. In this case, Pgp-mediated efflux of Rho 123 might
be negated but uptake of Rho 123 by passive diffusion is not af-
fected, either by trypsin or by MWCNTs. Thus, it is uptake
rather than release of Rho 123 that might determine cellular
staining of Rho 123 under ex situ condition. In the case of ex
situ FDA staining, cell surface MRP might also be compro-
mised, but the enhancement of staining appeared to be more
pronounced than in situ cells (Fig. 10D). This might be a result
of more thorough uptake of FDA under ex situ condition.
It has been demonstrated that cellular staining of Rho 123,
DiOC6(3) and JC-1 are all related to DWm (Fig. 12). However, cell
staining results of these probes following MWCNT exposure
showed inconsistency or even contradiction with respect to
DWm. Discretion should be used in data interpretation to avoid
misleading judgements on MWCNTs’ effect on DWm.
MWCNTs-treated cells displayed increased Rho123 staining
under in situ condition (Fig. 7A–D). As discussed above, this
phenomenon might be a result of impeded Rho 123 release
rather than increased Rho 123 uptake. Ex situ Rho 123 staining
data showed MWCNTs did not affect uptake of Rho 123

742 C A R B O N 4 8 ( 2 0 1 0 ) 7 3 0 – 7 4 3
(Fig. 7E–H), suggesting little impact on DWm. This point is cor-
roborated by data of JC-1 staining. Though cellular uptake of
JC-1 showed a decrease after MWCNT exposure particularly
under in situ condition, the index of DWm i.e. Ratio(Red/Green)
showed little variation under ex situ condition (Fig. 9A–F, J),
indicating no significant alteration of DWm and reduction of
JC-1 uptake not resulting from DWm disruption. In the case of
DiOC6(3), the sharply decreased staining under in situ condi-
tion was apparently not due to DWm disruption as the reduc-
tion of staining following MWCNT exposure was of a far
greater measure than following DWm dissipation by CCCP
(compare Figs. 4A and 8A). Reduction of DiOC6(3) staining
was to a less extent under ex situ condition, comparable to
that seen with dissipation of PMP (compare Figs. 4B and 8B).
Nonetheless, remarkable reduction of staining was still ob-
served even after PMP and DWm were both dissipated (see Sup-
plement Fig. S1), indicating that reduced uptake of DiOC6(3)
following MWCNT exposure could not be explained by disrup-
tion of either DWm or PMP. To summarize, MWCNT exposure
affected cell staining by Rho 123, DiOC6(3) and JC-1, but had lit-
tle impact on DWm. Ex situ JC-1 staining appeared to be the
most appropriate assay of DWm in Astro 1 cells after MWCNT
exposure and Ratio(Red/Green) was the proper index to use. Cel-
lular uptake of Rho 123 also reflected DWm, yet release of intra-
cellular Rho 123, probably efflux via Pgp could affect the
outcome of staining.
Besides evaluation of DWm by staining of 3 potential sensi-
tive probes, another marker of cell viability i.e. the integrity of
cell membrane was also assessed by staining of FDA and PI
after MWCNT exposure. As show by the data, MWCNTs-ex-
posed cells, stained either in situ or ex situ, showed higher
fluorescence than control cells following FDA loading
(Fig. 10A and B), indicating no leakage of intracellular fluores-
cein and there was only a slight increase in PI staining
(Fig. 7A–H), indicating minor change in membrane permeabil-
ity of this intact membrane none-penetrating dye.
An interesting aspect of our findings is that MWCNTs-ex-
posed cell displayed increased content of Rho 123 and fluores-
cein. As discussed above, we believe this phenomenon may be
mainly due to impeded efflux (via Pgp and MRP) by MWCNTs.
There may be concern that possible MWCNTs-dye interactions
might give rise to this phenomenon and particularly that
MWCNTs taken up by or associatedwith the cells (Fig. 11) might
serve as high-surface area adsorptive sinks for the dyes.
Indeed, MWCNT adsorption of several dyes has been docu-
mented [14–16,39] and we cannot rule out the possibility of
MWCNTs-dye interactions in the present study. Nonetheless,
MWCNTs-dye interaction alone is not adequate to explain the
increase in intracellular Rho 123. Since the MWCNT exposure
procedure was the same throughout our work, should there
be any MWCNT adsorption of the dye, it should have exerted
same effects on dye staining regardless of mode of staining.
However, data showed that increased Rho 123 staining only oc-
curred in cells stained under the in situ condition but not in the
ex situ stained cells (Fig. 7M). This difference in itself is evi-
dence against the argument that the increase in intracellular
Rho 123 arises from MWCNT adsorption of the dye. In the case
of FDA staining, increase in intracellular fluorescein was ob-
served under both staining conditions. The possible role of
MWCNTs–fluorescein adsorption cannot be excluded within
the frame of the present work. In a separate kinetic study on
the efflux of intracellular fluorescein and Rho 123, however,
the efflux rates of fluorescein and Rho 123 were found signifi-
cantly lower in MWCNTs-exposed cells (data not shown), sug-
gesting MWCNTs to be capable of impeding the efflux of
fluorescein and Rho 123.
As a control, cells exposed to C60 of the same concentra-
tion range as MWCNTs were subjected to the same set of
probe staining procedure. As can be seen from the data, the
influence of C60 on cellular staining of most of the probes
was of a much less magnitude than that of MWNCTs and
there was no remarkable difference between the in situ and
ex situ mode of staining. Thus, only in situ staining data of
C60-exposed cells were presented in this manuscript. One
point worth remark is that necrosis could occur at high doses
of C60, characterized by low Rho 123 fluorescence and high PI
fluorescence (Fig. 7I–L). Graphite and diamond are well known
carbon allotropes that have totally different physic-chemical
properties. C60 and MWCNTs are also carbon allotropes.
Their different effects on probe staining demonstrated in
the present work provide an example that carbon allotropes
of different nanostructure can also possess different biologi-
cal properties.
5. Conclusions
Based on our findings, we conclude that if JC-1, DiOC6(3) and
Rho 123 are used to stain MWCNTs-exposed cells, the out-
comes of staining will be significantly affected by the mode
of staining. Staining of JC-1and Rho 123 can be used to assay
the effect of MWCNTs on DWm and staining of FDA and PI can
provide information on cell membrane integrity. The ex situ
mode of dye loading is preferred, to avoid misleading staining
outcomes arising from inadequate dye uptake. As to the ef-
fects of MWCNTs and C60 on astrocyte viability in the present
work, JC-1 and Rho 123 staining suggested undamaged DWm,
FDA and PI staining indicated maintenance of cell membrane
integrity, all pointing to maintenance of cell viability.
Acknowledgements
Xiao Chen is grateful to the German Academic Exchange Ser-
vice (DAAD) for the support kindly provided. The authors
thank Professor Antje Bornemann for her assistance in elec-
tron microscopy.
Appendix A. Supplementary data
Supplementary data associated with this article can be found,
in the online version, at doi:10.1016/j.carbon.2009.10.020.
R E F E R E N C E S
[1] Mattson MP, Haddon RC, Rao AM. Molecularfunctionalization of carbon nanotubes and use as substratesfor neuronal growth. J Mol Neurosci 2000;14(3):175–82.

C A R B O N 4 8 ( 2 0 1 0 ) 7 3 0 – 7 4 3 743
[2] Hu H, Ni Y, Montana V, Haddon RC, Parpura V. Chemicallyfunctionalized carbon nanotubes as substrates for neuronalgrowth. Nano Lett 2004;4(3):507–11.
[3] Galvan-Garcia P, Keefer EW, Yang F, Zhang M, Fang S,Zakhidov AA, et al. Robust cell migration and neuronalgrowth on pristine carbon nanotube sheets and yarns. JBiomater Sci Polym 2007;18(10):1245–61.
[4] Lovat V, Pantarotto D, Lagostena L, Cacciari B, Grandolfo M,Righi M, et al. Carbon nanotube substrates boost neuronalelectrical signaling. Nano Lett 2005;5(6):1107–10.
[5] Cellot G, Cilia E, Cipollone S, Rancic V, Sucapane A, GiordaniS, et al. Carbon nanotubes might improve neuronalperformance by favouring electrical shortcuts. NatNanotechnol 2009;4(2):126–33.
[6] Ali-Boucetta H, Al-Jamal KT, McCarthy D, Prato M, Bianco A,Kostarelos K. Multiwalled carbon nanotube–doxorubicinsupramolecular complexes for cancer therapeutics. ChemCommun (Camb) 2008;28(4):459–61.
[7] Kateb B, Van Handel M, Zhang L, Bronikowski MJ, ManoharaH, Badie B. Internalization of MWCNT by microglia: possibleapplication in immunotherapy of brain tumors. Neuroimage2007;37(Suppl. 1):S9–S17.
[8] Van Vlerken LE, Amiji MM. Multi-functional polymericnanoparticles for tumour-targeted drug delivery. Expert OpinDrug Deliv 2006;3(2):205–16.
[9] Taber KH, Hurley RA. Astroglia: not just glue. JNeuropsychiatry Clin Neurosci 2008;20(2):iv-129.
[10] Volterra A, Meldolesi J. Astrocytes, from brain glue tocommunication elements: the revolution continues. Nat RevNeurosci 2005;6(8):626–40.
[11] Farina C, Aloisi F, Meinl E. Astrocytes are active players incerebral innate immunity. Trends Immunol2007;28(3):138–45.
[12] Floyd CL, Lyeth BG. Astroglia: important mediators oftraumatic brain injury. Prog Brain Res 2007;161:61–79.
[13] Ma DK, Ming GL, Song H. Glial influences on neural stem celldevelopment: cellular niches for adult neurogenesis. CurrOpin Neurobiol 2005;15(5):514–20.
[14] Worle-Knirsch JM, Pulskamp K, Krug HF. Oops they did itagain! Carbon nanotubes hoax scientists in viability assays.Nano Lett 2006;6(6):1261–8.
[15] Monteiro-Riviere NA, Inman AO, Zhang LW. Limitations andrelative utility of screening assays to assess engineerednanoparticle toxicity in a human cell line. Toxicol ApplPharmacol 2009;234(2):222–35.
[16] Davoren M, Herzog E, Casey A, Cottineau B, Chambers G,Byrne HJ, et al. In vitro toxicity evaluation of single walledcarbon nanotubes on human A549 lung cells. Toxicol In Vitro2007;21(3):438–48.
[17] Magrez A, Kasas S, Salicio V, Pasquier N, Seo JW, Celio M,et al. Cellular toxicity of carbon-based nanomaterials. NanoLett 2006;6:1121–5.
[18] Kisin ER, Murray AR, Keane MJ, Shi XC, Schwegler-Berry D,Gorelik O, et al. Single-walled carbon nanotubes: geno- andcytotoxic effects in lung fibroblast V79 cells. J Toxicol EnvironHealth A 2007;70:2071–9.
[19] Shapiro HM. Cell membrane potential analysis. Meth Cell Biol1994;41:121–33.
[20] Gottesman MM, Hrycyna CA, Schoenlein PV, Germann UA,Pastan I. Genetic analysis of the multidrug transporter. AnnuRev Genet 1995;29:607–49.
[21] Nare B, Prichard RK, Georges E. Characterization ofrhodamine 123 binding to P-glycoprotein in humanmultidrug-resistant cells. Mol Pharmacol 1994;45(6):1145–52.
[22] Petriz J, Garcıa-Lopez J. Flow cytometric analysis of P-glycoprotein function using rhodamine 123. Leukemia1997;11(7):1124–30.
[23] Petit PX, Susin SA, Zamzami N, Mignotte B, Kroemer G.Mitochondria and programmed cell death: back to the future.FEBS Lett 1996;396(1):7–13.
[24] Sabnis RW, Deligeorgiev TG, Jachak MN, Dalvi TS. DiOC6(3): auseful dye for staining the endoplasmic reticulum. BiotechHistochem 1997;72(5):253–8.
[25] Brewis IA, Morton IE, Mohammad SN, Browes CE, Moore HD.Measurement of intracellular calcium concentration andplasma membrane potential in human spermatozoa usingflow cytometry. J Androl 2000;21(2):238–49.
[26] Hasmann M, Valet GK, Tapiero H, Trevorrow K, Lampidis T.Membrane potential differences between adriamycin-sensitive and -resistant cells as measured by flow cytometry.Biochem Pharmacol 1989;38(2):305–12.
[27] Salvioli S, Ardizzoni A, Franceschi C, Cossarizza A. JC-1, butnot DiOC6(3) or rhodamine 123, is a reliable fluorescent probeto assess delta psi changes in intact cells: implications forstudies on mitochondrial functionality during apoptosis.FEBS Lett 1997;411(1):777–82.
[28] Guilbault GG, Kramer DN. Fluoremetric determination oflipase, acylase, alpha- and gamma-chymotrypsin andinhibitors of these enzymes. Anal Chem 1964;36:409–12.
[29] Mercier C, Masseguin C, Roux F, Gabrion J, Scherrmann JM.Expression of P-glycoprotein (ABCB1) and Mrp1 (ABCC1) inadult rat brain: focus on astrocytes. Brain Res2004;1021(1):32–40.
[30] Dallas S, Zhu X, Baruchel S, Schlichter L, Bendayan R.Functional expression of the multidrug resistance protein 1in microglia. J Pharmacol Exp Ther 2003;307(1):282–90.
[31] Nies AT, Jedlitschky G, Konig J, Herold-Mende C, Steiner HH,Schmitt HP, et al. Expression and immunolocalization of themultidrug resistance proteins, MRP1–MRP6 (ABCC1–ABCC6),in human brain. Neuroscience 2004;129(2):349–60.
[32] Decleves X, Regina A, Laplanche JL, Roux F, Boval B, LaunayJM, et al. Functional expression of P-glycoprotein andmultidrug resistance-associated protein (Mrp1) in primarycultures of rat astrocytes. J Neurosci Res 2000;60(5):594–601.
[33] Sun H, Johnson DR, Finch RA, Sartorelli AC, Miller DW, et al.Transport of fluorescein in MDCKII-MRP1 transfected cellsand mrp1-knockout mice. Biochem Biophys Res Commun2001;284(4):863–9.
[34] Tabet L, Bussy C, Amara N, Setyan A, Grodet A, Rossi MJ, et al.Adverse effects of industrial multiwalled carbon nanotubeson human pulmonary cells. J Toxicol Environ Health A2009;72(2):60–73.
[35] Bussy C, Cambedouzou J, Lanone S, Leccia E, Heresanu V,Pinault M, et al. Carbon nanotubes in macrophages: imagingand chemical analysis by X-ray fluorescence microscopy.Nano Lett 2008;8(9):2659–63.
[36] Porter AE, Muller K, Skepper J, Midgley P, Welland M. Uptakeof C60 by human monocyte macrophages, its localizationand implications for toxicity: studied by high resolutionelectron microscopy and electron tomography. Acta Biomater2006;2(4):409–19.
[37] Porter AE, Gass M, Muller K, Skepper JN, Midgley P, WellandM. Visualizing the uptake of C60 to the cytoplasm andnucleus of human monocyte-derived macrophage cells usingenergy-filtered transmission electron microscopy andelectron tomography. Environ Sci Technol 2007;41(8):3012–7.
[38] Hirano S, Kanno S, Furuyama A. Multi-walled carbonnanotubes injure the plasma membrane of macrophages.Toxicol Appl Pharmacol 2008;232(2):244–51.
[39] Casey A, Herzog E, Davoren M, Lyng FM, Byrne HJ, ChambersG. Spectroscopic analysis confirms the interactions betweensingle walled carbon nanotubes and various dyes commonlyused to assess cytotoxicity. Carbon 2007;45(7):1425–32.