modec, inc. and consolidated subsidiaries
TRANSCRIPT
MODEC, INC. and Consolidated Subsidiaries
Consolidated Financial Statements As of December 31, 2006 and 2005

MODEC, INC. and Consolidated Subsidiaries
CONSOLIDATED BALANCE SHEETS
December 31, 2006 and 2005
A S S E T S
Thousands of Japanese yen Thousands of U.S. dollars
2006 2005 2006 CURRENT ASSETS:
Cash and time deposits ¥28,827,361 ¥ 25,061,948 $ 242,003 Accounts receivable – trade (Note 16) 10,641,277 16,409,320 89,332 Inventories (Note 2) 2,518,199 2,237,994 21,140 Short-term loans receivable (Note 16) 27,270,756 255,827 228,935 Short-term lease receivable 2,352,593 2,145,448 19,750 Deferred tax assets (Note 11) 335,005 156,195 2,812 Other current assets 3,040,775 2,568,466 25,528 Less- Allowance for bad debts (3,408) (3,013) (29)
Total current assets 74,982,558 48,832,185 629,471 PROPERTY AND EQUIPMENT:
Buildings and equipment 936,512 774,407 7,862 Vessel 10,893,929 10,236,883 91,453 Construction in progress 30,759 3,735,215 258 Less- Accumulated depreciation (7,933,102) (7,651,566) (66,597)
3,928,098 7,094,939 32,976 INTANGIBLE ASSETS (Note 4) 15,119,857 5,246,688 126,930 OTHER ASSETS:
Investment securities (Note 3) 11,127,213 8,463,479 93,412 Long-term loans receivable from
unconsolidated subsidiaries and affiliated companies (Note 16) 13,782,627 28,289,633 115,704
Long-term lease receivable 2,565,483 5,043,801 21,537 Deferred tax assets (Note 11) 1,339,169 1,345,512 11,243 Other investments 507,647 388,817 4,261 Less- Allowance for bad debts (2,400) (6,400) (21) 29,319,739 43,524,842 246,136
Total assets ¥123,350,252 ¥104,698,654 $1,035,513
The accompanying notes are an integral part of these balance sheets.

LIABILITIES AND NET ASSETS
Thousands of Japanese yen Thousands of U.S. dollars
2006 2005 2006 CURRENT LIABILITIES:
Accounts payable – trade ¥ 16,265,379 ¥ 18,889,959 $ 136,546 Short-term loans payable (Notes 5 and 6) 34,172,577 27,960,410 286,875 Current portion of long-term loans payable
(Note 5) 2,955,844 3,107,316 24,814 Accrued expenses 5,025,737 1,692,027 42,191 Income taxes payable (Note 11) 1,842,845 345,594 15,470 Provision for product warranty 791,649 504,574 6,646 Deferred tax liabilities (Note 11) 7,941 725,719 67 Other current liabilities 3,182,919 3,205,519 26,721
Total current liabilities 64,244,891 56,431,118 539,330
LONG-TERM LIABILITIES: Long-term loans payable (Note 5) 12,822,085 6,478,169 107,640 Severance and retirement benefits
For employees (Note 9) 125,594 113,839 1,054 For directors and corporate auditors 189,671 120,944 1,592
Deferred tax liabilities (Note 11) 3,167,137 1,548,182 26,588 Other long-term liabilities 578,399 355,674 4,856
Total long-term liabilities 16,882,886 8,616,808 141,730 NET ASSETS : SHAREHOLDERS’ EQUITY (Note 7):
Common stock; Authorized – 102,868,000 shares Issued – 37,408,000 shares 12,391,600 12,391,600 104,026
Capital surplus 13,121,672 13,121,672 110,155 Retained earnings 13,319,511 10,434,178 111,816 Less- Treasury stock, at cost (713) (547) (6) Total shareholders’ equity 38,832,070 35,946,903 325,991
ACCUMULATED GAINS FROM VALUATION AND TRANSACTION ADJUSTMENTS Net unrealized holding gains on securities 780,351 865,195 6,551 Foreign currency translation adjustments 1,237,041 1,031,558 10,385 Total valuation transaction and adjustments 2,017,392 1,896,753 16,936
MINORITY INTERESTS IN CONSOLIDATED
SUBSIDIARIES 1,373,013 1,807,073 11,526 Total net assets 42,222,475 39,650,729 354,453
Total liabilities, net assets ¥123,350,252 ¥104,698,654 $1,035,513

MODEC, INC. and Consolidated Subsidiaries
CONSOLIDATED STATEMENTS OF INCOME
For the years ended December 31, 2006 and 2005
Thousands of Japanese yen Thousands of U.S. dollars
2006 2005 2006
SALES ¥99,149,334 ¥71,614,166 $832,348 COST OF SALES (Note 10) 89,767,807 63,053,293 753,591
Gross profit 9,381,527 8,560,873 78,757 SELLING, GENERAL AND ADMINISTRATIVE
EXPENSES 5,887,122 4,665,333 49,422 Operating profit 3,494,405 3,895,540 29,335
OTHER INCOME (EXPENSES):
Interest income and dividend income 3,552,577 1,287,727 29,824 Interest expense (2,555,538) (1,261,365) (21,454) Foreign exchange gain (loss), net (1,106,006) 580,714 (9,285) Equity in earnings of affiliates 1,132,458 763,396 9,507 Other, net 187,443 142,046 1,574
Total other income (expenses) 1,210,934 1,512,518 10,166 INCOME BEFORE INCOME TAXES AND
MINORITY INTERESTS 4,705,339 5,408,058 39,501 INCOME TAXES (Note 11):
Current 2,636,783 1,010,252 22,136 Deferred (1,511,569) 841,903 (12,689)
INCOME BEFORE MINORITY INTERESTS 3,580,125 3,555,903 30,054 MINORITY INTERESTS 274,376 342,901 2,303 NET INCOME ¥ 3,305,749 ¥ 3,213,002 $ 27,751
Japanese yen U.S. dollars Net income per share (Note 8) ¥88.37 ¥93.46 $0.74 Dividends per share ¥12.50 ¥10.00 $0.10
The accompanying notes are an integral part of these statements.

MODEC, INC. and Consolidated Subsidiaries
CONSOLIDATED STATEMENTS OF CHANGES IN NET ASSETS For the years ended December 31, 2006 and 2005
Thousands of Japanese yen
Shareholders' equity Accumulated gains from valuation and transaction adjustments
Common stock
Capital surplus
Retained earnings
Treasury stock at
cost
Total shareholders'
equity
Net unrealized
holding gains on securities
Foreign currency
translation adjustments
Total valuation
transaction and other
adjustments
Minority interests in
consolidated subsidiaries
Total net assets
Balance at December 31, 2004 7,159,000 7,675,150 7,531,745 (230) 22,365,665 575,834 (656,489) (80,655) 1,393,822 23,678,832
Issuance of new shares 5,232,600 5,446,522 10,679,122 - 10,679,122
Net income 3,213,002 3,213,002 - 3,213,002
Cash dividends paid (297,569) (297,569) - (297,569)
Bonuses paid to directors (13,000) (13,000) - (13,000)
Other - - -
Purchases of treasury stock (317) (317) - (317)
Increase due to changes in fair market values of available-for-sale securities
- 289,361 289,361 289,361
Adjustments from translation of foreign currency financial statements
- 1,688,047 1,688,047 1,688,047
Increase in minority interests in consolidated subsidiaries
- - 413,250 413,250
Balance at December 31, 2005 12,391,600 13,121,672 10,434,178 (547) 35,946,903 865,195 1,031,558 1,896,753 1,807,072 39,650,728
Net income 3,305,749 3,305,749 - 3,305,749
Cash dividends paid (420,837) (420,837) - (420,837)
Bonuses paid to directors (18,000) (18,000) - (18,000)
Other 18,421 18,421 - 18,421
Purchases of treasury stock (166) (166) - (166)
Decrease due to changes in fair market values of available-for-sale securities
- (84,844) (84,844) (84,844)
Adjustments from translation of foreign currency financial statements
- 205,483 205,483 205,483
Increase in minority interests in consolidated subsidiaries
- - (434,059) (434,059)
Balance at December 31, 2006 12,391,600 13,121,672 13,319,511 (713) 38,832,070 780,351 1,237,041 2,017,392 1,373,013 42,222,475
The accompanying notes are an integral part of these statements.

Thousands of USD
Shareholders' equity Accumulated gains from valuation and transaction adjustments
Common stock
Capital surplus
Retained earnings
Treasury stock at
cost
Total shareholders'
equity
Net unrealized holding gains on securities
Foreign currency
translation adjustments
Total valuation
transaction and other
adjustments
Minority interests in
consolidated subsidiaries
Total net assets
Balance at December 31, 2005 104,026 110,155 87,594 (4) 301,771 7,263 8,660 15,923 15,170 332,864
Net income 27,751 27,751 - 27,751
Cash dividends paid (3,533) (3,533) - (3,533)
Bonuses paid to directors (151) (151) - (151)
Other 155 155 - 155
Purchases of treasury stock (2) (2) - (2)
Decrease due to changes in fair market values of available-for-sale securities
- (712) (712) (712)
Adjustments from translation of foreign currency financial statements
- 1,725 1,725 1,725
Increase in minority interests in consolidated subsidiaries
- - (3,644) (3,644)
Balance at December 31, 2006 104,026 110,155 111,816 (6) 325,991 6,551 10,385 16,936 11,526 354,453
The accompanying notes are an integral part of these statements.

MODEC, INC. and Consolidated Subsidiaries
CONSOLIDATED STATEMENTS OF CASH FLOWS
For the years ended December 31, 2006 and 2005
Thousands of Japanese yen Thousands of U.S. dollars
2006 2005 2006 CASH FLOWS FROM OPERATING
ACTIVITIES: Income before income taxes and minority
interests ¥ 4,705,339 ¥ 5,408,058 $39,501 Adjustments to reconcile income before income
taxes and minority interests to net cash provided by operating activities: Depreciation and amortization 743,185 1,116,419 6,239 Amortization of consolidation goodwill 26,486 26,486 222 Provision for (reversal of) allowance for bad
debts (3,605) (2,379) (30) Provision for severance and retirement
benefits for employees 11,755 10,730 99 Provision for severance and retirement
benefits for directors and corporate auditors 68,727 15,964 577 Provision for product warranty 283,263 139,505 2,378 Interest income and dividend income (3,552,577) (1,287,727) (29,824) Interest expense 2,555,538 1,261,365 21,453 Foreign exchange (gain) loss (38,533) 131,722 (323) Equity in earnings of affiliates (1,132,458) (763,396) (9,507) Changes in assets and liabilities:
Decrease (Increase) in – Accounts receivable - trade 9,513,599 1,407,818 79,866 – Inventories (247,482) (2,072,878) (2,078) – Consumption taxes refund receivable 34,700 (51,674) 291
Increase (Decrease) in – Accounts payable - trade (2,992,121) 7,614,825 (25,119)
Bonuses paid to directors (18,000) (13,000) (151) Other, net 2,637,461 1,424,803 22,142
12,595,277 14,366,641 105,736 Interest and dividend received 2,593,165 1,132,849 21,769 Interest paid (2,478,193) (1,513,965) (20,804) Income taxes paid (994,213) (2,107,517) (8,346)
Net cash provided by operating activities 11,716,036 11,878,008 98,355
The accompanying notes are an integral part of these statements.

Thousands of Japanese yen Thousands of U.S. dollars
2006 2005 2006 CASH FLOWS FROM INVESTING
ACTIVITIES: Purchases of property and equipment and
intangible assets ¥(1,384,713) ¥(4,399,785) $(11,625) Purchases of investments in affiliates (2,535,886) (2,613,862) (21,288) Disbursement of short-term loans receivable (12,572,739) - (105,547) Decrease (Increase)in short-term loans
receivable 6,124,975 10,699,185 51,419 Disbursement of long-term loans receivable (32,315,137) (25,660,021) (271,282) Collection of long-term loans receivable 28,476,911 426,203 239,061 Purchases of investment in subsidiaries (5,836,635) - (48,998) Other, net 0 (1,500) (1)
Net cash used in investing activities (20,043,224) (21,549,780) (168,261) CASH FLOWS FROM FINANCING
ACTIVITIES: Increase in short-term loans payable 5,963,515 13,853,314 50,063 Proceeds from long-term loans payable 10,010,576 3,075,259 84,038 Repayment of long-term loans payable (3,052,688) (8,225,701) (25,627) Issuance of shares - 10,679,122 - Cash dividends paid to minority interests (632,527) (81,202) (5,310) Cash dividends paid (420,837) (297,379) (3,533) Other, net (166) (316) (1)
Net cash provided by financing activities 11,867,873 19,003,097 99,630 EFFECT OF EXCHANGE RATE CHANGES ON
CASH AND CASH EQUIVALENTS 223,651 1,668,696 1,877 NET INCREASE IN CASH AND CASH
EQUIVALENTS 3,764,336 11,000,021 31,601 CASH AND CASH EQUIVALENTS AT
BEGINNING OF YEAR 25,061,948 14,061,927 210,392 INCREASE IN CASH AND CASH
EQUIVALENTS DUE TO ADDITIONAL EXCLUSION OF CONSOLIDATED SUBSIDIARIES 1,077 - 10
CASH AND CASH EQUIVALENTS AT END OF YEAR ¥28,827,361 ¥25,061,948 $242,003
The accompanying notes are an integral part of these statements.

MODEC, Inc. and Consolidated Subsidiaries
NOTES TO CONSOLIDATED FINANCIAL STATEMENTS
1. Significant Accounting and Reporting Policies
(a) Basis of Presenting Consolidated Financial Statements
The accompanying consolidated financial statements of MODEC, Inc. (the “Company) have been prepared in accordance with the provisions set forth in the Japanese Securities and Exchange Law and its related accounting regulations, and in conformity with accounting principles generally accepted in Japan, which are different in certain respects as to application and disclosure requirements of International Financial Reporting Standards.
The accounts of overseas subsidiaries are based on their accounting records maintained in conformity with generally accepted accounting principles prevailing in the respective countries of domicile. The accompanying consolidated financial statements have been restructured and translated into English (with some expanded descriptions and the inclusion of consolidated statements of shareholders' equity) from the consolidated financial statements of the Company prepared in accordance with Japanese GAAP and filed with the appropriate Local Finance Bureau of the Ministry of Finance as required by the Securities and Exchange Law. Some supplementary information included in the statutory Japanese language consolidated financial statements, but not required for fair presentation, is not presented in the accompanying consolidated financial statements.
The translations of the Japanese yen amounts into U.S. dollars are included solely for the convenience of readers outside Japan, using the prevailing exchange rate at December 31, 2006, which was ¥119.12 to U.S. $1. The convenience translations should not be construed as representations that the Japanese yen amounts have been, could have been, or could in the future be, converted into U.S. dollars at this or any other rate of exchange.
(b) Principles of Consolidation and Equity Method
The accompanying consolidated financial statements include the accounts of the Company and 19 of its subsidiaries for the year ended December 31, 2006 and 2005. Material inter-company balances, transactions and profits have been eliminated in consolidation.
Investments in all of significant unconsolidated subsidiaries and affiliates, which were 14 companies for the year ended December 31, 2006 and 10 companies for the year ended December 31, 2005, were accounted for by using the equity method.

The consolidated financial statements are required to include the accounts of the Company and significant companies that are controlled by the Company through substantial ownership of more than 50% of the voting rights or through ownership of a high percentage of the voting rights, even if it is equal to or less than 50%, and existence of certain conditions evidencing control by the Company of decision-making bodies of such companies.
Investments in significant unconsolidated subsidiaries and affiliates, of which the Company has ownership of 20% or more but less than or equal to 50%, and of 15% or more and less than 20% and can exercise significant influences over operating financial policies of investees, have been accounted for by the equity method.
All consolidated subsidiaries have the same balance sheet date, December 31, corresponding with that of the Company.
(c) Valuation of Assets and Liabilities of Subsidiaries
In the elimination of investments in subsidiaries, the assets and liabilities of the subsidiaries, including the portion attributable to minority shareholders, were evaluated using the fair value at the time the Company acquired the control of the respective subsidiaries.
(d) Consolidation Goodwill
The differences between cost and net assets acquired of consolidated subsidiaries and affiliated companies which are accounted for by using the equity method are recognized as consolidation goodwill and amortized using the straight-line method over estimated useful lives, except that goodwill recognized in a consolidated subsidiary in the U.S.A. is treated in accordance with U.S. GAAP.
(e) Securities
In accordance with the Japanese accounting standard for financial instruments, all companies required to examine the intent of holding each security and classify those securities as (a) securities held for trading purposes (hereafter, “trading securities”), (b) debt securities intended to be held to maturity (hereafter, “held-to-maturity debt securities”), (c) equity securities issued by unconsolidated subsidiaries and affiliated companies, and (d) all other securities that are not classified in any of the above categories (hereafter, “available-for-sale securities”).
Based on the examination of the intent of holding, the Company classifies its securities as equity securities issued by unconsolidated subsidiaries and affiliated companies and available-

for-sale securities. Available-for-sale securities maturing within one year from the balance sheet date are included in current assets. Other securities are included in investments securities. The Company does not have trading securities or held-to-maturity debt securities.
Equity securities issued by unconsolidated subsidiaries and affiliated companies that are not accounted for by equity method are stated at moving-average cost. Available-for-sale securities with available fair market values are stated at fair market value as of balance sheet dates. Unrealized gains and losses on these securities are reported, net of applicable income taxes, as a separate component of shareholders’ equity. Realized gains and losses on sale of such securities are computed using moving-average cost. Available-for-sale securities without available fair market values are stated at moving-average cost.
(f) Inventories
Both raw materials and costs of uncompleted contracts are stated at cost, determined on an individual project basis.
(g) Property and Equipment
Property and equipment are carried substantially at cost. Depreciation of Floating Production Storage & Offloading System (“FPSO”) and Floating Storage & Offloading System (“FSO”), owned by the consolidated overseas subsidiaries are calculated by using the straight-line method based on their lease term or their economic useful lives.
Depreciation of property and equipment other than FPSO and FSO is calculated as follows. The Company depreciates property and equipment using the declining-balance method based on their useful lives and residual value prescribed by the Japanese corporation tax laws and regulations, except that buildings, acquired after March 31, 1998, are depreciated using the straight-line method. Consolidated overseas subsidiaries depreciate property and equipment using the straight-line method based on their useful lives.
(h) Intangible Assets
The Company amortizes software costs using the straight-line method over the estimated useful life (5 years), and amortizes intangible assets using the straight-line method based on their useful lives and residual value prescribed by the Japanese corporation tax laws and regulations.
Goodwill of a consolidated overseas subsidiary is amortized using the straight-line method based on the terms of an agreement.
Mining rights of a consolidated overseas subsidiary is amortized using the production method based on the amount of production forecast.
(i) Allowance for Bad Debts
The Company provides for a sufficient allowance for bad debts to cover probable losses on collection by estimating uncollectable amounts individually in addition to amounts for possible losses based on actual losses on collection in the past.
(j) Accrued Employees’ Bonuses
The Company accrues employees’ bonuses based on the estimated amounts to be paid in the subsequent period.
(k) Provision for Product Warranty
Provision for product warranty is provided based on the estimated amounts for covering the probable product warranties.
(l) Severance and Retirement Benefits for Employees
The Company has an unfunded lump-sum severance and retirement payment plan for employees. The Company and some overseas consolidated subsidiaries also adopt defined contribution pension plans. Under the plan, employees whose employment is terminated or who retire are entitled to benefits which are, in general, determined on the basis of length of service and current basic salary at the time of termination or retirement. If the termination is involuntary, the employees are generally entitled to larger benefits than in the case of voluntary termination or retirement.
The Company provides allowance for employees’ severance and retirement benefits based on the estimated amount of projected benefit obligation at the balance sheet date.
(m) Severance and Retirement Benefits for Directors and Corporate Auditors
Subject to shareholders’ approval, directors and corporate auditors customarily receive lump-sum payments upon retirement under an unfunded retirement allowances plan.

The Company records severance and retirement benefits for directors and corporate auditors at the amounts payable if all directors and corporate auditors voluntarily terminated their employment at the balance sheet date.
(n) Translation of Foreign Currency Accounts
Foreign currency transactions are translated into Japanese yen using the exchange rate in effect at the time of each transaction or at the applicable exchange rates under forward exchange contracts.
Assets and liabilities denominated in foreign currencies are translated into Japanese yen at the year-end exchange rate, and the resulting gains or losses are included in other income (expenses) in the statement of income.
Financial statements of consolidated overseas subsidiaries are translated into Japanese yen using the exchange rates prevailing at the end of each fiscal year, except the exchange rates in effect at the date of transactions are used for shareholders’ equity. The Company records foreign currency translation adjustments in the shareholders’ equity.
(o) Finance Lease Transactions without Transfer of Ownership
Finance lease transactions, other than those that transfer ownership of the leased property to the lessee, are accounted for in the same way as operating lease transactions.
(p) Derivative Transactions and Hedge Accounting
Derivative financial instruments of the Company are stated at fair value and gains or losses are recognized for changes in the fair value unless derivative financial instruments are used for hedging purposes.
If derivative financial instruments are used as hedges and meet certain hedging criteria, the Company defers recognition of gains or losses resulting from changes in fair value of derivative financial instruments until the related losses or gains on the hedged items are recognized.
However, in cases where forward foreign exchange contracts are used as hedges and meet certain hedging criteria, forward foreign exchange contracts and hedged items are accounted for in the following manner.
1) If a forward foreign exchange contract is executed to hedge existing foreign currency receivables or payables,

a) the difference, if any, between the Japanese yen amount of the hedged foreign currency receivable or payable translated using the spot rate at the inception date of the contract and the book value of the receivable or payable is recognized in the income statement in the period which includes the inception date, and
b) the discount or premium on the contract (that is, the difference between the Japanese yen amount of the contract translated using the contracted forward rate and that translated using the spot rate at the inception date of the contract) is recognized over the term of the contract.
2) If a forward foreign exchange contract is executed to hedge a future transaction denominated in a foreign currency, the future transaction will be recorded using the contracted forward rate, and no gains or losses on the forward foreign exchange contract are recognized.
Also, if interest rate swap contracts are used as hedges and meet certain hedging criteria, the net amount to be paid or received under the interest rate swap contract is added to or deducted from the interest on the assets or liabilities for which the swap contract was executed.
Some consolidated overseas subsidiaries adopt hedge accounting in accordance with U.S.GAAP.
(q) Revenue Recognition
The Company recognizes revenues on contracts by the completed contract method, except for those items whose contract amount is over 1 billion yen and whose term of construction is over one year in which cases the percentage of completion method is used.
The U.S.A. consolidated subsidiary recognizes revenues on all contracts by the percentage of completion method.
(r) Income Taxes
The Company provides income taxes at the amounts currently payable based on taxable income for tax purposes that may be different from income for the accounting purposes. The Company recognizes tax effects of temporary differences between the carrying amounts of assets and liabilities for tax and financial reporting purposes. The asset and liability approach is used to recognize deferred tax assets and liabilities for the expected future tax consequences of temporary differences between the carrying amounts of assets and liabilities for financial reporting purposes and the amounts used for income tax purposes.

(s) Cash Flow Statement
In preparing the consolidated statements of cash flows, cash on hand, readily available deposits and short-term highly liquid investments with maturities not exceeding three months at the time of purchase are considered to be cash and cash equivalents.
Reconciliations of cash and time deposits shown in the consolidated balance sheets and cash and cash equivalents in the consolidated statements of cash flows as of December 31, 2006 and 2005 were as follows:
Thousands of Japanese Yen
Thousands of U.S. dollars
2006 2005 2006 Cash and time deposits ¥28,827,361 ¥25,061,948 $242,002
Cash and cash equivalents ¥28,827,361 ¥25,061,948 $242,002
(t) Accounting Changes in Basic of Presenting Consolidated Financial Statements
1) ACCRUED BONUSES TO DIRECTORS AND CORPORATE AUDITORS
Effective the year ended December 31, 2006, the Company has adopted an accounting standard for directors’ bonuses.
The standard requires that directors’ bonuses be accounted for as an expense of the accounting period in which such bonuses were accrued.
As a result, operating profit, income before income taxes and minority interests and net income decreased by ¥18,000 thousand ($151 thousand) compared with the amounts which would have been recorded under the previous method.
2) PRESENTATION OF NET ASSETS IN THE BALANCE SHEET
Effective the year ended December 31, 2006, the Company has adopted an accounting standard for presentation of net assets in the balance sheet.
The amount corresponding to total net assets for the year ended December 31, 2006 and 2005 under the previous standards were ¥40,849,462 thousand ($342,927 thousand) and ¥37,843,656 thousand, respectively. However, the adoption of this standard had no material effect on the statement of income for the year ended December 31, 2006.
This standard requires that balance sheets be presented as follows;

1. The balance sheet is divided into “Assets,” “Liabilities,” and “Net assets” section. “Net assets” is divided into “Shareholders’ equity,” “Accumulated gains from valuation and transaction adjustments,” and “Minority interests in consolidated subsidiaries.”
2. “Shareholders’ equity” is divided into “Common stock,” “Capital surplus,” “Retained earnings” and “Treasury stock, at cost.”
3. “Accumulated gains from valuation and transaction adjustments” is divided into “Unrealized holding gain on securities,” “Deferred losses on derivative financial instruments used for hedge accounting” and “Foreign currency transaction adjustments.”
(u) Reclassification
Certain reclassifications have been made to the previously reported fiscal 2005 amounts to conform to fiscal 2006 presentation. These reclassifications had no effect on previously reported net income or total shareholders’ equity.
2. Inventories
Inventories as of December 31, 2006 and 2005 consisted of the following:
Thousands of Japanese Yen
Thousands of U.S. dollars
2006 2005 2006 Raw materials ¥2,039,603 ¥1,836,861 $17,122 Costs of uncompleted contracts 478,596 401,133 4,018
¥2,518,199 ¥2,237,994 $21,140
3. Marketable Securities and Investment Securities
(a) The following tables summarize acquisition costs, book values (fair values) of securities with available fair values as of December 31, 2006 and 2005
Thousands of Japanese Yen
2006 Acquisition
cost Book value Differences
Available-for-sale securities: Securities with book values
exceeding acquisition costs: Equity securities ¥310,587 ¥1,633,216 ¥1,322,629
Total ¥310,587 ¥1,633,216 ¥1,322,629

Thousands of Japanese Yen
2005 Acquisition
cost Book value Differences
Available-for-sale securities: Securities with book values
exceeding acquisition costs: Equity securities ¥310,587 ¥1,777,020 ¥1,466,433
Total ¥310,587 ¥1,777,020 ¥1,466,433
Thousands of U.S. dollars
2006: Acquisition
cost Book value Differences
Available-for-sale securities: Securities with book values
exceeding acquisition costs: Equity securities $2,607 $13,711 $11,103
Total $2,607 $13,711 $11,103
(b) The following table summarizes book values of securities with no available fair values as of
December 31, 2006 and 2005
Thousands of Japanese Yen Thousands of U.S. dollars
2006 2005 2006 Available-for-sale securities: Unlisted equity securities ¥ 200,111 ¥ 200,000 $ 1,680 Investments in non-consolidated subsidiaries and affiliates: 9,293,885 6,486,459 78,021
Total ¥9,493,996 ¥ 6,686,459 $79,701
4. Consolidation Goodwill
Consolidation goodwill included in intangible assets as of December 31, 2006 and 2005 were ¥7,238,064 thousand ($60,763 thousand) and ¥3,866,433 thousand, respectively.
5. Loans Payable
Short-term loans payable represent notes payable to banks due generally in twelve months and bearing an average interest rate of 6.1% and 5.1% as of December 31, 2006 and 2005, respectively.
Long-term loans payable as of December 31, 2006 and 2005 are summarized below:

Thousands of Japanese Yen
Thousands of U.S. dollars
2006 2005 2006
Loans from banks and others, at average rate of 5.9% due through 2008 ¥15,777,929 ¥9,585,485 $132,454 Less: Current portion included in current
liabilities (2,955,844) (3,107,316) (24,814)
¥12,822,085 ¥6,478,169 $107,640
The aggregate annual maturities of long-term loans payable are summarized below:
Year ended December 31, Thousands of Japanese Yen
Thousands of U.S. dollars
2007 ¥ 2,955,844 $ 24,814 2008 12,822,085 107,640
¥15,777,929 $132,454
6. Lending Commitment
The Company has a commitment line provided by co-financing consisted of five correspondent financial institutions for the purpose of efficient providing operating funds. The commitment line amount is $150,000 thousand, and the amount of loans as of December 31, 2006 is $116,092 thousand.
7. Net Assets
Japanese Corporate Law (“the Law”) became effective on May 1, 2006, replacing the Japanese Commercial Code (“the Code”).
Under the Japanese laws and regulations, the entire amount paid for new shares is required to be designated as common stock. However, a company may, by a resolution of the Board of Directors, designate an amount not exceeding one-half of the price of the new shares as additional paid-in capital, which is included in capital surplus.
Under the Law, in cases where dividend distribution of surplus is made, the smaller of an amount equal to 10% of the dividend and the excess, if any, of 25% of common stock over the total of additional paid-in-capital and legal earnings reserve must be set aside as additional paid-in-capital

or legal earnings reserve. Legal earnings reserve is included in retained earnings in the accompanying consolidated balance sheets.
Under the Code, companies were required to set aside an amount equal to at least 10% of cash dividends and other cash appropriations as legal earnings reserve until the total of legal earnings reserve and additional paid-in-capital equaled 25% of common stock.
Under the Code, legal earnings reserve and additional paid-in capital could be used to eliminate or reduce a deficit by a resolution of the shareholders’ meeting or could be capitalized by a resolution of the Board of Directors. Under the Law, both of these appropriations generally require a resolution of the shareholders’ meeting.
Additional paid-in capital and legal earnings reserve may not be distributed as dividends. Under the Code, however, additional paid-in capital and legal earnings reserve may be transferred to retained earnings by the resolution of the shareholders’ meeting as long as the total amount of legal earnings reserve and additional paid-in capital remained equal to or exceeded 25% of common stock. Under the Law, all additional paid-in capital and all legal earnings reserve may be transferred to other capital surplus and retained earnings, respectively, which are potentially available for dividends.
The maximum amount that the Company can distribute as dividends is calculated based on the non-consolidated financial statements of the Company in accordance with the Law.
At the annual shareholders’ meeting held on March 29, 2007, the shareholders resolved cash dividends amounting to ¥233,798 thousand ($1,963 thousand). Such appropriations have not been accrued in the consolidated financial statements as of December 31, 2006, and are recognized in the period in which they were resolved.
8. Per Share Data
Net income per share is calculated based on the weighted average number of shares of common stock outstanding during the fiscal year.
Diluted net income per share reflects the effect of potential dilution that could occur if securities or other contracts to issue common stock were exercised or converted into common stock. There is no outstanding potential common stock for the year ended December 31, 2006 and 2005.

9. Severance and Retirement Benefits for Employees
The company has an unfunded lump-sum severance and retirement payment plan for employees. The Company and some overseas consolidated subsidiaries also adopt defined contribution pension plans. In accordance with the Japanese accounting standard for employees’ severance and pension benefits, a “simpler method” can be adopted to calculate severance and retirements benefits employees if the number of employees is less than 300. Therefore the Company adopts the “simpler method”, and records severance and retirement benefits for employees at the amounts payable if all employees voluntarily terminated their employment at the balance sheet date. None of the consolidated subsidiaries have any termination and retirement allowances plan for employees.
The severance and retirement benefits for employees included in the liability section of the consolidated balance sheets as of December 31, 2006 and 2005 consisted of the following:
Thousands of Japanese Yen Thousands of U.S. dollars
2006 2005 2006
Projected benefit obligation ¥125,594 ¥113,839 $1,054 Severance and retirement benefits for
employees ¥125,594 ¥113,839 $1,054
Severance and retirement benefit expenses included in the consolidated statements of income for the years ended December 31, 2006 and 2005 were comprised of the following:
Thousands of Japanese Yen Thousands of U.S. dollars
2006 2005 2006
Service costs – benefits earned during the year ¥23,099 ¥22,638 $193
Others 27,346 11,180 230
Severance and retirement benefit expenses ¥50,445 ¥33,818 $423
10. Research and Development Costs
Costs relating to research and development activities charged to income for the years ended December 31, 2006 and 2005 are ¥18,586 thousand ($156 thousand) and ¥17,108 thousand, respectively.

11. Income Taxes
The normal statutory income tax rate in Japan arising out of the aggregation of corporate, enterprise and inhabitants taxes are 41% for the year ended December 31, 2006 and 2005.
The following table summarizes the significant differences between the statutory tax rate and the Company and its consolidated subsidiaries’ effective tax rate for financial statement purposes for the years ended December 31, 2006 and 2005:
2006 2005
Statutory tax rate 41.0% 41.0%
Non-deductible expenses for tax purposes 0.3 0.3 Additional payment or refund based on tax examination – 0.1 Offset of dividends from overseas consolidated subsidiaries 10.1 6.2 Taxation on revenue basis of foreign subsidiaries – 4.8 Non-deductible income excluded from accounting purposes (4.9) – Deductible expenses excluded from accounting purposes (3.5) 1.9 Income of foreign subsidiaries taxed at lower than
Japanese normal rate (3.8) (8.9) Credit for foreign taxes (6.5) (5.9) Tax loss carry forward 2.6 1.8 Equity in earning of affiliates (9.9) (5.8) Realization of tax loss carry forward – (2.1) Undistributed profits in a tax heaven 0.2 – Others (1.7) 0.8
Effective tax rate 23.9% 34.2%
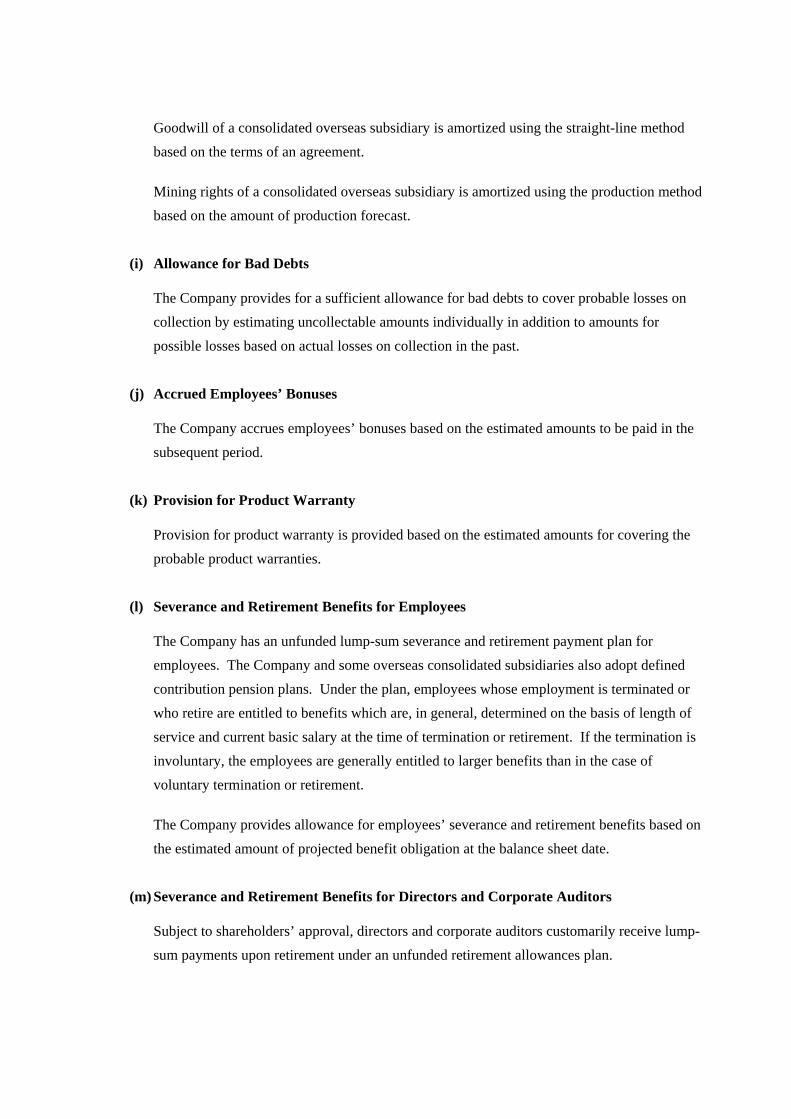
Significant components of deferred tax assets and liabilities as of December 31, 2006 and 2005 were as follows:
Thousands of Japanese Yen
Thousands of U.S. dollars
2006 2005 2006 Deferred tax assets:
Current assets: Enterprise tax payable ¥ 146,366 - $1,229 Accrued employees’ bonuses 29,717 ¥ 19,469 249 Provision for product warranty 286,307 31,152 2,404 Undistributed profits in a tax haven - - - Tax loss carry forward - 194,534 - Credit for foreign taxes - 156,440 - Foreign exchange losses 93,038 22,077 781 Others 76,623 28,318 643
Sub total 632,051 451,990 5,306
Valuation Allowance (27,397) - (230) Offset to deferred tax liabilities (short-term) (269,649) (295,795) (2,264)
Total 335,005 156,195 2,812 Fixed assets:
Unrealized inter-company profit on fixed assets 1,339,169 868,100 11,242
Tax loss carry forward 488,310 273,698 4,099 Depreciation 20,549 280,649 173 Severance and retirement benefits for
employees 51,494 44,807 432 Severance and retirement benefits for
directors and corporate auditors 77,765 - 653 Others 145,527 270,467 1,223
Sub total 2,122,814 1,737,721 17,822 Valuation allowance (508,859) (295,886) (4,272) Offset to deferred tax liabilities (long-term) (274,786) (96,323) (2,307)
Total 1,339,169 1,345,512 11,243
Total deferred tax assets ¥1,674,174 ¥1,501,707 $14,055
Deferred tax liabilities:
Current liabilities: Reduction of tax rate in foreign subsidiaries ¥ (7,941) ¥ (121,229) $(67) Refund repair costs - (81,412) - Foreign exchange gains (269,649) (606,263) (2,264) Others - (212,610) -
Sub total (277,590) (1,021,514) (2,331) Offset to deferred tax assets (short-term) 269,649 295,795 2,264
Total (7,941) (725,719) (67) Long-term liabilities:
Finance lease (691,522) (962,548) (5,805) Depreciation (2,140,375) - (17,968) Net unrealized holding gains on securities (542,278) (601,237) (4,552) Others (67,748) (80,720) (570)
Sub total (3,441,923) (1,644,505) (28,895) Offset to deferred tax assets (long-term) 274,786 96,323 2,307
Total (3,167,137) (1,548,182) (26,588) Total deferred tax liabilities (3,175,078) (2,273,901) (26,655)
Net deferred tax liabilities ¥(1,500,904) ¥(772,194) $(12,600)

12. Contingent Liabilities and Commitments
As of December 31, 2006 and 2005, the Company was contingently liable for the following:
Thousands of Japanese Yen
Thousands of U.S. dollars
2006 2005 2006 Guarantees of bank loans and other
indebtedness ¥3,762,137 ¥510,450 $31,583
13. Leases
(a) As Lessee
i) Information on a “as if capitalized” basis of leased property such as acquisition cost, accumulated depreciation, obligations under finance leases and depreciation equivalent of finance leases that do not transfer ownership of the leased property to the lessee for the years ended December 31, 2006 and 2005, were as follows:
Thousands of Japanese Yen
2006:
Buildings and
equipment Total
Acquisition cost ¥9,700 ¥9,700 Accumulated depreciation (8,873) (8,873)
Net leased property ¥ 827 ¥ 827
Thousands of Japanese Yen
2005:
Buildings and
equipment Total
Acquisition cost ¥9,700 ¥9,700 Accumulated depreciation (8,070) (8,070)
Net leased property ¥ 1,630 ¥ 1,630
Thousands of U.S. dollars
2006:
Buildings and
equipment Total
Acquisition cost $81 $81 Accumulated depreciation (74) (74)
Net leased property $ 7 $ 7

ii) Obligations under finance leases:
Thousands of Japanese Yen
Thousands of U.S. dollars
2006 2005 2006
Due within one year ¥ 707 ¥ 906 $6 Due after one year 412 942 3
Total ¥1,119 ¥1,848 $9
iii) Annual lease payments and depreciation equivalent:
Thousands of Japanese Yen
Thousands of U.S. dollars
2006 2005 2006
Annual lease payments ¥906 ¥3,094 $8 Depreciation equivalent 803 2,820 7 Interest expense equivalent 65 174 1
Depreciation equivalent is computed by a straight-line method over the lease period with no residual value. The difference between total lease payments and acquisition costs under finance leases is recognized as interest expense equivalent, which is allocated to relevant accounting period based on the interest method.
(b) As Lessor
Future lease receivables from operating lease transactions as of December 31, 2006 and 2005, were as follows:
Thousands of Japanese Yen
Thousands of U.S. dollars
2006 2005 2006
Due within one year ¥920,559 ¥1,474,165 $7,728 Due after one year - 9,731,307 -
Total ¥920,559 ¥11,205,472 $7,728
14. Derivative Transactions of the Company and its Consolidated Subsidiaries
The Company and its consolidated subsidiaries utilize forward foreign currency contracts in order to hedge currency fluctuation risks arising from export of products in addition to hedging through increases in overseas production and overseas procurement of materials.

The Company and its consolidated subsidiaries also utilize interest rate swaps as derivative transactions in order to hedge interest rate risks of bonds and loans payable.
As the derivative transactions are made solely with leading financial institutions, the Company and its consolidated subsidiaries do not expect any credit risks.
The Company follows its internal regulations for derivatives, which stipulates the policy, objective, scope, organization, procedures, and financial institutions to deal with, and has a reporting system for derivative transactions reflecting proper internal control functions.
The following summarizes hedging derivative financial instruments used and items hedged:
Hedging instruments: Hedged items: Forward foreign exchange contracts Foreign currency receivables and payables
including future transactions Currency swap contracts Foreign currency receivables and payables Interest rate swap contracts Foreign currency bonds and loans payable
The Company evaluates hedge effectiveness on a semi-annual basis by comparing the cumulative changes in cash flows from or the changes in fair value of hedged items with the corresponding changes in the hedging derivative instruments.
Also, if interest rate swap contracts are used as hedges and meet certain hedging criteria, the net amount to be paid or received under the interest rate swap contract is added to or deducted from the interest on the assets or liabilities for which the swap contract was executed.
Some consolidated overseas subsidiaries adopt hedge accounting in accordance with U.S.GAAP.
The following tables summarize market value information as of December 31, 2006 and 2005 of derivative transactions for which hedge accounting has not been applied:
Thousands of Japanese Yen Notional amount
2006: Total Due after one year
Market value
Unrealized gain (loss)
Currency related derivatives: Forward contracts:
To sell U.S. dollars ¥18,686,396 – ¥18,693,247 ¥6,851
¥6,851

Thousands of Japanese Yen Notional amount
2005: Total Due after one year
Market value
Unrealized gain (loss)
Currency related derivatives: Forward contracts:
To sell U.S. dollars ¥5,316,056 – ¥5,348,855 (¥34,986)
(¥34,986)
Thousands of U.S. dollars Notional amount
2006: Total Due after one year
Market value
Unrealized gain (loss)
Currency related derivatives: Forward contracts:
To sell U.S. dollars $156,870 – $156,928 $58
$58
15. Segment Information
Industry segment information for the years ended December 31, 2006 and 2005 is not disclosed because the Company and its consolidated subsidiaries operate a single business relevant to floating production facilities.
Geographical segment information by area for the years ended December 31, 2006 and 2005 is as follows:
Thousands of Japanese Yen
2006: Japan Asia
Central and
South America
North America Others Total
Corporate and
Elimination Consolidated
Sales: Outside customers ¥27,524,177 ¥ 6,969,218 ¥ 2,204,392 ¥62,451,547 – ¥99,149,334 – ¥ 99,149,334Inter segment 1,375,504 – – 1,152,685 – 2,528,189 ¥ (2,528,189) –
Total 28,899,681 6,969,218 2,204,392 63,604,232 – 101,677,523 (2,528,189) 99,149,334
Operating expenses 27,001,126 6,667,815 1,451,382 63,133,327 ¥ 47,962 98,301,612 (2,646,682) 95,654,930
Operating profit ¥ 1,898,555 301,403 753,010 470,905 (47,962) 3,375,911 118,493 3,494,404
Assets ¥85,264,440 ¥8,357,130 ¥8,909,224 ¥31,359,747 ¥4,188,855 ¥138,079,396 ¥ (14,729,144) ¥123,350,252
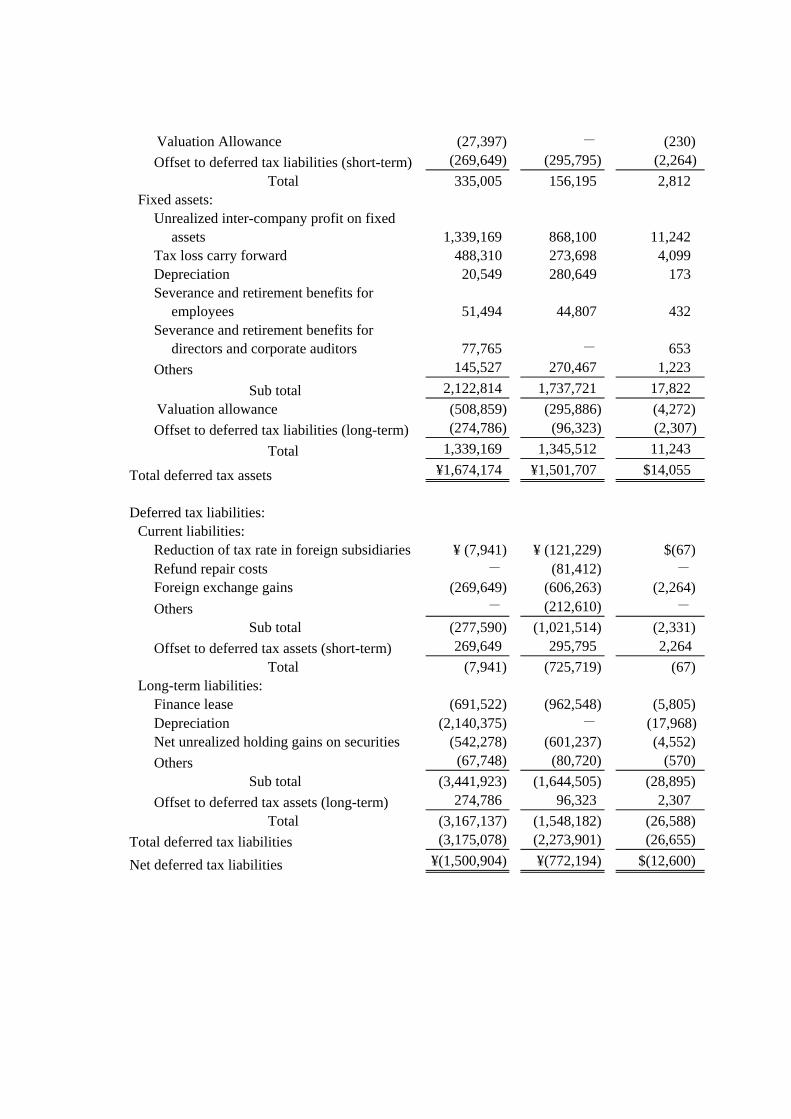
Thousands of Japanese Yen
2005: Japan Asia
Central and
South America
North America Others Total
Corporate and
Elimination Consolidated
Sales: Outside customers ¥19,314,068 ¥ 8,416,882 ¥ 2,497,624 ¥41,385,592 – ¥71,614,166 – ¥ 71,614,166Inter segment 4,588,182 – – 1,107,069 – 5,695,251 ¥ (5,695,251) –
Total 23,902,250 8,416,882 2,497,624 42,492,661 – 77,309,417 (5,695,251) 71,614,166
Operating expenses 23,517,371 6,726,316 1,406,035 41,399,583 ¥ 32,814 73,082,119 (5,363,493) 67,718,626
Operating profit ¥ 384,879 1,690,566 1,091,589 1,093,078 (32,814) 4,227,298 (331,758) 3,895,540
Assets ¥72,208,210 ¥13,592,948 ¥12,295,612 ¥20,747,989 ¥1,921,812 ¥120,766,571 ¥ (16,067,917) ¥104,698,654
Thousands of U.S. dollars
2006: Japan Asia
Central and
South America
North America Others Total
Corporate and
Elimination Consolidated
Sales: Outside customers $231,063 $58,506 $18,505 $524,274 – $832,348 – $832,348Inter segment 11,547 – – 9,677 – 21,224 $(21,224) –
Total 242,610 58,506 18,505 533,951 – 853,572 (21,224) 832,348
Operating expenses 226,672 55,976 12,184 529,998 $ 402 825,232 (22,219) 803,013
Operating profit $ 15,938 $2,530 $ 6,321 $ 3,953 $(402) $ 28,340 $ 995 $ 29,335
Assets $715,786 $70,157 $74,792 $263,262 $35,165 $1,159,162 $(123,649) $1,035,513
The overseas sales of the Company and its consolidated subsidiaries for the years ended December 31, 2006 and 2005 consisted of the following:
Thousands of Japanese Yen
2006: Asia Africa Oceania
Central and
South America
North America Total
Overseas sales ¥11,530,157 ¥5,535,961 ¥22,366,557 ¥45,345,362 ¥14,353,053 ¥99,131,090
Consolidated sales - - - - - ¥99,149,334
The ratio of consolidated sales 11.6% 5.6% 22.6% 45.7% 14.5% 100.0%
Thousands of Japanese Yen
2005: Asia Africa Oceania
Central and
South America
North America Total
Overseas sales ¥7,883,375, ¥20,821,801 ¥13,414,920 ¥28,880,883 ¥588,397 ¥71,589,376
Consolidated sales - - - - - ¥71,614,166
The ratio of consolidated sales 11.0% 29.1% 18.8% 40.3% 0.8% 100.0%

Thousands of U.S. dollars
2006: Asia Africa Oceania
Central and
South America
North America Total
Overseas net sales $96,794 $46,474 $187,765 $380,670 $120,492 $832,195
Consolidated sales - - - - - $832,348
The ratio of consolidated sales 11.6% 5.6% 22.6% 45.7% 14.5% 100.0%
16. Related Party Transactions
Significant related party transactions and corresponding balances between the Company and unconsolidated subsidiaries and affiliates for the year ended December 31, 2006 and 2005 are as follows:
Thousands of Japanese Yen
Thousands of U.S. dollars
Related party Transactions 2006 2005 2006 Jasmine FPSO PTE LTD. Plant and Equipment Investment ¥606,321 - $5,090MODEC FPSO B.V. Construction of FPSO 27,178 ¥53,643 228MODEC FPSO B.V. Guarantees of bank loans 347,213 - 2,915Rong Doi MV12 PTE LTD. Rong Doi MV12 PTE LTD.
Construction of FSO Plant and Equipment Investment
4,155,3582,480,642
- -
34,88420,825
Rong Doi MV12 PTE LTD. Guarantees of bank Loans 3,414,923 - 28,668Espadarte MV14 B.V. Construction of FPSO 275,763 - 2,315Espadarte MV14 B.V. Plant and Equipment Investment 2,757,952 - 23,153PRA-1 MV15 B.V. Construction of FSO 221,645 - 1,861PRA-1 MV15 B.V. Plant and Equipment Investment 3,281,342 - 27,547Stybarrow MV16 B.V. Construction of FPSO 20,386,042 8,458,765 171,139Stybarrow MV16 B.V. Plant and Equipment Investment 6,735,806 - 56,546IMC-MODEC JV 1 INC. Plant and Equipment Investment 392,500 - 3,295Rang Dong MV17 B.V. Construction of FSO 1,729,317 - 14,517

Thousands of Japanese Yen
Thousands of U.S. dollars
Related party Balances 2006 2005 2006 Jasmine FPSO PTE LTD. Long-term loans receivable ¥1,368,370 ¥1,957,285 $11,487MODEC FPSO B.V. Accounts receivable - trade 1,890,290 2,477,603 15,869MODEC FPSO B.V. Long-term loans receivable 1,995,260 1,977,673 16,750MODEC VENTURE 10 B.V. Long-term loans receivable 2,382,400 2,361,400 20,000MODEC VENTURE 11 B.V. Long-term loans receivable 1,300,790 1,289,324 10,920Rong Doi MV12 PTE LTD. Accounts receivable - trade 17,117 - 144Rong Doi MV12 PTE LTD. Short-term loans receivable 30,769 - 258Espadarte MV 14 B.V. Short-term loans receivable 14,268,398 - 119,782Espadarte MV14 B.V. Long-term loans receivable - 11,408,986 -
PRA-1 MV 15 B.V. Short-term loans receivable 12,000,926 - 100,747PRA-1 MV 15 B.V. Long-term loans receivable - 8,642,724 -
Stybarrow MV16 B.V. Accounts receivable - trade 617,060 7,029,790 5,180Stybarrow MV16 B.V. Long-term loans receivable 6,735,806 - 56,546IMC-MODEC JV 1 INC. LTD.
Short-term loans receivable 1,274,703 - 10,701
Rang Dong MV17 B.V. Accounts receivable - trade 1,729,317 - 14,517