model-based emissions management...
TRANSCRIPT

1
MODEL-BASED EMISSIONS MANAGEMENT SYSTEMS: MANAGING ENERGY, EMISSIONS, AND REGULATORY REPORTING IN GAS
PROCESSING
Alberto Alva-Argaez and James Holoboff Process Ecology Inc.
Calgary, Alberta, Canada
Glenda Kowlessar Encana
Calgary, Alberta, Canada
Piyush Shah Aspentech
Houston, Texas, U.S.A.
ABSTRACT Emissions reduction is one of the most serious challenges industry is currently facing and there is a need for decision support tools to assist operating companies in the identification of the most promising opportunities for improvement. The integration of process simulation models with internet technologies can result in emissions management systems that enable rapid analysis and identification of emissions reduction opportunities. Using simulation software such as Aspen HYSYSTM, chemical species of interest (benzene, methane, H2S, etc.) can be traced based on their thermodynamic and transport properties. The potential for emissions reductions is very significant once reliable and actionable information is available. Currently available systems have been instrumental in improving emissions reporting; however, these tools (usually based on average emission factors) do not have the resolution required for opportunity identification and are likely to result in misleading conclusions. Simulation models can, however, provide the resolution to capture the opportunities and avoid incorrect assumptions. Process Ecology has developed an innovative methodology to implement these concepts with promising results for the management of BTEX emissions from glycol dehydration. Reporting emissions from dehydration units to various stakeholders is done on a timely and consistent basis while simultaneously providing management with a set of tools to prioritize efforts in energy efficiency and emissions reductions programs. This approach was implemented for approximately 100 operating dehydration units operated by Encana in Western Canada. The results, benefits achieved and some interesting trends / opportunities will be presented in this paper.
2
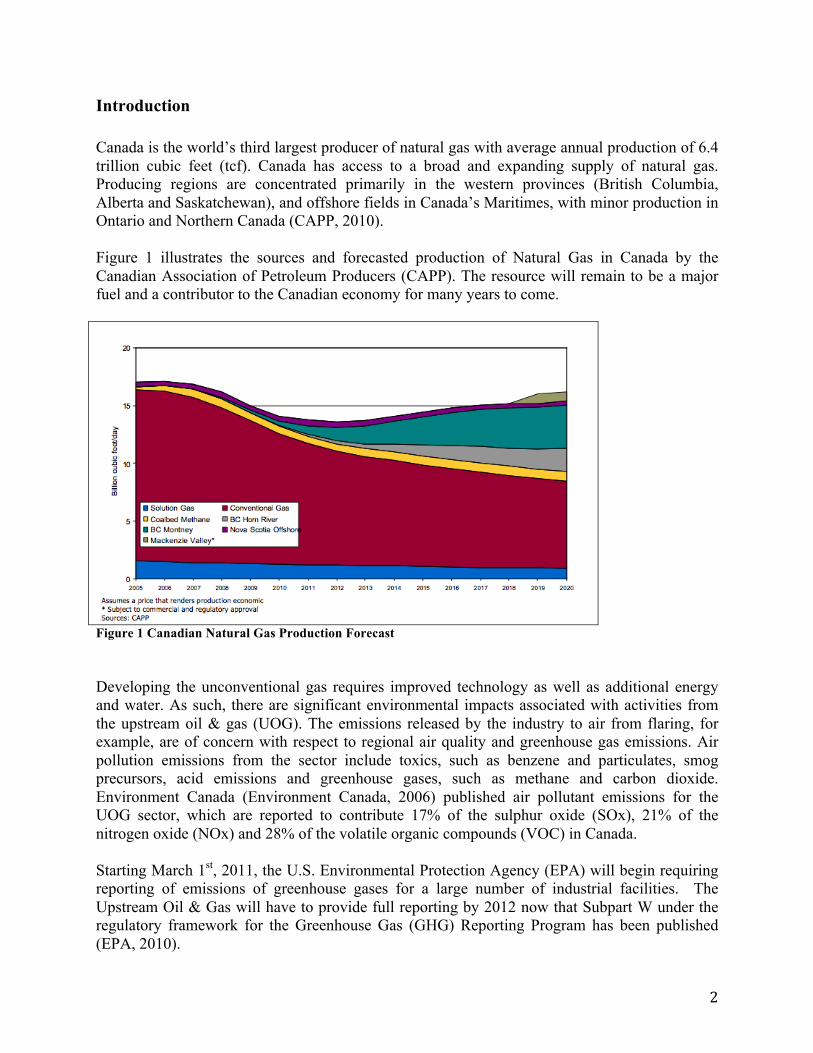
Introduction Canada is the world’s third largest producer of natural gas with average annual production of 6.4 trillion cubic feet (tcf). Canada has access to a broad and expanding supply of natural gas. Producing regions are concentrated primarily in the western provinces (British Columbia, Alberta and Saskatchewan), and offshore fields in Canada’s Maritimes, with minor production in Ontario and Northern Canada (CAPP, 2010). Figure 1 illustrates the sources and forecasted production of Natural Gas in Canada by the Canadian Association of Petroleum Producers (CAPP). The resource will remain to be a major fuel and a contributor to the Canadian economy for many years to come.
Figure 1 Canadian Natural Gas Production Forecast Developing the unconventional gas requires improved technology as well as additional energy and water. As such, there are significant environmental impacts associated with activities from the upstream oil & gas (UOG). The emissions released by the industry to air from flaring, for example, are of concern with respect to regional air quality and greenhouse gas emissions. Air pollution emissions from the sector include toxics, such as benzene and particulates, smog precursors, acid emissions and greenhouse gases, such as methane and carbon dioxide. Environment Canada (Environment Canada, 2006) published air pollutant emissions for the UOG sector, which are reported to contribute 17% of the sulphur oxide (SOx), 21% of the nitrogen oxide (NOx) and 28% of the volatile organic compounds (VOC) in Canada. Starting March 1st, 2011, the U.S. Environmental Protection Agency (EPA) will begin requiring reporting of emissions of greenhouse gases for a large number of industrial facilities. The Upstream Oil & Gas will have to provide full reporting by 2012 now that Subpart W under the regulatory framework for the Greenhouse Gas (GHG) Reporting Program has been published (EPA, 2010).

3
Energy use and emissions of pollutants to air are tightly linked in all economic activity. The natural gas production and processing sector in Western Canada faces the challenge of increased pressures from all stakeholders to improve their environmental performance while remaining economically attractive for investors. Emissions reduction is one of the most serious challenges this industry is currently facing and there is a need for decision support tools to assist operating companies and governments in the identification of the most promising opportunities for improvement.
Benzene Emissions (BTEX) Over the last fifteen years, there has been a trend to reduce benzene emissions from glycol dehydrators. The Energy Resources Conservation Board (ERCB), the regulatory body in Alberta, introduced a directive to further encourage emissions reductions; non-compliance with ERCB directives could potentially result in suspension of operations (ERCB, 2008). Glycol dehydration units are an integral part of many gas production and processing operations, with as many as 4,000 units in Alberta and some 20,000 to 45,000 units in the United States alone (EPA, 2010b). One of the main environmental issues with the operation of glycol units is the release of BTEX emissions, which are controlled by federal and/or local regulatory agencies. The vast majority of dehydration units use Triethylene Glycol (TEG) to remove the water. Therefore, the ability of simulation tools to accurately predict BTEX emissions and dry gas water content in TEG dehydration units is of primary importance for both operators and regulatory agencies. In North America, HYSYS and GRI-GLYCalc are the most common simulation tools used to predict benzene emissions from glycol dehydration units. For HYSYS, the Peng Robinson equation of state has been the recommended property package over the years. Recently Aspentech developed a new Glycol property package with promising results for TEG and BTEX. GLYCalc has been the software of choice for regulatory agencies in North America with respect to estimating benzene emissions from Glycol Dehydration units. There are some drawbacks in the implementation of the calculations in the GLYCalc software and it has been shown that it is possible to improve the accuracy and consistency of the emissions estimations by relying on more sophisticated simulation tools such as HYSYS (Holoboff and Khoshkbarchi, 2009). The ERCB directive sets out requirements for the reduction of benzene emissions from glycol dehydrators. With the issuance of this directive, the ERCB and Alberta Environment have established mandatory requirements to ensure continued reductions of benzene emissions to reduce potential impact on the public. Licensees must ensure that all their dehydrators meet the following benzene emission limits.

4
In order for producers to ensure compliance with the directive, they are required to collect operational data from their glycol dehydration units and to perform computer simulation studies to calculate benzene emissions. Direct measurement is also an option to determine emissions, however it tends to be an expensive option for most operators. The data gathering campaign usually begins by sending a request to field personnel for all dehydrator locations. Ensuring the quality of the data is sometimes overlooked and some validation procedure must be in place to minimize data entry errors or misinterpretations. The validated data is then used to perform the required calculations and produce the documentation to comply with the Directive, including the Dehydrator Engineering and Operations Sheet (DEOS) Graph, illustrated in Figure 2.
Figure 2- Sample DEOS graph The DEOS forms are sent back to operators to post on their dehys; an inventory list is also required by ERCB annually to report the calendar-year total emissions of benzene for each licensee. The workflow can be time-consuming for operating companies that run hundreds of glycol dehydration units.

5
Online BTEX Emissions Management System In order to streamline the workflow associated with compliance with Directive 039, a web-based system was developed that facilitates every step of the process. A set of consistent Field Data Forms is sent out to the field to capture the operating conditions of the individual units; to minimize data entry errors, the forms can be automatically uploaded to an on-line database. Validation procedures have also been implemented to compare the current conditions with previous years and to normal operating ranges for all relevant variables. For instance, once of the key parameters for calculation of benzene emissions is the glycol circulation rate; in order to ensure the best possible estimation of the flow rate, the system provides a preliminary calculation based on pump model and number of strokes. Once the data has passed the validation tests, it is submitted to a HYSYS case; the system takes advantage of the extensibility of Aspentech HYSYS simulator to programmatically run a number of cases and write results back to the online database, where the reports are finally generated for download. By simplifying the data management and calculation requirements for dehydrator emissions reporting, the system allows operators to spend their resources analyzing the results and identifying opportunities for improvement.
Greenhouse Gas Emissions As noted in the last section, the HYSYS model is also useful to calculate the flow rates of various greenhouse gases (GHG) that are emitted from process vents. In the case of dehydrators with a flash tank installed, it is essential to correctly identify the fate of the flash gas as it will be mainly composed of methane- a potent greenhouse gas. Another key factor in the determination of GHG emissions is the use of stripping gas in the glycol regeneration step; units that vent directly to atmosphere will have a significant contribution from methane releases from this source. Similarly, dehydrators that process high-CO2 gas can also vent significant amounts of greenhouse gases. As noted earlier, EPA’s Mandatory Reporting of Greenhouse Gases, particularly Subpart W of 40 CFR Part 98 indicates that for all dehydrators with gas rates higher than 0.4 MMSCFD, emissions from venting may be calculated using a software program such as GRI GlyCalc or Aspentech HYSYS. For smaller dehys an emission factor may be used to estimate these sources. A random sample of ten dehydrators provides the basis for a preliminary comparison between the emissions calculation methods available. Results are shown in Table 1.

6
Table 1- Comparison of emissions calculations From this sample it can be observed that both the Peng-Robinson (P-R) and the Glycol fluid packages in Aspen HYSYS provide somewhat consistent results in terms of greenhouse gas emissions. Note that these figures only account for vented emissions and do not consider the emissions from fuel gas combustion in the regenerator reboiler; these combustion-related are available for the units simulated with HYSYS but cannot be readily identified using GRI GlyCalc. These results are plotted in Figure 3 below.
Figure 3- Calculation method comparison

7
Although Figure 3 does not reveal an accurate picture for some units with low emissions, a few high level trends can be identified. The results from applying generic emission factors (API 2009) are very different from the simulation results and in general will tend to underestimate emissions. There is only one case where the emissions factor predicts higher emissions than the other methods in Unit 8. Closer review of this unit shows that it operates an electric pump and no stripping gas. The only reason why this unit has higher emissions according to the emission factor is that is processing a higher gas rate than the other units. The emission factor approach fails to take into consideration the full effect of stripping gas use in the methane emissions venting from glycol dehydrators. It is also noted in API 2009 that these emissions factors would overestimate emissions from a glycol dehydration system with a flash tank separator that routes the flash gas to a vapor recovery system. Furthermore API does clarify that some dehydrators introduce stripping gas in the regenerator to help strip water and other absorbed compounds out of the glycol by increasing the vapor flow rate in the reboiler still. Any methane in the stripping gas will pass directly through the regenerator; therefore, the use of dry natural gas will increase CH4 emissions from the regenerator. Simulation software should be used to estimate CH4 emissions in this situation, as the default approaches presented in subsection 5.1.1 do not account for the use of stripping gas. HYSYS-PR, HYSYS-Glycol and GlyCalc predict GHG emissions within 10-15% of each other. A comparison based on emissions intensity allows a better resolution of the differences; in Figure 4 the y-axis scale was determined to enable this comparison normalizing based on rate of gas processed by the dehydrator (E6m3) although Unit 7 is out-of-bounds.
Figure 4- Intensity-based comparison Clearly the use of emission factors to calculate GHG emissions from process vents can be significantly misleading and should be avoided.

8
From Regulatory Reporting to Emissions and Energy Management The potential for emissions and energy reduction is very significant once reliable and actionable information is available. More conventional systems have helped in improving regulatory emissions reporting workflows; however, these tools typically do not have the resolution required to identify opportunities and could result in misleading conclusions. The results of the HYSYS simulation provide the required information to report the benzene emissions as a function of the glycol circulation rate. The models also report emissions of all other components included in the fluid definition, some of which are of particular relevance to industry. Certainly the Toluene, Ethylbenzene and Xylenes of the BTEX group are available for reporting and analysis if required (for instance, facilities that require reporting for NPRI in Canada) as well as Greenhouse Gas emissions from venting and combustion sources. The energy requirements for regeneration of the glycol are also calculated by the HYSYS model and, by assuming reasonable heater efficiencies, the fuel gas consumption of the unit is also calculated by the system. Armed with an estimation of fuel gas use, it is then possible to perform comparisons of current operation to industry best practices and uncover potential opportunities for energy reduction in glycol dehydration units (See Figure 5).
Figure 5- Workflow for emissions reporting and management Mapping functionality in the system enables users to visualize opportunities using different criteria; for example, in terms of potential operating cost reductions due to reduced glycol circulation rate and reduced fuel gas use, the illustration in Figures 6 and 6a indicate that there are some units with significant potential while most of the units have minor opportunities. This

9
representation provides a clear picture for management indicating the facilities where most of the effort should be directed for energy optimization work.
Figure 6- Mapping of all dehydration units
Figure 6a- Ranking of units based on potential cost reductions

10
It is interesting to note that for the 96 displayed operating units; the total potential fuel gas savings identified amounts to over $680,0001 per year and an associated reduction in greenhouse gas emissions of approximately 10,000 tonnes CO2/year or the equivalent of 2 taking 1,800 cars off the road each year. These reductions only consider the fuel gas usage in the reboiler and would be significantly higher if stripping gas and vented emissions were considered. As can be seen from the map representation and in Figure 7, 80% of the available opportunities for fuel gas conservation are found in the top 26 units.
Figure 7- Cumulative savings in fuel gas consumption A well-focused effort has been since taken to perform more detailed studies on those top 25-30 dehys that offer the greatest potential for fuel gas recovery. It is also worth noting that there is no relationship whatsoever between units that have benzene emissions and units processing gas with
1 All figures in Canadian Dollars. Fuel Gas price assumed at $4/GJ 2 To translate GHG reductions into an equivalent number of cars off the road, annual emissions from a typical passenger vehicle should be equated to 5.5 metric tons of carbon dioxide equivalent or 1.5 metric tons of carbon equivalent. (http://www.epa.gov/oms/climate/420f05004.htm)

11
no benzene present which shows that a narrow approach to emissions calculation could miss on important opportunities for optimization. It is also possible to identify the regions where benzene emissions are likely to be problematic, which coincides with the availability of richer gas along the foothills of the Canadian Rocky Mountains (Figure 8).
Figure 8- Sorting dehydration units according to benzene emissions With respect to greenhouse gas emissions, it can be seen that there is no correlation with the quality of gas produced and it depends strongly on operating practices by the various facilities as well as the type and age of the equipment (Figure 9).

12
Figure 9- Units ranked by greenhouse gas emissions
Automation Tools for Continuous Emissions and Energy Management The next step in improving the emission and energy performance of the facilities is to provide actionable advice from the simulation models to operators regularly (hour-to- hour or shift-to-shift or day-to-day) so that they can capture the potential benefits sooner and ensure that the best practices of operations are used consistently. Aspen Tech has introduced new software tools to facilitate the use of simulation models in the operating facilities. It can integrate Aspen HYSYS models with data historian and visualization tools (See Figure 10). This integrated system validates the raw data from the data historian, performs simulation runs and presents the results back to operators at regular intervals and alerts them when they deviate from the optimum operation.

13
Figure 10- Integrated system outline This integrated system can be used as a soft or virtual sensor. It uses available measurements (such as flow, pressure, temperature, etc.) with validated simulation models to infer other parameters such as dew point of the gas or RVP of condensate or CO2 emissions from the heater that can’t be measured directly with the existing instruments at the site. This integrated system can also be used for performance monitoring of the key equipments of the site as well. The simulation model can estimate exchanger fouling factor, compressor efficiency and heater efficiency using available measurements. The results from the simulation model runs are stored in the data historian so it is possible to monitor and trend these equipment performance factors (e.g. fouling factor or efficiency) over a long term and develop a pro-active equipment maintenance plan (e.g. reboiler cleaning schedule). The system can also be used to perform ’what-if’ analysis to understand associated trade-offs using validated simulation models very easily.
Conclusions The Upstream Oil & Gas sector is facing the challenge to produce hydrocarbons in the most efficient manner while respecting the environment. A number of regulatory requirements have emerged and it is likely that these will continue increasing in complexity and stringency. Novel

14
tools are required to assist operators in complying with all regulatory regimes that can also act as advisor systems for operational optimization of process plants. Encana’s experience in the use of an integrated system that relies on rigorous simulation models and internet technology has confirmed that many of the benefits of such tools are significant and can be accessed with no/low capital cost. Besides ensuring compliance with the ERCB regulations, Encana has embarked on a focused optimization effort to tackle the most promising opportunities for improvement with a goal of capturing up to $250,000 annually in fuel gas conservation while reducing its environmental impacts simultaneously. Although many of these plants are not well instrumented, work is ongoing to test and validate systems that can provide real-time guidance to operators in the future. References
- Environment Canada (2006) “National Pollutant Release Inventory- 2006” http://www.ec.gc.ca/inrp-npri/default.asp?lang=En&n=4A577BB9-1
- Environmental Protection Agency, (2010) “40 CFR Part 98 Mandatory Reporting of Greenhouse Gases: Petroleum and Natural Gas Systems; Final Rule”. Federal Register/Vol. 75, No.229, November 30th 2010.
- Alberta Energy Resources and Conservation Board (2008), “Directive 039. Revised Program to Reduce Benzene Emissions from Glycol Dehydrators”
- Environmental Protection Agency, (2010) “Natural Gas Dehydration: Lessons Learned from the Natural Gas STAR Program”. Producers Technology Transfer Workshop, March 23, 2010.
- Holoboff, J. and Khoshkbarchi, M. (2009) “Prediction of BTEX emissions and water content in TEG dehydration units” GPA Convention, March 9th, 2009. San Antonio TX.
- API (2009) “Compendium of Greenhouse Gas Emissions Methodologies for the Oil and Natural Gas Industry”