model-based information fusion investigation on fault
TRANSCRIPT

Journal of Loss Prevention in the Process Industries 67 (2020) 104267
Available online 10 August 20200950-4230/© 2020 Elsevier Ltd. All rights reserved.
Model-based information fusion investigation on fault isolation of subsea systems considering the interaction among subsystems and sensors
Guozheng Song a,b,*, Pierluigi Salvo Rossi c, Faisal Khan d, Nicola Paltrinieri b, Ahmad BahooToroody e
a Functional Safety Center, Instrumentation Technology and Economy Institute, Beijing, PR China b Department of Mechanical and Industrial Engineering, Norwegian University of Science and Technology, Trondheim, Norway c Department of Electronic Systems, Norwegian University of Science and Technology, Trondheim, Norway d Centre for Risk, Integrity and Safety Engineering (C-RISE), Faculty of Engineering and Applied Science, Memorial University of Newfoundland, St. John’s, Canada e Department of Industrial Engineering (DIEF), University of Florence, Florence, Italy
A R T I C L E I N F O
Keywords: Fault isolation Information fusion Subsea system Bayesian network False alarm Subsystem dependency
A B S T R A C T
The offshore oil industry has expanded to deep water and Arctic. The harsh operating conditions (e.g., ice and strong wind) and increasing complicated system raise the occurrence likelihood of system faults. This requires timely fault isolation and management in the subsea system. However, the offshore oil industry mainly relies on humans to isolate faults based on alarms. With harsh operating conditions and increasing complicated system, this industry urgently needs research on more efficient fault isolation and cause diagnosis methods. Unfortu-nately, limited research is conducted on fault isolation method in the offshore oil industry. Furthermore, in industry 4.0 era, large amounts of information are obtained. This provides precondition for the application of information fusion technique which aims to improve diagnosis results. However, to the authors’ knowledge, information fusion has not been much studied in the fault isolation of the offshore oil industry. Moreover, the interaction of different subsystems contains valuable information. How the interaction of different subsystems can influence the fault diagnosis has not been explored. This paper proposes a Bayesian network (BN) based method for timely fault isolation and cause diagnosis for the offshore oil industry. The work fuses different in-formation, and it also includes the dependency among different subsystems in the fault diagnosis. As an important alarm source, false alarms are also taken into account in the model. A case study on the subject of the subsea wellhead and chemical injection systems is conducted to demonstrate the functions and merits of the proposed method.
1. Introduction
With the depletion of onshore reserves, oil production has expanded to deep water and recently to Arctic (Bai and Bai, 2012; Bucelli et al., 2018). In relation to such development, this industry has faced greater challenges in terms of safety due to the extremely harsh environments, such as ice, strong winds and waves, vibrations, erosion and complicated geological factors (Bucelli et al., 2018; Song et al., 2016; Wu et al., 2016). Furthermore, a subsea production system includes various complicated components (Bai and Bai, 2012). Facilities have become increasingly integrated with the advance in automation, software and technology, leading to increased system complexity (Goel et al., 2017). Both the harsh operating conditions and high system complexity
increase the likelihood of faults (Bucelli et al., 2018; Cai et al., 2016), which causes a heavier demand for efficient fault isolation.
Facility failure can significantly degrade system performance (Cai et al., 2017a), negatively influencing production efficiency. A petro-chemical company can suffer $50,000,000 to $100,000,000 annual losses because of upsets and abnormal situations (Goel et al., 2017). Moreover, faults can evolve to catastrophic accidents when systems keep operating in a faulty condition (U.S. Chemical safety and hazard investigation board, 2011). For example, the DuPont plant in Belle, WV, Kanawha kept running after alarm occurrence, without finding out the fault. This has led to release of approximately 2000 pounds of methyl chloride over five days (U.S. Chemical safety and hazard investigation board, 2011). Thus, efficient fault isolation is essential for safe and
* Corresponding author. E-mail address: [email protected] (G. Song).
Contents lists available at ScienceDirect
Journal of Loss Prevention in the Process Industries
journal homepage: http://www.elsevier.com/locate/jlp
https://doi.org/10.1016/j.jlp.2020.104267 Received 31 October 2019; Received in revised form 5 August 2020; Accepted 5 August 2020

Journal of Loss Prevention in the Process Industries 67 (2020) 104267
2
efficient production. To effectively manage faults, various types of sensors have been applied in the subsea production system (Bai and Bai, 2012). These sensors can generate large numbers of alarms. The alarm amount in an industrial system can be 60–120 per hour during normal operation, while it can reach approximately 390–3750 alarms per hour in upset conditions (Goel et al., 2017; Rothenberg, 2009). This further requires quick fault isolation in the alarm management.
However, workers on the offshore platform manually isolate faults, and the efficiency and accuracy of manual diagnosis are influenced by multiple factors, such as knowledge, experience and training (Institute for Energy Tech, 2017). Furthermore, since a fault may cause different abnormal symptoms and an abnormal symptom can be caused by various faults (see Fig. 1), efficient manual fault isolation for frequent alarms can surpass human capacity, especially during an alarm flood (Cai et al., 2017b; Dai et al., 2016). Moreover, in our interview of the offshore employees of China National Offshore Oil Corporation, workers claimed that much of their work time is consumed by isolating the faults related to alarms. Fault isolation has contributed to heavy workload in the offshore industry.
According to above analysis, timely fault isolation is an important precondition for efficient production, significant accident prevention and relief of the heavy work on offshore platforms. For this purpose, the offshore oil industry urgently needs a tool for efficient fault isolation and cause diagnosis. Because of the complexity of the offshore production system, the proposed diagnostic tool should enable the representation of the dependency of different subsystems and the fusion of the abnormal symptoms from different types of sensors. It also needs to consider all potential faults, including the sensor error. Bayesian network (BN) is a powerful tool, completely satisfying these requirements. BN is excellent in fusing multiple information and representing the dependency of different systems. Compared to other methods, such as the Markov chain, fault tree, petri net and principal component analysis (PCA), BN can visually demonstrate the dependent relationship among variables
and avoid state space explosion problems for complex systems (Cai et al., 2015; Khakzad et al., 2011). Furthermore, BN is powerful to deal with uncertainty problems in the fault diagnosis (Cai et al., 2017c). The basic concepts of BN are presented in Section 2.1.
Because of the powerful functions, BN has been widely used for fault diagnosis in the process and energy industries (Cai et al., 2017b). Sixteen BN-based diagnosis works in these two domains have been reviewed in a paper (Cai et al., 2017b). Besides those introduced in that paper, Amin et al. (2019) presented a dynamic Bayesian network (DBN) based method for fault detection, root cause diagnosis, and fault propagation pathway identification. The proposed method was used to diagnose faults of two components in the chemical industry separately: a binary distillation column and a continuous stirred tank heater. Wang et al. (2018) presented a BN which has one child node (symptom) and mul-tiple parent nodes (root causes). A case study of thermal power plants was conducted and found that the proposed method could deal well with false and missing alarms, multiple root causes and incompleteness of known root causes. Wang et al. (2019) used a simplified BN to diagnose the diesel engine fuel injection system. The simplified BN reduces the complexity in establishing and applying the diagnosis model. Wang et al. (2017) proposed an approach merging a distance rejection technique and non-sensor information into the BN to identify new types of faults and increase the diagnostic accuracy of chillers.
However, the application of BN in the offshore area is very limited (Cai et al., 2017b). Cai et al. (2017a) used DBN to identify faulty com-ponents and fault types among the intermittent, transient and perma-nent faults, considering the degradation process of subsea genius modular redundancy control systems. Cai et al. (2016) also proposed an object-oriented Bayesian network (OOBN) to conduct fault diagnosis for a subsea production system. The OOBN can simplify the models of complex systems with repetitive structures. Liu et al. (2015) proposed a new development approach of BN for fault diagnosis by adding an operational procedure layer in the model. The proposed method was used for fault diagnosis in the procedure of closing a subsea blowout preventer. These works contribute to the fault diagnosis of subsea sys-tems. However, some important points have not been investigated.
• Firstly, a subsea production system includes dependent subsystems. The dependency of subsystems contains valuable information for fault diagnosis. How to use information from a subsystem to di-agnose faults in another one has not been studied.
• Secondly, the above-mentioned works neither explain how BN ach-ieves information fusion nor analyze the impacts of information fusion on the diagnostic results.
• Thirdly, as a potential fault, the false alarm is an important source of abnormal symptoms (Khodabakhsh et al., 2018). However, it is not considered as a potential fault node in the above-mentioned works.
The three points are important to be considered for a practical fault diagnosis. In the current work, information from different types of sensors and different subsystems is fused to analyze the effects of in-formation fusion on diagnostic results. Moreover, fault isolation of a subsystem based on abnormal symptoms from another subsystem is conducted. Furthermore, the node of false alarm is included in the diagnosis model. In this work, fault isolation means the process to decide faults given detected symptoms from sensors.
This work is organized as follows. Section 2 presents the proposed methodology. In Section 3, a case study of a subsea wellhead system and a chemical injection system is conducted to demonstrate the functions and merits of the proposed method. Section 4 provides the conclusions.
2. Proposed methodology
2.1. Background information
As one of the most useful tools for probabilistic reasoning, BN can Fig. 1. Relationship among faults and abnormal symptoms.
G. Song et al.

Journal of Loss Prevention in the Process Industries 67 (2020) 104267
3
well handle the uncertainty problem of fault diagnosis (Cai et al., 2014). The oriented BN graph represents variables using nodes and shows their dependency with arcs (Song et al., 2016). An important function of BN is diagnostic inference (backward inference) considering the dependency of variables (Song et al., 2016; Khakzad et al., 2011). As shown in Fig. 2, in a fault diagnosis, BN updates the probability of the precedent fault variable F using detected state of symptom node S (evidence), according to Bayes’ theorem (see Eq. (1)). The posterior probability of the fault variable is obtained through the diagnostic inference. Then the most likely fault can be identified according to its probability change between prior and posterior probabilities (Cai et al., 2016; Wang et al., 2019).
P(F|S)=P(Fk).P(S|Fk)
∑ni=1P(Fi).P(S|Fi)
(1)
where F is the precedent fault variable, while S is the symptom node. n represents the total state of fault node F and k is F’s k-th state.
Another important concept applied in this work is information fusion. Multi-source information fusion (i.e., data fusion) is a technique which combines data from multi-sensors and related information of databases to achieve improved analysis accuracy and more specific in-ferences than the application of a single sensor alone (Hall and Llinas, 1997; Wu et al., 2018). In this study, information fusion refers to inte-grating symptoms detected by different types of sensors and from different subsystems of the subsea production system. For example, when one abnormal symptom is detected, to diagnose the fault and cause of the abnormal symptom, the node representing the symptom is set as abnormal in the BN-based model; then the model is updated to obtain the posterior probabilities of related faults and causal nodes. Then, if another symptom is detected from another subsystem, this ev-idence is entered into the model and the BN is further updated to obtain the posterior probabilities of related faults and causal nodes, given occurrence of the two symptoms. The obtained posterior probabilities represent the most likely states of these nodes. In this way, the effects of the two pieces of information are fused, using BN in the fault isolation.
2.2. Method explanation
This work aims to propose a fault diagnosis model capable of infor-mation fusion from different types of sensors and different subsystems for the offshore oil industry. It also aims to analyze the effects of in-formation fusion on diagnostic results. To fulfill the goals, a BN-based method is proposed and this method is explained in Fig. 3. This method considers the fault of false alarm by adding the related node.
The steps of Fig. 3 are explained using a simple example in Fig. 4.
(1) Identify faults and causes of abnormal symptoms in the offshore oil production system and analyze their dependency. This work could be completed referring to fault records, accident investi-gation reports, academic literature and experience of experts (e. g., system designers and experienced workers on platforms) (Cai et al., 2016). For example, causes 1–6 and faults 1–3 are identi-fied for the abnormal symptoms 1 and 2 in Fig. 4.
(2) Represent the symptoms and identified causes and faults using nodes of BN, and link correlative nodes with arcs. As shown in
Fig. 4, the identified six causes, three faults and two abnormal symptoms are represented using nodes and the nodes for each subsystem are assigned in a box with a dashed line to clearly show subsystem dependency in the diagnosis. For the sake of clarifi-cation, the nodes of causes and faults are represented using black nodes, while abnormal symptoms are red in the proposed model. Then the correlative nodes are linked in Fig. 4. For example, causes 1–3 are linked to fault 1, and faults 1–2 are linked with abnormal symptom 1. In this way, the structure construction of BN is completed and a parameter decision of the network will be conducted in the following step.
(3) Identify the prior probabilities of root nodes and conditional probabilities of intermediate and leaf nodes (Cai et al., 2016; Khakzad et al., 2013). The prior probabilities and conditional probabilities can be obtained from historical data, previous literature and experts’ experience (Song et al., 2016; Cai et al., 2014). The Kirsten method to convert expert experiences to data is demonstrated in a previous paper (Song et al., 2016) which interested readers can refer to. With this information, the quan-titative relationship and interaction among sensors and sub-systems are established. The BN-based fault diagnosis model is obtained now.
Fig. 2. Schematic diagram of a basic BN for fault diagnosis.
Fig. 3. Flow diagram of the proposed work.
Fig. 4. Information fusion represented by BN.
G. Song et al.

Journal of Loss Prevention in the Process Industries 67 (2020) 104267
4
(4) Update BN with the targeted abnormal symptom detected by sensors. The observed state of targeted symptom is integrated into BN and then the BN is updated to obtain posterior proba-bilities of causes and faults. The probability changes of causes and faults of the targeted abnormal symptom are compared to decide their likelihood of being the real faults and causes. The bigger probability growth they have, the larger likelihood they are the real faults and causes.
(5) When further symptoms are detected from different types of sensors and different subsystems, this information is also entered into the BN. Then the probability changes of causes and faults of the targeted symptom are further analyzed to decide their like-lihood of being the real faults and causes.
(6) Compare the diagnostic results from steps 4 and 5 to demonstrate how the information fusion and the inclusion of subsystem dependence influence the fault isolation.
The schematic BN model in Fig. 4 has the following merits. Firstly, such a visual form can clearly show all potential causes and faults for an abnormal symptom, and thus it informs inexperienced workers of the scope of faults and causes. Secondly, it can help employees understand the occurrence principle of abnormal symptoms. For example, according to Fig. 4, causes 1, 2 and 3 lead to fault 1, which further causes abnormal symptom 1. Moreover, the BN represents the interaction of different subsystems through information fusion. For example, the abnormal symptom in subsystem 1 is linked to the fault located in subsystem 2. By establishing the interaction of different subsystems, the BN can isolate faults located in a different subsystem. When an abnormal symptom is detected, if the employee only focuses on the component where the symptom is captured, the real fault located in another component could be missed. The proposed method can solve this problem.
3. An illustrative case
In this section, a case study is conducted on the subject of fault diagnosis of a subsea wellhead system and a chemical injection system to demonstrate the function of the proposed method.
3.1. Model establishment
Wellheads are essential components of the subsea production system (Devold, 2009). Different sensors, such as flow and pressure sensors, are assigned to monitor the state of wellheads. Another important system to facilitate oil production is the chemical injection system (Chilingarian et al., 1987). To guarantee liquid product flowing smoothly, chemicals are injected into the liquid product through the injection system (Chi-lingarian et al., 1987). If the injection facilities do not work properly, petroleum could stop flowing and the production process could be interrupted (PetroWiki, 2019). This can cause significant loss for the offshore platform. To guarantee normal operation of the injection sys-tem, sensors are also assigned to monitor its states. When faults occur, sensors related to wellheads and chemical injection facilities can generate abnormal symptoms. Employees need to isolate and fix the detected faults in a timely way to guarantee safe and efficient produc-tion. In this case study, a BN-based diagnosis model is established using GeNIe software (BayesFusion LLC, 2019a) to help employees isolate faults and diagnose their causes based on symptoms obtained from different types of sensors and different subsystems. This case study ex-plains how the proposed model achieves information fusion and ana-lyzes the effects of the fusion and subsystem dependency on diagnostic results. It also demonstrates how the model enables the isolation of the specific fault of false alarm.
The potential causes, faults and abnormal symptoms are identified according to related literature (Chilingarian et al., 1987; Matanovic et al., 2012; Penberthy and Shaughnessy, 1992; White et al., 2018) and interviews of the offshore employees of China National Offshore Oil
Corporation. The identified causes, faults and abnormal symptoms are shown in Table 1. Following the procedure described in Fig. 3, the fault isolation model is obtained as Fig. 5. The prior probabilities of root nodes are decided by interviewing the offshore oil workers in China National Offshore Oil Corporation and they are shown in Table 1.
3.2. Qualitative function demonstration
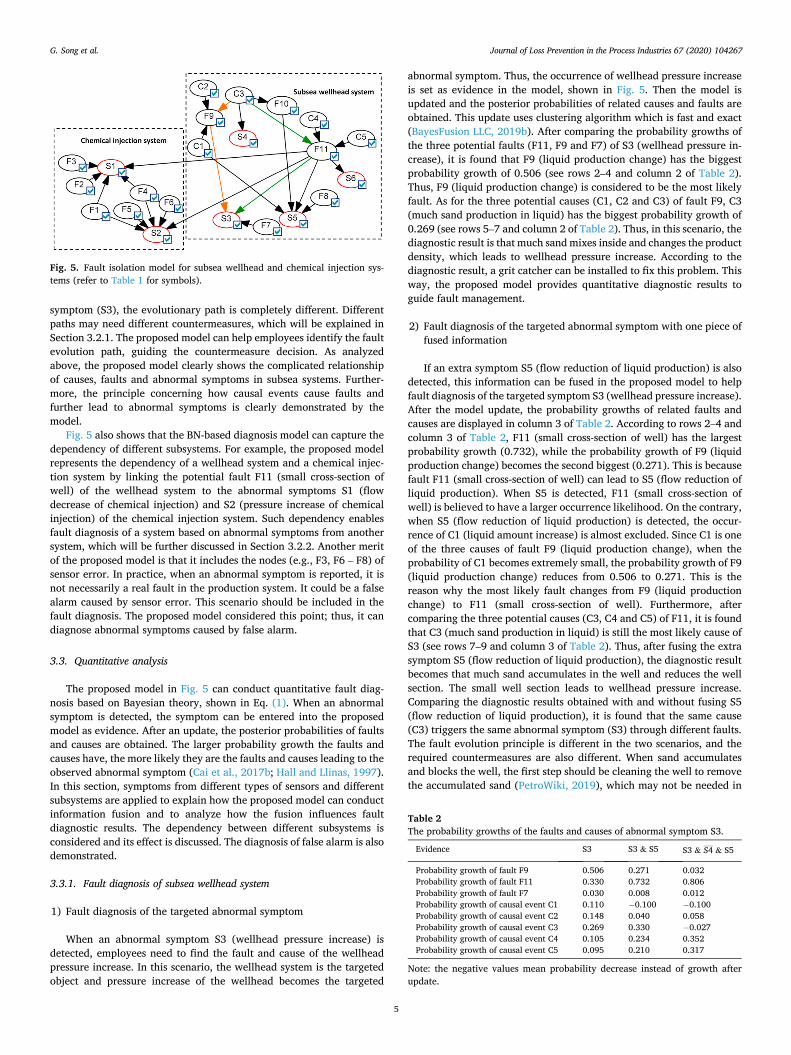
In Fig. 5, causes (represented using symbol C) and faults (shown by symbol F) are black nodes, while abnormal symptoms are red. Fig. 5 shows that S3 (wellhead pressure increase) can be caused by three po-tential faults: F9 (liquid production change), F11 (small cross-section of well) and F7 (pressure sensor error of wellhead). The first two faults have various causes. For example, the causes of liquid production change (F9) are liquid amount increase (C1), dense liquid production (C2) and much sand production in liquid (C3). This reveals that various potential faults (e.g., F7, F9 and F11) exist for an abnormal symptom (S3) and also that various potential causes (e.g., C1, C2 and C3) can lead to the same fault (F9). Moreover, Fig. 5 shows that C3 (much sand production in liquid) not only can lead to S3 (wellhead pressure in-crease), it can also result in S5 (flow reduction of liquid production) by causing F10 (pump abrasion). This reveals that a causal event (e.g., C3) can cause different symptoms (e.g., S3 and S5). Thus, it is difficult for employees to diagnose faults and isolate causes in a timely way from many potential candidates, especially for workers who lack experience. However, causes and faults need to be diagnosed quickly to make countermeasure decisions in practice. The proposed model can help workers to deal with this challenge on offshore platforms.
Furthermore, the proposed model in Fig. 5 not only shows the po-tential faults and corresponding causes of each abnormal symptom, but also represents the evolutionary path from causal events to faults, and further to abnormal symptoms, in a visual form. The visual path can help employees to better understand the occurrence principle of abnormal symptoms. For example, the causal event C3 (much sand production in liquid) has two paths to the abnormal symptom S3 (wellhead pressure increase) as shown in Fig. 5. Path 1 (represented by green arcs) means that sand is mixed in oil, triggering a density change of the product, and this change causes increase of wellhead pressure. Alternatively, path 2 (shown in orange arcs) means that sand accumulation decreases the well section. Consequently, wellhead pressure increases, due to the small cross-section of well (F11). Even with the same cause (C3) and abnormal
Table 1 Causes, faults and abnormal symptoms.
Symbol Causes (C), faults (F) & abnormal symptoms (S) Prior probabilities
C1 liquid amount increase 0.10 C2 dense liquid production 0.10 C3 much sand production in liquid 0.10 C4 wax in liquid production 0.10 C5 nozzle valve turns down 0.05 F1 injection device blockage 0.03 F2 lack of chemical supply 0.01 F3 flow sensor error of chemical injection 0.02 F4 power system failure for chemical injection 0.005 F5 voltage increase 0.01 F6 pressure sensor error of chemical injection 0.02 F7 pressure sensor error of wellhead 0.02 F8 flow sensor error of wellhead 0.02 F9 liquid production change – F10 pump abrasion – F11 small cross-section of well – S1 flow decrease of chemical injection – S2 pressure increase of chemical injection – S3 wellhead pressure increase – S4 high sand rate – S5 flow reduction of liquid production – S6 increase of electric current in upward stroke &
decrease of electric current in downward stroke –
G. Song et al.
Journal of Loss Prevention in the Process Industries 67 (2020) 104267
5
symptom (S3), the evolutionary path is completely different. Different paths may need different countermeasures, which will be explained in Section 3.2.1. The proposed model can help employees identify the fault evolution path, guiding the countermeasure decision. As analyzed above, the proposed model clearly shows the complicated relationship of causes, faults and abnormal symptoms in subsea systems. Further-more, the principle concerning how causal events cause faults and further lead to abnormal symptoms is clearly demonstrated by the model.
Fig. 5 also shows that the BN-based diagnosis model can capture the dependency of different subsystems. For example, the proposed model represents the dependency of a wellhead system and a chemical injec-tion system by linking the potential fault F11 (small cross-section of well) of the wellhead system to the abnormal symptoms S1 (flow decrease of chemical injection) and S2 (pressure increase of chemical injection) of the chemical injection system. Such dependency enables fault diagnosis of a system based on abnormal symptoms from another system, which will be further discussed in Section 3.2.2. Another merit of the proposed model is that it includes the nodes (e.g., F3, F6 – F8) of sensor error. In practice, when an abnormal symptom is reported, it is not necessarily a real fault in the production system. It could be a false alarm caused by sensor error. This scenario should be included in the fault diagnosis. The proposed model considered this point; thus, it can diagnose abnormal symptoms caused by false alarm.
3.3. Quantitative analysis
The proposed model in Fig. 5 can conduct quantitative fault diag-nosis based on Bayesian theory, shown in Eq. (1). When an abnormal symptom is detected, the symptom can be entered into the proposed model as evidence. After an update, the posterior probabilities of faults and causes are obtained. The larger probability growth the faults and causes have, the more likely they are the faults and causes leading to the observed abnormal symptom (Cai et al., 2017b; Hall and Llinas, 1997). In this section, symptoms from different types of sensors and different subsystems are applied to explain how the proposed model can conduct information fusion and to analyze how the fusion influences fault diagnostic results. The dependency between different subsystems is considered and its effect is discussed. The diagnosis of false alarm is also demonstrated.
3.3.1. Fault diagnosis of subsea wellhead system
1) Fault diagnosis of the targeted abnormal symptom
When an abnormal symptom S3 (wellhead pressure increase) is detected, employees need to find the fault and cause of the wellhead pressure increase. In this scenario, the wellhead system is the targeted object and pressure increase of the wellhead becomes the targeted
abnormal symptom. Thus, the occurrence of wellhead pressure increase is set as evidence in the model, shown in Fig. 5. Then the model is updated and the posterior probabilities of related causes and faults are obtained. This update uses clustering algorithm which is fast and exact (BayesFusion LLC, 2019b). After comparing the probability growths of the three potential faults (F11, F9 and F7) of S3 (wellhead pressure in-crease), it is found that F9 (liquid production change) has the biggest probability growth of 0.506 (see rows 2–4 and column 2 of Table 2). Thus, F9 (liquid production change) is considered to be the most likely fault. As for the three potential causes (C1, C2 and C3) of fault F9, C3 (much sand production in liquid) has the biggest probability growth of 0.269 (see rows 5–7 and column 2 of Table 2). Thus, in this scenario, the diagnostic result is that much sand mixes inside and changes the product density, which leads to wellhead pressure increase. According to the diagnostic result, a grit catcher can be installed to fix this problem. This way, the proposed model provides quantitative diagnostic results to guide fault management.
2) Fault diagnosis of the targeted abnormal symptom with one piece of fused information
If an extra symptom S5 (flow reduction of liquid production) is also detected, this information can be fused in the proposed model to help fault diagnosis of the targeted symptom S3 (wellhead pressure increase). After the model update, the probability growths of related faults and causes are displayed in column 3 of Table 2. According to rows 2–4 and column 3 of Table 2, F11 (small cross-section of well) has the largest probability growth (0.732), while the probability growth of F9 (liquid production change) becomes the second biggest (0.271). This is because fault F11 (small cross-section of well) can lead to S5 (flow reduction of liquid production). When S5 is detected, F11 (small cross-section of well) is believed to have a larger occurrence likelihood. On the contrary, when S5 (flow reduction of liquid production) is detected, the occur-rence of C1 (liquid amount increase) is almost excluded. Since C1 is one of the three causes of fault F9 (liquid production change), when the probability of C1 becomes extremely small, the probability growth of F9 (liquid production change) reduces from 0.506 to 0.271. This is the reason why the most likely fault changes from F9 (liquid production change) to F11 (small cross-section of well). Furthermore, after comparing the three potential causes (C3, C4 and C5) of F11, it is found that C3 (much sand production in liquid) is still the most likely cause of S3 (see rows 7–9 and column 3 of Table 2). Thus, after fusing the extra symptom S5 (flow reduction of liquid production), the diagnostic result becomes that much sand accumulates in the well and reduces the well section. The small well section leads to wellhead pressure increase. Comparing the diagnostic results obtained with and without fusing S5 (flow reduction of liquid production), it is found that the same cause (C3) triggers the same abnormal symptom (S3) through different faults. The fault evolution principle is different in the two scenarios, and the required countermeasures are also different. When sand accumulates and blocks the well, the first step should be cleaning the well to remove the accumulated sand (PetroWiki, 2019), which may not be needed in
Fig. 5. Fault isolation model for subsea wellhead and chemical injection sys-tems (refer to Table 1 for symbols).
Table 2 The probability growths of the faults and causes of abnormal symptom S3.
Evidence S3 S3 & S5 S3 & S4 & S5
Probability growth of fault F9 0.506 0.271 0.032 Probability growth of fault F11 0.330 0.732 0.806 Probability growth of fault F7 0.030 0.008 0.012 Probability growth of causal event C1 0.110 − 0.100 − 0.100 Probability growth of causal event C2 0.148 0.040 0.058 Probability growth of causal event C3 0.269 0.330 − 0.027 Probability growth of causal event C4 0.105 0.234 0.352 Probability growth of causal event C5 0.095 0.210 0.317
Note: the negative values mean probability decrease instead of growth after update.
G. Song et al.

Journal of Loss Prevention in the Process Industries 67 (2020) 104267
6
the first scenario (see section 1) of 3.3.1). The analysis reveals that after fusing extra information, the fault evolutionary path changes. Even though the cause and the targeted abnormal symptom are the same, the required countermeasures can be different for different evolutionary paths. The proposed model enables to identify the evolutionary paths. Furthermore, as shown in rows 2–4 and columns 2–3 of Table 2, the probability growths of F11, F9 and F7 change from 0.330, 0.560 and 0.030 to 0.732, 0.271 and 0.008 respectively after including the extra information S5 (flow reduction of liquid production). It is obvious that the difference of probability growths between F11 and the other two (F9 & F7) becomes larger after fusing S5. This means that there is much more confidence to believe that the fault is F11 (small cross-section of well) instead of the other two, after considering S5 (flow reduction of liquid production). Thus, with inclusion of the extra information S5 from a different type of sensor, the proposed method provides a more confi-dent diagnostic result.
3) Fault diagnosis of the targeted abnormal symptom with two pieces of fused information
Although we have more confidence about the diagnosed fault after considering the extra abnormal symptom S5, the three potential causes (C3, C4 and C5) of the diagnosed fault F11 have similar likelihoods to be the real causal event, with probability growths of 0.330, 0.234 and 0.210 respectively (see rows 7–9 and column 3 of Table 2). Thus, although C3 (much sand production in liquid) is the most likely cause of S3 (wellhead pressure increase), C4 (wax in liquid production) and C5 (nozzle valve turns down) still have reasonable chances to be the causes of S3 (wellhead pressure increase). Such uncertainty can negatively influence effective fault management, since the three potential causal events require completely different countermeasures. When another extra symptom S4 (no high sand rate) is detected from the sand sensor, F11 (small cross-section of well) is still the most likely fault with a probability growth of 0.806 as shown in rows 2–4 and column 4 of Table 2, but the causal event C3 (much sand production in liquid) has a probability decrease of 0.027. Thus, only two relatively likely causes remain for the diagnosed fault F11: C4 (wax in liquid production) and C5 (nozzle valve turns down) with probability growths of 0.352 and 0.317, respectively (see rows 7–9 and column 4 of Table 2). In this way, this model narrows the scope of relatively likely causes based on in-formation fusion from different types of sensors. This facilitates cause diagnosis and benefits the countermeasure decision.
3.3.2. Fault diagnosis of chemical injection system
1) Fault diagnosis of the targeted abnormal symptom by fusing an abnormal symptom with a similar diagnostic effect
If the abnormal symptom S2 (pressure increase of chemical injection) is detected in the chemical injection system, workers need to find the fault. In this scenario, the chemical injection system is the targeted ob-ject and pressure increase of the chemical injection becomes the targeted abnormal symptom. Then the abnormal symptom S2 (pressure increase of chemical injection) is set as evidence in the proposed model of Fig. 5. It is found that F1 (injection device blockage) is the most likely fault with a probability growth of 0.398, while the second most likely fault is F11 (small cross-section of well) with a probability growth of 0.251, as shown in column 2 of Table 3. Thus, this abnormal symptom of the in-jection system is most likely caused by its own fault. Similarly, when another abnormal symptom S1 (flow decrease of chemical injection) is detected in the chemical injection system, the most likely fault is also F1 (injection device blockage) with a probability growth of 0.355, and the second most likely fault is F11 (small cross-section of well) with a probability growth of 0.214 (see column 3 of Table 3). These two abnormal symptoms have similar diagnostic results. When the abnormal
symptom S1 (flow decrease of chemical injection) is fused in the model to help isolate the fault of S2 (pressure increase of chemical injection), the probability growth of F1 (injection device blockage) increases from 0.398 to 0.821, and the second most likely fault F11 (small cross-section of well) has a far smaller probability growth, reducing from 0.251 to 0.122 (see columns 2 and 4 of Table 3). This means that after fusing S1 (flow decrease of chemical injection) into the fault diagnosis of S2 (pressure increase of chemical injection), the diagnostic effects are strengthened and such information fusion provides a more confident diagnostic result. Thus, even if some symptoms have similar effects, fusion of such abnormal symptoms is also meaningful. It can strengthen diagnostic effects and thus can highlight the fault.
2) Fault diagnosis of the targeted abnormal symptom by fusing an abnormal symptom of another system
If an extra abnormal symptom, S5 (flow reduction of liquid pro-duction), is detected from a subsea wellhead system, it can help diagnose the fault of an abnormal symptom S2 of the chemical injection system. When S5 (flow reduction of liquid production) is fused in the fault diagnosis of S2 (pressure increase of chemical injection), F11 (small cross-section of well) has the biggest probability growth of 0.727. F1 (injection device blockage) has the second biggest probability growth of 0.173, much smaller than that of F11 (see column 5 of Table 3). This is because only F11 (small cross-section of well) can lead to both S2 (pressure increase of chemical injection) and S5 (flow reduction of liquid production) among all the faults of S2. When S5 is detected together with S2, F11 (small cross-section of well) is believed to be the most likely fault of S2 (pressure increase of chemical injection). This diagnosis used abnormal symptoms from different systems, which reveals the ability of the proposed model to conduct diagnosis across systems. Furthermore, it is found that even though the abnormal symptom has been detected in the chemical injection device, the fault is related to the wellhead system instead of the injection device. This means that even if a system (e.g., chemical injection system) has abnormal symptoms, the real fault may most likely be located in another system (e.g., wellhead system). If the employees are misled by symptoms and directly replace equipment which produces the abnormal symptoms, it cannot fix the real faults. The proposed model represents dependency of different systems. Such dependency enables the model to diagnose faults of a system based on abnormal symptoms from another one.
3.3.3. False alarm diagnosis Numerous sensors are assigned in the subsea production system (Bai
and Bai, 2012; Khodabakhsh et al., 2018). However, sensors are not always reliable and they can generate abnormal symptoms, even if the production system is operating normally (Khodabakhsh et al., 2018). False alarm can be an important source of abnormal symptoms. This point is considered in the proposed model of Fig. 5. When three symp-toms, S1 (flow decrease of chemical injection), S2 (no pressure increase of chemical injection) and S6 (normal electric current), are detected, the probability of F3 (flow sensor error of chemical injection) increases from 0.020 to 0.192. It has the second biggest probability growth of 0.172, while F2 (lack of chemical supply) has the biggest probability growth of 0.276. Although the most likely fault is F2 (lack of chemical supply), the abnormal symptom S1 (flow decrease of chemical injection) still has a reasonable likelihood to be caused by a false alarm, since the probability growths of F2 and F3 do not have a large difference. This result can be
Table 3 The probability growths of faults F1 and F11 given detected information.
Evidence S2 S1 S1 & S2 S2 & S5
Probability growth of fault F1 0.398 0.355 0.821 0.173 Probability growth of fault F11 0.251 0.214 0.122 0.727
G. Song et al.

Journal of Loss Prevention in the Process Industries 67 (2020) 104267
7
explained as follows. The fault in a production facility can cause different abnormal symptoms. When other types of sensors do not detect abnormality, the only one releasing abnormal signal has a reasonable likelihood of giving a false alarm. The proposed model deals with this scenario by including false alarm nodes; thus, it not only can isolate the faults in production facilities, but also can diagnose the potential faults of sensors.
4. Conclusions
This work aims to isolate faults and diagnose causes for a subsea production system considering information fusion and subsystem de-pendency. A BN-based approach is proposed to fuse information from different types of sensors and different subsystems. The interaction of subsystems is represented and the specific fault of false alarm is also included in this approach. A case study of the subsea wellhead system and chemical injection system is conducted. The functions and merits of the proposed method are demonstrated using the illustrative case. The following conclusions are obtained.
(1) The complicated relationship among causes, faults and abnormal symptoms is represented in a visual form. It informs inexperi-enced workers of the scope of faults and causes and helps workers understand the occurrence principle of abnormal symptoms.
(2) The evolutionary path of the fault is shown for the sake of fault management. The evolutionary path of a fault changes after fusing extra information. Different countermeasures are required for different evolutionary paths, even if the diagnosed causal event and abnormal symptom are the same.
(3) By integrating extra information from a different type of sensors, the approach obtains a more confident diagnostic result of an abnormal symptom. The scope of relatively likely causes can also be narrowed based on such information fusion.
(4) After including the dependency of different subsystems, the approach can diagnose the fault of a subsystem based on the abnormal symptoms from another one.
(5) The approach includes false alarm nodes. Thus, it can diagnose the potential fault of sensors.
While this work focuses on the subsea system, the proposed method can facilitate fault isolation and cause diagnosis in multiple areas, such as the chemical plant.
CRediT authorship contribution statement
Guozheng Song: Conceptualization, Methodology, Software, Vali-dation, Formal analysis, Writing - original draft. Pierluigi Salvo Rossi: Methodology, Software, Formal analysis, Validation, Writing - original draft, Writing - review & editing. Faisal Khan: Conceptualization, Methodology, Formal analysis, Supervision, Writing - original draft, Writing - review & editing. Nicola Paltrinieri: Conceptualization, Methodology, Supervision, Funding acquisition, Writing - review & editing. Ahmad BahooToroody: Conceptualization, Methodology, Writing - review & editing.
Declaration of competing interest
The authors declare that they have no known competing financial interests or personal relationships that could have appeared to influence the work reported in this paper.
Acknowledgments
The authors acknowledge the financial support provided by Nor-wegian University of Science and Technology, and appreciate the offshore employees of China National Offshore Oil Corporation, who
provided valuable information for the case study. Author, Faisal Khan, thankfully acknowledges the financial support provided by the Natural Science and Engineering Council of Canada and the Canada Research Chair (CRC) Program in offshore safety and risk engineering.
References
Amin, M.T., Khan, F., Imtiaz, S., 2019. Fault detection and pathway analysis using a dynamic Bayesian network. Chem. Eng. Sci. 195, 777–790.
Bai, Y., Bai, Q., 2012. Overview of subsea engineering. In: Subsea Engineering Handbook.
BayesFusion LLC, 2019a. GeNIe documentation. https://support.bayesfusion.com/docs/. (Accessed 2 May 2019).
BayesFusion LLC, 2019b. Introduction to GeNIe inference algorithms. https://support. bayesfusion.com/docs/GeNIe/algorithms_introduction.html. (Accessed 2 May 2019).
Bucelli, M., Paltrinieri, N., Landucci, G., 2018. Integrated risk assessment for oil and gas installations in sensitive areas. Ocean. Eng. 150, 377–390.
Cai, B., Liu, Y., Fan, Q., Zhang, Y., Liu, Z., Yu, S., Ji, R., 2014. Multi-source information fusion based fault diagnosis of ground-source heat pump using Bayesian network. Appl. Energy 114, 1–9.
Cai, B., Liu, Y., Ma, Y., Liu, Z., Zhou, Y., Sun, J., 2015. Real-time reliability evaluation methodology based on dynamic Bayesian networks: a case study of a subsea pipe ram BOP system. ISA Trans. 58, 595–604.
Cai, B., Liu, H., Xie, M., 2016. A real-time fault diagnosis methodology of complex systems using object-oriented Bayesian networks. Mech. Syst. Signal Process. 80, 31–44.
Cai, B., Liu, Y., Xie, M., 2017a. A dynamic-bayesian-network-based fault diagnosis methodology considering transient and intermittent faults. IEEE Trans. Autom. Sci. Eng. 14, 276–285.
Cai, B., Huang, L., Xie, M., 2017b. Bayesian networks in fault diagnosis. IEEE Transactions on Industrial Informatics 13, 2227–2240.
Cai, B., Zhao, Y., Liu, H., Xie, M., 2017c. A data-driven fault diagnosis methodology in three-phase inverters for PMSM drive systems. IEEE Trans. Power Electron. 32, 5590–5600.
Chilingarian, G., Robertson, J., Kumar, S., 1987. Surface Operations in Petroleum Production, vol. I. Elsevier Publishing Company.
Dai, Y., Wang, H., Khan, F., Zhao, J., 2016. Abnormal situation management for smart chemical process operation. Current Opinion in Chemical Engineering 14, 49–55.
Devold, H., 2009. Oil and Gas Production Handbook: an Introduction to Oil and Gas Production. ABB.
Goel, P., Datta, A., Mannan, M.S., 2017. Industrial alarm systems: challenges and opportunities. J. Loss Prev. Process. Ind. 50, 23–36.
Hall, D.L., Llinas, J., 1997. An introduction to multisensor data fusion. In: Proceedings of the IEEE. IEEE, pp. 6–23.
Institute for Energy Technology (IFE), 2017. The petro-HRA guideline. Accessed on. https ://www.researchgate.net/publication/326156394_The_Petro-HRA_Guideline. (Accessed 2 May 2019).
Khakzad, N., Khan, F., Amyotte, P., 2011. Safety analysis in process facilities: comparison of fault tree and Bayesian network approaches. Reliab. Eng. Syst. Saf. 96, 925–932.
Khakzad, N., Khan, F., Amyotte, P., 2013. Dynamic safety analysis of process systems by mapping bow-tie into Bayesian network. Process Saf. Environ. Protect. 91, 46–53.
Khodabakhsh, A., Ari, I., Bakir, M., Ercan, A.O., 2018. Multivariate sensor data analysis for oil refineries and multi-mode identification of system behavior in real-time. IEEE Access 6, 64389–64405.
Liu, Z., Liu, Y., Cai, B., Zheng, C., 2015. An approach for developing diagnostic Bayesian network based on operation procedures. Expert Syst. Appl. 42, 1917–1926.
Matanovic, D., Cikes, M., Moslavac, B., 2012. Sand Control in Well Construction and Operation. Springer-Verlag Berlin Heidelberg.
Penberthy, W.L., Shaughnessy, C.M., 1992. Sand Control. Henry L. Doherty Memorial Fund of AIME, Society of Petroleum Engineers, Richardson, TX.
PetroWiki, 2019. Sand control. https://petrowiki.org/Sand_control. (Accessed 2 May 2019).
Rothenberg, D.H., 2009. Alarm Management for Process Control: a Best-Practice Guide for Design, Implementation, and Use of Industrial Alarm Systems. Momentum press.
Song, G., Khan, F., Wang, H., Leighton, S., Yuan, Z., Liu, H., 2016. Dynamic occupational risk model for offshore operations in harsh environments. Reliab. Eng. Syst. Saf. 150, 58–64.
U.S. Chemical safety and hazard investigation board, 2011. Investigation Report: Methyl Chloride Release January 22, 2010. https://www.csb.gov/assets/1/20/csb%20final %20report.pdf?13966. (Accessed 2 May 2019).
Wang, Z., Wang, Z., He, S., Gu, X., Yan, Z.F., 2017. Fault detection and diagnosis of chillers using Bayesian network merged distance rejection and multi-source non- sensor information. Appl. Energy 188, 200–214.
Wang, J., Yang, Z., Su, J., Zhao, Y., Gao, S., Pang, X., Zhou, D., 2018. Root-cause analysis of occurring alarms in thermal power plants based on Bayesian networks. Int. J. Electr. Power Energy Syst. 103, 67–74.
Wang, J., Wang, Z., Stetsyuk, V., Ma, X., Gu, F., Li, W., 2019. Exploiting Bayesian networks for fault isolation: a diagnostic case study of diesel fuel injection system. ISA Trans. 86, 276–286.
G. Song et al.

Journal of Loss Prevention in the Process Industries 67 (2020) 104267
8
White, M., Pierce, K., Acharya, T., 2018. A review of wax-formation/mitigation technologies in the petroleum industry. SPE Prod. Oper. 33, 476–485.
Wu, S., Zhang, L., Zheng, W., Liu, Y., Lundteigen, M.A., 2016. A DBN-based risk assessment model for prediction and diagnosis of offshore drilling incidents. J. Nat. Gas Sci. Eng. 34, 139–158.
Wu, G., Tong, J., Zhang, L., Zhao, Y., Duan, Z., 2018. Framework for fault diagnosis with multi-source sensor nodes in nuclear power plants based on a Bayesian network. Ann. Nucl. Energy 122, 297–308.
G. Song et al.