model compensation scale for child care …ceo.lacounty.gov/sib/pdf/res/bullet22.pdf · county of...
TRANSCRIPT

County of Los Angeles
MODEL COMPENSATION SCALE FOR CHILD CARE WORKERS STUDY
County of Los Angeles
Chief Administrative Office, Service Integration Branch Research and Evaluation Services
Manuel H. Moreno, Principal Investigator
Vandana Joshi
Julie Beardsley
Halil Toros
Max Stevens
Nancy Salem
March 17, 2005
David E. Janssen, Chief Administrative Officer
Lari Sheehan, Assistant Administrative Officer
Constance S. Sullivan, Assistant Division Chief
Prepared for:
County of Los Angeles, Chief Administrative Office Service Integration Branch, Office of Child Care

Acknowledgement
The authors wish to thank the many people and organizations who made this report possible. Laura Escobedo, of the County of Los Angeles Service Integration Branch Office of Child Care, provided valuable guidance and insight in developing the salary matrix and producing the final report. Special thanks to the child care providers throughout the County who responded to the Model Compensation Scale survey and provided us with valuable insights and suggestions. Finally, thanks to Mary Mar for her assistance in compiling this report.

TABLE OF CONTENTS
Overview ......................................................................................................................1
Background Research..................................................................................................2
Methodology Used to Develop the Salary Matrix .........................................................4
How to Read the Salary Matrix of the Model Compensation Scale ..............................6
Survey and Field Test ..................................................................................................7
Survey Findings ...........................................................................................................8
Hourly Wages.......................................................................................................9
Health Benefits.....................................................................................................11
Implementing the Salary Scale.............................................................................12
Barriers to Implementation ...................................................................................14
Conclusion ...................................................................................................................17
Survey Participants’ Hourly Rates................................................................................18
Appendix A – Model Compensation Scale (with Employee Benefits)...........................22
Appendix B – Model Compensation Scale (without Employee Benefits)......................23
Appendix C – Survey to Field Test the Model Compensation Scale ............................24
References...................................................................................................................31

1
COUNTY OF LOS ANGELES MODEL COMPENSATION SCALE FOR CHILD CARE WORKERS STUDY
It is well understood by professionals in the field of Early Childhood Education/Child Development that the quality of child care can be compromised by high staff turn-over.1 To promote appropriate salaries and benefits for qualified workers in the Early Childhood Education/Child Development field, and improve the retention of well-trained, educated and dedicated practitioners, the Research and Evaluation Services unit of the Service Integration Branch of the County of Los Angeles (County) Chief Administrative Office, has developed a Model Compensation Scale in collaboration with the County Child Care Planning Committee (Planning Committee). This scale is designed to reflect and reward the workers’ qualifications, education, and job responsibilities. The scale allows for a range of salaries for each job or position category, and is intended to be utilized by all types of child care organizations. To test the validity of this scale, it was mailed to the directors of selected child care centers, along with a survey to gather information about the feasibility of implementation. The data was collected and the results of this field test are presented in this report. Overview With over a million children in the County, whose parents work, the demand for child care in the region has increased beyond current capacity.2 Over 70 percent of publicly-funded child care programs in the County report waiting lists affecting thousands of children from low-income families.3 Providers of child care in Los Angeles vary in size and capacity, from small private centers to unified school districts and large universities. They include subsidized center-based sites, non-subsidized child care centers, and family child care providers. These last two groups care for the majority of children in the County, and historically, their workers have earned lower salaries and experienced higher turnover than those employed in subsidized programs. The subsidized centers offer better compensation, employ better educated staff, and report lower staff turnover than non-subsidized centers, despite the fact that the State of California has not provided for increases to the standard reimbursement rate for several years, which would allow providers of these centers to increase worker salaries.4
1 Vandell, D.L., Wolfe, B. (2000). Child Care Quality: Does It Matter and Does It Need to be Improved?
Office of the Assistant Secretary for Planning and Evaluation, U.S. Department of Health and Human Services, Washington, D.C.
2 The 2003 California Child Care Portfolio, Los Angeles County, California Child Care Resource &
Referral Network. Available at: http://www.rrnetwork.org/rrnet/our_research/2003portfolio.php. 3 Public Safety Can’t Wait: California’s Preschool Shortage, A Missed Opportunity for Crime Prevention.
(2005). Fight Crime: Invest In Kids, Washington, D.C. 4 The funding subsidized centers receive is a product of their days of operation and the number of
children they serve. The standard reimbursement rate (SRR) is the maximum daily per-child payment that subsidized child care center-based programs may earn. The SRR for 2000-01 was $26.62.6. At several points—coinciding at times with severe State budgetary pressures—the Legislature provided either no Cost-of-Living Adjustment (COLA) to subsidized child care programs, or a smaller adjustment than the rate of inflation or the increase provided to basic K-12 education allocations.

2
The segment of the labor force in the County providing child care is predominantly female. A high percentage of the workforce in child care and development is either Hispanic or African American. Salary information provided by the County Office of Child Care indicates that rates of compensation for this workforce lag behind those of professionals with similar skills and levels of responsibilities, and frequently does not include health care coverage.5 Yet, these workers comprise a well-educated workforce, with 22 percent holding at least a Bachelor’s degree, and almost all having completed at least some college courses relevant to their jobs. Low rates of compensation are a principal cause of staff turnover in child care programs. Staff turnover is a significant problem because numerous studies have shown that inconsistent care resulting from high turnover is detrimental to children’s development.6,7 Background Research Numerous studies have shown that high rates of staff turnover affect the quality of child care. Changing caregivers too often can affect a child's ability to form trusting, loving attachments.8 Staff turnover is also disruptive and wasteful for child care centers, as it drains resources of time and money to train new workers.9 Quality care has been shown to positively affect cognitive growth and language development, and the benefits of such care are especially pronounced in children from impoverished backgrounds.10 Research shows that when caregivers hold a Bachelor’s degree or higher, children in their care were more likely to display stronger cognitive growth.11 More recently, several studies have shown that children enrolled in quality preschool programs do better academically, have fewer behavior problems, and less instances of involvement in the juvenile justice system.12
5 Montgomery, D. L., Whitebook, M., Burton, A., Hikido, C., Vergun, R., & Chambers, J. (1996).
California child care and development compensation study: Towards promising policy and practice. (Final Report). Palo Alto, CA: American Institutes for Research.
6 Cost, Quality, and Child Outcomes Study Team (1995). Cost, quality, and child outcomes in child care
centers. Public report. Denver, CO: Department of Economics, Center for Research in Economic and Social Policy, University of Colorado at Denver.
7 Bellm, D., Whitebook, M, Burton A. (2002). Inside the Pre-K Classroom: A Study in Staffing and
Stability in State Funded Pre-Kindergarten Programs. Center for the Child Care Workforce. 8 Loeb, S., Fuller, B., Kagan, S., Carrol, B., Carroll, J., McCarthy, J. (2004). Child Care in Poor
Communities: Early Learning Effects of Type, Quality, and Stability. The Society for Research in Child Development.
9 Petrillose, M. (1998). Improving Bottom-line Results by Managing Turnover and Absenteeism.
University of Nevada, Las Vegas, Nevada. 10 Vandell, D.L., Wolfe, B. (2000). Child Care Quality: Does It Matter and Does It Need to be Improved?
Office of the Assistant Secretary for Planning and Evaluation U.S. Department of Health and Human Services, Washington, D.C.
11 Arnett, J. (1989). Caregivers in day-care centers: Does training matter? Journal of Applied
Developmental Psychology, 10, 541-552. 12 Brown, J. July (2002). The Link Between Early Childhood Education and Crime and Violence
Reduction, Policy Associate, Early Learning and Care.

3
Researchers studying child care compensation issues have noted that child care workers’ salaries do not respond to standard market forces.13 Despite the fact that these workers tend to be well educated, and provide services for which there is a high demand, they remain poorly compensated when compared to similarly skilled workers in other fields. This is a cause of job turnover within the child care field. This turnover rate in child care and development jobs greatly exceeds that of other teaching settings. The average annual rate of departure from child care positions is 30 percent, nationally, more than four times that of teachers in elementary schools (7%).14 High staff turnover has also been correlated with situations in which some members of staff hold higher degrees and work with co-workers who are less educated; and in situations in which staff with college graduates work with a greater percentage of staff who have less than a Bachelor’s degree.15 The Center for the Child Care Workforce (CCCW) examined data on child care workers in Los Angeles between 1995 and 2002 on behalf of the Planning Committee. While CCCW found some improvement in compensation rates during those years, (a time of economic expansion throughout the State), they also found that child care remained one of the lowest paid occupations in the County; that health insurance coverage was minimal; and that levels of staff turnover remained consistent with those reported in 1995. In addition, their research indicated that the average salary for the lowest-level Assistant Teachers in 2002 was beneath the self-sufficiency standard of a living wage for a single adult in the Los Angeles County, and further beneath the level required to support dependent children.16 Compounding the problem, it was found that child care and development workers with a Bachelor’s degree in Early Childhood Education or Child Development (an educational level comparable to that required of K-12 teachers), were leaving the child care field for the higher salaries offered by school districts.17 This study also found an inverse relationship between compensation rates and turnover rates; programs that offer lower salaries to teaching staff reported higher turnover rates. Programs with the highest turnover rate (100 percent), paid teachers 50 percent less than those with the lowest turnover rate (0-10 percent). Rapid staff turnover emphasizes the general inadequacies in the compensation plans offered to child care and development workers, which are often arbitrary and may depend upon how desperate a director is to hire or retain workers.18 13 Maria D. Montilla, Eric C. Twombly, Carol J. De Vita, June 01, 2001, Models for Increasing Child Care
Worker Compensation, http://www.urban.org/url.cfm?ID=310101. 14 Whitebook, M. and Bellm D. (1999). Taking on turnover: An action guide for child care center teachers
and directors. Washington, DC: Center for Child Care Workforce. 15 Whitebook, M. and Sakai, L. (2003). Turnover begets turnover: an examination of job and occupational
instability among child care center staff. Center for the Study of Child Care Employment. 16 Center for the Child Care Workforce. A Profile of the Child Care Center Workforce in Los Angeles
County: Findings from the 2002 Survey of Child Care Staff Salaries, Benefits, and Working Conditions. Prepared for the County of Los Angeles Child Care Planning Committee, December 2002, pp2, 13.
17 Ibid. pps. 9, 13, 20. 18 Anthony, Mary Ann. Designing a Job Classification and Wage Scale System. (2001). Child Care
Information Exchange.

4
Recognizing issues affecting this labor force, California policymakers passed the Assembly Bill 212 in 2000, which established the California CARES (Compensation and Retention Encourage Stability) program for purposes of promoting the retention of teachers and directors in the child care field. The County “Investing in Early Educators” program was developed by the Planning Committee and funded by the California Department of Education, per Chapter 547 of the Statutes of 2000 (AB 212). This program rewards child care workers for pursuing education in the field of child care and development by awarding them stipend incentives. It has yet to be determined as to whether this program can affect the level of wages paid to child care and development staff. The County Service Integration Branch-Office of Child Care, on behalf of the Planning Committee, contracted with Research and Evaluation Services in the Chief Administrative Office to develop a Model Compensation Scale of salaries for child care workers in center-based programs. The model was designed to suggest equitable compensation rates for different levels of education and training for child care workers in the County. The Model Compensation Scale uses salary increments linked to levels of education, responsibility, and work experience. By linking training and education to salary compensation, the model demonstrates incentives for child care workers to gain additional education and skills, and promotes the recruitment and retention of qualified child care workers. Methodology Used to Develop the Salary Matrix A database of salary information, provided by the Service Integration Branch-Office of Child Care, was used to develop a salary matrix for various child care positions. The salary matrix design includes:
• Staff positions, presented in the rows of the matrix. • Number of years of service for each position, presented in the sub-rows in the
matrix. • The education and experience qualifications for each position on the career
ladder, presented in the salary matrix columns. • Salaries for staff positions, starting with a base wage for each position at the
entry level and continuing with increments based on positions, educational steps, and years of service, presented in the individual cells of the salary matrix.
The Salary Matrix (see appendices B and C) determined seven categories (the columns) of educational and experience requirements. These qualification categories ranged from 6 to 12 college units of Early Childhood Education/Child Development (including core classes) to a Master’s degree, a degree in Administration, or other advanced credential.

5
A review of the sample salaries provided by the Office of Child Care revealed that the salaries paid for child care positions had a wide variation in the number of salary increments or steps. These ranged from only one (1) to over 20 steps, with the unified school districts having the widest range of steps. In addition, the increment amount for each salary step varied from a few cents per hour to significant increases of thousands of dollars annually for the higher positions. The data also revealed a wide variation in job titles for each occupational category. What was termed an “Assistant” in one center may be called an “Associate” in another, and so forth. In order to be able to compare salaries offered by different programs, specific categories of positions based on similar attributes needed to be defined. To accomplish this, the educational requirements for four teaching positions, as defined by the State of California, were used. These requirements specify the academic goals each teacher must meet to be granted the different levels of teaching permits.19 The Office of Child Care staff, with input from the Qualifications and Compensation Work Group of the Planning Committee, provided the data on minimum qualifications for each of the four positions. These educational categories were used to narrow the list down to four positions: Site Supervisor/Assistant Director, Head/Lead Teacher, Teacher, and Assistant Teacher. For each occupational category, blocks of six rows were allotted to represent an hourly rate, one for each year of experience with the employer at that job level. Zero represented the first year or entry level, and five represented the highest salary level within each category. A person would realize an increase in salary due to time on the job, every year up to five 5 years. The matrix does not include a guide for rate increases due to merit or quality of job performance, although the annual increases could be adjusted for this. To increase one’s rate of pay in a given year, beyond the annual increase for time spent on the job, a teacher would need to be promoted to the next category, either through merit and experience, or by increasing their educational level. To move from one position category to the next assumes that the individual meets the minimum educational requirements for higher level position. It was necessary to determine the base wage for each level of education and experience. In principle, the lowest entry-level compensation should offer a minimum of a living wage for a single adult. This would allow an entry-level child care worker to maintain a standard of living without being dependent upon public assistance. A decision was made to set the base level, or starting hourly rate, to the Living Wage Standard (LW) for the County in 2004.20 This hourly wage was taken from calculations derived from previously published estimates made by the County Research and Evaluation Services unit. These estimates use a formula that calculates an individual’s costs towards food, health insurance (and out of pocket medical costs), housing costs, miscellaneous personal expenses, and State and Federal income taxes. Information provided by the Office of Child Care indicated that many child care centers offered paid, or partially paid, health benefits as a part of their compensation package. 19 The State of California document listing the requirements for teachers may be viewed at:
http://www.ctc.ca.gov/credentials/CREDS/child-dev-permits.html. 20 Moreno, Manuel H., Halil Toros, Max Stevens, 2004, Living Wage Estimation for the County of
Los Angeles, 2004. Los Angeles: County of Los Angeles Chief Administrative Office/Service Integration Branch/Research and Evaluation Services.

6
An hourly wage in the middle, or mid-range of the scale, was determined. Selecting this mid-range figure was necessary in order to calculate the incremental increase or decrease for each cell. The mid-range hourly wage was equivalent to that of a teacher holding a Bachelor’s degree and working as a Lead or Head Teacher ($18.75/hour). The starting salary level was set close to that of an entry level elementary public school teacher in California. Achieving parity with elementary school district salaries is a long-term goal in order to increase the retention rates of qualified teachers in child care sites. After determining the starting and mid-level wage rates, the wage increments between positions were specified, based on educational steps and years of service, and filled in the appropriate cells in the matrix. How to Read the Salary Matrix of the Model Compensation Scale The Model Compensation Salary Matrix for child care and development personnel works like a wage ladder. It takes into consideration experience, responsibilities, and education, with greater emphasis placed on job responsibilities and educational levels than on time spent on the job. The teaching positions are displayed in the rows, and the educational requirement for each position is displayed at the head of each column. Each cell in the salary matrix represents the hourly wage rate for a combination of years of service and education level for each position. Cells with ‘Not Applicable’ (NA) value indicate that educational combinations are not applicable for that position, such as a starting salary for an Assistant Teacher position with a Master’s degree. The starting salary for a person with no experience with the minimum educational requirement, 6 to 12 units of Early Childhood Education/Child Development, was determined by using the living wage level for a single individual in the County. In 2004, this level was estimated to be $10.00 per hour, assuming health insurance is provided by the employer. The base value in the salary matrix represents this living wage level, which is the bottom or the starting value in Column C. Starting from this hourly wage base of $10.00, a child care worker would receive a $0.25 per hour increase for each additional year of experience in the same child care center.21 For example, an Assistant Teacher would earn $10.25 per hour after completing one year of service in the same center. Column B entitled, “Years of Service,” illustrates the wage increments for each additional year employed in the same center. Wages would increase for up to five years of service, for each position, and would stay at the same level after the fifth year, unless promoted or if the employer also provides merit increases. Zero years of service refers to the starting position at each specific child care occupational position. The rate of increase, $0.25 per hour for each additional year of service, is identical for all positions. The rate of increase between the different education/experience steps varies. For example, when an Assistant Teacher completes more than 12 units of Early Childhood Education/Child Development (moving to the next step), the hourly wage increases by $0.50 per hour. On the other hand, a worker (who may be an Assistant Teacher, Teacher, or Lead Teacher) who earns a Bachelor’s degree and moves from the fourth to the fifth level would earn an additional $2.50 per hour. The rate of increase from one 21 The matrix version with an allowance for health coverage begins at $11.00/hr.

7
education level to the next is the same for all applicable positions. These rates are displayed in the last row as a reference with a range between $0.50 and $2.50 per hour. The rate of increase for educational attainment is higher than for job retention, to indicate the greater importance placed on achieving higher levels of education in order to develop a highly professional workforce. This was a deliberate strategy to counter the “stay-in-place’ effect, which can be described as an individual staying in the same position, with the same employer, long enough to earn more than a more educated teacher who has been hired more recently. When a worker is promoted to the next level of occupational category with additional responsibilities, the hourly wage would go up by $0.75 per hour. This rate of increase is the same for all promotions. For example, if a Teacher, with three years of service and a 2-year Associate of Arts degree, which is the fourth level of education in the salary matrix, is promoted to a Lead Teacher, the hourly wage would increase from $14.50 to $15.25 per hour. The mid-range for a Lead Teacher with a Bachelor’s degree is $18.75 per hour. The full-time monthly salary based on this hourly rate is equivalent to the average monthly salary for beginning California elementary teachers. The higher hourly wage of $20.75 per hour for a Teacher with a Bachelor’s degree, plus additional qualifications and training, is equivalent to that of a beginning pre-credentialed Teacher in Los Angeles Unified School District. Survey and Field Test A survey (see Appendix C) was developed to field test the Model Compensation Scale. The survey, salary matrix, and instructions on how to read the salary matrix were mailed to the Program Directors/Administrators of 36 child care sites. The survey requested information about the actual hourly wages paid to their employees; whether they would consider implementing the proposed salary scale; and what barriers to implementation might exist. The response rate was approximately 70 percent, with 26 providers completing the survey. The survey data was collected either by a telephone interview, or the completed survey was returned by mail or fax. The responding child care centers reflected an even distribution of the types of centers in the County, i.e., small, medium, and large; and having various auspices and funding sources: school districts, public entities, private proprietary, community–based non-profits, government subsidized centers, and fee-based programs. Information previously provided to the Research and Evaluation Services unit by the Office of Child Care indicated that the salaries for Program Directors/Administrators were much higher than for the other positions. A decision was made to exclude these salaries from the survey questions and the scale, so as not to skew the analysis of salaries for the other occupational categories. The highest position included in the field test survey was that of a Site Supervisor/Assistant Director, and the lowest position was that of an Assistant Teacher. Survey respondents, who were almost always the Program Director/Administrator, were asked to state the actual hourly wages paid to workers at their site, in each of the four positions: Assistant Director/Site Supervisor; Lead Teacher; Teacher; and Assistant Teacher. Respondents were then asked to identify the suggested wage in the salary matrix corresponding to the educational and experience level for each of the

8
positions. During the interview to collect the results of the field test survey, the Program Directors/Administrators were given an opportunity to make comments about implementing the proposed salary scale, as well as other issues related to compensation within the child care field.
Survey Findings Due to the small number of survey respondents (N=26), no statistical tests were conducted on the data. Descriptive statistical tests, such as chi-square, require at least 5 cases per cell, and because of the small sample size, this was not always the case. The survey data was used mostly for qualitative responses and for describing data using bar graphs without statistical tests. Although most of the Program Directors/Administrators agreed that the wages suggested in the Model Compensation Scale were appropriate for the levels of experience and education, very few centers were actually paying the suggested salaries. Two Program Directors felt the wages suggested in the scale were too high, and one Director wryly stated that the job of Early Childhood Education was so important that no salary was high enough!
Figure 1
Average Actual and Model Hourly Rates by Position
18.9
14.7 14.2
9.5
17.816.6
12.1
19.3
0
5
10
15
20
25
Assistant Director Lead Teacher Teacher Assistant Teacher
Mea
n Ho
urly
Rat
es
Actual Suggested
The survey results displayed a wide variation in the salaries of child care workers, in given positions with similar levels of education. But, overall, the majority of actual salaries paid were below those suggested in the salary matrix. The most disparity between actual and suggested salaries was found at the lower level positions.
9
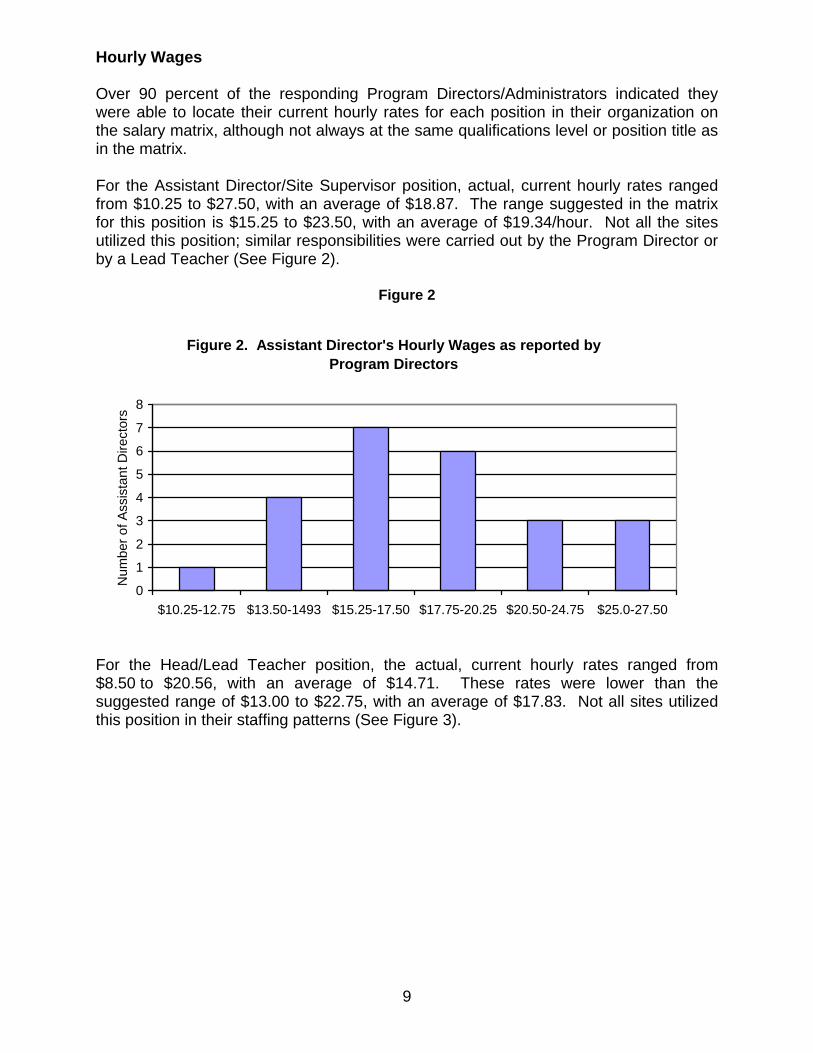
Hourly Wages Over 90 percent of the responding Program Directors/Administrators indicated they were able to locate their current hourly rates for each position in their organization on the salary matrix, although not always at the same qualifications level or position title as in the matrix. For the Assistant Director/Site Supervisor position, actual, current hourly rates ranged from $10.25 to $27.50, with an average of $18.87. The range suggested in the matrix for this position is $15.25 to $23.50, with an average of $19.34/hour. Not all the sites utilized this position; similar responsibilities were carried out by the Program Director or by a Lead Teacher (See Figure 2).
Figure 2
Figure 2. Assistant Director's Hourly Wages as reported by Program Directors
0
1
2
3
4
5
6
7
8
$10.25-12.75 $13.50-1493 $15.25-17.50 $17.75-20.25 $20.50-24.75 $25.0-27.50
Num
ber o
f Ass
ista
nt D
irect
ors
For the Head/Lead Teacher position, the actual, current hourly rates ranged from $8.50 to $20.56, with an average of $14.71. These rates were lower than the suggested range of $13.00 to $22.75, with an average of $17.83. Not all sites utilized this position in their staffing patterns (See Figure 3).

10
Figure 3
Head/Lead Teacher's Hourly Wages as Reported by the Program Directors
0
2
4
6
8
10
12
$8.50-10.0 $10.25-12.75 $13.0-15.75 $16.0-18.0 $18.25-20.0 $20.25-22.75
Num
ber o
f Hea
d/Le
ad T
each
ers
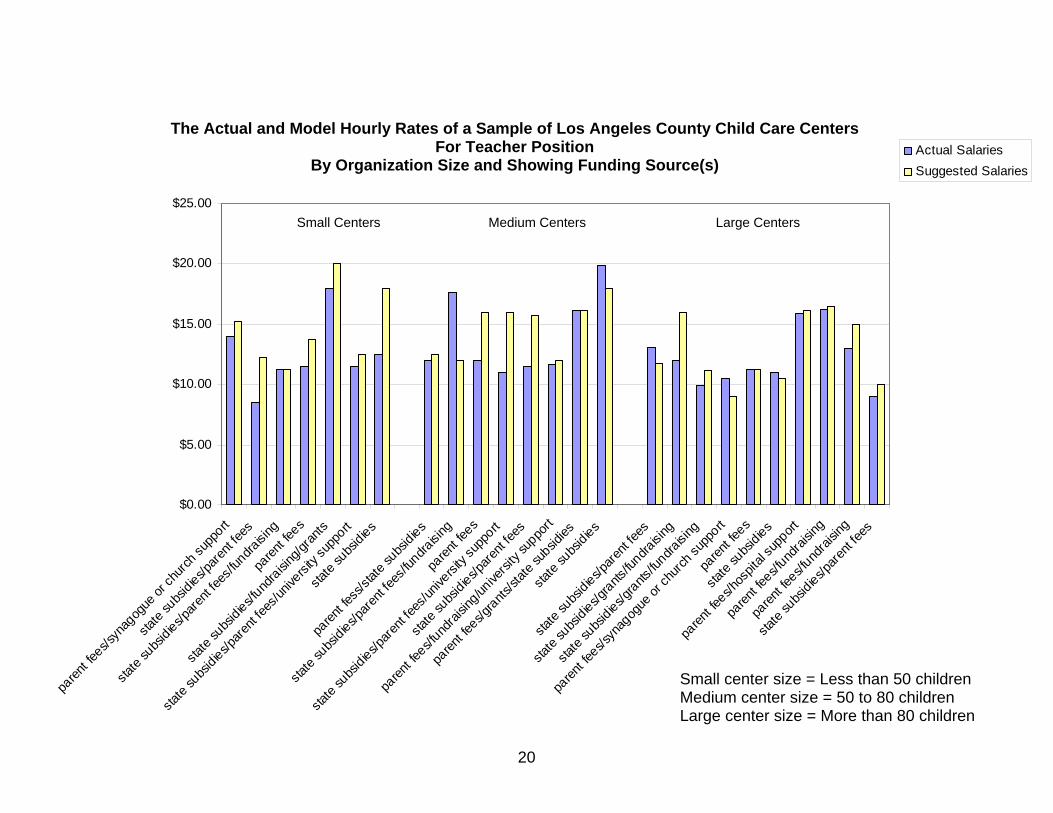
The hourly rates for the position of Teacher also were below the suggested range at $8.50 to $19.90, with the average actual rate at $14.20. The suggested range is $11.25 to $22.00, the average being $16.63 per hour (See Figure 4).
Figure 4
Teacher's Hourly Wages as Reported by Program Directors
02468
101214
$8.50-11.0 $11.25-13.50
$13.75-16.0
$16.25-18.50
$18.75-20.0
$20.25-22.0
Num
ber o
f Tea
cher
s
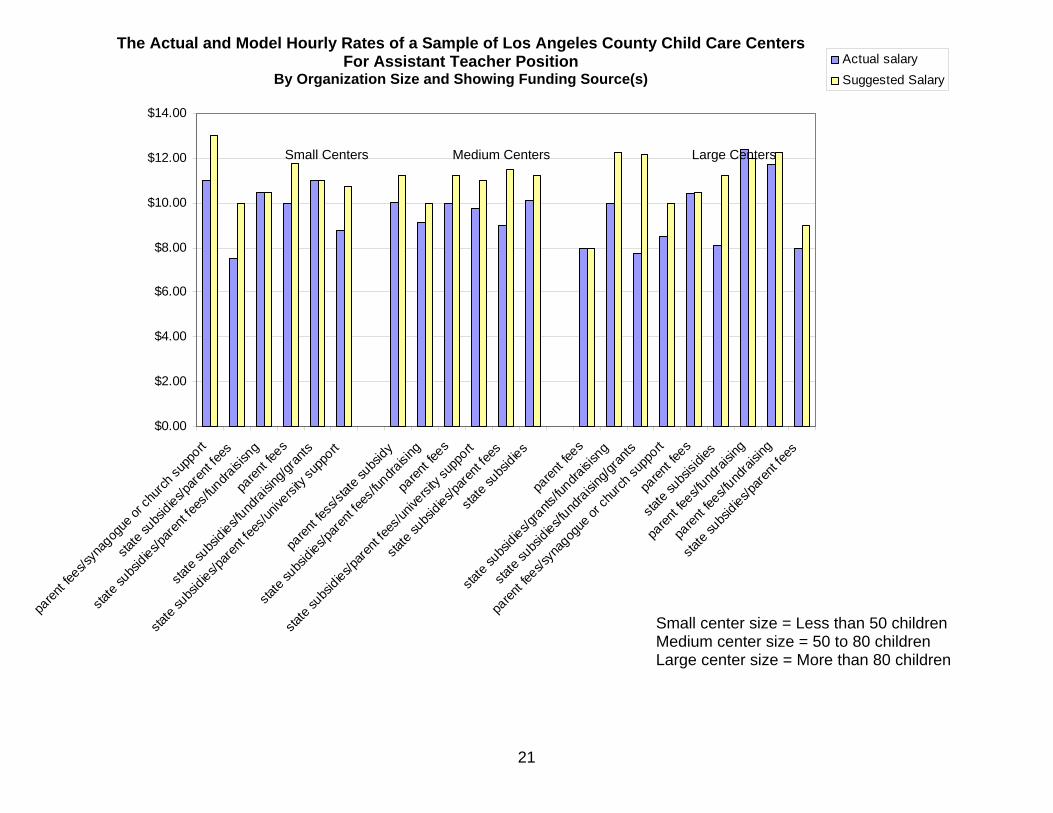
For Assistant Teachers, the range of actual hourly rates was $7.50 to $12.81, with an average of $9.49 per hour. The suggested salary range is $10.00 to $14.25, with an average of $12.12 per hour. Not all sites had workers filling this position. Several sites reported that students or interns acted as Assistant Teachers. At some sites, Assistant Teachers worked only part-time, were paid less than full-time child care workers at this level, and did not have any health benefits (See Figure 5).

11
Figure 5
Assistant Teacher's Hourly Wages as Reported by the Program Directors
0
2
4
6
8
10
12
$7.50-9.50 $9.75-11.25 $11.50-13.0 $13.25-14.25Num
ber o
f Ass
ista
nt T
each
ers
Health Benefits All the child care programs responding to the survey offered health benefits, either fully- or partially-paid for all, for most of their staff. The one position that was most often the exception was Assistant Teacher. This situation frequently occurred in programs where students or interns were employed to gain educational credits and experience. Some of the larger programs also offered retirement and vacation benefits. When survey respondents were asked if implementing the proposed compensation scale would impact their ability to provide health benefits for their employees, 53.8 percent (n=14) said it would not; 26.9 percent (n=7) said it would; and 19.2 percent (n=5) responded that they were not sure. Those who were uncertain stated they needed to discuss it with a Board of Directors or other governing body. When asked if they would consider offering a choice between higher salary or health benefits, 15.9 percent (n=4) of the child care programs said “Yes,” 34.6 (n=9) providers said “No,” and 57.7 percent (n=15) were uncertain or did not answer (See Figure 6).

12
Figure 6
Basic Health Benefits Paid for Each Position
0%
10%
20%
30%
40%
50%
60%
70%
80%
90%
100%
Assistant Director Lead Teacher Teacher Assistant Teacher
YesNo
Implementing the Salary Scale Many Program Directors/Administrators stated that increased awareness and recognition of the importance of Early Childhood Education would have a positive effect towards getting the Model Compensation Scale implemented throughout the industry. However, only 58 percent said they would or could consider implementing the model compensation scale at their centers at this time (See Figure 7). Figure 7
Would Consider Implementing the Scale in the Organization
0%
10%
20%
30%
40%
50%
60%
70%
80%
90%
100%
Yes No

13
The survey asked three questions about whether the suggested salaries in the salary matrix were appropriately matched to the suggested levels of education, experience, and responsibility. This is how the participants responded:
• 83 percent reported the wages were appropriately matched to the level of education.
• 88 percent reported the suggested wages were appropriately matched to the level of experience.
• 83 percent reported the suggested wages were well matched to the level of responsibility.
The survey asked respondents if they were able to find the hourly rates in the Model Compensation Scale that corresponded to the actual wages they paid their employees. Some centers did not have all positions, however:
• 82 percent reported they could find the salaries for the Site Supervisor/Assistant Director position.
• 85 percent reported they could find the salaries for the Lead Teacher position. • 74 percent reported they could find the salaries for the Teacher position. • 71 percent reported they could find the salaries for Assistant Teacher position.
When asked if the model compensation scale (salary matrix) would help in achieving improved compensation for staff, 75 percent of the Program Directors said it would be “very helpful,” 20 percent indicated it would be “somewhat helpful,” and only 5 percent said it would help “not at all” (See Figure 8).
Figure 8
How Helpful Is the Proposed Salary Scale
0%
10%
20%
30%
40%
50%
60%
70%
80%
90%
100%
Very Helpful Somewhat Helpful Not helpful at all

14
Barriers to Implementation There are a wide variety of factors influencing the child care center’s ability to fully implement the Model Compensation Scale. These include:
• State reimbursement rate (SRR): This is a per/child, per/day rate paid by the California Department of Education to its child development center contractors serving low-income families, including those participating in Welfare-to-Work programs. Many centers rely solely upon the SRR for their operational budgets. But this rate is inadequate, in most instances, to allow for staff compensation levels suggested in the Model Compensation Scale, and does not adequately reflect the costs of living in the County.22 For example, the SRR does not take into consideration the costs of health benefits for child care workers. Working poor families cannot be charged more, nor can they afford to pay increased fees, so child care sites, where the SRR is the primary source of funding, are often at a disadvantage when hiring teachers with higher qualifications or with additional training such as Special Education credentials. Increasing reimbursement rates that fall more in line with the Model Compensation Scale can only be addressed at the State legislative level.
• Lack of funding: This was the most common response when respondents were
asked about barriers to implementing the proposed salary scale. Where funding is a combination of public and private, the fees charged to poor families may be lower than market rates, but most often this is the most these families can afford to pay. With low State reimbursement rates, centers often must rely upon their fundraising abilities, grants, and other outside sources of income.
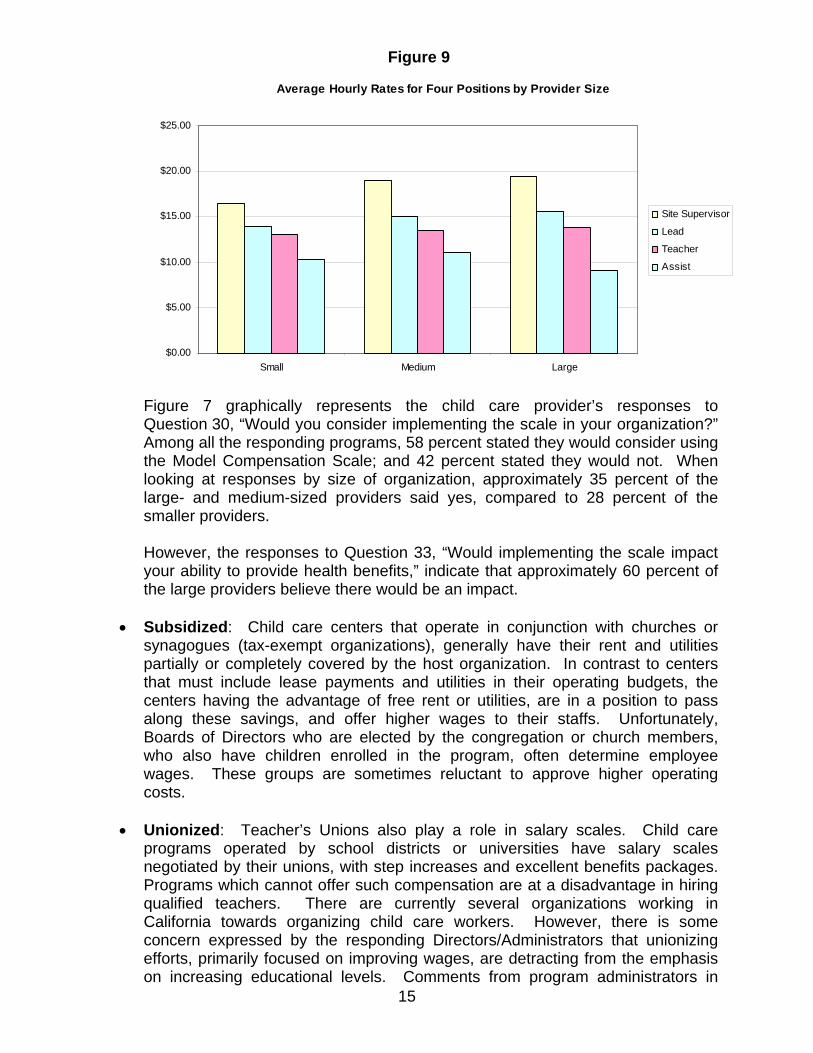
• Size of the organization: The larger child care programs tend to pay higher
salaries for the Site Supervisor/Assistant Director and Lead Teacher positions. Small programs were found to pay more for Assistant Teachers, and the rates at small centers were more compressed. That is, there was a smaller difference in the pay rates from one position to another. For example, on average, the difference between the lowest paid and highest paid positions in small centers was $6.25 per hour. Whereas in larger organizations, the difference was $11 per hour (See Figure 9).
22 Moreno, Manuel H., Halil Toros, Max Stevens. 2004. Living Wage Estimation for the County of
Los Angeles, 2004. Los Angeles: County of Los Angeles Chief Administrative Office/Service Integration Branch/Research and Evaluation Services.
15
Figure 9
Figure 7 graphically represents the child care provider’s responses to Question 30, “Would you consider implementing the scale in your organization?” Among all the responding programs, 58 percent stated they would consider using the Model Compensation Scale; and 42 percent stated they would not. When looking at responses by size of organization, approximately 35 percent of the large- and medium-sized providers said yes, compared to 28 percent of the smaller providers. However, the responses to Question 33, “Would implementing the scale impact your ability to provide health benefits,” indicate that approximately 60 percent of the large providers believe there would be an impact.
• Subsidized: Child care centers that operate in conjunction with churches or
synagogues (tax-exempt organizations), generally have their rent and utilities partially or completely covered by the host organization. In contrast to centers that must include lease payments and utilities in their operating budgets, the centers having the advantage of free rent or utilities, are in a position to pass along these savings, and offer higher wages to their staffs. Unfortunately, Boards of Directors who are elected by the congregation or church members, who also have children enrolled in the program, often determine employee wages. These groups are sometimes reluctant to approve higher operating costs.
• Unionized: Teacher’s Unions also play a role in salary scales. Child care
programs operated by school districts or universities have salary scales negotiated by their unions, with step increases and excellent benefits packages. Programs which cannot offer such compensation are at a disadvantage in hiring qualified teachers. There are currently several organizations working in California towards organizing child care workers. However, there is some concern expressed by the responding Directors/Administrators that unionizing efforts, primarily focused on improving wages, are detracting from the emphasis on increasing educational levels. Comments from program administrators in
Average Hourly Rates for Four Positions by Provider Size
$0.00
$5.00
$10.00
$15.00
$20.00
$25.00
Small Medium Large
Site Supervisor
Lead
Teacher
Assist
16
currently unionized environments indicate that it would be difficult to promote the higher qualifications required on the matrix to match current level of wages paid (higher than those on the matrix). At the same time, some union organizers are more aware of the qualifications-quality link, and are willing to work with the child care community to promote greater levels of funding that would allow fairer compensation levels for higher educational qualifications.
• Additional costs: Worker’s compensation costs have risen over the past three
years, and for some centers, payments have actually tripled. For many programs, the ability to increase staff wages is being offset by these increased insurance payments.
Centers are often unable to afford the cost of hiring teachers with specialized training, for instance, teachers with Special Education (SPED) certificates, even though the centers may serve many children with special education needs.
• Lack of awareness: Many of those surveyed, expressed the belief that the
public lacks awareness of the importance of Child Development. They stated that they continue to encounter the attitude in the general public that what child care centers do is glorified “baby-sitting.” They pointed out that the academic requirements for children in elementary school have increased, and children must be more academically prepared for Kindergarten and First Grade than ever before. This trend is not expected to change. Increased public awareness of the importance of Child Development will play an important role in bringing public pressure on the State legislature to increase the standard reimbursement rates, and in the public’s willingness to pay more for the child care and development services desired.
• Impact on benefits: Survey respondents were asked whether implementing the
suggested salary scale would negatively impact their ability to provide health benefits to their employees. Thirty-six percent (n=8) responded they believed it would; 64 percent said it would not. Among the 36 percent who said that implementing the scale would impact providing health benefits to their employees, 50 percent (n=4) said they would consider offering a choice between higher salary in place of benefits to their employees.
• AB 212 stipends and age of applicants: Assembly Bill 212 was enacted to
provide incentives to child care workers to allow them to return to school and increase their educational attainment. The goal of this program is to provide incentives to improve educational levels and to reduce job turnover in the child care field. Information provided by the Office of Child Care indicates the average age of the majority of workers taking advantage of this program is over 40. Some Program Directors/Administrators stated that younger female employees, who could benefit the most from this program, may not be participating as much as older employees due to the difficulty in pursuing more education while attempting to balance family responsibilities and work.

17
Conclusion The Model Compensation Scale (matrix) was generally well received, even by those who said they were not yet able to implement it. Many Program Directors/Administrators stated that it was a useful tool, one they could to take to their employers, Boards of Directors, or other governing bodies, in proposing salary increases to show the relation between education, experience, and compensation levels. Standardization of wages for child care workers will be a process as much as a goal due to the diversity of programs in the County. Central to this issue are the rates of reimbursement the State pays for child care for low-income families. Increasing these rates would have a particularly profound impact on compensation, particularly at the low end of the wage scale. Higher levels of compensation would create incentives for child development teachers to remain in child development programs, rather than moving into teaching in the K-12 system. A positive experience in a stable child care environment with low staff turnover translates into better grades throughout school, improved socialization, and helps keep children out of the juvenile justice system. Increasing child development teachers’ educational qualifications and providing an appropriate level of economic compensation commensurate with education, experience, and responsibility can reduce levels of child care staff turnover and improve the quality of care for our children.
18
$0.00
$5.00
$10.00
$15.00
$20.00
$25.00
$30.00
paren
t fees/s
ynag
ogue
or ch
urch s
uppo
rt
state
subs
idies/pare
nt fee
s
state
subs
idies/pare
nt fee
s/fun
draisin
gpa
rent fe
es
state
subs
idies/fund
raising/g
rants
state
subs
idies/pare
nt fee
s/univ
ersity
supp
ort
state
subs
idies
paren
t fess
/state
subs
idies
state
subs
idies/pare
nt fee
s/fun
draisin
gpa
rent fe
es
state
subs
idies/pare
nt fee
s
paren
t fees/f
undrai
sing/un
iversi
ty su
pport
paren
t fees/g
rants/st
ate su
bsidies
state
subs
idies
state
subs
idies/pare
nt fee
s
state
subs
idies/grants
/fundra
ising
state
subs
idies/grants
/fundra
ising
paren
t fees/s
ynag
ogue
or ch
urch s
uppo
rtpa
rent fe
es
state
subs
idies
paren
t fees/h
ospit
al su
pport
paren
t fees/f
undrai
sing
paren
t fees/f
undrai
sing
state
subs
idies/pare
nt fee
s
Actual SalarySuggested Salary
Small centers Medium centers Large centers
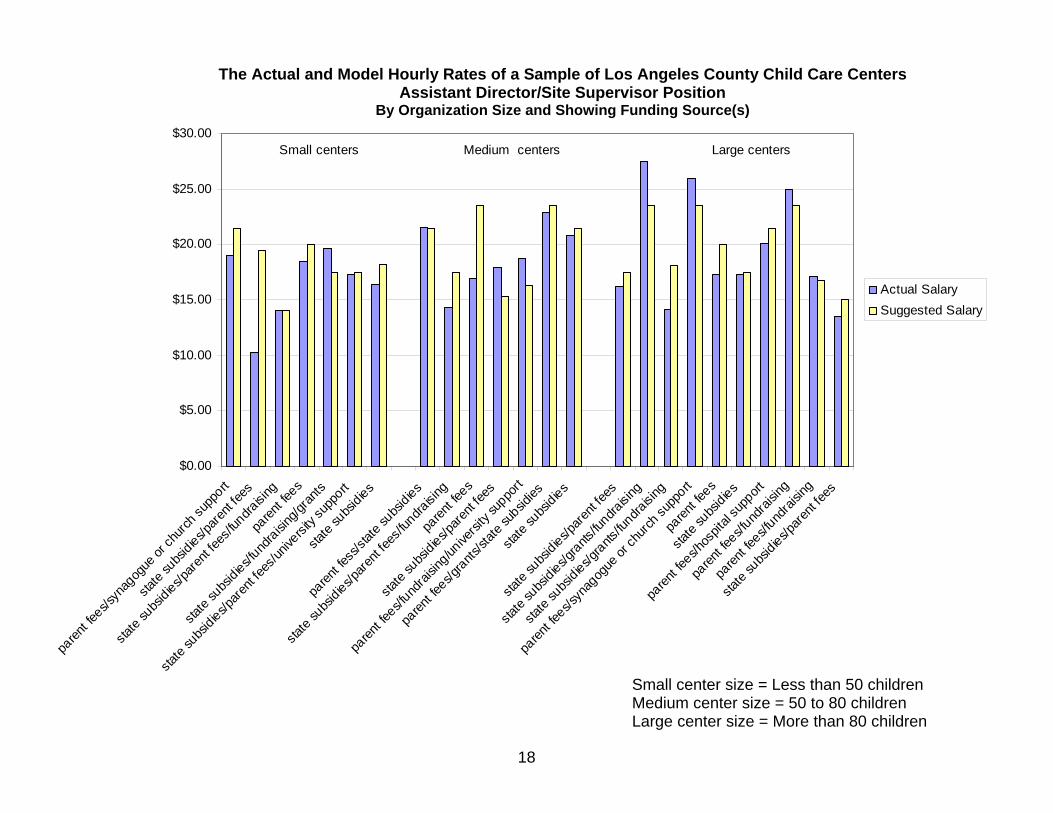
The Actual and Model Hourly Rates of a Sample of Los Angeles County Child Care Centers Assistant Director/Site Supervisor Position
By Organization Size and Showing Funding Source(s)
Small center size = Less than 50 children Medium center size = 50 to 80 children Large center size = More than 80 children

19
$0.00
$5.00
$10.00
$15.00
$20.00
$25.00
state
subs
idies
/paren
t fees
state
subs
idies
/paren
t fees/f
undrai
sing
state
subs
idies
/paren
t fees/u
nivers
ity su
pport
state
subs
idies
/paren
t fees
state
subs
idies
/paren
t fees
state
subs
idies
paren
t fees
/hosp
ital s
uppo
rt
state
subs
idies
/paren
t fees/u
nivers
ity su
pport
state
subs
idies
/paren
t fees/f
undrai
sing
paren
t fees
paren
t fees
/fundra
ising
/unive
rsity
supp
ort
paren
t fees
/gran
ts/sta
te su
bsidies
paren
t fees
paren
t fees
/syna
gogue
or ch
urch s
uppo
rt
state
subs
idies
/fund
raisin
g/gran
ts
paren
t fess
/state
subs
idies
state
subs
idies
paren
t fees
/fundra
ising
paren
t fees
/fundra
ising
paren
t fees
Actual Salaries
Suggested Salaries
The Actual and Model Hourly Rates of a Sample of Los Angeles County Child Care Centers Lead Teacher Position
By Organization Size and Showing Funding Source(s)
Small Centers Medium Centers Large Centers
Small center size = Less than 50 children Medium center size = 50 to 80 children Large center size = More than 80 children
20
The Actual and Model Hourly Rates of a Sample of Los Angeles County Child Care Centers
For Teacher Position By Organization Size and Showing Funding Source(s)
Small center size = Less than 50 children Medium center size = 50 to 80 children Large center size = More than 80 children
$0.00
$5.00
$10.00
$15.00
$20.00
$25.00
paren
t fees/s
ynag
ogue
or ch
urch s
uppo
rt
state
subs
idies/pare
nt fee
s
state
subs
idies/pare
nt fee
s/fun
draisin
gpa
rent fe
es
state
subs
idies/fund
raising/g
rants
state
subs
idies/pare
nt fee
s/univ
ersity
supp
ort
state
subs
idies
paren
t fess
/state
subs
idies
state
subs
idies/pare
nt fee
s/fun
draisin
gpa
rent fe
es
state
subs
idies/pare
nt fee
s/univ
ersity
supp
ort
state
subs
idies/pare
nt fee
s
paren
t fees/f
undrai
sing/un
iversi
ty su
pport
paren
t fees/g
rants/st
ate su
bsidies
state
subs
idies
state
subs
idies/pare
nt fee
s
state
subs
idies/grants
/fundra
ising
state
subs
idies/grants
/fundra
ising
paren
t fees/s
ynag
ogue
or ch
urch s
uppo
rtpa
rent fe
es
state
subs
idies
paren
t fees/h
ospit
al su
pport
paren
t fees/f
undrai
sing
paren
t fees/f
undrai
sing
state
subs
idies/pare
nt fee
s
Actual SalariesSuggested Salaries
Small Centers Medium Centers Large Centers
21
$0.00
$2.00
$4.00
$6.00
$8.00
$10.00
$12.00
$14.00
paren
t fees/s
ynag
ogue
or ch
urch s
uppo
rt
state
subs
idies/pare
nt fee
s
state
subs
idies/pare
nt fee
s/fun
draisis
ngpa
rent fe
es
state
subs
idies/fund
raising/g
rants
state
subs
idies/pare
nt fee
s/univ
ersity
supp
ort
paren
t fess
/state
subs
idy
state
subs
idies/pare
nt fee
s/fun
draisin
gpa
rent fe
es
state
subs
idies/pare
nt fee
s/univ
ersity
supp
ort
state
subs
idies/pare
nt fee
s
state
subs
idiespa
rent fe
es
state
subs
idies/grants
/fundra
isisng
state
subs
idies/fund
raising/g
rants
paren
t fees/s
ynag
ogue
or ch
urch s
uppo
rtpa
rent fe
es
state
subs
isidie
s
paren
t fees/f
undrai
sing
paren
t fees/f
undrai
sing
state
subs
idies/pare
nt fee
s
Actual salarySuggested Salary
Small center size = Less than 50 children Medium center size = 50 to 80 children Large center size = More than 80 children
Small Centers Medium Centers Large Centers
The Actual and Model Hourly Rates of a Sample of Los Angeles County Child Care Centers For Assistant Teacher Position
By Organization Size and Showing Funding Source(s)

22
Appendix A - Model Compensation Scale (With Employee Benefits)
Column A Column B Column C Column D Column E Column F Column G Column H Column I Column J
Position Years of Service
6 to 12 units of ECE/CD
12 to 24 units ECE/CD
including core courses and experience
24 + units in child
development including 16
units of general
education and experience
AA (or 60 units)
including 24 ECE/CD units and general education
AA (or 60 units) with 24 ECE/CD including core
courses + 6 units admin + 2 units
adult supervision + 1 year
classroom supervision
BA with 24 units of
ECE/CD and some
experience
BA with 24 ECE/CD units + 6 units admin +
2 units adult supervision +
supervisory and classroom experience (2 - 3 years)
MA or Admin credential or
Teaching credential + experience
5+ NA NA NA NA 18.00 4 NA NA NA NA 17.75 3 NA NA NA NA 17.50 2 NA NA NA NA 17.25
Program Director (Small Center or single site)
1 NA NA NA NA 17.00
On a different pay scale
5 NA NA NA 16.50 17.50 20.00 21.50 23.50 4 NA NA NA 16.25 17.25 19.75 21.25 23.25 3 NA NA NA 16.00 17.00 19.50 21.00 23.00 2 NA NA NA 15.75 16.75 19.25 20.75 22.75 1 NA NA NA 15.50 16.50 19.00 20.50 22.50
Supervisor/ Assistant Director
0 NA NA NA 15.25 16.25 18.75 20.25 22.25 5 NA NA 14.25 15.75 16.75 19.25 20.75 22.75
4 NA NA 14.00 15.50 16.50 19.00 20.50 22.50 3 NA NA 13.75 15.25 16.25 18.75 20.25 22.25 2 NA NA 13.50 15.00 16.00 18.50 20.00 22.00 1 NA NA 13.25 14.75 15.75 18.25 19.75 21.75
Head/ Lead Teacher
0 NA NA 13.00 14.50 15.50 18.00 19.50 21.50 5 NA 12.50 13.50 15.00 16.00 18.50 20.00 22.00
4 NA 12.25 13.25 14.75 15.75 18.25 19.75 21.75 3 NA 12.00 13.00 14.50 15.50 18.00 19.50 21.50 2 NA 11.75 12.75 14.25 15.25 17.75 19.25 21.25 1 NA 11.50 12.50 14.00 15.00 17.50 19.00 21.00
Teacher
0 NA 11.25 12.25 13.75 14.75 17.25 18.75 20.75 5 11.25 11.75 12.75 14.25 NA NA NA NA
4 11.00 11.50 12.50 14.00 NA NA NA NA 3 10.75 11.25 12.25 13.75 NA NA NA NA 2 10.50 11.00 12.00 13.50 NA NA NA NA 1 10.25 10.75 11.75 13.25 NA NA NA NA
Assistant Teacher
0 10.00 10.50 11.50 13.00 NA NA NA NA
$0.50 $1.00 $1.50 $1.00 $2.50 $1.50 $2.00

23
Appendix B - Model Compensation Scale (Without Employee Benefits)
Column A Column B Column C Column D Column E Column F Column G Column H Column I Column J
Position Years of Service
6 to 12 units of ECE/CD
12 to 24 units ECE/CD
including core courses and experience
24 + units in child
development including 16
units of general
education and experience
AA (or 60 units) including 24
ECE/CD units and general education
AA (or 60 units) with 24 ECE/CD including core
courses + 6 units admin + 2 units
adult supervision + 1 year
classroom supervision
BA with 24 units of
ECE/CD and some
experience
BA with 24 ECE/CD units + 6 units admin +
2 units adult supervision +
supervisory and classroom experience (2 - 3 years)
MA or Admin credential or
Teaching credential + experience
5+ NA NA NA NA 19.00 4 NA NA NA NA 18.75 3 NA NA NA NA 18.50 2 NA NA NA NA 18.25
Program Director (Small Center or single site)
1 NA NA NA NA 18.00
On a different pay scale
5 NA NA NA 17.50 18.50 21.00 22.50 24.50 4 NA NA NA 17.25 18.25 20.75 22.25 24.25 3 NA NA NA 17.00 18.00 20.50 22.00 24.00 2 NA NA NA 16.75 17.75 20.25 21.75 23.75 1 NA NA NA 16.50 17.50 20.00 21.50 23.50
Supervisor/ Assistant Director
0 NA NA NA 16.25 17.25 19.75 21.25 23.25 5 NA NA 15.25 16.75 17.75 20.25 21.75 23.75
4 NA NA 15.00 16.50 17.50 20.00 21.50 23.50 3 NA NA 14.75 16.25 17.25 19.75 21.25 23.25 2 NA NA 14.50 16.00 17.00 19.50 21.00 23.00 1 NA NA 14.25 15.75 16.75 19.25 20.75 22.75
Head/Lead Teacher
0 NA NA 1400 15.50 16.50 19.00 20.50 22.50 5 NA 13.50 14.50 16.00 17.00 19.50 21.00 23.00
4 NA 13.25 14.25 15.75 16.75 19.25 20.75 22.75 3 NA 13.00 14.00 15.50 16.50 19.00 20.50 22.50 2 NA 12.75 13.75 15.25 16.25 18.75 20.25 2225 1 NA 12.50 13.50 15.00 16.00 18.50 20.00 22.00
Teacher
0 NA 12.25 13.25 14.75 15.75 18.25 19.75 21.75 5 12.25 12.75 13.75 15.25 NA NA NA NA
4 12.00 12.50 13.50 14.00 NA NA NA NA 3 11.75 12.25 13.25 14.75 NA NA NA NA 2 11.50 12.00 13.00 14.50 NA NA NA NA 1 11.25 11.75 12.75 14.25 NA NA NA NA
Assistant Teacher
0 11.00 11.50 12.50 14.00 NA NA NA NA
$0.50 $1.00 $1.50 $1.00 $2.50 $1.50 $2.00

24
Appendix C
Survey to Field Test the Model Compensation Scale
Please see the attached salary matrix. Compare the salaries offered to your staff in your organization against the salaries proposed in the matrix. Please provide answers for the following positions listed below. Section I. Questions about Site Supervisor or Assistant Director 1. Does the Supervisor or Assistant Director in your organization meet the qualifications specified in the following
columns?
If yes, please specify which column. If no, skip to question 2.
Column G Yes ___ No ___ Column H Yes ___ No ___ Column I Yes ___ No ___ Column J Yes ___ No ___
2. If columns G, H, I & J do not describe the actual qualifications of your Supervisor/Assistant Director, please specify which column best describes the actual qualification (Check as many as apply):
Columns: D ___ E ___ F ___ None ___
3. If none, what are the qualifications of this position?
4. What does this individual actually earn per hour? $ ____________.
5. Based on the actual qualifications, according to the salary scale, what should a Supervisor/Assistant Director earn per hour? $ ____________.
6. Are basic health benefits paid or partially paid for this position in your organization?
Yes ___ No ___

25
Section II. Questions about Head/Lead Teacher. Defined as the Primary Teacher with a group/classroom; or the Lead Teacher over a few groups of children (Note: If there are three or more Head/Lead Teachers in your organization, please provide information for two Head/Lead Teachers in your organization). 7. Does the Head or Lead Teacher in your organization meet the qualifications specified in the following columns?
If yes, please specify which columns. If no, skip to question 8.
Column E Yes ___ No ___ Column F Yes ___ No ___ Column G Yes ___ No ___ Column H Yes ___ No ___
8. If columns E, F, G & H do not describe the actual qualifications of a Head/Lead Teacher, please specify which
column best describes the actual qualification (Check as many as apply):
Columns: C ___ D ___ I ___ J ___ None ___ 9. If none, what are the qualifications of this position?
10. What does a Head/Lead Teacher actually earn per hour? $ ____________. 11. Based on the actual qualifications, according to the salary scale, what should a Head/Lead Teacher earn per hour?
$ ____________. 12. Are basic health benefits paid or partially offered for this position in your organization? Yes ___ No ___

26
Section III. Questions about Teacher. Defined as one of a team of staff assigned to a group; or the sole staff with a group of children (Note: If there are five or more Teachers in your organization, please provide information for two Teachers in your organization). 13. Does a Teacher in your organization meet the qualifications specified in the following columns?
If yes, please specify which column. If no, skip to question 14.
Column D Yes ___ No ___ Column E Yes ___ No ___ Column F Yes ___ No ___ Column G Yes ___ No ___ Column H Yes ___ No ___ Column I Yes ___ No ___ Column J Yes ___ No ___
14. If columns D, E, F, G, H, I and J do not describe the actual qualifications of a Teacher, please specify which column
best describes the actual qualification (Check as many as apply):
Column: C ___ None ___
15. If none, what are the qualifications of this position?
16. What does a Teacher actually earn per hour $ ____________. 17. Based on the actual qualifications, according to the salary scale, what should a Teacher earn per hour?
$ ____________.
18. Are basic health benefits paid or partially paid for this position in your organization? Yes ___ No ___

27
Section IV. Questions about Assistant Teacher. Defined as the assistant or aide in a classroom, or with a group under the supervision of a Teacher (Note: if there are five or more Assistant Teachers in your organization, please provide information for two Assistant Teachers in your organization). 19. Does an Assistant Teacher in your organization meet the qualifications specified in the following columns?
If yes, please specify which column. If no, skip to question 20.
Column C Yes ___ No ___ Column D Yes ___ No ___ Column E Yes ___ No ___ Column F Yes ___ No ___
20. If columns C, D, E and F do not describe the actual qualifications of an Assistant Teacher, please specify which
column best describes the actual qualification (Check as many as apply):
Column: B ___ None ___
21. If none, what are the qualifications of this position?
22. What does an Assistant Teacher actually earn per hour $ ____________ 23. Based on the actual qualifications, according to the salary scale, what should an Assistant Teacher earn per hour?
$ ____________.
24. Are basic health benefits paid or partially offered for this position in your organization? Yes ___ No ___

28
Section V. Questions Regarding Implementing the Scale 25. How many full-time or part-time staff members work in your organization? Please list the number of staff members in
your organization by position/title.
Site Supervisor/Assistant Director _________ Head/Lead Teacher _________ Teacher _________ Assistant Teacher _________
26. For the positions noted in the scale, do you think the salaries are appropriately matched to the stated educational
requirements?
Yes ___ No ___
If no, why not?
27. For the positions noted in the scale, do you think the salaries are appropriately matched to the stated experience
requirements?
Yes ___ No ___
If no, why not?

29
28. For the positions noted in the scale, do you think the salaries are appropriately matched to the level of responsibility implied by the position/title?
Yes ___ No ___
If no, why not?
29. Were you able to find the salaries for the various positions in your organization in the salary scale?
Supervisor/Assistant Director Yes ___ No ___ Head/Lead Teacher Yes ___ No ___ Teacher Yes ___ No ___ Assistant Teacher Yes ___ No ___
30. Would you consider implementing this scale in your organization?
Yes ___ (go to question 32) No ___ (go to question 31)
31. Please provide reasons why would you not consider implementing the scale?
32. In your opinion how helpful is the proposed salary scale in achieving your goal of improving the compensation of
employees?
___ Very helpful ___ Somewhat helpful ___ Helpful ___ Not helpful at all
33. Would implementing this scale impact providing health benefits to your employees?
Yes ___ (go to question 34) No ___ (go to question 35)

30
34. If implementing the scale would impact providing health benefits, would you consider offering a choice to your employees between a higher salary in place of benefits?
Yes ___ No ___
35. What are the most significant barriers to implementing the scale in your organization?
36. If cost is the greatest barrier to implementing the scale, what do you see as a possible resolution?
37. If you are not able to readily use the proposed salary scale, what changes would you advise? _____________________________________________________________________________________________ _____________________________________________________________________________________________

31
REFERENCES
Anthony, Mary Ann. Designing a Job Classification and Wage Scale System. Child Care Information Exchange. Redmond, WA.
Arnett, J. 1(989). Caregivers in day-care centers: Does training matter? Journal of Applied Developmental Psychology, 10 (4), 541-552. Brown, J. (2000). The Link Between Early Childhood Education and Crime and Violence Reduction, Policy Associate, Early Learning and Care. Economic Opportunity Institute, Seattle, Washington. Bellm, D., Whitebook, M, Burton A. (2002). Inside the Pre-K Classroom: A Study in Staffing and Stability in State Funded Pre-Kindergarten Programs. Center for the Child Care Workforce, Childcare Resource and Research Unit, University of Toronto, Canada. Center for the Child Care Workforce. (2002). A Profile of the Child Care Center Workforce in Los Angeles County: Findings from the 2002 Survey of Child Care Staff Salaries, Benefits, and Working Conditions. Prepared for the County of Los Angeles Child Care Planning Committee, December 2002, pp2-13. Cost, Quality and Child Outcomes Study Team (1995). Cost, quality, and child outcomes in child care centers. Public report. Second Edition. Denver, CO: Department of Economics, University of Colorado. Loeb, S. Fuller, B Kagan, S Carrol, B Carroll, J McCarthy, J. (2004). Child Care in Poor Communities: Early Learning Effects of Type, Quality, and Stability The Society for Research in Child Development. National Bureau of Economic Research, Cambridge, MA. Maria D. Montilla, Eric C. Twombly, Carol J. De Vita, June 01, 2001. Models for Increasing Child Care Worker Compensation. http://www.urban.org/url.cfm?ID=310101 Montgomery, D. L., Whitebook, M., Burton, A., Hikido, C., Vergun, R., and Chambers, J. (1996). California child care and development compensation study: Towards promising policy and practice. (Final Report). Palo Alto, CA: American Institute for Research. Moreno, Manuel H., Halil Toros, Max Stevens. Living Wage Estimation for the County of Los Angeles, 2004. Los Angeles: Chief Administrative Office, Service Integration Branch, Research and Evaluation Services, 2004, County of Los Angeles.

32
Petrillose, M. (1998). Improving Bottom-line Results by Managing Turnover and Absenteeism. University of Nevada, Las Vegas, Nevada. Public Safety Can’t Wait: California’s Preschool Shortage, A Missed Opportunity for Crime Prevention. (2005). Fight Crime: Invest In Kids, Washington, DC. The 2003 California Child Care Portfolio, Los Angeles County, California Child Care Resource & Referral Network. Available at: http://www.rrnetwork.org/rrnet/our_research/2003portfolio.php The State of California document listing the requirements for teachers may be viewed at: http://www.ctc.ca.gov/credentials/CREDS/child-dev-permits.html
Vandell, D.L. and Wolfe, B. (2000). Child Care Quality: Does It Matter and Does It Need to be Improved? Office of the Assistant Secretary for Planning and Evaluation U.S. Department of Health and Human Services, Washington, D.C. Whitebook, M. and Bellm D. (1999). Taking on turnover: An action guide for child care center teachers and directors. Center for Child Care Workforce. Washington DC. Whitebook,M. and Sakai, L. (2003). Turnover begets turnover: an examination of job and occupational instability among child care center staff. Center for the Study of Child Care Employment, Institute of Industrial Relations, University of Berkley. Model Comp Salary Scale Brief Revised – June 2005 - Final