model land use plan - planning department(uttar …planning.up.nic.in/landuseboard/allahabad.pdf6...
TRANSCRIPT
6
District Model Land Use Plan District – Allahabad Uttar Pradesh
Final Report
By
Bimal Kumar
Sponsored By State Land Use Board, Uttar Pradesh
Department of Planning, Government of U. P. Yojana Bhawan, Lucknow – 226 001
G. B. Pant Social Science Institute Jhusi, Allahabad – 211 019
Phone: (0532) 667214, 667206, Fax: (0532) 667206, E-mail: [email protected]
7
Study Team Project Director Sri Bimal Kumar Research Assistants Mohd. Israil Sri Gyan Nath Jha Research Investigators Sri Atul Mishra Sri Sandeep Srivastava Sri Ashok Kumar Dwivedi Computer Assistant Sri Sandip Kumar Jaiswal
8
Contents
Study Team i
Contents ii-iv List of Tables v-xi Preface xii Location Map xiii Chapter - 1
Introduction 1-6
1.1 Relevance of Study 4-5 1.2 Objectives 5-6 1.3 Methodology 6 1.4 Data Source 6
SECTION – I
Chapter - 2
Population and Land Resources 6-16
2.1 Demographic Profile 6-7 2.1.1 Settlement 6 2.1.2 Urbanisation 7 2.2 Population 7-8 2.3 Occupational Structure 8-12 2.3.1 Block-wise Analysis of Occupational Structure 11-12 2.4 Distribution of Landholdings 12-16 Chapter - 3
PART-A: Land Use Related to Agriculture 17-38
3.1 Net Sown Area 17 3.2 Cropping Intensity 17-18 3.3 Irrigation 18 3.4 Gross Irrigated Area as Percentage of Net Irrigated Area 22-25 3.5 Source of Irrigation 26-31 3.6 Cropping Pattern 31-34 3.7 Fertilizer Use 34-36 3.8 Extent of Mechanisation 37-38 3.9 Livestock PART-B: Land Use Plan Related to Agricultural Land 38-43 3.10 Agricultural Production System and Framework for Land Use Plan 41 3.11 Factors Inhibiting Growth 41 3.12 Framework of Agricultural Work 41-43 3.13 Collective Farming Society 43 3.14 Confederation of Collective Farming Societies 43 Chapter - 4 Land Use Plan (Other than Agricultural Land) 44-95
9
PART–A
4.1 District Level Analysis of Land Use Pattern and Land Use Plan 45-50 4.1.1 Forest 45 4.1.2 Land Put to Non-agricultural Uses 46-48 4.1.3 Barren and Unculturable Land 48 4.1.4 Culturable Waste 48 4.1.5 Land under Miscellaneous Trees, Crops, and Groves not
included in Net Sown Area 48-50
4.2 Some General Suggestions 51-56 4.2.1 District Level 51 4.2.2 Block Level 51-55 4.2.3 Village Level 55-56
PART–B 4.3 Block-wise Analysis of Land Use Pattern and Land Use Plan 57-95 4.3.1 Block – Kaurihar 57-58 4.3.2 Block – Holagarh 59-60 4.3.3 Block – Mau-Aima 61-62 4.3.4 Block – Soraon 63-64 4.3.5 Block – Baharia 65-66 4.3.6 Block – Phulpur 67-68 4.3.7 Block – Bahadurpur 69-70 4.3.8 Block – Pratappur 71-72 4.3.9 Block – Saidabad 73-74 4.3.10 Block – Dhanupur 75-76 4.3.11 Block – Handia 77-78 4.3.12 Block – Jasra 79-80 4.3.13 Block – Shankargarh 81-82 4.3.14 Block – Chaka 83-84 4.3.15 Block – Karchhana 85-86 4.3.16 Block – Kaundhiyara 87-88 4.3.17 Block – Uroowa 89-90 4.3.18 Block – Meja 91-92 4.3.19 Block – Koraon 93 4.3.20 Block – Manda 94-95
SECTION – II Chapter - 5 Village Level Plan (Based on Village Level Survey) 96-197 5.1 Village Study – I (Village-Golhaiya, Block-Shankargarh) 97-115 (A) Village Profile 97-101 5.1.1 Land Use Pattern 97 5.1.2 Demographic Profile 97-99 5.1.3 Land Ownership 99 5.1.4 Occupational Structure 100 5.1.5 Livestock 101 5.1.6 Housing Condition 101
(B) Responses of Selected Households in Village Golhaiya 102-112
5.1.7 Change in Size of Land Holding 102-103 5.1.8 Conversion of Agricultural Land for Non-agricultural Purposes 104 5.1.9 Land Reclamation 105 5.1.10 Water Harvesting 106-107
10
5.1.11 Orchards 108-109 5.1.12 Livestock 110 5.1.13 Agriculture 111-112
(C) Land Use Plan for Golhaiya Village 113-115
5.2 Village Study – II (Village-Harro, Block-Shankargarh) 116-133 (A) Village Profile 116-120 5.2.1 Land Use Pattern 116 5.2.2 Demographic Profile 116-117 5.2.3 Land Ownership 118 5.2.4 Occupational Structure 118-119 5.2.5 Livestock 119-120 5.2.6 Housing Condition 120
(B) Responses of Selected Households in Village Harro 121-131
5.2.7 Change in Size of Land Holding 121-122 5.2.8 Conversion of Agricultural Land for Non-agricultural Purposes 123 5.2.9 Land Reclamation 124 5.2.10 Water Harvesting 125-126 5.2.11 Orchards 127-128 5.2.12 Livestock 129 5.2.13 Agriculture 130-131
(C) Land Use Plan for Harro Village 132-133
5.3 Village Study – III (Village - Fazilapur, Block – Phulpur) 134-150 (A) Village Profile 134-138 5.3.1 Land Use Pattern 134-135 5.3.2 Demographic Profile 135-136 5.3.3 Land Ownership 136-137 5.3.4 Occupational Structure 137-138 5.3.5 Livestock 138 5.3.6 Housing Condition 138
(B) Responses of Selected Households in Village Fazilapur 139-149
5.3.7 Change in Size of Land Holding 139-140 5.3.8 Conversion of Agricultural Land for Non-agricultural Purposes 141 5.3.9 Land Reclamation 142 5.3.10 Water Harvesting 143-144 5.3.11 Orchards 145-146 5.3.12 Livestock 147 5.3.13 Agriculture 148-149
(C) Land Use Plan for Fazilapur Village 150
5.4 Village Study – IV (Village – Rajepur, Block – Phulpur) 151-167 (A) Village Profile 151-155 5.4.1 Land Use Pattern 151 5.4.2 Demographic Profile 152 5.4.3 Land Ownership 153 5.4.4 Occupational Structure 154 5.4.5 Livestock 155 5.4.6 Housing Condition 155
11
(B) Responses of Selected Households in Village Rajepur
156-166
5.4.7 Change in Size of Land Holding 156-157 5.4.8 Conversion of Agricultural Land for Non-agricultural Purposes 158 5.4.9 Land Reclamation 159 5.4.10 Water Harvesting 160-161 5.4.11 Orchards 162-163 5.4.12 Livestock 164 5.4.13 Agriculture 165-166
(C) Land Use Plan for Rajepur Village 167
Chapter - 6 Conclusion and Recommendations
168-207
6.1 Land Use Plan Related to Agricultural Land 168-173 6.2 District Level Analysis of Land Use Pattern and Land Use Plan (Other
than Agricultural Land) 173-177
6.3 Some General Suggestions 177-183 6.3.1 District Level 177-178 6.3.2 Block Level 178-181 6.3.3 Village Level 182-183 6.4 Block Level Plan for Year 2010 184-202 6.5 Village Level Plan for Selected Villages 203-207 6.5.1 Land Use Plan for Golhaiya Village 203-205 6.5.2 Land Use Plan for Harro Village 205 6.5.3 Land Use Plan for Fazilapur Village 205-206 6.5.4 Land Use Plan for Rajepur Village 206-207 Appendix-1 List of Harbal Plants 208-216Appendix-2 xzg u{k= okfVdkvksa dk jksi.k 217-218
12
List of Tables
Tables Title Page. No.
2.1.1 Settlement Profile of the District Allahabad 62.2.1 Population of District Allahabad 72.2.2 Growth Rate of Population in District Allahabad 82.2.3 Demographic Profile of the District Allahabad 82.3 Classification of Workers in the District Allahabad (In percent) 102.3.1 Block-wise Distribution of Workers by Economic Category in Allahabad
District, (in percent) 11-12
2.4.1 Block-wise Distribution of Landholding (Size & Area) in Allahabad District (In percent)
13-14
2.4.2 Block-wise Distribution of Landholding (Size & Area) in Allahabad District (In percent)
15-16
3.1 Year-wise Irrigation and Cropping Intensity of Allahabad District 193.1.1 Block-wise Cropping Intensity in Allahabad District 193.1.2 Block-wise Net Sown Area as % of Total Reporting Area 203.1.3 Block-wise Irrigation Intensity in Allahabad District 203.1.4 Block-wise Gross Irrigated Area as % of Net Irrigated Area 213.2 Year-wise Irrigated Area by Different Sources in Allahabad District, (in
Percent) 23
3.2.1 Block-wise Irrigated Area by Different Sources in Allahabad District (in Percent)
24-25
3.3(a) Area Under Major Crops and Productivity (as percentage of net sown area) (Qt./Hectare) in Allahabad District
27
3.3(b) Percent of Cropped Area in Net Sown Area, Allahabad District 273.3.1 Block-wise Cropping Pattern in Allahabad District, (in Percent) 28-313.4.1 Use of Fertiliser in Allahabad District (in MT) 323.4.2 Block-wise Use of Fertiliser in Allahabad District (in MT) 32-343.5.1 Technology Available in Allahabad District 353.5.2 Block-wise Technology Available in Allahabad District 35-363.6.1 Details of Livestock in Allahabad District 373.6.2 Block-wise Details of Livestock in Allahabad District 384.1 Total Reporting Area (TRA) and Land Use Pattern in Allahabad District, (in
percent) 50
4.3.1 Total Reporting Area (TRA) and Land Use Pattern in Kaurihar Block, (in percent)
57
4.3.2 Total Reporting Area (TRA) and Land Use Pattern in Holagarh Block, (in percent)
59
4.3.3 Total Reporting Area (TRA) and Land Use Pattern in Mau-Aima Block, (in percent)
61
4.3.4 Total Reporting Area (TRA) and Land Use Pattern in Soraon Block, (in percent)
63
4.3.5 Total Reporting Area (TRA) and Land Use Pattern in Baharia Block, (in percent)
65
4.3.6 Total Reporting Area (TRA) and Land Use Pattern in Phulpur Block, (in percent)
67
4.3.7 Total Reporting Area (TRA) and Land Use Pattern in Bahadurpur Block, (in percent)
69
4.3.8 Total Reporting Area (TRA) and Land Use Pattern in Pratappur Block, (in 71
13
percent) 4.3.9 Total Reporting Area (TRA) and Land Use Pattern in Saidabad Block, (in
percent) 73
4.3.10 Total Reporting Area (TRA) and Land Use Pattern in Dhanupur Block, (in
percent) 75
4.3.11 Total Reporting Area (TRA) and Land Use Pattern in Handia Block, (in percent)
77
4.3.12 Total Reporting Area (TRA) and Land Use Pattern in Jasra Block, (in percent)
79
4.3.13 Total Reporting Area (TRA) and Land Use Pattern in Shankargarh Block, (in percent)
81
4.3.14 Total Reporting Area (TRA) and Land Use Pattern in Chaka Block, (in percent)
83
4.3.15 Total Reporting Area (TRA) and Land Use Pattern in Karchhana Block, (in percent)
85
4.3.16 Total Reporting Area (TRA) and Land Use Pattern in Kaundhiyara Block, (in percent)
87
4.3.17 Total Reporting Area (TRA) and Land Use Pattern in Uroowa Block, (in percent)
89
4.3.18 Total Reporting Area (TRA) and Land Use Pattern in Meja Block, (in percent) 914.3.19 Total Reporting Area (TRA) and Land Use Pattern in Koraon Block, (in
percent) 93
4.3.20 Total Reporting Area (TRA) and Land Use Pattern in Manda Block, (in percent)
94
5.1.1 Land Use Pattern in the Gollahaiya Village of the Allahabad District 985.1.2.1 Caste and Gender-wise Distribution of Population in the Village Gollahaiya 985.1.2.2 Caste and Gender-wise Distribution of Education in the Village Gollahaiya 995.1.3.1 Distribution of Per Family/Per Adult Size of Landholdings in Different Size
Groups in the Village Gollahaiya 99
5.1.3.2 Caste-wise Distribution of Landholdings in Different Size Groups in the Village Gollahaiya
99
5.1.4.1 Present and Past Occupations of Households in the Village Gollahaiya 1005.1.4.2 Caste and Gender-wise Distribution of Occupation of Workers in the Village
Gollahaiya 100
5.1.5 Distribution of Animal in Different Categories of Landholding Size Groups Households in the Village Gollahaiya
101
5.1.6 Caste-wise Distribution of Housing Condition in the Village Gollahaiya 1015.1.7.1 Caste and Landholding wise Distribution of Selected Households in Villages
Gollahaiya 102
5.1.7.2 Reason of Changes in Total Land Owned During the Last 20 years in Selected Households
102
5.1.7.3 Number of Households Whose Landholding Increased 1035.1.7.4 Number of Households Whose Landholding Decrease 1035.1.7.5 Number of Households Whose Land was Acquired 1045.1.8.1 Reason of Conversion of Agricultural land for Non-agricultural Uses of
Owned Land by Selected Households 104
5.1.8.2 Reasons of Conversion of Agricultural Land for Non-agricultural Purposes in the Village (As Suggested by Respondents)
104
5.1.8.3 Distribution of Respondents on the Basis of Responses to Query "Reasons for not cultivating the agriculture land"
104
5.1.9.1 Distribution of Responses to the query "Barren land could be put to which uses"
105
5.1.9.2 Distribution of Responses to the question "Are you aware of the Government Programmes to recalm Usar Land"
105
5.1.9.3 Distribution of Responses to Query "Which Department Undertook the work of Reclamation of Usar Land"
105
5.1.9.4 Distribution of Responses to the Query "In what way you benefited from the schemes"
105
14
5.1.9.5 Distribution of Responses to the Query "Reasons for Not-availing the Facilities of Schemes for Land Reclamation"
105
5.1.10.1 Distribution of Responses to the Query "What measures could be adopted to avoid water logging due to rain water"
106
5.1.10.2 Distribution of Responses to the Query "What could be done to Conserve
rain water in the village" 106
5.1.10.3 Distribution of Responses to Query "If more water could be conserved in the village then, it could be put to what uses?
106
5.1.10.4 Distribution of Responses to the Query "What is the present use of land of those ponds, which have totally or partially disappeared"
107
5.1.10.5 Distribution of Responses to the Query "What efforts could be made for renovation of ponds"
107
5.1.10.6 Distribution of Responses to query "In what way the renovation of Ponds will help villagers"
107
5.1.10.7 Distribution of Responses to query "What is the Present Use of Existing Ponds"
107
5.1.11.1 Distribution of Responses to query "Whether the area under orchards has increased/decreased"
108
5.1.11.2 Distribution of Perception of Respondent about Reason of Decrease of Orchard
108
5.1.11.3 Perception of Respondent about Reason of Increase of Orchard 1085.1.11.4 Distribution of Responses to query "Why the potential of growth of orchards
is low" 108
5.1.11.5 Distribution of Responses to query "On which type of land area under orchards could be increased
109
5.1.11.6 Distribution of Responses to query "What kind of facilities would be required to increase area under orchard"
109
5.1.12.1 Distribution of Responses to query "Reasons for decrease in livestock" 1105.1.12.2 Distribution of Responses to query "Reasons for increase in livestock" 1105.1.12.3 Distribution of Responses to query "Number of which type of livestock has
decreased" 110
5.1.12.4 Distribution of Responses to query "What type of livestock will improve your economic condition"
110
5.1.12.5 Distribution of Responses to query "What are the main constraints in increasing livestock"
110
5.1.13.1 Cropping Pattern of Selected Household, Average Production and Use of Fertilizer
111
5.1.13.2 Distribution of Responses to query "Reason for lower productivity of respondents farm from other farms"
111
5.1.13.3 Distribution of Responses to query "What are the main constraints in better utilisation of agricultural land"
111
5.1.13.4 Distribution of Responses to query "How above mentioned constraints could be removed"
112
5.1.13.5 Distribution of Responses to query "Reasons for leasing out the land" 1125.1.13.6 Distribution of Responses to query "Reasons for leasing in by tenants" 1125.2.1 Land Use Pattern in the Harro Village of the Allahabad District 1165.2.2.1 Caste and Gender-wise Distribution of Population in the Village Harro 1175.2.2.2 Caste and Gender-wise Distribution of Education in the Village Harro 1175.2.3.1 Landholding Size : Per Family/Per Adult in the Village Harro 1185.2.3.2 Caste-wise Distribution of Landholdings Size in the Village Harro 1185.2.4.1 Present and Past Occupation of Households in the Village Harro 1195.2.4.2 Caste and Gender-wise Distribution of Occupation of Workers in the Village
Harro 119
5.2.5 Distribution of Animal in Different Categories of Landholding Households in the Village Harro
120
5.2.6 Caste-wise Distribution of Housing Condition in the Village Harro 1205.2.7.1 Caste and Landholding wise Distribution of Selected Households in Villages
Harro 121
5.2.7.2 Reason of Changes in Total Land Owned During the Last 20 years in 121
15
Selected Households 5.2.7.3 Number of Households Whose Landholding Increased 1225.2.7.4 Number of Households Whose Landholding Decrease 122 5.2.7.5 Number of Households Whose Land was Acquired 1235.2.8.1 Reason of Conversion of Agricultural land for Non-agricultural Uses of
Owned Land by Selected Households 123
5.2.8.2 Other Reasons of Conversion of Agricultural Land for Non-agricultural Purpose in the Village (As Suggested by Respondents)
123
5.2.8.3 Distribution of Respondents on the Basis of Responses to Query "Reasons for not cultivating the agriculture land"
123
5.2.9.1 Distribution of Responses to the query "Barren land could be put to which uses"
124
5.2.9.2 Distribution of Responses to the question "Are you aware of the Government Programmes to recalm Usar Land"
124
5.2.9.3 Distribution of Responses to Query "Which Department Undertook the work of Reclamation of Usar Land"
124
5.2.9.4 Distribution of Responses to the Query "Reasons for Not-availing the Facilities of Schemes for Land Reclamation"
124
5.2.10.1 Distribution of Responses to the Query "What measures could be adopted to avoid water logging due to rain water"
125
5.2.10.2 Distribution of Responses to the Query "What could be done to Conserve rain water in the village"
125
5.2.10.3 Distribution of Responses to Query "If more water could be conserved in the village then, it could be put to what uses?
125
5.2.10.4 Distribution of Responses to the Query "What is the present use of land of those ponds, which have totally or partially disappeared"
126
5.2.10.5 Distribution of Responses to the Query "What efforts could be made for renovation of ponds"
126
5.2.10.6 Distribution of Responses to query "In what way the renovation of Ponds will help villagers"
126
5.2.10.7 Distribution of Responses to query "What is the Present Use of Existing Ponds"
126
5.2.11.1 Distribution of Responses to query "Whether the area under orchards has increased/decreased"
127
5.2.11.2 Distribution of Perception of Respondent about Reason of Decrease of Orchard
127
5.2.11.3 Perception of Respondent about Reason of Increase of Orchard 1275.2.11.4 Distribution of Responses to query "Why the potential of growth of orchards
is low" 128
5.2.11.5 Distribution of Responses to query "On which type of land area under orchards could be increased
128
5.2.11.6 Distribution of Responses to query "What kind of facilities would be required to increase area under orchard"
128
5.2.12.1 Distribution of Responses to query "Reasons for decrease in livestock" 1295.2.12.2 Distribution of Responses to query "Reasons for increase in livestock" 1295.2.12.3 Distribution of Responses to query "Number of which type of livestock has
decreased" 129
5.2.12.4 Distribution of Responses to query "What type of livestock will improve your economic condition"
129
5.2.12.5 Distribution of Responses to query "What are the main constraints in increasing livestock"
129
5.2.13.1 Cropping Pattern of Selected Household, Average Production and Use of Fertilizer
130
5.2.13.2 Distribution of Responses to query "Reason for lower productivity of respondents farm from other farms"
130
5.2.13.3 Distribution of Responses to query "What are the main constraints in better utilisation of agricultural land"
130
5.2.13.4 Distribution of Responses to query "How above mentioned constraints could 131
16
be removed" 5.2.13.5 Distribution of Responses to query "Reasons for leasing in by tenants" 1315.3.1 Land Use Pattern in the Fazilapur Village of the Allahabad District 135 5.3.2.1 Caste and Gender-wise Distribution of Population in the Village Fazilapur 1355.3.2.2 Caste and Gender-wise Distribution of Education in the Village Fazilapur 1365.3.3.1 Distribution of Per Family/Per Adult Size of Landholdings in Different Size
Groups in the Village Fazilapur 136
5.3.3.2 Caste-wise Distribution of Landholdings in Different Size Groups in the Village Fazilapur
137
5.3.4.1 Present and Past Occupations of Households in the Village Fazilapur 1375.3.4.2 Caste and Gender-wise Distribution of Occupation of Workers in the Village
Fazilapur 138
5.3.5 Distribution of Animal in Different Categories of Landholding Size Groups Households in the Village Fazilapur
138
5.3.6 Caste-wise Distribution of Housing Condition in the Village Fazilapur 1385.3.7.1 Caste and Landholding wise Distribution of Selected Households in Villages
Fazilapur 139
5.3.7.2 Reason of Changes in Total Land Owned During the Last 20 years in Selected Households
139
5.3.7.3 Number of Households Whose Landholding Increased 1405.3.7.4 Number of Households Whose Landholding Decrease 1405.3.8.1 Reason of Conversion of Agricultural land for Non-agricultural Uses of
Owned Land by Selected Households 141
5.3.8.2 Reasons of Conversion of Agricultural Land for Non-agricultural Purposes in the Village (As Suggested by Respondents)
141
5.3.8.3 Distribution of Respondents on the Basis of Responses to Query "Reasons for not cultivating the agriculture land"
141
5.3.9.1 Distribution of Responses to the query "Barren land could be put to which uses"
142
5.3.9.2 Distribution of Responses to the question "Are you aware of the Government Programmes to recalm Usar Land"
142
5.3.9.3 Distribution of Responses to Query "Which Department Undertook the work of Reclamation of Usar Land"
142
5.3.9.4 Distribution of Responses to the Query "In what way you benefited from the schemes"
142
5.3.9.5 Distribution of Responses to the Query "Reasons for Not-availing the Facilities of Schemes for Land Reclamation"
142
5.3.10.1 Distribution of Responses to the Query "What measures could be adopted to avoid water logging due to rain water"
143
5.3.10.2 Distribution of Responses to the Query "What could be done to Conserve rain water in the village"
143
5.3.10.3 Distribution of Responses to Query "If more water could be conserved in the village then, it could be put to what uses?
143
5.3.10.4 Distribution of Responses to the Query "What is the present use of land of those ponds, which have totally or partially disappeared"
144
5.3.10.5 Distribution of Responses to the Query "What efforts could be made for renovation of ponds"
144
5.3.10.6 Distribution of Responses to query "In what way the renovation of Ponds will help villagers"
144
5.3.10.7 Distribution of Responses to query "What is the Present Use of Existing Ponds"
144
5.3.11.1 Distribution of Responses to query "Whether the area under orchards has increased/decreased"
145
5.3.11.2 Distribution of Perception of Respondent about Reason of Decrease of Orchard
145
5.3.11.3 Distribution of Responses to query "Why the potential of growth of orchards is low"
146
5.3.11.4 Distribution of Responses to query "On which type of land area under 146
17
orchards could be increased 5.3.11.5 Distribution of Responses to query "What kind of facilities would be required
to increase area under orchard" 146
5.3.12.1 Distribution of Responses to query "Reasons for decrease in livestock" 1475.3.12.2 Distribution of Responses to query "Reasons for increase in livestock" 1475.3.12.3 Distribution of Responses to query "Number of which type of livestock has
decreased" 147
5.3.12.4 Distribution of Responses to query "What type of livestock will improve your economic condition"
147
5.3.12.5 Distribution of Responses to query "What are the main constraints in increasing livestock"
147
5.3.13.1 Cropping Pattern of Selected Household, Average Production and Use of Fertilizer
148
5.3.13.2 Distribution of Responses to query "Reason for lower productivity of respondents farm from other farms"
148
5.3.13.3 Distribution of Responses to query "What are the main constraints in better utilisation of agricultural land"
148
5.3.13.4 Distribution of Responses to query "How above mentioned constraints could be removed"
149
5.3.13.5 Distribution of Responses to query "Reasons for leasing out the land" 1495.3.13.6 Distribution of Responses to query "Reasons for leasing in by tenants" 1495.4.1 Land Use Pattern in the Rajepur Village of the Allahabad District 1515.4.2.1 Caste and Gender-wise Distribution of Population in the Village Rajepur 1525.4.2.2 Caste and Gender-wise Distribution of Education in the Village Rajepur 1525.4.3.1 Distribution of Per Family/Per Adult Size of Landholdings in Different Size
Groups in the Village Rajepur 153
5.4.3.2 Caste-wise Distribution of Landholdings in Different Size Groups in the Village Rajepur
153
5.4.4.1 Present and Past Occupations of Households in the Village Rajepur 1545.4.4.2 Caste and Gender-wise Distribution of Occupation of Workers in the Village
Rajepur 154
5.4.5 Distribution of Animal in Different Categories of Landholding Size Groups Households in the Village Rajepur
155
5.4.6 Caste-wise Distribution of Housing Condition in the Village Rajepur 1555.4.7.1 Caste and Landholding wise Distribution of Selected Households in Villages
Rajepur 156
5.4.7.2 Reason of Changes in Total Land Owned During the Last 20 years in Selected Households
156
5.4.7.3 Number of Households Whose Landholding Increased 1575.4.7.4 Number of Households Whose Landholding Decrease 1575.4.8.1 Reason of Conversion of Agricultural land for Non-agricultural Uses of
Owned Land by Selected Households 158
5.4.8.2 Reasons of Conversion of Agricultural Land for Non-agricultural Purposes in the Village (As Suggested by Respondents)
158
5.4.8.3 Distribution of Respondents on the Basis of Responses to Query "Reasons for not cultivating the agriculture land"
158
5.4.9.1 Distribution of Responses to the query "Barren land could be put to which uses"
159
5.4.9.2 Distribution of Responses to the question "Are you aware of the Government Programmes to recalm Usar Land"
159
5.4.9.3 Distribution of Responses to Query "Which Department Undertook the work of Reclamation of Usar Land"
159
5.4.9.4 Distribution of Responses to the Query "In what way you benefited from the schemes"
159
5.4.9.5 Distribution of Responses to the Query "Reasons for Not-availing the Facilities of Schemes for Land Reclamation"
159
5.4.10.1 Distribution of Responses to the Query "What measures could be adopted to avoid water logging due to rain water"
160
18
5.4.10.2 Distribution of Responses to the Query "What could be done to Conserve rain water in the village"
160
5.4.10.3 Distribution of Responses to Query "If more water could be conserved in the
village then, it could be put to what uses? 160
5.4.10.4 Distribution of Responses to the Query "What is the present use of land of those ponds, which have totally or partially disappeared"
161
5.4.10.5 Distribution of Responses to the Query "What efforts could be made for renovation of ponds"
161
5.4.10.6 Distribution of Responses to query "In what way the renovation of Ponds will help villagers"
161
5.4.10.7 Distribution of Responses to query "What is the Present Use of Existing Ponds"
161
5.4.11.1 Distribution of Responses to query "Whether the area under orchards has increased/decreased"
162
5.4.11.2 Distribution of Perception of Respondent about Reason of Decrease of Orchard
162
5.4.11.3 Distribution of Responses to query "Why the potential of growth of orchards is low"
163
5.4.11.4 Distribution of Responses to query "On which type of land area under orchards could be increased
163
5.4.11.5 Distribution of Responses to query "What kind of facilities would be required to increase area under orchard"
163
5.4.12.1 Distribution of Responses to query "Reasons for decrease in livestock" 1645.4.12.2 Distribution of Responses to query "Reasons for increase in livestock" 1645.4.12.3 Distribution of Responses to query "Number of which type of livestock has
decreased" 164
5.4.12.4 Distribution of Responses to query "What type of livestock will improve your economic condition"
164
5.4.12.5 Distribution of Responses to query "What are the main constraints in increasing livestock"
164
5.4.13.1 Cropping Pattern of Selected Household, Average Production and Use of Fertilizer
165
5.4.13.2 Distribution of Responses to query "Reason for lower productivity of respondents farm from other farms"
165
5.4.13.3 Distribution of Responses to query "What are the main constraints in better utilisation of agricultural land"
165
5.4.13.4 Distribution of Responses to query "How above mentioned constraints could be removed"
166
5.4.13.5 Distribution of Responses to query "Reasons for leasing out the land" 1665.4.13.6 Distribution of Responses to query "Reasons for leasing in by tenants" 166
19
Preface
Preparation of a separate land use plan for a district has its own
importance because of growing population and limited land resource. The
carrying capacity of land is under stress due to environmental pollution and
land degradation.
We, therefore, focus not only on quantification of required land for
each land use category but also on quality land use.
Secondly, we have tried to emphasize that there is need for block level
and village level land use planning as well. Hence an attempt has been made
to prepare land use plans for each block of the district and four selected
villages of the district. We have also suggested for formation/revamping of
institutions for this purpose.
The plans also include policy framework, besides general suggestions
and specific tasks. These are based on informations collected from primary
and secondary sources, discussions with villagers and observations made by
members of the survey team.
We gratefully acknowledge our thanks to State Land Use Board for
sponsoring the study. We are specially obliged to Mrs. Mridula Singh,
Additional Director, State Land Use Board for constant interaction and help in
course of this study. We are also thankful to DSTO in particular and other
district level functionaries in general who supported us in collection of data
and also provided important insights to the problem of land use.
I am also indebted to Prof. R.C. Tripathi, Director, G.B. Pant Social
Science Institute, Jhusi, Allahabad, for reposing faith on me to conduct the
study and for providing facilities, without which this study would not have
completed.
I am also thankful to members of the research team viz. Mohd. Israil,
Sri. Gyan Nath Jha, Sri Ashok Dwivedi, Sri Atul Mishra, Sri Sandeep
Srivastava and Sri Sandip Kumar Jaiswal for their dedicated work in collecting
data and helping me in analysis. Special thanks are due to Sri Sandip Kumar
20
Jaiswal, who also worked as Computer Assistant, for his painstaking effort in
typing and formatting of this report despite many odds.
– Bimal Kumar
21
Chapter – 1
Introduction Location and Extent:
The district of Allahabad* is located between 24° 47’ N and 25° 47’ N latitudes and
between 81° 19’E and 82° 21’E longitudes. It covers an area of 5246 km2. This district lies in the
southern part of the state in the Gangetic plain and adjoining Vindhyan Plateau of India. Allahabad
district is surrounded by district Bhadohi and Mirzapur in the East, Kaushambi and Banda in the
west, Pratapgarh and Jaunpur in the North and Banda and Madhya Pradesh are in the south.
River Ganga and Yamuna flow through the district.
Administrative Divisions:
The district comprises of eight tahsils, namely Sadar, Soraon, Phulpur, Handia, Bara,
Karchana, Koraon and Meja.Tahsil Meja is biggest one according to the area while as per
population Tahsil Sadar is the biggest Tahsil of the district. It has 20 development Blocks, 2715
villages and 10 towns.
Geology:
Geologically the district presents a greater complexity than any other district of U.P. with
the exception of Mirzapur. The whole Trans-Ganga tract, the greater portion of Doab are
composed of gangetic alluvium. The alluvial detritus of the Vindhyans is found in the southern part
of the Doab. The Trans-Yamuna tract, the Vindhyan detritus merges in the gangetic sand and silt.
The gangetic alluvium consists of alterations of fluvial deposition of sand silt and clay. The
thickness of alluvium increases from south to north. The mineral products that are commonly
found in the district are glass sand, building stone, kankar, brickearth and reh. Glass sands
deposits are found in the neighborhood of Shankargarh (Tehsil Bara) and the requirements of
most of the glass factories in northern India are drawn from these deposits. Building stone (kaimur
sandstone) is extracted either by blasting or by splitting the chief quarries. Bricks and pottery,
earth-material are available in the alluvial tract of the district and are locally used for the
manufacture of bricks and earthenware. 'Reh' is found as a white encrustations in the 'usar' land
expacially in trans-ganga tract. Soda ash, which is extracted from it, is used in making of soap and
glass, in the dyeing industry and for the treatment of hard water.
22
Topography:
The district may be divided in the three distinct Physical parts. the trans-Ganga or the
Gangapar Plain, the doab and trans-Yamuna or the Yamunapar tract which are formed by the
Ganga and its tributary, the Yamuna, the latter joining the former at Allahabad, the confluence
being known as sangam.
Trans Ganga tract comprises poor sandy soil (full of kankar) with stretches of sodic lands
popularly known as 'USAR'. In tehsil Handia, the water table is high and the water in excess,
collecting in numerous lakes which form the most noticeable feature of the area, especially in
northern part.
The Trans Yamuna tract forms a part of Bundelkhand region.
River System:
The rivers of the district belong to the main system of Ganga and comprise several sub-
systems of which the most important are the Yamuna and the Tons, other including the minor
systems of the Varuna and the Sai.
Climate:
The climate of Allahabad district is characterised by a long and hot summer, a fairly
pleasant monsoon and cold seasons. The winter usually extends from mid-November to February
and is followed by the summer which continues till about the middle of June. The south-west
monsoon then ushers in the rainy season which lasts till the end of September. October and the
first half of November constitute the post-monsoon season.
Rainfall:
The district has 8 rain-gauge stations – Allahabad, Handia, Karchhana, Meja, Phulpur and
Soraon with records ranging from 62 to 98 years. The rainfall of Allahabad district generally
decreases from the south-east to the north-west. About 88 percent of the annual rainfall is
received during the monsoon season. July and August being the months of maximum rainfall. The
normal rainfall in the district is 975.4 mm. (38.40”) but the variation from year to year is appreciable
on an average there are about 48 rainy days in a year, the variation in different parts of the district
being negligible.
Temperature:
There is one meteorological observatory in the district, the records of which may be taken
as representative of the meteorological conditions in the district.
From about the middle of November, the temperatures begin to fall rapidly and in January
(the coldest month) the mean daily maximum is 23.7°C (74.7°F). In association with cold waves in
* The district of Allahabad was bifurcated into Allahabad and Kaushambi in 1997, Before the
bifurcation it covered an area of 7261 km2 with nine tehsils and 28 CD blocks. The Doab region covering an area of 2015 km2 with three Tehsil, and 8 CD blocks was created as Kaushambi.
23
the wake of western disturbance passing eastwards, the minimum temperature may go down to a
degree on two above the freezing point of water and slight frosts may occur. Temperatures rise
rapidly after February. The heat in the summer season-particularly in May and the early part of
June is intense. May usually being the hottest month of the year with the mean daily maximum
temperature at 41.8°C (107.2°F) and the mean daily minimum at 26.8°C (80.2°F). The hot dry and
often dusty westerly winds (locally known as loo) make the heat more intense during the daytime
specially in the trans-Yamuna tract due to the radiation from the stony outcrops.
Humidity and Cloudiness:
The climate is marked by high relative humidity i.e. 70 to 80 percent during monsoon and
progressive decrease in humidity (during the summers humidity is very low i.e. 15 to 20 percent
only).
During the monsoon season the skies are heavily clouded but during the rest of the year
they are clear or lightly clouded except for short spells of a day or two during the cold season
when in association with the passing western disturbances, they become cloudy.
Winds:
Winds are generally light throughout the year with some increase in force in the summer
(particularly in the afternoons) and during the south west monsoon season. From November to
April they blow predominantly from the west or north-west. By May easterlies and north-easterlies
also appear. In the monsoon season, the direction of the winds is either south west to west or
north-east to east. By October the north easterlies and easterlies become less frequent. The mean
wind speed for the district in Kilometres per hour is 4.2 in January, 5.0 in February, 6.0 in March,
6.6 in April, 7.6 in May, 8.7 in June, 7.7 in July, 6.9 in August, 6.0 in September, 3.7 in October,
2.7 in November, and 3.2 in December, the mean annual speed being 5.7.
Flora:
The reserved forest area under the state forest department in the district is 19839
hectares of which nearly 98 percent lie in trans Yamuna own mainly in two sub-divisions Meja
14832 and Bara 4806. Phulpur and Karchhana have no forest cover. Till the beginning of the
present century patches of 'dhak' were found in the trans-Ganga tract mostly between Phulpur
and Sarai Mamrez, along the bank of the sasur khaderi, but most of them were cleared for
agricultural purposes during the following decades. The right bank of the Ganga has patches of
babul. Forest now exist only in the trans-Yamuna tracts in Bara tahsil and the southern tracts of
tahsil Meja.
The chief varieties of trees found in these forest are Dhak (Butea monosprma), Kakor,
(Ziziphus globerrima), Aonla (Emblica ofbicinalis), Kahwa (Terminalia arjuna), Jharberi (Ziziphus
numilaria), Kanju (Holoplelea inegrifolia), Mahua (Madhuca indica), Semal (Salmalia Malabarica),
Salai (Boswellia Serrata), Khair (Acacia Catechu), Harra (Terminalia chebula), Chiraunji
(Buchanania lanzon), Bahera (Terminalia belerica) and Babul.
24
Fauna:
Forest cover plays an important role in the economy of the district. The supply of fuel,
fodder and bamboo's etc. is made from these forests.
The wild life of the district has depleted considerably owing to the destruction of forest and
reckless shooting in the past. In 1880 wolves became such a past that rewards were given for their
destruction. They are found in the trans-Yamuna tract and specially along the banks of the Ganga.
The number and species of wild animals are much greater in the trans-Yamuna tract than
elsewhere in the district. The tiger (Panthera tigris) visits the district from Mirzapur or Madhya
Pradesh. The bear (Melursus ursinus) is found in the southern part of the trans-Yamuna tract and
the leopard (Panthera Pardus) is sometimes seen in the ravined area of the Yamuna in tahsil Bara
and the southern part of the tahsil Meja. The bear and the Chinkara (Gazella bennetti) also known
as the Indian gazelle or ravine deer are found in tahsil Bara and the Sambar (Cervus unicolor)
occurs in small numbers in the southern part of tahsil Meja. The hyaena (Hyaena hyaena),
considerable herds of the Indian blank buck (Anteloppe cervicapra) and the boar (sus secrofa),
which do much damage to the crops, are also found in the last also being met with in the flood
plain of the Ganga and the doab. The milgai or blue bull (Boselaphus tragocamelus) is found in the
tahsil of trans-Yamuna tract. The fox (Kulpus bengalensis), the hare (Lepus rufica udatus), and the
sahi or Indian porcupine (Hystrix leucura) are found throughout the district.
Minerals:
Minerals wealth of the district has great significance in terms of socio-economic prosperity
and economic base. It contributes largely for developing an area by providing economic
opportunities and enriching an area with its natural endowments. The mineral products that are
commonly found in the district are glass sand, building stone, Kankar, brick earth and reh.
Glass Sand: Some of the best glass sand deposits are found in the neighbourhood of
Shankargarh and Lohgara (both in tahsil Bara) and the requirements of most of the glass factories
in northern India are drawn from these deposits.
Building Stone: The Kaimur sandstone is an excellent building stone. It lies in beds
varying between 150 m.m and 2.5 m.m thickness. These stones one found in the southern parts of
the district.
1.1 Relevance of Study
With growing population and limited land resources the relevance of land use planning is
obvious. Land has limited carrying capacity beyond which there will be degradation and loss in
productivity due to excessive use. In order to meet various demands of the growing population the
land degrading trend needs to be checked.
25
We should also attach due important to problem of rural communities, specially those
below poverty line in whose hands this resource has to be efficiently utilized and whose minimum
needs the efficient use of such resources is meant to serve.
The revenue department classifies land uses in following categories: (i) Land put to non-
agricultural uses, (ii) Barren and uncultivable land, (iii) Pastures and grazing land, (iv) Land
under trees and groves, (v) culturable waste land, (vi) current fallow, (vii) Fallow other than current
fallow, (viii) Net Sown area, (ix) Forest.
The study also focusses on waste lands. Wastelands are such degraded lands which can
be brought under vegetative cover, with reasonable effort, and which are currently under-utilized,
and lands which are deteriorating due to lack of appropriate water and soil management or on
account of natural causes.
A model land use plan for a district has been sought to be prepared on the basis of its land
capability and feasibility to change present land use pattern, development and urbanisation have
their own pressure on land use pattern. There are some major areas of concern as well. Forest
area is being reduced by pushing the frontier of agriculture. On the other side good agricultural
land is being usurped by urban sprawls, industrial establishments and expansion of human
settlements and infra-structural facilities.
We have also investigated into the reasons of land degradation and the reasons for
conversion of agricultural land to non-agricultural uses. And also how area under fallow land,
culturable waste and barren/uncultivable land could be reduced.
A new strategy is needed to protect grazing land, land under trees, bushes etc. as well as
protection of land for chak road and drainage system is also necessary. Common resource
property should be brought under communal ownership which should become non transferable
and any activity that leads to their destruction should become unlawful.
The role of common resource property and its allocation systems becomes crucial in
management of these natural resources. It must be emphasised that management of such
resources be vested with the local communities who will take a longer view. Outside commercial
interest will come and go with narrow economic interest only.
Effective communal property rights and resource management systems could be
developed by empowering panchayats to develop modes of their use in their respective
panchayats and by providing them technical and managerial skill as well as needed capital
resources.
1.2 Objectives The major objectives of preparing Model Land Use Plan for District are as follows:
(i) To review the existing land use patterns and preparation of data base.
(ii) Projection of desirable and attainable optimal land use Plan.
26
(iii) Suggestion of Action Plan including institutional changes and resource
management policies to achieve optimal land use Plan.
(iv) Identify areas under different types of wasteland and make suggestions for their
reclamation.
1.3 Methodology
The present report is based on a three tier study of the districts.
(i) District level
(ii) Block level
(iii) Village level
In order to select villages two blocks namely Shankargarh and Phulpur were selected from
the district. The two villages were selected randomly from each of the selected blocks. Thus the
villages selected are:
(i) Golhaiya (Block – Shankargarh)
(ii) Harro (Block – Shankargarh)
(iii) Fazilapur (Block – Phulpur)
(iv) Rajepur (Block – Phulpur)
1.4 Data Source
The data for preparing district and block level plans was collected from secondary
sources, while village level plans are based on primary data. Three types of schedules were
canvassed to elicit required information. These are (i) Village Schedule and (ii) Household
Schedule, and (iii) Listing Schedule.
The information for village schedule was gathered from Gram Pradhan, Ex-gram Pradhan,
Lekhpal, Village level functionary and also from well informed citizens of the village.
The household schedule was canvassed among 20 farmers of the village. The care was
taken that these farmers represent all categories and communities of the village.
The listing schedule was canvassed to collect critical information about all households of
the village such as demography, land use pattern, land ownership, occupational structure, literacy,
livestock, housing condition etc. If also found the sample frame from which sample was drawn for
detailed study of households.
Besides generating the primary data, information was also gathered from secondary
sources. These included both published data and unpublished data (generated by various line
departments). Different line departments were also approached to provide information which has a
bearing on land use pattern of the district.
27
Chapter – 2
Population and Land Resources 2.1 Demographic Profile 2.1.1 Settlement
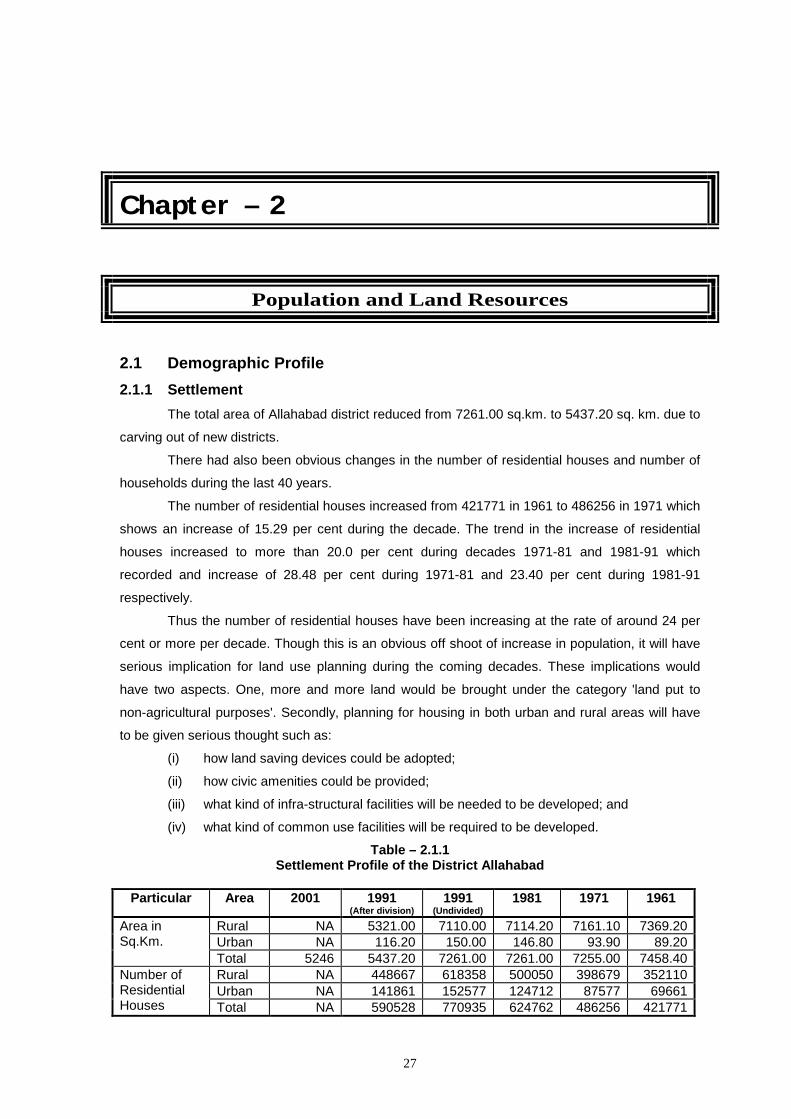
The total area of Allahabad district reduced from 7261.00 sq.km. to 5437.20 sq. km. due to
carving out of new districts.
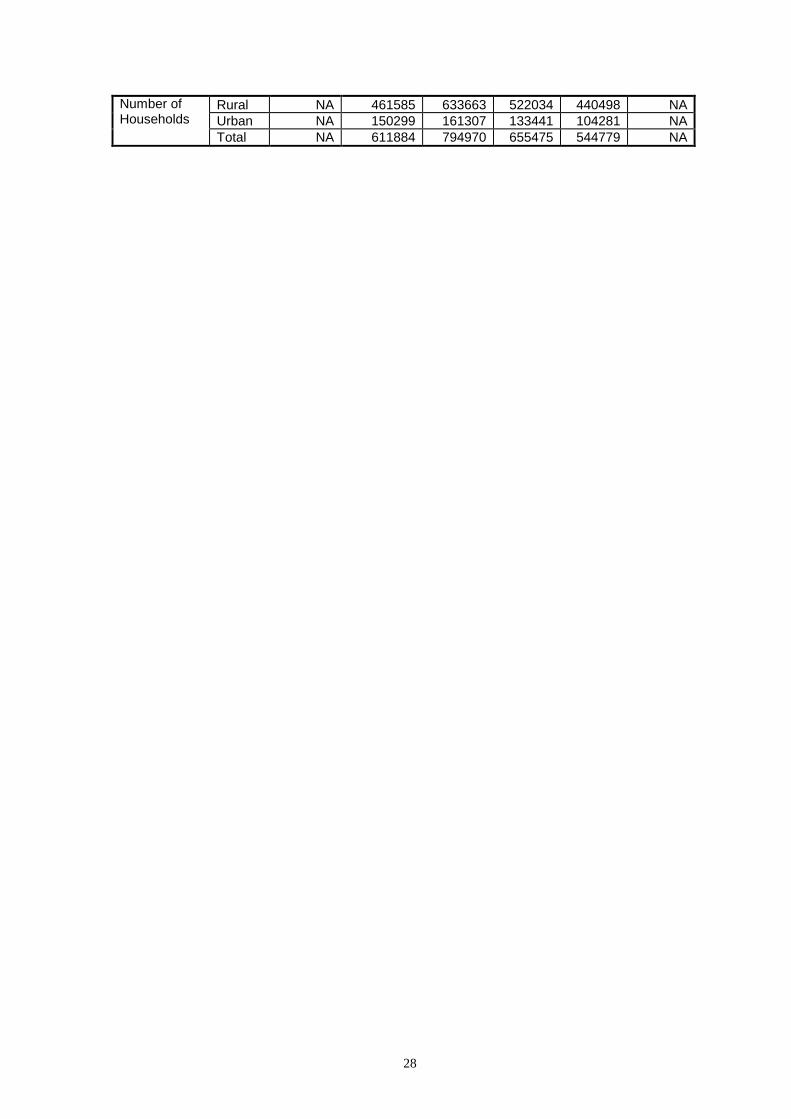
There had also been obvious changes in the number of residential houses and number of
households during the last 40 years.
The number of residential houses increased from 421771 in 1961 to 486256 in 1971 which
shows an increase of 15.29 per cent during the decade. The trend in the increase of residential
houses increased to more than 20.0 per cent during decades 1971-81 and 1981-91 which
recorded and increase of 28.48 per cent during 1971-81 and 23.40 per cent during 1981-91
respectively.
Thus the number of residential houses have been increasing at the rate of around 24 per
cent or more per decade. Though this is an obvious off shoot of increase in population, it will have
serious implication for land use planning during the coming decades. These implications would
have two aspects. One, more and more land would be brought under the category 'land put to
non-agricultural purposes'. Secondly, planning for housing in both urban and rural areas will have
to be given serious thought such as:
(i) how land saving devices could be adopted;
(ii) how civic amenities could be provided;
(iii) what kind of infra-structural facilities will be needed to be developed; and
(iv) what kind of common use facilities will be required to be developed.
Table – 2.1.1 Settlement Profile of the District Allahabad
Particular Area 2001 1991
(After division) 1991
(Undivided) 1981 1971 1961
Rural NA 5321.00 7110.00 7114.20 7161.10 7369.20Urban NA 116.20 150.00 146.80 93.90 89.20
Area in Sq.Km.
Total 5246 5437.20 7261.00 7261.00 7255.00 7458.40Rural NA 448667 618358 500050 398679 352110Urban NA 141861 152577 124712 87577 69661
Number of Residential Houses Total NA 590528 770935 624762 486256 421771
28
Rural NA 461585 633663 522034 440498 NAUrban NA 150299 161307 133441 104281 NA
Number of Households
Total NA 611884 794970 655475 544779 NA
29
2.1.2 Urbanisation
Another feature of settlement and area is related to urbanisation. In urban area the
number of residential houses have been increasing and the share of urban population has also
been increasing because of migration. But even more importantly, the area under urban limits
have also been increasing. Though Allahabad had been divided, the area under urban limits
increased from 89 sq.km. in 1961 to 146.8 sq.km. in 1981. i.e. an increase of 64.94 per cent during
two decades. The share of urban population has increased from 18.12 per cent in 1961 to 24.72
per cent in 2001.
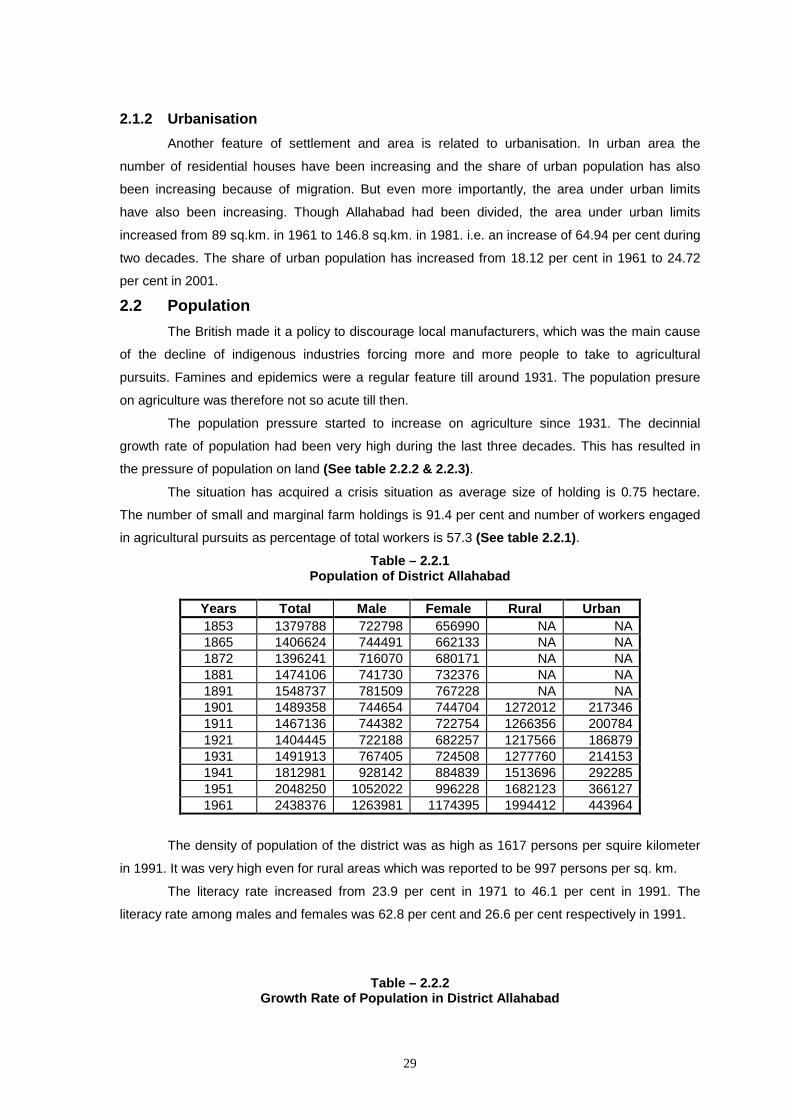
2.2 Population The British made it a policy to discourage local manufacturers, which was the main cause
of the decline of indigenous industries forcing more and more people to take to agricultural
pursuits. Famines and epidemics were a regular feature till around 1931. The population presure
on agriculture was therefore not so acute till then.
The population pressure started to increase on agriculture since 1931. The decinnial
growth rate of population had been very high during the last three decades. This has resulted in
the pressure of population on land (See table 2.2.2 & 2.2.3).
The situation has acquired a crisis situation as average size of holding is 0.75 hectare.
The number of small and marginal farm holdings is 91.4 per cent and number of workers engaged
in agricultural pursuits as percentage of total workers is 57.3 (See table 2.2.1).
Table – 2.2.1 Population of District Allahabad
Years Total Male Female Rural Urban 1853 1379788 722798 656990 NA NA 1865 1406624 744491 662133 NA NA 1872 1396241 716070 680171 NA NA 1881 1474106 741730 732376 NA NA 1891 1548737 781509 767228 NA NA 1901 1489358 744654 744704 1272012 217346 1911 1467136 744382 722754 1266356 200784 1921 1404445 722188 682257 1217566 186879 1931 1491913 767405 724508 1277760 214153 1941 1812981 928142 884839 1513696 292285 1951 2048250 1052022 996228 1682123 366127 1961 2438376 1263981 1174395 1994412 443964
The density of population of the district was as high as 1617 persons per squire kilometer
in 1991. It was very high even for rural areas which was reported to be 997 persons per sq. km.
The literacy rate increased from 23.9 per cent in 1971 to 46.1 per cent in 1991. The
literacy rate among males and females was 62.8 per cent and 26.6 per cent respectively in 1991.
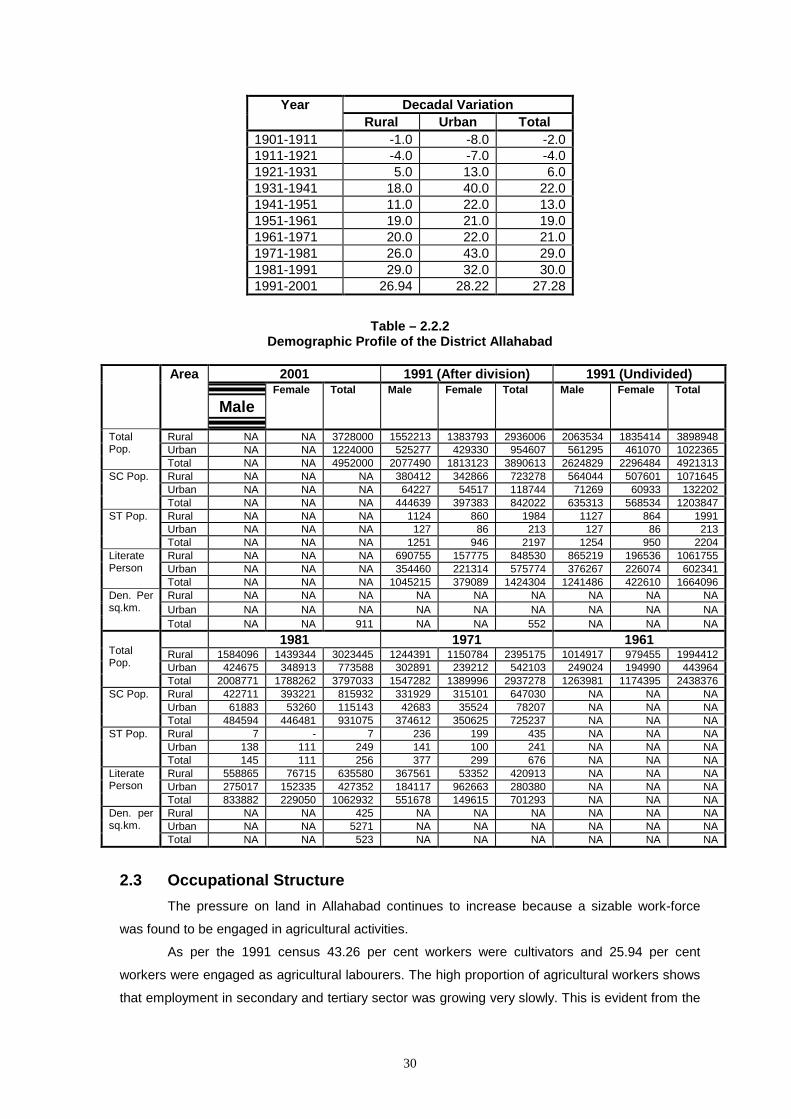
Table – 2.2.2 Growth Rate of Population in District Allahabad
30
Decadal Variation Year Rural Urban Total
1901-1911 -1.0 -8.0 -2.0 1911-1921 -4.0 -7.0 -4.0 1921-1931 5.0 13.0 6.0 1931-1941 18.0 40.0 22.0 1941-1951 11.0 22.0 13.0 1951-1961 19.0 21.0 19.0 1961-1971 20.0 22.0 21.0 1971-1981 26.0 43.0 29.0 1981-1991 29.0 32.0 30.0 1991-2001 26.94 28.22 27.28
Table – 2.2.2 Demographic Profile of the District Allahabad
2001 1991 (After division) 1991 (Undivided) Area
Male Female Total Male Female Total Male Female Total
Rural NA NA 3728000 1552213 1383793 2936006 2063534 1835414 3898948 Urban NA NA 1224000 525277 429330 954607 561295 461070 1022365
Total Pop.
Total NA NA 4952000 2077490 1813123 3890613 2624829 2296484 4921313 Rural NA NA NA 380412 342866 723278 564044 507601 1071645 Urban NA NA NA 64227 54517 118744 71269 60933 132202
SC Pop.
Total NA NA NA 444639 397383 842022 635313 568534 1203847 Rural NA NA NA 1124 860 1984 1127 864 1991 Urban NA NA NA 127 86 213 127 86 213
ST Pop.
Total NA NA NA 1251 946 2197 1254 950 2204 Rural NA NA NA 690755 157775 848530 865219 196536 1061755 Urban NA NA NA 354460 221314 575774 376267 226074 602341
Literate Person
Total NA NA NA 1045215 379089 1424304 1241486 422610 1664096 Rural NA NA NA NA NA NA NA NA NA Urban NA NA NA NA NA NA NA NA NA
Den. Per sq.km.
Total NA NA 911 NA NA 552 NA NA NA 1981 1971 1961 Rural 1584096 1439344 3023445 1244391 1150784 2395175 1014917 979455 1994412 Urban 424675 348913 773588 302891 239212 542103 249024 194990 443964
Total Pop.
Total 2008771 1788262 3797033 1547282 1389996 2937278 1263981 1174395 2438376 Rural 422711 393221 815932 331929 315101 647030 NA NA NA Urban 61883 53260 115143 42683 35524 78207 NA NA NA
SC Pop.
Total 484594 446481 931075 374612 350625 725237 NA NA NA Rural 7 - 7 236 199 435 NA NA NA Urban 138 111 249 141 100 241 NA NA NA
ST Pop.
Total 145 111 256 377 299 676 NA NA NA Rural 558865 76715 635580 367561 53352 420913 NA NA NA Urban 275017 152335 427352 184117 962663 280380 NA NA NA
Literate Person
Total 833882 229050 1062932 551678 149615 701293 NA NA NA Rural NA NA 425 NA NA NA NA NA NA Urban NA NA 5271 NA NA NA NA NA NA
Den. per sq.km.
Total NA NA 523 NA NA NA NA NA NA
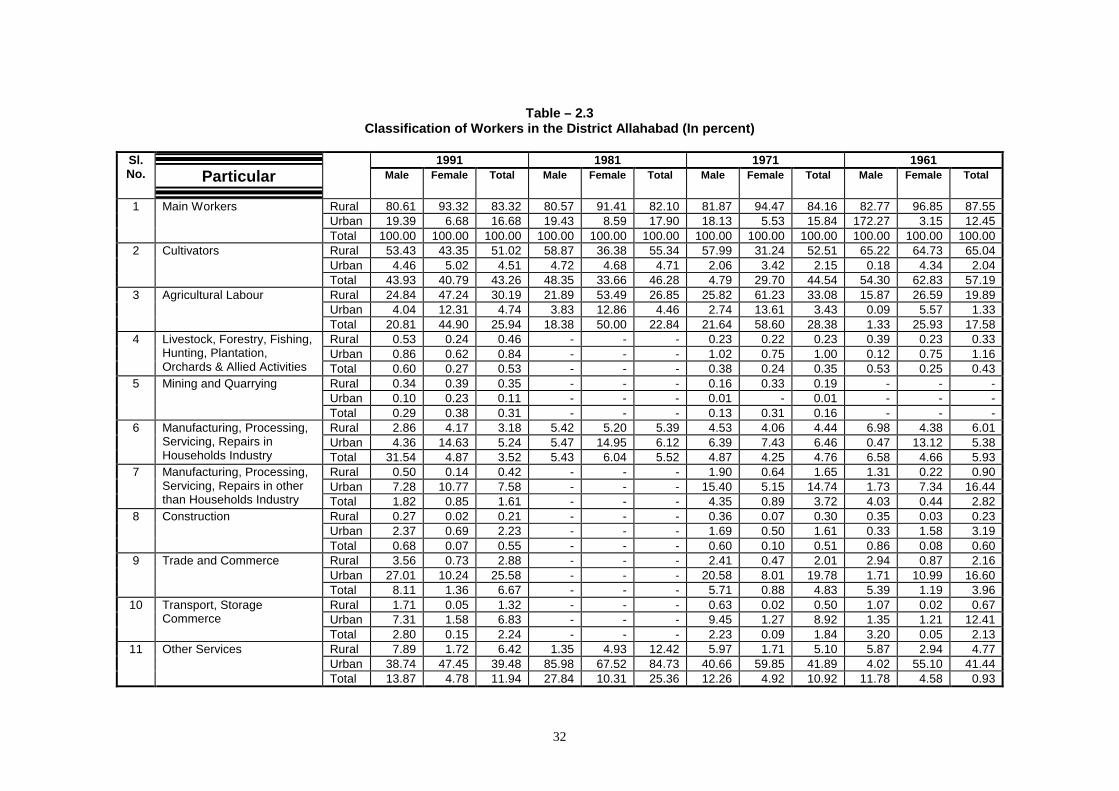
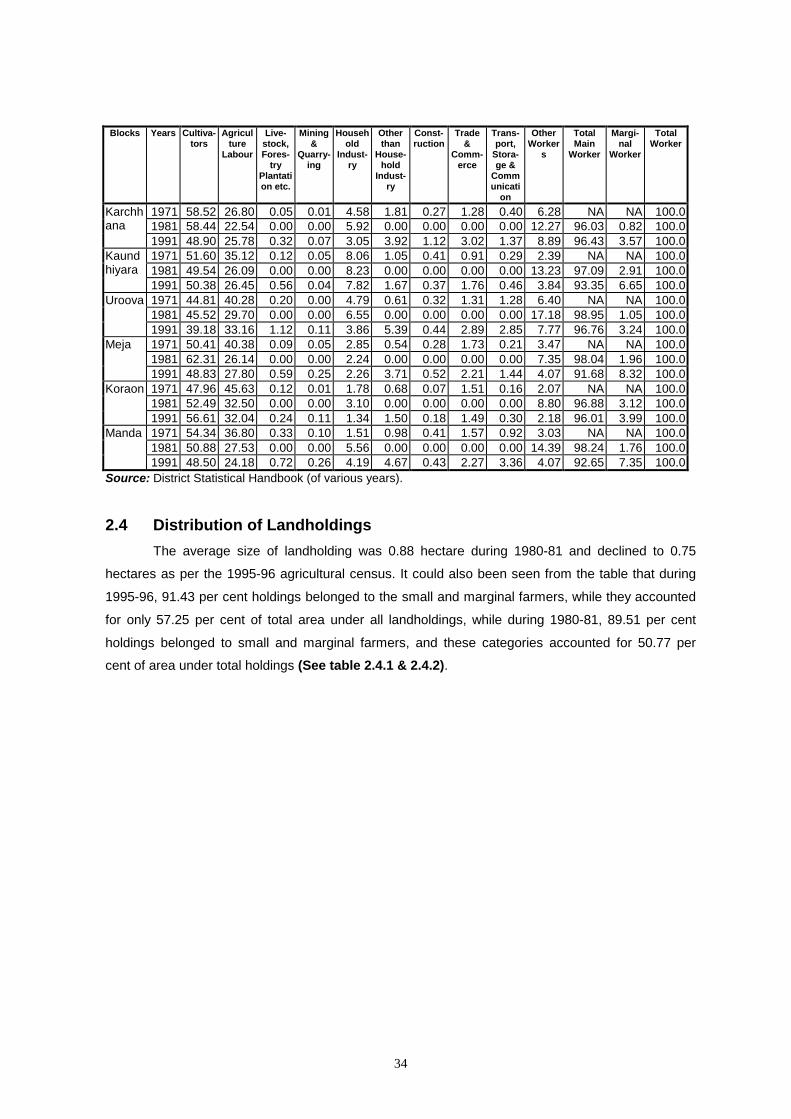
2.3 Occupational Structure The pressure on land in Allahabad continues to increase because a sizable work-force
was found to be engaged in agricultural activities.
As per the 1991 census 43.26 per cent workers were cultivators and 25.94 per cent
workers were engaged as agricultural labourers. The high proportion of agricultural workers shows
that employment in secondary and tertiary sector was growing very slowly. This is evident from the
31
fact that number of workers engaged in household industry was 3.52 per cent while those engaged
in other than household industry was 1.61 per cent only. The number of workers engaged in trade
and commerce and other services was 6.67 per cent and 11.94 per cent respectively.
It could also be seen from table 2.3 that whereas the proportion of agricultural labourers
has increased during 1981-91, the proportion of workers in household industry and in other
services have declined during the same period.
This trend was in evidence in all the blocks of Allahabad district.
32
Table – 2.3 Classification of Workers in the District Allahabad (In percent)
1991 1981 1971 1961 Sl.
No. Particular
Male Female Total Male Female Total Male Female Total Male Female Total
Rural 80.61 93.32 83.32 80.57 91.41 82.10 81.87 94.47 84.16 82.77 96.85 87.55 Urban 19.39 6.68 16.68 19.43 8.59 17.90 18.13 5.53 15.84 172.27 3.15 12.45
1 Main Workers
Total 100.00 100.00 100.00 100.00 100.00 100.00 100.00 100.00 100.00 100.00 100.00 100.00 Rural 53.43 43.35 51.02 58.87 36.38 55.34 57.99 31.24 52.51 65.22 64.73 65.04 Urban 4.46 5.02 4.51 4.72 4.68 4.71 2.06 3.42 2.15 0.18 4.34 2.04
2 Cultivators
Total 43.93 40.79 43.26 48.35 33.66 46.28 4.79 29.70 44.54 54.30 62.83 57.19 Rural 24.84 47.24 30.19 21.89 53.49 26.85 25.82 61.23 33.08 15.87 26.59 19.89 Urban 4.04 12.31 4.74 3.83 12.86 4.46 2.74 13.61 3.43 0.09 5.57 1.33
3 Agricultural Labour
Total 20.81 44.90 25.94 18.38 50.00 22.84 21.64 58.60 28.38 1.33 25.93 17.58 Rural 0.53 0.24 0.46 - - - 0.23 0.22 0.23 0.39 0.23 0.33 Urban 0.86 0.62 0.84 - - - 1.02 0.75 1.00 0.12 0.75 1.16
4 Livestock, Forestry, Fishing, Hunting, Plantation, Orchards & Allied Activities Total 0.60 0.27 0.53 - - - 0.38 0.24 0.35 0.53 0.25 0.43
Rural 0.34 0.39 0.35 - - - 0.16 0.33 0.19 - - - Urban 0.10 0.23 0.11 - - - 0.01 - 0.01 - - -
5 Mining and Quarrying
Total 0.29 0.38 0.31 - - - 0.13 0.31 0.16 - - - Rural 2.86 4.17 3.18 5.42 5.20 5.39 4.53 4.06 4.44 6.98 4.38 6.01 Urban 4.36 14.63 5.24 5.47 14.95 6.12 6.39 7.43 6.46 0.47 13.12 5.38
6 Manufacturing, Processing, Servicing, Repairs in Households Industry Total 31.54 4.87 3.52 5.43 6.04 5.52 4.87 4.25 4.76 6.58 4.66 5.93
Rural 0.50 0.14 0.42 - - - 1.90 0.64 1.65 1.31 0.22 0.90 Urban 7.28 10.77 7.58 - - - 15.40 5.15 14.74 1.73 7.34 16.44
7 Manufacturing, Processing, Servicing, Repairs in other than Households Industry Total 1.82 0.85 1.61 - - - 4.35 0.89 3.72 4.03 0.44 2.82
Rural 0.27 0.02 0.21 - - - 0.36 0.07 0.30 0.35 0.03 0.23 Urban 2.37 0.69 2.23 - - - 1.69 0.50 1.61 0.33 1.58 3.19
8 Construction
Total 0.68 0.07 0.55 - - - 0.60 0.10 0.51 0.86 0.08 0.60 Rural 3.56 0.73 2.88 - - - 2.41 0.47 2.01 2.94 0.87 2.16 Urban 27.01 10.24 25.58 - - - 20.58 8.01 19.78 1.71 10.99 16.60
9 Trade and Commerce
Total 8.11 1.36 6.67 - - - 5.71 0.88 4.83 5.39 1.19 3.96 Rural 1.71 0.05 1.32 - - - 0.63 0.02 0.50 1.07 0.02 0.67 Urban 7.31 1.58 6.83 - - - 9.45 1.27 8.92 1.35 1.21 12.41
10 Transport, Storage Commerce
Total 2.80 0.15 2.24 - - - 2.23 0.09 1.84 3.20 0.05 2.13 Rural 7.89 1.72 6.42 1.35 4.93 12.42 5.97 1.71 5.10 5.87 2.94 4.77 Urban 38.74 47.45 39.48 85.98 67.52 84.73 40.66 59.85 41.89 4.02 55.10 41.44
11 Other Services
Total 13.87 4.78 11.94 27.84 10.31 25.36 12.26 4.92 10.92 11.78 4.58 0.93
33
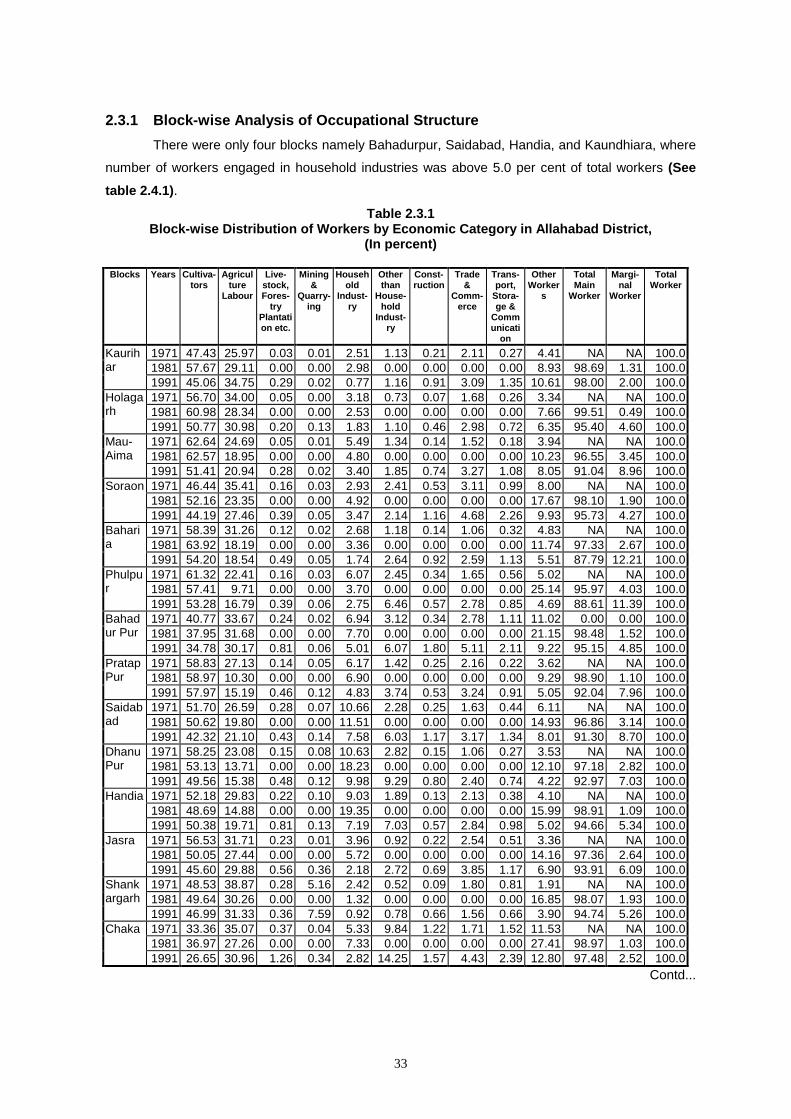
2.3.1 Block-wise Analysis of Occupational Structure
There were only four blocks namely Bahadurpur, Saidabad, Handia, and Kaundhiara, where
number of workers engaged in household industries was above 5.0 per cent of total workers (See
table 2.4.1).
Table 2.3.1 Block-wise Distribution of Workers by Economic Category in Allahabad District,
(In percent) Blocks Years Cultiva-
tors Agricul
ture Labour
Live-stock, Fores-
try Plantation etc.
Mining &
Quarry-ing
Household
Indust-ry
Other than
House-hold
Indust-ry
Const-ruction
Trade &
Comm-erce
Trans-port,
Stora-ge &
Communicati
on
Other Worker
s
Total Main
Worker
Margi-nal
Worker
Total Worker
1971 47.43 25.97 0.03 0.01 2.51 1.13 0.21 2.11 0.27 4.41 NA NA 100.01981 57.67 29.11 0.00 0.00 2.98 0.00 0.00 0.00 0.00 8.93 98.69 1.31 100.0
Kaurihar 1991 45.06 34.75 0.29 0.02 0.77 1.16 0.91 3.09 1.35 10.61 98.00 2.00 100.0
1971 56.70 34.00 0.05 0.00 3.18 0.73 0.07 1.68 0.26 3.34 NA NA 100.01981 60.98 28.34 0.00 0.00 2.53 0.00 0.00 0.00 0.00 7.66 99.51 0.49 100.0
Holagarh 1991 50.77 30.98 0.20 0.13 1.83 1.10 0.46 2.98 0.72 6.35 95.40 4.60 100.0
1971 62.64 24.69 0.05 0.01 5.49 1.34 0.14 1.52 0.18 3.94 NA NA 100.01981 62.57 18.95 0.00 0.00 4.80 0.00 0.00 0.00 0.00 10.23 96.55 3.45 100.0
Mau-Aima 1991 51.41 20.94 0.28 0.02 3.40 1.85 0.74 3.27 1.08 8.05 91.04 8.96 100.0
1971 46.44 35.41 0.16 0.03 2.93 2.41 0.53 3.11 0.99 8.00 NA NA 100.01981 52.16 23.35 0.00 0.00 4.92 0.00 0.00 0.00 0.00 17.67 98.10 1.90 100.0
Soraon
1991 44.19 27.46 0.39 0.05 3.47 2.14 1.16 4.68 2.26 9.93 95.73 4.27 100.01971 58.39 31.26 0.12 0.02 2.68 1.18 0.14 1.06 0.32 4.83 NA NA 100.01981 63.92 18.19 0.00 0.00 3.36 0.00 0.00 0.00 0.00 11.74 97.33 2.67 100.0
Baharia 1991 54.20 18.54 0.49 0.05 1.74 2.64 0.92 2.59 1.13 5.51 87.79 12.21 100.0
1971 61.32 22.41 0.16 0.03 6.07 2.45 0.34 1.65 0.56 5.02 NA NA 100.01981 57.41 9.71 0.00 0.00 3.70 0.00 0.00 0.00 0.00 25.14 95.97 4.03 100.0
Phulpur 1991 53.28 16.79 0.39 0.06 2.75 6.46 0.57 2.78 0.85 4.69 88.61 11.39 100.0
1971 40.77 33.67 0.24 0.02 6.94 3.12 0.34 2.78 1.11 11.02 0.00 0.00 100.01981 37.95 31.68 0.00 0.00 7.70 0.00 0.00 0.00 0.00 21.15 98.48 1.52 100.0
Bahadur Pur 1991 34.78 30.17 0.81 0.06 5.01 6.07 1.80 5.11 2.11 9.22 95.15 4.85 100.0
1971 58.83 27.13 0.14 0.05 6.17 1.42 0.25 2.16 0.22 3.62 NA NA 100.01981 58.97 10.30 0.00 0.00 6.90 0.00 0.00 0.00 0.00 9.29 98.90 1.10 100.0
Pratap Pur 1991 57.97 15.19 0.46 0.12 4.83 3.74 0.53 3.24 0.91 5.05 92.04 7.96 100.0
1971 51.70 26.59 0.28 0.07 10.66 2.28 0.25 1.63 0.44 6.11 NA NA 100.01981 50.62 19.80 0.00 0.00 11.51 0.00 0.00 0.00 0.00 14.93 96.86 3.14 100.0
Saidabad 1991 42.32 21.10 0.43 0.14 7.58 6.03 1.17 3.17 1.34 8.01 91.30 8.70 100.0
1971 58.25 23.08 0.15 0.08 10.63 2.82 0.15 1.06 0.27 3.53 NA NA 100.01981 53.13 13.71 0.00 0.00 18.23 0.00 0.00 0.00 0.00 12.10 97.18 2.82 100.0
Dhanu Pur 1991 49.56 15.38 0.48 0.12 9.98 9.29 0.80 2.40 0.74 4.22 92.97 7.03 100.0
1971 52.18 29.83 0.22 0.10 9.03 1.89 0.13 2.13 0.38 4.10 NA NA 100.01981 48.69 14.88 0.00 0.00 19.35 0.00 0.00 0.00 0.00 15.99 98.91 1.09 100.0
Handia
1991 50.38 19.71 0.81 0.13 7.19 7.03 0.57 2.84 0.98 5.02 94.66 5.34 100.01971 56.53 31.71 0.23 0.01 3.96 0.92 0.22 2.54 0.51 3.36 NA NA 100.01981 50.05 27.44 0.00 0.00 5.72 0.00 0.00 0.00 0.00 14.16 97.36 2.64 100.0
Jasra
1991 45.60 29.88 0.56 0.36 2.18 2.72 0.69 3.85 1.17 6.90 93.91 6.09 100.01971 48.53 38.87 0.28 5.16 2.42 0.52 0.09 1.80 0.81 1.91 NA NA 100.01981 49.64 30.26 0.00 0.00 1.32 0.00 0.00 0.00 0.00 16.85 98.07 1.93 100.0
Shankargarh 1991 46.99 31.33 0.36 7.59 0.92 0.78 0.66 1.56 0.66 3.90 94.74 5.26 100.0
1971 33.36 35.07 0.37 0.04 5.33 9.84 1.22 1.71 1.52 11.53 NA NA 100.01981 36.97 27.26 0.00 0.00 7.33 0.00 0.00 0.00 0.00 27.41 98.97 1.03 100.0
Chaka
1991 26.65 30.96 1.26 0.34 2.82 14.25 1.57 4.43 2.39 12.80 97.48 2.52 100.0Contd...
34
Blocks Years Cultiva-
tors Agricul
ture Labour
Live-stock, Fores-
try Plantation etc.
Mining &
Quarry-ing
Household
Indust-ry
Other than
House-hold
Indust-ry
Const-ruction
Trade &
Comm-erce
Trans-port,
Stora-ge &
Communicati
on
Other Worker
s
Total Main
Worker
Margi-nal
Worker
Total Worker
1971 58.52 26.80 0.05 0.01 4.58 1.81 0.27 1.28 0.40 6.28 NA NA 100.01981 58.44 22.54 0.00 0.00 5.92 0.00 0.00 0.00 0.00 12.27 96.03 0.82 100.0
Karchhana 1991 48.90 25.78 0.32 0.07 3.05 3.92 1.12 3.02 1.37 8.89 96.43 3.57 100.0
1971 51.60 35.12 0.12 0.05 8.06 1.05 0.41 0.91 0.29 2.39 NA NA 100.01981 49.54 26.09 0.00 0.00 8.23 0.00 0.00 0.00 0.00 13.23 97.09 2.91 100.0
Kaundhiyara 1991 50.38 26.45 0.56 0.04 7.82 1.67 0.37 1.76 0.46 3.84 93.35 6.65 100.0
1971 44.81 40.28 0.20 0.00 4.79 0.61 0.32 1.31 1.28 6.40 NA NA 100.01981 45.52 29.70 0.00 0.00 6.55 0.00 0.00 0.00 0.00 17.18 98.95 1.05 100.0
Uroova
1991 39.18 33.16 1.12 0.11 3.86 5.39 0.44 2.89 2.85 7.77 96.76 3.24 100.01971 50.41 40.38 0.09 0.05 2.85 0.54 0.28 1.73 0.21 3.47 NA NA 100.01981 62.31 26.14 0.00 0.00 2.24 0.00 0.00 0.00 0.00 7.35 98.04 1.96 100.0
Meja
1991 48.83 27.80 0.59 0.25 2.26 3.71 0.52 2.21 1.44 4.07 91.68 8.32 100.01971 47.96 45.63 0.12 0.01 1.78 0.68 0.07 1.51 0.16 2.07 NA NA 100.01981 52.49 32.50 0.00 0.00 3.10 0.00 0.00 0.00 0.00 8.80 96.88 3.12 100.0
Koraon
1991 56.61 32.04 0.24 0.11 1.34 1.50 0.18 1.49 0.30 2.18 96.01 3.99 100.01971 54.34 36.80 0.33 0.10 1.51 0.98 0.41 1.57 0.92 3.03 NA NA 100.01981 50.88 27.53 0.00 0.00 5.56 0.00 0.00 0.00 0.00 14.39 98.24 1.76 100.0
Manda
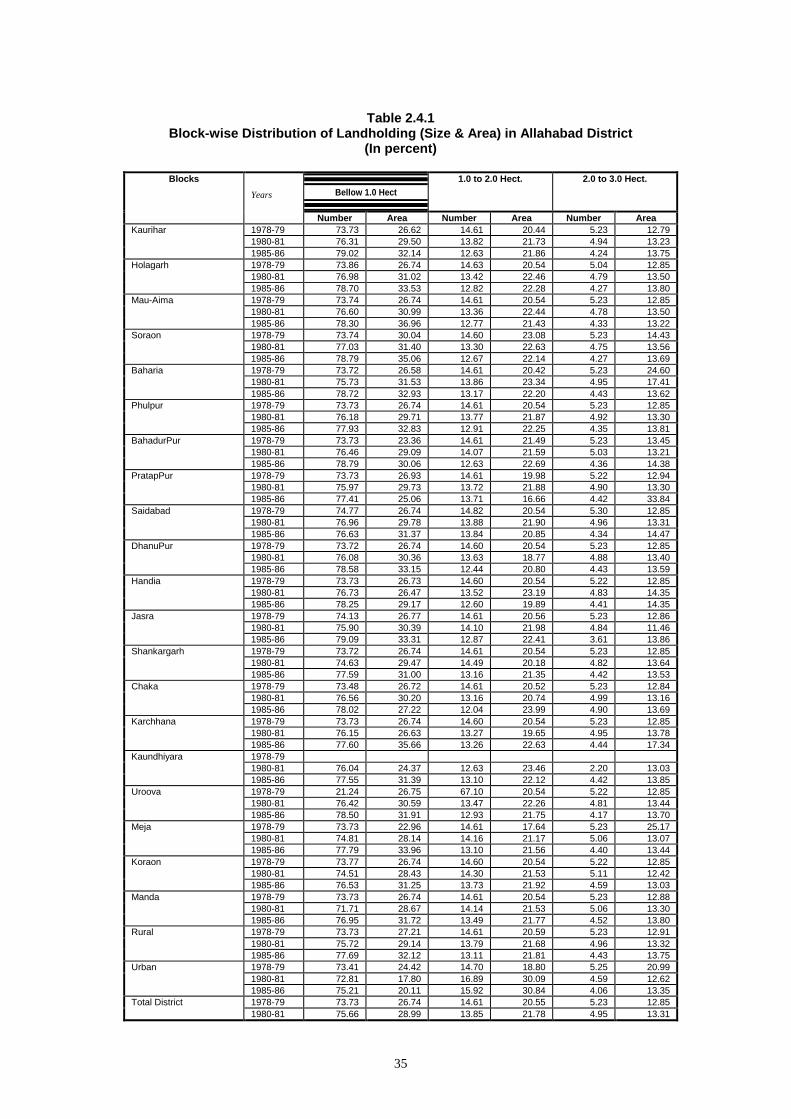
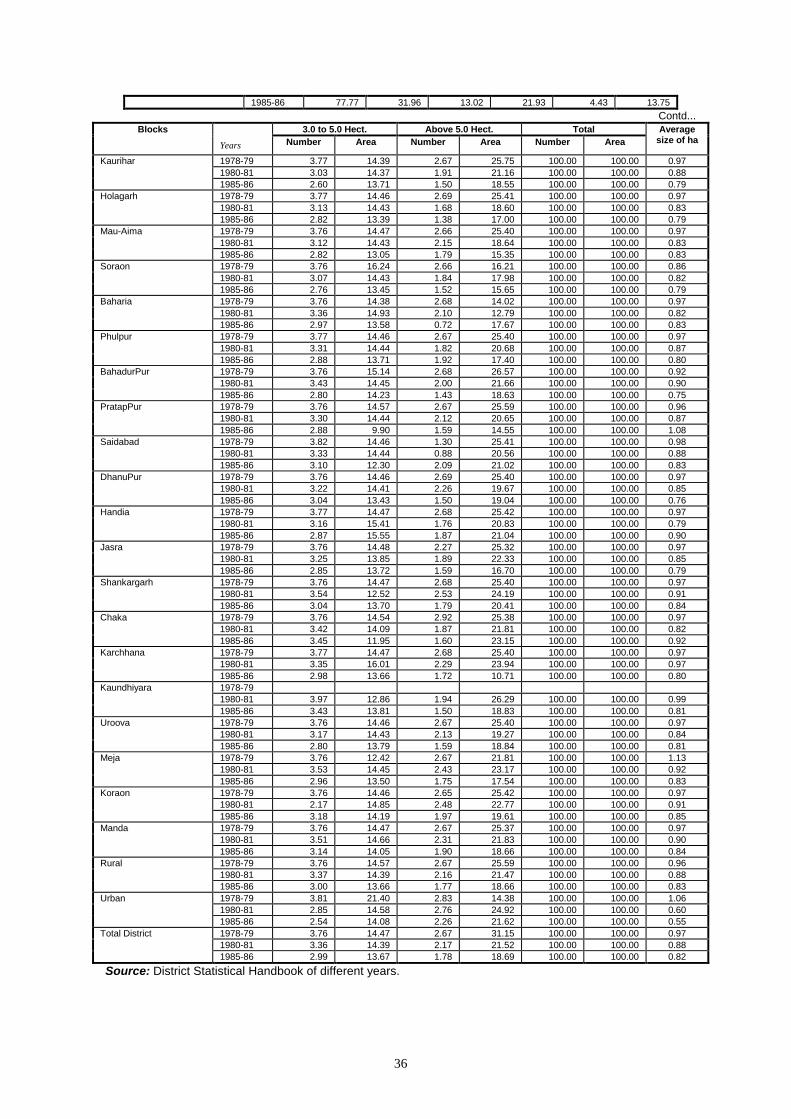
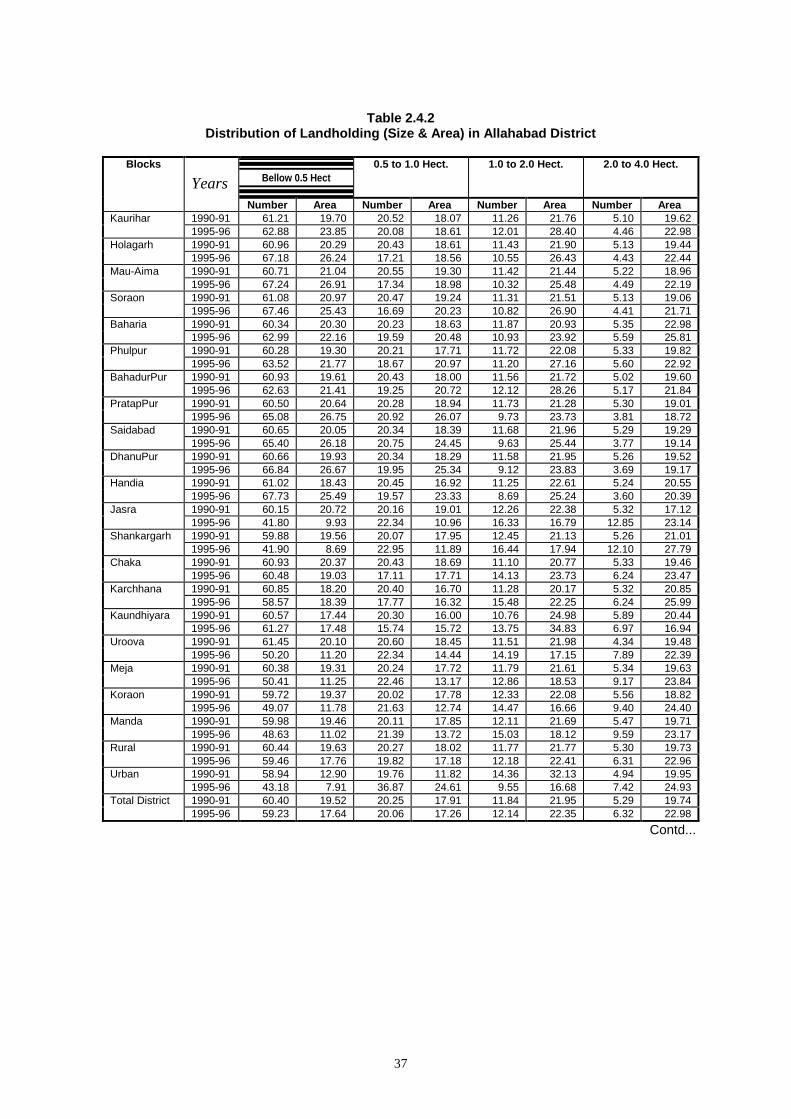
1991 48.50 24.18 0.72 0.26 4.19 4.67 0.43 2.27 3.36 4.07 92.65 7.35 100.0Source: District Statistical Handbook (of various years). 2.4 Distribution of Landholdings
The average size of landholding was 0.88 hectare during 1980-81 and declined to 0.75
hectares as per the 1995-96 agricultural census. It could also been seen from the table that during
1995-96, 91.43 per cent holdings belonged to the small and marginal farmers, while they accounted
for only 57.25 per cent of total area under all landholdings, while during 1980-81, 89.51 per cent
holdings belonged to small and marginal farmers, and these categories accounted for 50.77 per
cent of area under total holdings (See table 2.4.1 & 2.4.2).
35
Table 2.4.1
Block-wise Distribution of Landholding (Size & Area) in Allahabad District (In percent)
Bellow 1.0 Hect 1.0 to 2.0 Hect. 2.0 to 3.0 Hect. Blocks
Years
Number Area Number Area Number Area 1978-79 73.73 26.62 14.61 20.44 5.23 12.79 1980-81 76.31 29.50 13.82 21.73 4.94 13.23
Kaurihar
1985-86 79.02 32.14 12.63 21.86 4.24 13.75 1978-79 73.86 26.74 14.63 20.54 5.04 12.85 1980-81 76.98 31.02 13.42 22.46 4.79 13.50
Holagarh
1985-86 78.70 33.53 12.82 22.28 4.27 13.80 1978-79 73.74 26.74 14.61 20.54 5.23 12.85 1980-81 76.60 30.99 13.36 22.44 4.78 13.50
Mau-Aima
1985-86 78.30 36.96 12.77 21.43 4.33 13.22 1978-79 73.74 30.04 14.60 23.08 5.23 14.43 1980-81 77.03 31.40 13.30 22.63 4.75 13.56
Soraon
1985-86 78.79 35.06 12.67 22.14 4.27 13.69 1978-79 73.72 26.58 14.61 20.42 5.23 24.60 1980-81 75.73 31.53 13.86 23.34 4.95 17.41
Baharia
1985-86 78.72 32.93 13.17 22.20 4.43 13.62 1978-79 73.73 26.74 14.61 20.54 5.23 12.85 1980-81 76.18 29.71 13.77 21.87 4.92 13.30
Phulpur
1985-86 77.93 32.83 12.91 22.25 4.35 13.81 1978-79 73.73 23.36 14.61 21.49 5.23 13.45 1980-81 76.46 29.09 14.07 21.59 5.03 13.21
BahadurPur
1985-86 78.79 30.06 12.63 22.69 4.36 14.38 1978-79 73.73 26.93 14.61 19.98 5.22 12.94 1980-81 75.97 29.73 13.72 21.88 4.90 13.30
PratapPur
1985-86 77.41 25.06 13.71 16.66 4.42 33.84 1978-79 74.77 26.74 14.82 20.54 5.30 12.85 1980-81 76.96 29.78 13.88 21.90 4.96 13.31
Saidabad
1985-86 76.63 31.37 13.84 20.85 4.34 14.47 1978-79 73.72 26.74 14.60 20.54 5.23 12.85 1980-81 76.08 30.36 13.63 18.77 4.88 13.40
DhanuPur
1985-86 78.58 33.15 12.44 20.80 4.43 13.59 1978-79 73.73 26.73 14.60 20.54 5.22 12.85 1980-81 76.73 26.47 13.52 23.19 4.83 14.35
Handia
1985-86 78.25 29.17 12.60 19.89 4.41 14.35 1978-79 74.13 26.77 14.61 20.56 5.23 12.86 1980-81 75.90 30.39 14.10 21.98 4.84 11.46
Jasra
1985-86 79.09 33.31 12.87 22.41 3.61 13.86 1978-79 73.72 26.74 14.61 20.54 5.23 12.85 1980-81 74.63 29.47 14.49 20.18 4.82 13.64
Shankargarh
1985-86 77.59 31.00 13.16 21.35 4.42 13.53 1978-79 73.48 26.72 14.61 20.52 5.23 12.84 1980-81 76.56 30.20 13.16 20.74 4.99 13.16
Chaka
1985-86 78.02 27.22 12.04 23.99 4.90 13.69 1978-79 73.73 26.74 14.60 20.54 5.23 12.85 1980-81 76.15 26.63 13.27 19.65 4.95 13.78
Karchhana
1985-86 77.60 35.66 13.26 22.63 4.44 17.34 1978-79 1980-81 76.04 24.37 12.63 23.46 2.20 13.03
Kaundhiyara
1985-86 77.55 31.39 13.10 22.12 4.42 13.85 1978-79 21.24 26.75 67.10 20.54 5.22 12.85 1980-81 76.42 30.59 13.47 22.26 4.81 13.44
Uroova
1985-86 78.50 31.91 12.93 21.75 4.17 13.70 1978-79 73.73 22.96 14.61 17.64 5.23 25.17 1980-81 74.81 28.14 14.16 21.17 5.06 13.07
Meja
1985-86 77.79 33.96 13.10 21.56 4.40 13.44 1978-79 73.77 26.74 14.60 20.54 5.22 12.85 1980-81 74.51 28.43 14.30 21.53 5.11 12.42
Koraon
1985-86 76.53 31.25 13.73 21.92 4.59 13.03 1978-79 73.73 26.74 14.61 20.54 5.23 12.88 1980-81 71.71 28.67 14.14 21.53 5.06 13.30
Manda
1985-86 76.95 31.72 13.49 21.77 4.52 13.80 1978-79 73.73 27.21 14.61 20.59 5.23 12.91 1980-81 75.72 29.14 13.79 21.68 4.96 13.32
Rural
1985-86 77.69 32.12 13.11 21.81 4.43 13.75 1978-79 73.41 24.42 14.70 18.80 5.25 20.99 1980-81 72.81 17.80 16.89 30.09 4.59 12.62
Urban
1985-86 75.21 20.11 15.92 30.84 4.06 13.35 1978-79 73.73 26.74 14.61 20.55 5.23 12.85 Total District 1980-81 75.66 28.99 13.85 21.78 4.95 13.31
36
1985-86 77.77 31.96 13.02 21.93 4.43 13.75 Contd...
3.0 to 5.0 Hect. Above 5.0 Hect. Total Blocks Years Number Area Number Area Number Area
Average size of ha
1978-79 3.77 14.39 2.67 25.75 100.00 100.00 0.97 1980-81 3.03 14.37 1.91 21.16 100.00 100.00 0.88
Kaurihar
1985-86 2.60 13.71 1.50 18.55 100.00 100.00 0.79 1978-79 3.77 14.46 2.69 25.41 100.00 100.00 0.97 1980-81 3.13 14.43 1.68 18.60 100.00 100.00 0.83
Holagarh
1985-86 2.82 13.39 1.38 17.00 100.00 100.00 0.79 1978-79 3.76 14.47 2.66 25.40 100.00 100.00 0.97 1980-81 3.12 14.43 2.15 18.64 100.00 100.00 0.83
Mau-Aima
1985-86 2.82 13.05 1.79 15.35 100.00 100.00 0.83 1978-79 3.76 16.24 2.66 16.21 100.00 100.00 0.86 1980-81 3.07 14.43 1.84 17.98 100.00 100.00 0.82
Soraon
1985-86 2.76 13.45 1.52 15.65 100.00 100.00 0.79 1978-79 3.76 14.38 2.68 14.02 100.00 100.00 0.97 1980-81 3.36 14.93 2.10 12.79 100.00 100.00 0.82
Baharia
1985-86 2.97 13.58 0.72 17.67 100.00 100.00 0.83 1978-79 3.77 14.46 2.67 25.40 100.00 100.00 0.97 1980-81 3.31 14.44 1.82 20.68 100.00 100.00 0.87
Phulpur
1985-86 2.88 13.71 1.92 17.40 100.00 100.00 0.80 1978-79 3.76 15.14 2.68 26.57 100.00 100.00 0.92 1980-81 3.43 14.45 2.00 21.66 100.00 100.00 0.90
BahadurPur
1985-86 2.80 14.23 1.43 18.63 100.00 100.00 0.75 1978-79 3.76 14.57 2.67 25.59 100.00 100.00 0.96 1980-81 3.30 14.44 2.12 20.65 100.00 100.00 0.87
PratapPur
1985-86 2.88 9.90 1.59 14.55 100.00 100.00 1.08 1978-79 3.82 14.46 1.30 25.41 100.00 100.00 0.98 1980-81 3.33 14.44 0.88 20.56 100.00 100.00 0.88
Saidabad
1985-86 3.10 12.30 2.09 21.02 100.00 100.00 0.83 1978-79 3.76 14.46 2.69 25.40 100.00 100.00 0.97 1980-81 3.22 14.41 2.26 19.67 100.00 100.00 0.85
DhanuPur
1985-86 3.04 13.43 1.50 19.04 100.00 100.00 0.76 1978-79 3.77 14.47 2.68 25.42 100.00 100.00 0.97 1980-81 3.16 15.41 1.76 20.83 100.00 100.00 0.79
Handia
1985-86 2.87 15.55 1.87 21.04 100.00 100.00 0.90 1978-79 3.76 14.48 2.27 25.32 100.00 100.00 0.97 1980-81 3.25 13.85 1.89 22.33 100.00 100.00 0.85
Jasra
1985-86 2.85 13.72 1.59 16.70 100.00 100.00 0.79 1978-79 3.76 14.47 2.68 25.40 100.00 100.00 0.97 1980-81 3.54 12.52 2.53 24.19 100.00 100.00 0.91
Shankargarh
1985-86 3.04 13.70 1.79 20.41 100.00 100.00 0.84 1978-79 3.76 14.54 2.92 25.38 100.00 100.00 0.97 1980-81 3.42 14.09 1.87 21.81 100.00 100.00 0.82
Chaka
1985-86 3.45 11.95 1.60 23.15 100.00 100.00 0.92 1978-79 3.77 14.47 2.68 25.40 100.00 100.00 0.97 1980-81 3.35 16.01 2.29 23.94 100.00 100.00 0.97
Karchhana
1985-86 2.98 13.66 1.72 10.71 100.00 100.00 0.80 1978-79 1980-81 3.97 12.86 1.94 26.29 100.00 100.00 0.99
Kaundhiyara
1985-86 3.43 13.81 1.50 18.83 100.00 100.00 0.81 1978-79 3.76 14.46 2.67 25.40 100.00 100.00 0.97 1980-81 3.17 14.43 2.13 19.27 100.00 100.00 0.84
Uroova
1985-86 2.80 13.79 1.59 18.84 100.00 100.00 0.81 1978-79 3.76 12.42 2.67 21.81 100.00 100.00 1.13 1980-81 3.53 14.45 2.43 23.17 100.00 100.00 0.92
Meja
1985-86 2.96 13.50 1.75 17.54 100.00 100.00 0.83 1978-79 3.76 14.46 2.65 25.42 100.00 100.00 0.97 1980-81 2.17 14.85 2.48 22.77 100.00 100.00 0.91
Koraon
1985-86 3.18 14.19 1.97 19.61 100.00 100.00 0.85 1978-79 3.76 14.47 2.67 25.37 100.00 100.00 0.97 1980-81 3.51 14.66 2.31 21.83 100.00 100.00 0.90
Manda
1985-86 3.14 14.05 1.90 18.66 100.00 100.00 0.84 1978-79 3.76 14.57 2.67 25.59 100.00 100.00 0.96 1980-81 3.37 14.39 2.16 21.47 100.00 100.00 0.88
Rural
1985-86 3.00 13.66 1.77 18.66 100.00 100.00 0.83 1978-79 3.81 21.40 2.83 14.38 100.00 100.00 1.06 1980-81 2.85 14.58 2.76 24.92 100.00 100.00 0.60
Urban
1985-86 2.54 14.08 2.26 21.62 100.00 100.00 0.55 1978-79 3.76 14.47 2.67 31.15 100.00 100.00 0.97 1980-81 3.36 14.39 2.17 21.52 100.00 100.00 0.88
Total District
1985-86 2.99 13.67 1.78 18.69 100.00 100.00 0.82 Source: District Statistical Handbook of different years.
37
Table 2.4.2
Distribution of Landholding (Size & Area) in Allahabad District
Bellow 0.5 Hect 0.5 to 1.0 Hect. 1.0 to 2.0 Hect. 2.0 to 4.0 Hect. Blocks
Years Number Area Number Area Number Area Number Area
1990-91 61.21 19.70 20.52 18.07 11.26 21.76 5.10 19.62 Kaurihar 1995-96 62.88 23.85 20.08 18.61 12.01 28.40 4.46 22.98 1990-91 60.96 20.29 20.43 18.61 11.43 21.90 5.13 19.44 Holagarh 1995-96 67.18 26.24 17.21 18.56 10.55 26.43 4.43 22.44 1990-91 60.71 21.04 20.55 19.30 11.42 21.44 5.22 18.96 Mau-Aima 1995-96 67.24 26.91 17.34 18.98 10.32 25.48 4.49 22.19 1990-91 61.08 20.97 20.47 19.24 11.31 21.51 5.13 19.06 Soraon 1995-96 67.46 25.43 16.69 20.23 10.82 26.90 4.41 21.71 1990-91 60.34 20.30 20.23 18.63 11.87 20.93 5.35 22.98 Baharia 1995-96 62.99 22.16 19.59 20.48 10.93 23.92 5.59 25.81 1990-91 60.28 19.30 20.21 17.71 11.72 22.08 5.33 19.82 Phulpur 1995-96 63.52 21.77 18.67 20.97 11.20 27.16 5.60 22.92 1990-91 60.93 19.61 20.43 18.00 11.56 21.72 5.02 19.60 BahadurPur 1995-96 62.63 21.41 19.25 20.72 12.12 28.26 5.17 21.84 1990-91 60.50 20.64 20.28 18.94 11.73 21.28 5.30 19.01 PratapPur 1995-96 65.08 26.75 20.92 26.07 9.73 23.73 3.81 18.72 1990-91 60.65 20.05 20.34 18.39 11.68 21.96 5.29 19.29 Saidabad 1995-96 65.40 26.18 20.75 24.45 9.63 25.44 3.77 19.14 1990-91 60.66 19.93 20.34 18.29 11.58 21.95 5.26 19.52 DhanuPur 1995-96 66.84 26.67 19.95 25.34 9.12 23.83 3.69 19.17 1990-91 61.02 18.43 20.45 16.92 11.25 22.61 5.24 20.55 Handia 1995-96 67.73 25.49 19.57 23.33 8.69 25.24 3.60 20.39 1990-91 60.15 20.72 20.16 19.01 12.26 22.38 5.32 17.12 Jasra 1995-96 41.80 9.93 22.34 10.96 16.33 16.79 12.85 23.14 1990-91 59.88 19.56 20.07 17.95 12.45 21.13 5.26 21.01 Shankargarh 1995-96 41.90 8.69 22.95 11.89 16.44 17.94 12.10 27.79 1990-91 60.93 20.37 20.43 18.69 11.10 20.77 5.33 19.46 Chaka 1995-96 60.48 19.03 17.11 17.71 14.13 23.73 6.24 23.47 1990-91 60.85 18.20 20.40 16.70 11.28 20.17 5.32 20.85 Karchhana 1995-96 58.57 18.39 17.77 16.32 15.48 22.25 6.24 25.99 1990-91 60.57 17.44 20.30 16.00 10.76 24.98 5.89 20.44 Kaundhiyara 1995-96 61.27 17.48 15.74 15.72 13.75 34.83 6.97 16.94 1990-91 61.45 20.10 20.60 18.45 11.51 21.98 4.34 19.48 Uroova 1995-96 50.20 11.20 22.34 14.44 14.19 17.15 7.89 22.39 1990-91 60.38 19.31 20.24 17.72 11.79 21.61 5.34 19.63 Meja 1995-96 50.41 11.25 22.46 13.17 12.86 18.53 9.17 23.84 1990-91 59.72 19.37 20.02 17.78 12.33 22.08 5.56 18.82 Koraon 1995-96 49.07 11.78 21.63 12.74 14.47 16.66 9.40 24.40 1990-91 59.98 19.46 20.11 17.85 12.11 21.69 5.47 19.71 Manda 1995-96 48.63 11.02 21.39 13.72 15.03 18.12 9.59 23.17 1990-91 60.44 19.63 20.27 18.02 11.77 21.77 5.30 19.73 Rural 1995-96 59.46 17.76 19.82 17.18 12.18 22.41 6.31 22.96 1990-91 58.94 12.90 19.76 11.82 14.36 32.13 4.94 19.95 Urban 1995-96 43.18 7.91 36.87 24.61 9.55 16.68 7.42 24.93 1990-91 60.40 19.52 20.25 17.91 11.84 21.95 5.29 19.74 Total District 1995-96 59.23 17.64 20.06 17.26 12.14 22.35 6.32 22.98
Contd...
38
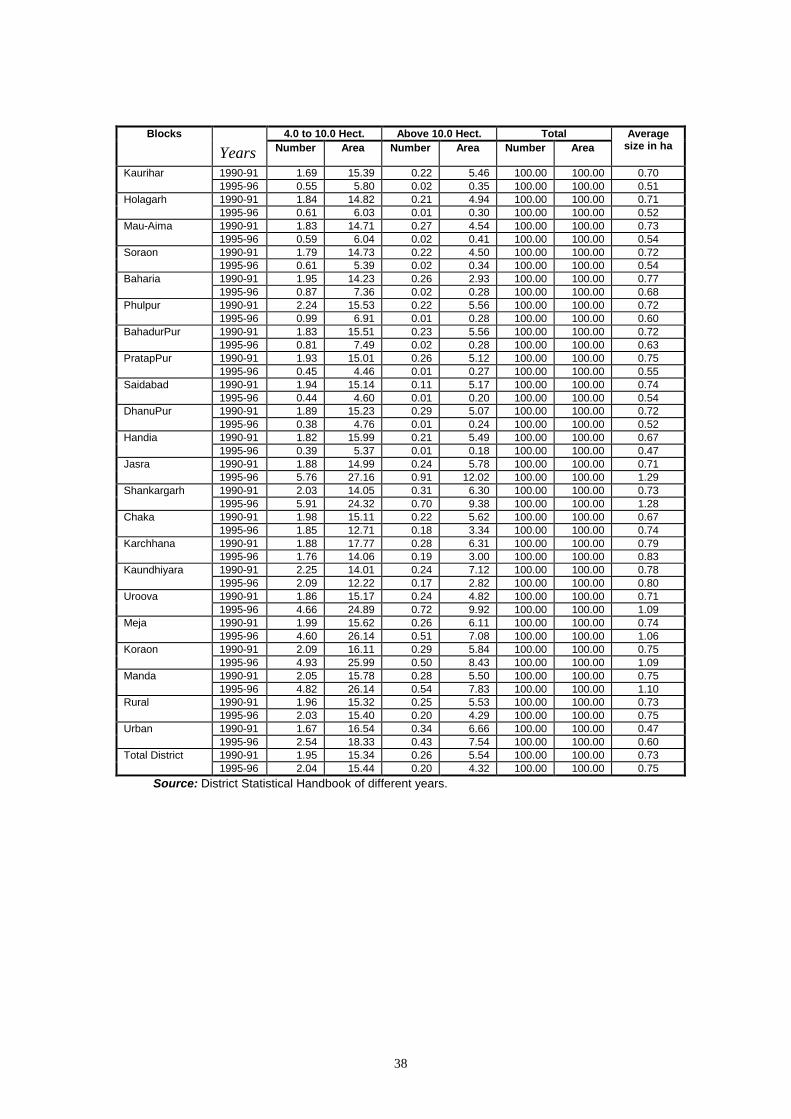
4.0 to 10.0 Hect. Above 10.0 Hect. Total Blocks
Years Number Area Number Area Number Area Average
size in ha
1990-91 1.69 15.39 0.22 5.46 100.00 100.00 0.70 Kaurihar 1995-96 0.55 5.80 0.02 0.35 100.00 100.00 0.51 1990-91 1.84 14.82 0.21 4.94 100.00 100.00 0.71 Holagarh 1995-96 0.61 6.03 0.01 0.30 100.00 100.00 0.52 1990-91 1.83 14.71 0.27 4.54 100.00 100.00 0.73 Mau-Aima 1995-96 0.59 6.04 0.02 0.41 100.00 100.00 0.54 1990-91 1.79 14.73 0.22 4.50 100.00 100.00 0.72 Soraon 1995-96 0.61 5.39 0.02 0.34 100.00 100.00 0.54 1990-91 1.95 14.23 0.26 2.93 100.00 100.00 0.77 Baharia 1995-96 0.87 7.36 0.02 0.28 100.00 100.00 0.68 1990-91 2.24 15.53 0.22 5.56 100.00 100.00 0.72 Phulpur 1995-96 0.99 6.91 0.01 0.28 100.00 100.00 0.60 1990-91 1.83 15.51 0.23 5.56 100.00 100.00 0.72 BahadurPur 1995-96 0.81 7.49 0.02 0.28 100.00 100.00 0.63 1990-91 1.93 15.01 0.26 5.12 100.00 100.00 0.75 PratapPur 1995-96 0.45 4.46 0.01 0.27 100.00 100.00 0.55 1990-91 1.94 15.14 0.11 5.17 100.00 100.00 0.74 Saidabad 1995-96 0.44 4.60 0.01 0.20 100.00 100.00 0.54 1990-91 1.89 15.23 0.29 5.07 100.00 100.00 0.72 DhanuPur 1995-96 0.38 4.76 0.01 0.24 100.00 100.00 0.52 1990-91 1.82 15.99 0.21 5.49 100.00 100.00 0.67 Handia 1995-96 0.39 5.37 0.01 0.18 100.00 100.00 0.47 1990-91 1.88 14.99 0.24 5.78 100.00 100.00 0.71 Jasra 1995-96 5.76 27.16 0.91 12.02 100.00 100.00 1.29 1990-91 2.03 14.05 0.31 6.30 100.00 100.00 0.73 Shankargarh 1995-96 5.91 24.32 0.70 9.38 100.00 100.00 1.28 1990-91 1.98 15.11 0.22 5.62 100.00 100.00 0.67 Chaka 1995-96 1.85 12.71 0.18 3.34 100.00 100.00 0.74 1990-91 1.88 17.77 0.28 6.31 100.00 100.00 0.79 Karchhana 1995-96 1.76 14.06 0.19 3.00 100.00 100.00 0.83 1990-91 2.25 14.01 0.24 7.12 100.00 100.00 0.78 Kaundhiyara 1995-96 2.09 12.22 0.17 2.82 100.00 100.00 0.80 1990-91 1.86 15.17 0.24 4.82 100.00 100.00 0.71 Uroova 1995-96 4.66 24.89 0.72 9.92 100.00 100.00 1.09 1990-91 1.99 15.62 0.26 6.11 100.00 100.00 0.74 Meja 1995-96 4.60 26.14 0.51 7.08 100.00 100.00 1.06 1990-91 2.09 16.11 0.29 5.84 100.00 100.00 0.75 Koraon 1995-96 4.93 25.99 0.50 8.43 100.00 100.00 1.09 1990-91 2.05 15.78 0.28 5.50 100.00 100.00 0.75 Manda 1995-96 4.82 26.14 0.54 7.83 100.00 100.00 1.10 1990-91 1.96 15.32 0.25 5.53 100.00 100.00 0.73 Rural 1995-96 2.03 15.40 0.20 4.29 100.00 100.00 0.75 1990-91 1.67 16.54 0.34 6.66 100.00 100.00 0.47 Urban 1995-96 2.54 18.33 0.43 7.54 100.00 100.00 0.60 1990-91 1.95 15.34 0.26 5.54 100.00 100.00 0.73 Total District 1995-96 2.04 15.44 0.20 4.32 100.00 100.00 0.75
Source: District Statistical Handbook of different years.
39
Chapter – 3
PART - A Land Use Related to Agriculture
3.1 Net Sown Area When we discuss about land use, agriculture finds the dominant place in various categories
of land use. This is true of Allahabad district as well. The proportion of net sown area in the district
varied around 63 per cent to 65 per cent during 1960-61 to 1994-95. But the net sown area as
percentage of total reporting area increased to above 67 per cent in 2000 (See table 3.1). This is
so, because the blocks which have remained with Allahabad district had higher proportion of net
sown area.
But the net sown area as per cent of total reporting area varied among different blocks of
the district. Blocks where proportion of net sown area was high (i.e. above 70 per cent) during 2000-
2K are Holagarh, Mau-Aima, Baharia, Phulpur, Pratappur, Saidabad, Dhanupur, Karchhana,
Kaundhiara and Koraon. Except Koraon, in the these blocks, net sown area has remained stagnant
within the range of 2 per cent to 3 per cent around their present level.
Blocks with medium share of net sown area (i.e. between 60 per cent to 70 per cent) are
Soraon, Bahadurpur, Jasra, Uroowa and Meja. Except Meja, all these blocks had attained high level
of share of net sown area (i.e. above 70.0 per cent) in the past. That is in future, they could easily
exhibit high level of net sown area.
There are also some blocks where net sown area as percentage of total reporting area was
low (i.e. less than 60.0 per cent). These included Kaurihar, Shankargarh, Chaka and Manda.
3.2 Cropping Intensity In agriculture, the land use has another characteristic also. The same land could be
cultivated more than once in a year. The cropping intensity thus shows the proportion of gross sown
area as percentage of net sown area. The cropping intensity of the Allahabad district had increased
since 1960-61, slowly during the period 1960-61 to 1996-97. Thus it has increased from 126.09 in
1960-61 to 143.8 in 1996-97. Thereafter it increased to 157.30 in 2000-01.
Block-wise analysis of cropping intensity during 2000-01 shows that cropping intensity was
on the lower side (i.e. below 150) in following blocks – Kaurihar (148.6), Phulpur (145.99),
Bahadurpur (140.32), Jasra (143.22), Shankargarh (141.22), Chaka (127.66), Karchhana (135.64),
Uroowa (134.8) and Meja (135.23).
Blocks where cropping intensity was in the medium range (i.e. between 15.0-170) include
following blocks. Baharia (153.50), Dhanupur (162.17), Handia (160.6) and Kaundhiara (165.64).
40
Only five blocks had shown high cropping intensity (i.e. above 170). These included
Holagarh (200.84), Mau-Aima (197.14), Soraon (178.24) Koraon (176.45) and Manda (186.44).
The blocks of Allahabad district witnessed wide fluctuations in cropping intensity over period
of last twenty years. Those block where cropping intensity was found to be on the lower side had
also moderate cropping intensity i.e. around 150 to 170 at some period of time in the past, and they
may achieve those levels of cropping intensity in future also without making much effort. But
cropping intensity in these blocks could be increased to high levels i.e. around 180 and above only if
some efforts are made in this context.
The most important factor which has effected cropping intensity is irrigation.
3.3 Irrigation The Allahabad district had long back shifted from rain-fed farming to irrigation farming. The
irrigation intensity i.e. net irrigated area as percentage of net sown area has increased from 23.16
per cent in 1990-91 to 71.31 per cent in 2000-01. This trend was discernible in all the blocks of the
district as well. The irrigation intensity was reported to be very high i.e. above 90.0 per cent in two
blocks namely Holagarh (95.45 per cent) and Mau-Aima (96.87 per cent) during 2000-01, and low in
Shankargarh block (See table 3.1 and 3.1.2).
3.4 Gross Irrigated Area as Percentage of Net Irrigated Area Furthermore, gross irrigated area as percentage of net irrigated area has also increased
during the last twenty five years from around 115.46 in 1980-81 to around 162.8 in 2000-01 (See
table 3.1 and 3.1.3).
Block-wise analysis of gross irrigated area as percentage of net irrigated area is shown in
table 3.1.4. We can categories the blocks in three groups. In the first category we put those blocks
where gross irrigated area as percent of net irrigated area was high (i.e. above 180), these include
Holagarh, Mau-Aima, Soraon and Koraon.
In the medium category those blocks are included where gross irrigated area as percentage
of net irrigated area was between 160 to 180. The blocks included in this category are Bahaira,
Pratappur, Saidabad, Dhanupur, Handia and Kaundhiara.
The blocks where gross irrigated area as percentage of net irrigated area was low (i.e. less
than 160) are: Kaurihar, Phulpur, Bahadurpur, Jasra, Shankargarh, Chaka, Karchana, Uroowa, and
Meja.
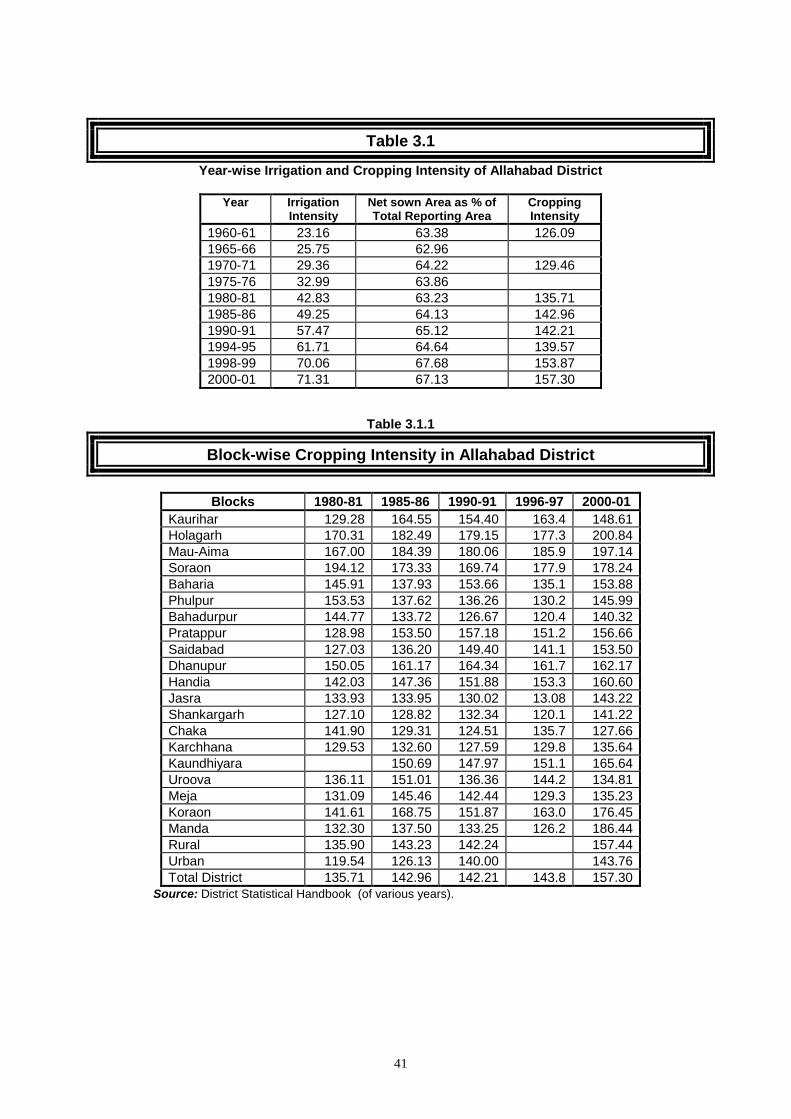
41
Table 3.1
Year-wise Irrigation and Cropping Intensity of Allahabad District
Year Irrigation Intensity
Net sown Area as % of Total Reporting Area
Cropping Intensity
1960-61 23.16 63.38 126.09 1965-66 25.75 62.96 1970-71 29.36 64.22 129.46 1975-76 32.99 63.86 1980-81 42.83 63.23 135.71 1985-86 49.25 64.13 142.96 1990-91 57.47 65.12 142.21 1994-95 61.71 64.64 139.57 1998-99 70.06 67.68 153.87 2000-01 71.31 67.13 157.30
Table 3.1.1
Block-wise Cropping Intensity in Allahabad District
Blocks 1980-81 1985-86 1990-91 1996-97 2000-01
Kaurihar 129.28 164.55 154.40 163.4 148.61 Holagarh 170.31 182.49 179.15 177.3 200.84 Mau-Aima 167.00 184.39 180.06 185.9 197.14 Soraon 194.12 173.33 169.74 177.9 178.24 Baharia 145.91 137.93 153.66 135.1 153.88 Phulpur 153.53 137.62 136.26 130.2 145.99 Bahadurpur 144.77 133.72 126.67 120.4 140.32 Pratappur 128.98 153.50 157.18 151.2 156.66 Saidabad 127.03 136.20 149.40 141.1 153.50 Dhanupur 150.05 161.17 164.34 161.7 162.17 Handia 142.03 147.36 151.88 153.3 160.60 Jasra 133.93 133.95 130.02 13.08 143.22 Shankargarh 127.10 128.82 132.34 120.1 141.22 Chaka 141.90 129.31 124.51 135.7 127.66 Karchhana 129.53 132.60 127.59 129.8 135.64 Kaundhiyara 150.69 147.97 151.1 165.64 Uroova 136.11 151.01 136.36 144.2 134.81 Meja 131.09 145.46 142.44 129.3 135.23 Koraon 141.61 168.75 151.87 163.0 176.45 Manda 132.30 137.50 133.25 126.2 186.44 Rural 135.90 143.23 142.24 157.44 Urban 119.54 126.13 140.00 143.76 Total District 135.71 142.96 142.21 143.8 157.30
Source: District Statistical Handbook (of various years).
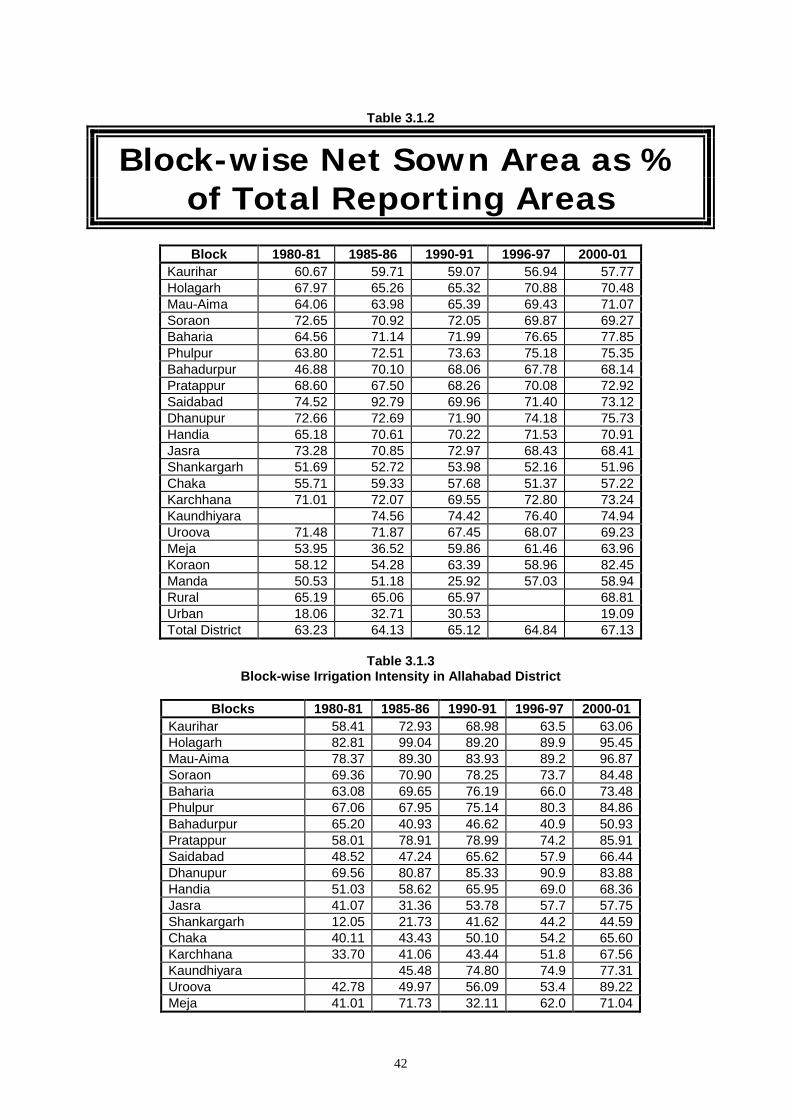
42
Table 3.1.2
Block-wise Net Sown Area as % of Total Reporting Areas
Block 1980-81 1985-86 1990-91 1996-97 2000-01
Kaurihar 60.67 59.71 59.07 56.94 57.77 Holagarh 67.97 65.26 65.32 70.88 70.48 Mau-Aima 64.06 63.98 65.39 69.43 71.07 Soraon 72.65 70.92 72.05 69.87 69.27 Baharia 64.56 71.14 71.99 76.65 77.85 Phulpur 63.80 72.51 73.63 75.18 75.35 Bahadurpur 46.88 70.10 68.06 67.78 68.14 Pratappur 68.60 67.50 68.26 70.08 72.92 Saidabad 74.52 92.79 69.96 71.40 73.12 Dhanupur 72.66 72.69 71.90 74.18 75.73 Handia 65.18 70.61 70.22 71.53 70.91 Jasra 73.28 70.85 72.97 68.43 68.41 Shankargarh 51.69 52.72 53.98 52.16 51.96 Chaka 55.71 59.33 57.68 51.37 57.22 Karchhana 71.01 72.07 69.55 72.80 73.24 Kaundhiyara 74.56 74.42 76.40 74.94 Uroova 71.48 71.87 67.45 68.07 69.23 Meja 53.95 36.52 59.86 61.46 63.96 Koraon 58.12 54.28 63.39 58.96 82.45 Manda 50.53 51.18 25.92 57.03 58.94 Rural 65.19 65.06 65.97 68.81 Urban 18.06 32.71 30.53 19.09 Total District 63.23 64.13 65.12 64.84 67.13
Table 3.1.3
Block-wise Irrigation Intensity in Allahabad District
Blocks 1980-81 1985-86 1990-91 1996-97 2000-01 Kaurihar 58.41 72.93 68.98 63.5 63.06 Holagarh 82.81 99.04 89.20 89.9 95.45 Mau-Aima 78.37 89.30 83.93 89.2 96.87 Soraon 69.36 70.90 78.25 73.7 84.48 Baharia 63.08 69.65 76.19 66.0 73.48 Phulpur 67.06 67.95 75.14 80.3 84.86 Bahadurpur 65.20 40.93 46.62 40.9 50.93 Pratappur 58.01 78.91 78.99 74.2 85.91 Saidabad 48.52 47.24 65.62 57.9 66.44 Dhanupur 69.56 80.87 85.33 90.9 83.88 Handia 51.03 58.62 65.95 69.0 68.36 Jasra 41.07 31.36 53.78 57.7 57.75 Shankargarh 12.05 21.73 41.62 44.2 44.59 Chaka 40.11 43.43 50.10 54.2 65.60 Karchhana 33.70 41.06 43.44 51.8 67.56 Kaundhiyara 45.48 74.80 74.9 77.31 Uroova 42.78 49.97 56.09 53.4 89.22 Meja 41.01 71.73 32.11 62.0 71.04
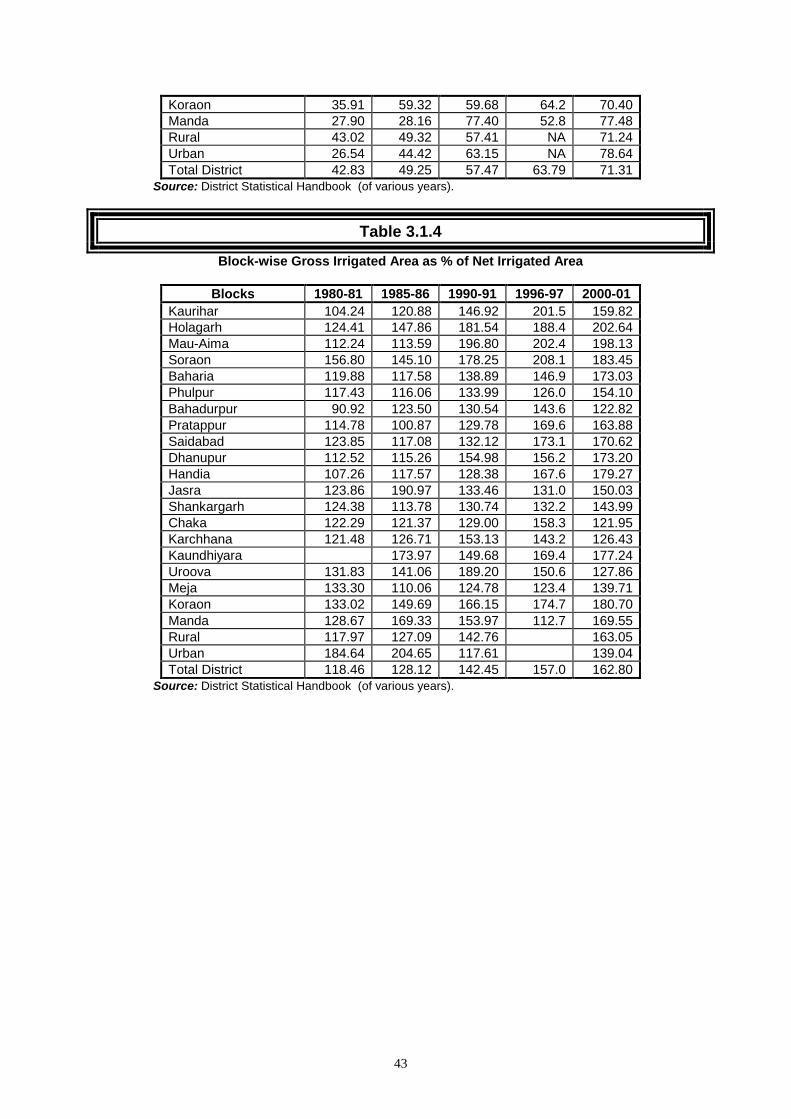
43
Koraon 35.91 59.32 59.68 64.2 70.40 Manda 27.90 28.16 77.40 52.8 77.48 Rural 43.02 49.32 57.41 NA 71.24 Urban 26.54 44.42 63.15 NA 78.64 Total District 42.83 49.25 57.47 63.79 71.31
Source: District Statistical Handbook (of various years).
Table 3.1.4
Block-wise Gross Irrigated Area as % of Net Irrigated Area
Blocks 1980-81 1985-86 1990-91 1996-97 2000-01 Kaurihar 104.24 120.88 146.92 201.5 159.82 Holagarh 124.41 147.86 181.54 188.4 202.64 Mau-Aima 112.24 113.59 196.80 202.4 198.13 Soraon 156.80 145.10 178.25 208.1 183.45 Baharia 119.88 117.58 138.89 146.9 173.03 Phulpur 117.43 116.06 133.99 126.0 154.10 Bahadurpur 90.92 123.50 130.54 143.6 122.82 Pratappur 114.78 100.87 129.78 169.6 163.88 Saidabad 123.85 117.08 132.12 173.1 170.62 Dhanupur 112.52 115.26 154.98 156.2 173.20 Handia 107.26 117.57 128.38 167.6 179.27 Jasra 123.86 190.97 133.46 131.0 150.03 Shankargarh 124.38 113.78 130.74 132.2 143.99 Chaka 122.29 121.37 129.00 158.3 121.95 Karchhana 121.48 126.71 153.13 143.2 126.43 Kaundhiyara 173.97 149.68 169.4 177.24 Uroova 131.83 141.06 189.20 150.6 127.86 Meja 133.30 110.06 124.78 123.4 139.71 Koraon 133.02 149.69 166.15 174.7 180.70 Manda 128.67 169.33 153.97 112.7 169.55 Rural 117.97 127.09 142.76 163.05 Urban 184.64 204.65 117.61 139.04 Total District 118.46 128.12 142.45 157.0 162.80
Source: District Statistical Handbook (of various years).
44
3.5 Source of Irrigation If we analyse the sources of irrigation in Allahabad district, we can witness three distinct
phases during the period of year 1960-61 to year 2000-01.
The first phase covers the period 1960-61 to 1969-70. This is the phase when traditional
sources of irrigation continued to be significant. Canals and tubewells together covered less than 50
per cent of net irrigated area. The fact that other wells accounted for irrigation of more than 50 per
cent of net irrigated area during this phase showed continuing importance of traditional sources of
irrigation during this phase.
The next phase covers a long period of 1970-71 to around 1995-96. In this phase, area
irrigated through traditional sources declined very fast, specially after 1975-76. The area irrigated
through canals increased from around 25 per cent to around 45 per cent, and the area irrigated
through tubewells increased from around 25 per cent to around 50 per cent. In this phase
contribution of canals and tubewells was almost same.
The third phase could be said to have started since 1997-98. In this phase, the contribution
of canals increased. Tubewell irrigation is now showing a declining trend (See table 3.2).
Block-wise analysis of sources of irrigation shows that there were only some blocks where
canal still accounted for more than 60 per cent of net irrigated area in 2000-01 (See table 3.2.1).
These are Holagarh (82.02 per cent), Mau-Aima (64.5 per cent), Jasra (80.64 per cent),
Shankargarh (84.37 per cent), Kaundhiara (80.38 per cent), Meja (88.96 per cent), Koraon (96.45
per cent) and Manda (84.09 per cent). On the other hand there are many blocks where tubewell is
the dominant source of irrigation. These include Kaurihar, Baharia, Phulpur, Bahadurpur, Saidabad,
Dhanupur, Handia, Chaka, Karchhana and Uroowa.
There is another aspect of analysis of sources of irrigation. Though tubewells have become
dominant source of many blocks, the role of public sources continues to be very important is some
of them. Because canals and government tubewells together account for more than 50 per cent of
net irrigated area in most of the blocks. That means, public investment in irrigation will continue to
play an important role in increasing gross irrigated area, which in turn would help in increasing the
cropping intensity in these blocks.
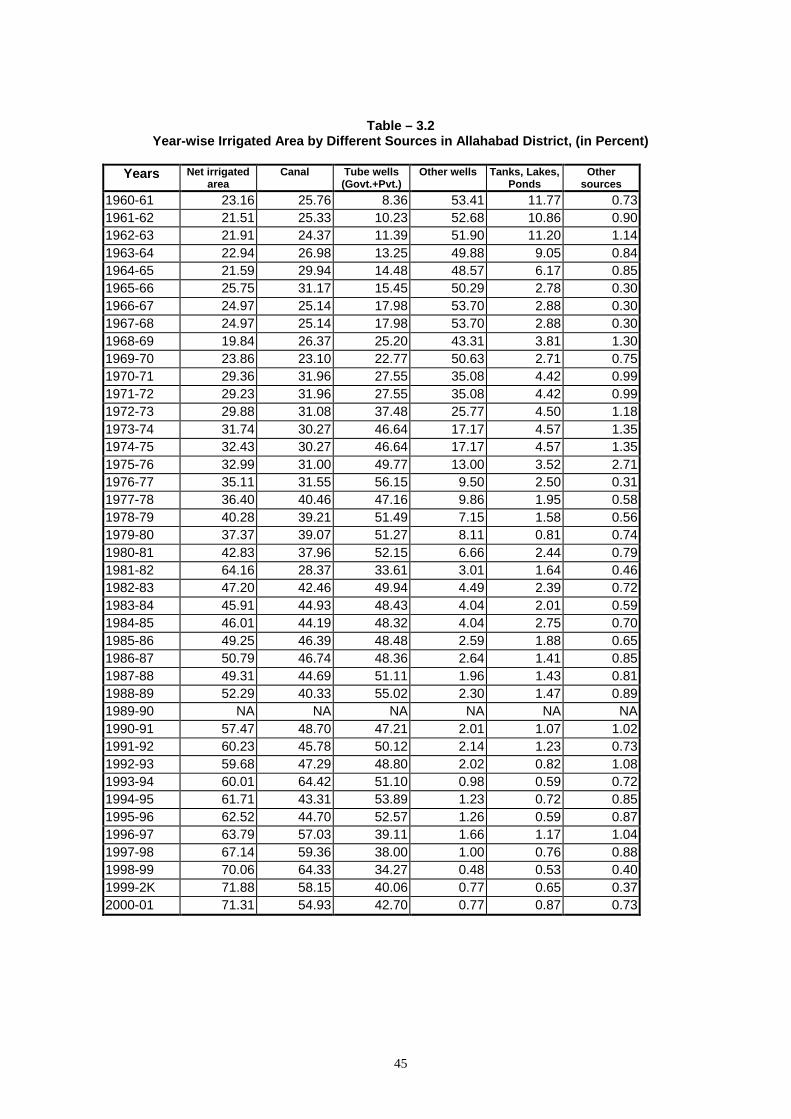
45
Table – 3.2 Year-wise Irrigated Area by Different Sources in Allahabad District, (in Percent)
Years Net irrigated
area Canal Tube wells
(Govt.+Pvt.) Other wells Tanks, Lakes,
Ponds Other
sources 1960-61 23.16 25.76 8.36 53.41 11.77 0.73 1961-62 21.51 25.33 10.23 52.68 10.86 0.90 1962-63 21.91 24.37 11.39 51.90 11.20 1.14 1963-64 22.94 26.98 13.25 49.88 9.05 0.84 1964-65 21.59 29.94 14.48 48.57 6.17 0.85 1965-66 25.75 31.17 15.45 50.29 2.78 0.30 1966-67 24.97 25.14 17.98 53.70 2.88 0.30 1967-68 24.97 25.14 17.98 53.70 2.88 0.30 1968-69 19.84 26.37 25.20 43.31 3.81 1.30 1969-70 23.86 23.10 22.77 50.63 2.71 0.75 1970-71 29.36 31.96 27.55 35.08 4.42 0.99 1971-72 29.23 31.96 27.55 35.08 4.42 0.99 1972-73 29.88 31.08 37.48 25.77 4.50 1.18 1973-74 31.74 30.27 46.64 17.17 4.57 1.35 1974-75 32.43 30.27 46.64 17.17 4.57 1.35 1975-76 32.99 31.00 49.77 13.00 3.52 2.71 1976-77 35.11 31.55 56.15 9.50 2.50 0.31 1977-78 36.40 40.46 47.16 9.86 1.95 0.58 1978-79 40.28 39.21 51.49 7.15 1.58 0.56 1979-80 37.37 39.07 51.27 8.11 0.81 0.74 1980-81 42.83 37.96 52.15 6.66 2.44 0.79 1981-82 64.16 28.37 33.61 3.01 1.64 0.46 1982-83 47.20 42.46 49.94 4.49 2.39 0.72 1983-84 45.91 44.93 48.43 4.04 2.01 0.59 1984-85 46.01 44.19 48.32 4.04 2.75 0.70 1985-86 49.25 46.39 48.48 2.59 1.88 0.65 1986-87 50.79 46.74 48.36 2.64 1.41 0.85 1987-88 49.31 44.69 51.11 1.96 1.43 0.81 1988-89 52.29 40.33 55.02 2.30 1.47 0.89 1989-90 NA NA NA NA NA NA 1990-91 57.47 48.70 47.21 2.01 1.07 1.02 1991-92 60.23 45.78 50.12 2.14 1.23 0.73 1992-93 59.68 47.29 48.80 2.02 0.82 1.08 1993-94 60.01 64.42 51.10 0.98 0.59 0.72 1994-95 61.71 43.31 53.89 1.23 0.72 0.85 1995-96 62.52 44.70 52.57 1.26 0.59 0.87 1996-97 63.79 57.03 39.11 1.66 1.17 1.04 1997-98 67.14 59.36 38.00 1.00 0.76 0.88 1998-99 70.06 64.33 34.27 0.48 0.53 0.40 1999-2K 71.88 58.15 40.06 0.77 0.65 0.37 2000-01 71.31 54.93 42.70 0.77 0.87 0.73
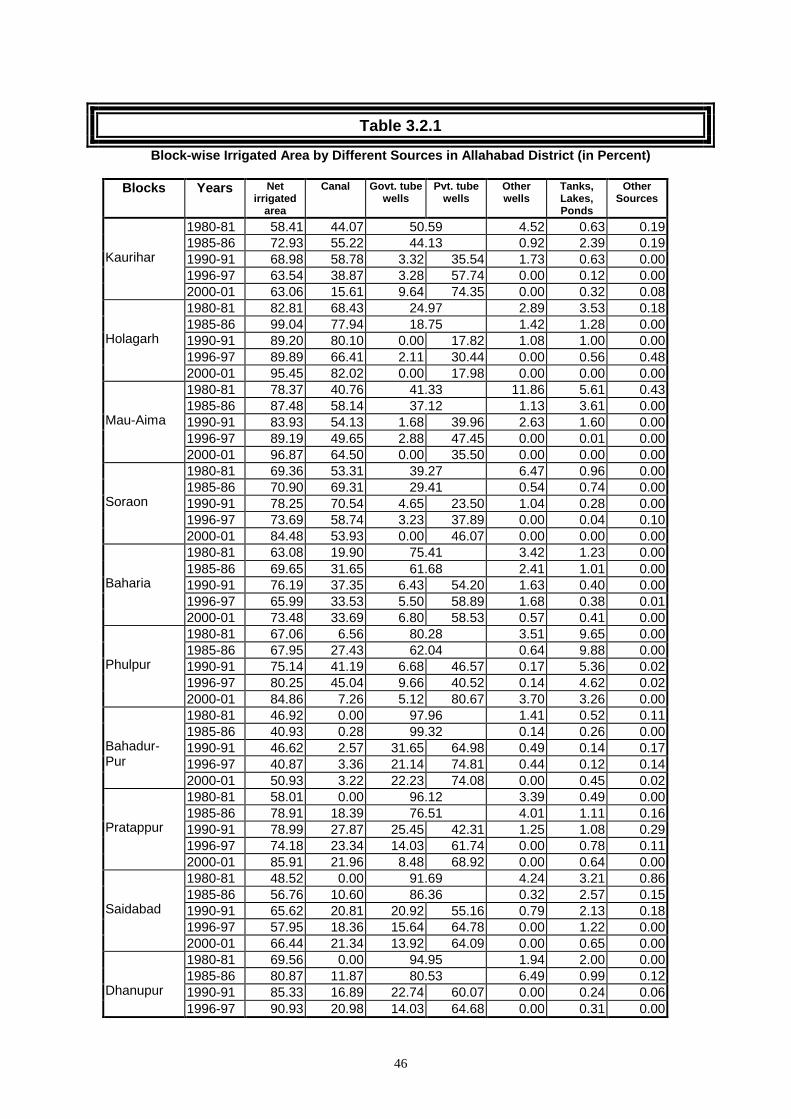
46
Table 3.2.1
Block-wise Irrigated Area by Different Sources in Allahabad District (in Percent)
Blocks Years Net irrigated
area
Canal Govt. tube wells
Pvt. tube wells
Other wells
Tanks, Lakes, Ponds
Other Sources
1980-81 58.41 44.07 50.59 4.52 0.63 0.191985-86 72.93 55.22 44.13 0.92 2.39 0.191990-91 68.98 58.78 3.32 35.54 1.73 0.63 0.001996-97 63.54 38.87 3.28 57.74 0.00 0.12 0.00
Kaurihar
2000-01 63.06 15.61 9.64 74.35 0.00 0.32 0.081980-81 82.81 68.43 24.97 2.89 3.53 0.181985-86 99.04 77.94 18.75 1.42 1.28 0.001990-91 89.20 80.10 0.00 17.82 1.08 1.00 0.001996-97 89.89 66.41 2.11 30.44 0.00 0.56 0.48
Holagarh
2000-01 95.45 82.02 0.00 17.98 0.00 0.00 0.001980-81 78.37 40.76 41.33 11.86 5.61 0.431985-86 87.48 58.14 37.12 1.13 3.61 0.001990-91 83.93 54.13 1.68 39.96 2.63 1.60 0.001996-97 89.19 49.65 2.88 47.45 0.00 0.01 0.00
Mau-Aima
2000-01 96.87 64.50 0.00 35.50 0.00 0.00 0.001980-81 69.36 53.31 39.27 6.47 0.96 0.001985-86 70.90 69.31 29.41 0.54 0.74 0.001990-91 78.25 70.54 4.65 23.50 1.04 0.28 0.001996-97 73.69 58.74 3.23 37.89 0.00 0.04 0.10
Soraon
2000-01 84.48 53.93 0.00 46.07 0.00 0.00 0.001980-81 63.08 19.90 75.41 3.42 1.23 0.001985-86 69.65 31.65 61.68 2.41 1.01 0.001990-91 76.19 37.35 6.43 54.20 1.63 0.40 0.001996-97 65.99 33.53 5.50 58.89 1.68 0.38 0.01
Baharia
2000-01 73.48 33.69 6.80 58.53 0.57 0.41 0.001980-81 67.06 6.56 80.28 3.51 9.65 0.001985-86 67.95 27.43 62.04 0.64 9.88 0.001990-91 75.14 41.19 6.68 46.57 0.17 5.36 0.021996-97 80.25 45.04 9.66 40.52 0.14 4.62 0.02
Phulpur
2000-01 84.86 7.26 5.12 80.67 3.70 3.26 0.001980-81 46.92 0.00 97.96 1.41 0.52 0.111985-86 40.93 0.28 99.32 0.14 0.26 0.001990-91 46.62 2.57 31.65 64.98 0.49 0.14 0.171996-97 40.87 3.36 21.14 74.81 0.44 0.12 0.14
Bahadur- Pur
2000-01 50.93 3.22 22.23 74.08 0.00 0.45 0.021980-81 58.01 0.00 96.12 3.39 0.49 0.001985-86 78.91 18.39 76.51 4.01 1.11 0.161990-91 78.99 27.87 25.45 42.31 1.25 1.08 0.291996-97 74.18 23.34 14.03 61.74 0.00 0.78 0.11
Pratappur
2000-01 85.91 21.96 8.48 68.92 0.00 0.64 0.001980-81 48.52 0.00 91.69 4.24 3.21 0.861985-86 56.76 10.60 86.36 0.32 2.57 0.151990-91 65.62 20.81 20.92 55.16 0.79 2.13 0.181996-97 57.95 18.36 15.64 64.78 0.00 1.22 0.00
Saidabad
2000-01 66.44 21.34 13.92 64.09 0.00 0.65 0.001980-81 69.56 0.00 94.95 1.94 2.00 0.001985-86 80.87 11.87 80.53 6.49 0.99 0.121990-91 85.33 16.89 22.74 60.07 0.00 0.24 0.06
Dhanupur
1996-97 90.93 20.98 14.03 64.68 0.00 0.31 0.00
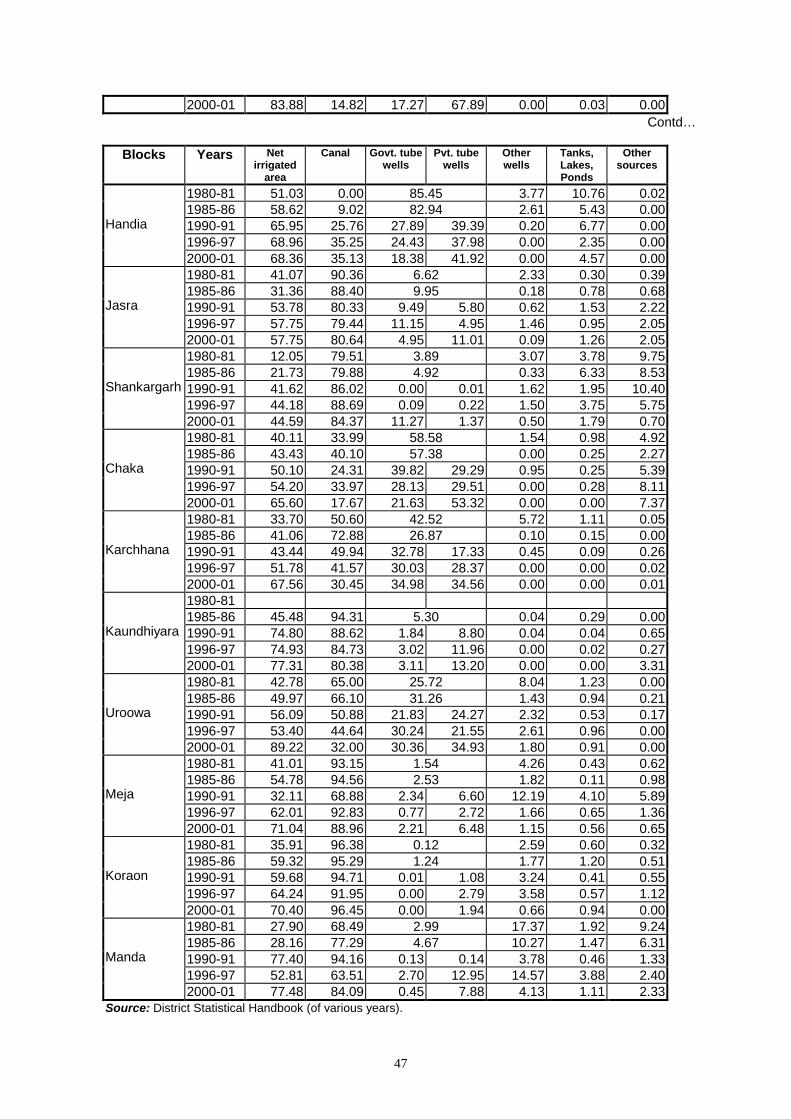
47
2000-01 83.88 14.82 17.27 67.89 0.00 0.03 0.00Contd…
Blocks Years Net
irrigated area
Canal Govt. tube wells
Pvt. tube wells
Other wells
Tanks, Lakes, Ponds
Other sources
1980-81 51.03 0.00 85.45 3.77 10.76 0.021985-86 58.62 9.02 82.94 2.61 5.43 0.001990-91 65.95 25.76 27.89 39.39 0.20 6.77 0.001996-97 68.96 35.25 24.43 37.98 0.00 2.35 0.00
Handia
2000-01 68.36 35.13 18.38 41.92 0.00 4.57 0.001980-81 41.07 90.36 6.62 2.33 0.30 0.391985-86 31.36 88.40 9.95 0.18 0.78 0.681990-91 53.78 80.33 9.49 5.80 0.62 1.53 2.221996-97 57.75 79.44 11.15 4.95 1.46 0.95 2.05
Jasra
2000-01 57.75 80.64 4.95 11.01 0.09 1.26 2.051980-81 12.05 79.51 3.89 3.07 3.78 9.751985-86 21.73 79.88 4.92 0.33 6.33 8.531990-91 41.62 86.02 0.00 0.01 1.62 1.95 10.401996-97 44.18 88.69 0.09 0.22 1.50 3.75 5.75
Shankargarh
2000-01 44.59 84.37 11.27 1.37 0.50 1.79 0.701980-81 40.11 33.99 58.58 1.54 0.98 4.921985-86 43.43 40.10 57.38 0.00 0.25 2.271990-91 50.10 24.31 39.82 29.29 0.95 0.25 5.391996-97 54.20 33.97 28.13 29.51 0.00 0.28 8.11
Chaka
2000-01 65.60 17.67 21.63 53.32 0.00 0.00 7.371980-81 33.70 50.60 42.52 5.72 1.11 0.051985-86 41.06 72.88 26.87 0.10 0.15 0.001990-91 43.44 49.94 32.78 17.33 0.45 0.09 0.261996-97 51.78 41.57 30.03 28.37 0.00 0.00 0.02
Karchhana
2000-01 67.56 30.45 34.98 34.56 0.00 0.00 0.011980-81 1985-86 45.48 94.31 5.30 0.04 0.29 0.001990-91 74.80 88.62 1.84 8.80 0.04 0.04 0.651996-97 74.93 84.73 3.02 11.96 0.00 0.02 0.27
Kaundhiyara
2000-01 77.31 80.38 3.11 13.20 0.00 0.00 3.311980-81 42.78 65.00 25.72 8.04 1.23 0.001985-86 49.97 66.10 31.26 1.43 0.94 0.211990-91 56.09 50.88 21.83 24.27 2.32 0.53 0.171996-97 53.40 44.64 30.24 21.55 2.61 0.96 0.00
Uroowa
2000-01 89.22 32.00 30.36 34.93 1.80 0.91 0.001980-81 41.01 93.15 1.54 4.26 0.43 0.621985-86 54.78 94.56 2.53 1.82 0.11 0.981990-91 32.11 68.88 2.34 6.60 12.19 4.10 5.891996-97 62.01 92.83 0.77 2.72 1.66 0.65 1.36
Meja
2000-01 71.04 88.96 2.21 6.48 1.15 0.56 0.651980-81 35.91 96.38 0.12 2.59 0.60 0.321985-86 59.32 95.29 1.24 1.77 1.20 0.511990-91 59.68 94.71 0.01 1.08 3.24 0.41 0.551996-97 64.24 91.95 0.00 2.79 3.58 0.57 1.12
Koraon
2000-01 70.40 96.45 0.00 1.94 0.66 0.94 0.001980-81 27.90 68.49 2.99 17.37 1.92 9.241985-86 28.16 77.29 4.67 10.27 1.47 6.311990-91 77.40 94.16 0.13 0.14 3.78 0.46 1.331996-97 52.81 63.51 2.70 12.95 14.57 3.88 2.40
Manda
2000-01 77.48 84.09 0.45 7.88 4.13 1.11 2.33Source: District Statistical Handbook (of various years).
48
3.6 Cropping Pattern The cropping pattern in the district has vastly changed during the last 30 years (See table
3.3). The only crop which continues to be important during all these years is paddy. Area under
paddy cultivation increased from around 30.7 per cent of net sown area in 1960-61 to around 57.06
per cent during 2000-01. Area under wheat cultivation increased from 11.60 per cent in 1960-61 to
57.31 per cent of net sown area in 2000-01. But area under different coarse grains declined during
this period, for example area under barley declined from 18.7 per cent to 2.87 per cent, gram
cultivation declined from 20.7 per cent to 10.07 per cent, and peas cultivation declined from 6.84 per
cent to 1.76 per cent during 1960-61 to 2000-01.
Besides wheat and paddy, other crop whose area under cultivation increased is potato. The
area under potato increased from around 0.90 per cent in 1960-61 to 3.36 per cent in 2000-01.
The main crops viz. paddy, wheat, and potato and sugarcane have witnessed very large
increases in their productivity also during the period 1960-61 to 1998-99 (See table 3.3.1). If we
analyse other factor namely productivity, we find that area under cultivation has increased in case of
only those crops, whose productivity has also increased significantly. The productivity of paddy
increased from 6.85 qt./ha in 1960-61 to 18.30 qt./ha in 2000-01. The productivity of wheat
increased from 8.72 qt./ha in 1960-61 to 22.70 qt./ha in 2000-01. As regards cash crops, the
productivity of potato increased from 51.88 qt./ha in 1960-61 to 204.72 qt./ha in 2000-01.
And these are the very crops, which are almost cent percent irrigated.
Thus, farmers have shifted to crops, which are highly irrigated, fertilizer use is higher on
them and whose productivity is also comparatively very high.
We need to make efforts to increase production of more pluses, oilseeds and spices.
Cropping rotation also needs to be changed. Following steps are imperative to achieve it.
(a) More thrust be given for developing high yielding varieties of pulses, oil seeds and
spices.
(b) Rain fed areas should be encouraged to cultivate these crops.
(c) Orchards, fallow land and land under social forestry could be used for growing such
crops.
(d) Processing industries of oilseeds and spices be promoted at local level with support for
technology up gradation, packaging and market access facilities.
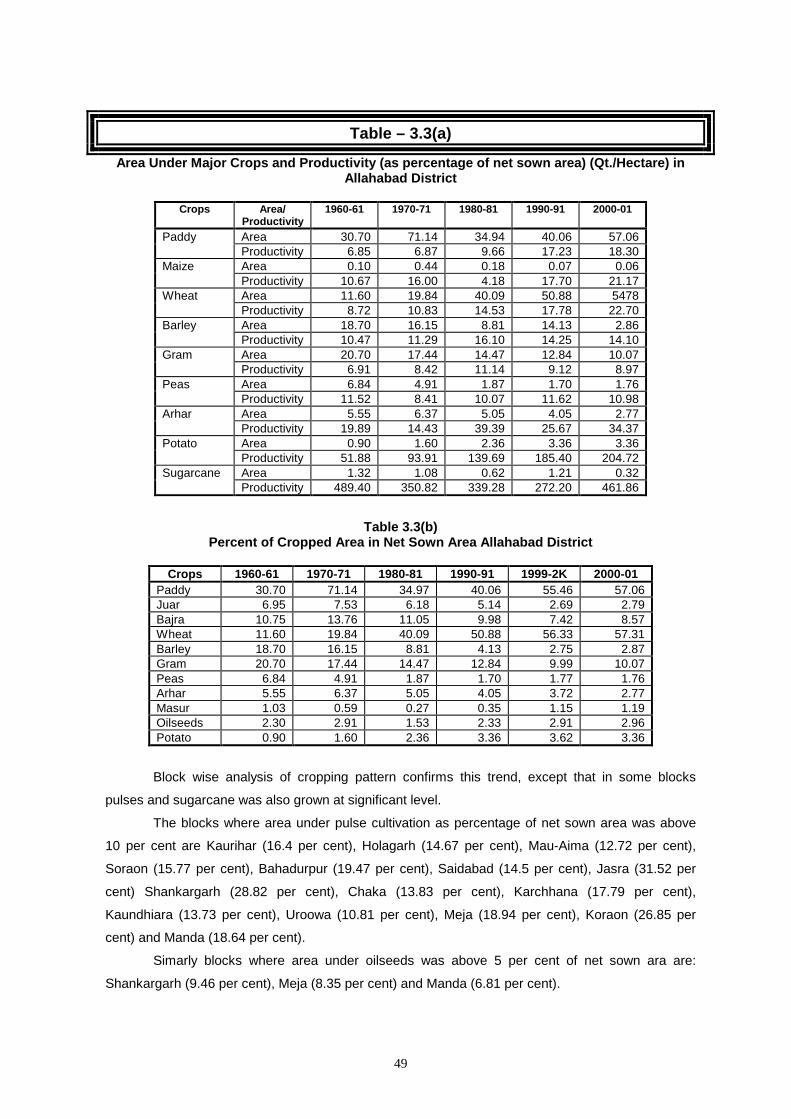
49
Table – 3.3(a)
Area Under Major Crops and Productivity (as percentage of net sown area) (Qt./Hectare) in Allahabad District
Crops Area/
Productivity 1960-61 1970-71 1980-81 1990-91 2000-01
Area 30.70 71.14 34.94 40.06 57.06 Paddy Productivity 6.85 6.87 9.66 17.23 18.30 Area 0.10 0.44 0.18 0.07 0.06 Maize Productivity 10.67 16.00 4.18 17.70 21.17 Area 11.60 19.84 40.09 50.88 5478 Wheat Productivity 8.72 10.83 14.53 17.78 22.70 Area 18.70 16.15 8.81 14.13 2.86 Barley Productivity 10.47 11.29 16.10 14.25 14.10 Area 20.70 17.44 14.47 12.84 10.07 Gram Productivity 6.91 8.42 11.14 9.12 8.97 Area 6.84 4.91 1.87 1.70 1.76 Peas Productivity 11.52 8.41 10.07 11.62 10.98 Area 5.55 6.37 5.05 4.05 2.77 Arhar Productivity 19.89 14.43 39.39 25.67 34.37 Area 0.90 1.60 2.36 3.36 3.36 Potato Productivity 51.88 93.91 139.69 185.40 204.72 Area 1.32 1.08 0.62 1.21 0.32 Sugarcane Productivity 489.40 350.82 339.28 272.20 461.86
Table 3.3(b) Percent of Cropped Area in Net Sown Area Allahabad District
Crops 1960-61 1970-71 1980-81 1990-91 1999-2K 2000-01
Paddy 30.70 71.14 34.97 40.06 55.46 57.06 Juar 6.95 7.53 6.18 5.14 2.69 2.79 Bajra 10.75 13.76 11.05 9.98 7.42 8.57 Wheat 11.60 19.84 40.09 50.88 56.33 57.31 Barley 18.70 16.15 8.81 4.13 2.75 2.87 Gram 20.70 17.44 14.47 12.84 9.99 10.07 Peas 6.84 4.91 1.87 1.70 1.77 1.76 Arhar 5.55 6.37 5.05 4.05 3.72 2.77 Masur 1.03 0.59 0.27 0.35 1.15 1.19 Oilseeds 2.30 2.91 1.53 2.33 2.91 2.96 Potato 0.90 1.60 2.36 3.36 3.62 3.36
Block wise analysis of cropping pattern confirms this trend, except that in some blocks
pulses and sugarcane was also grown at significant level.
The blocks where area under pulse cultivation as percentage of net sown area was above
10 per cent are Kaurihar (16.4 per cent), Holagarh (14.67 per cent), Mau-Aima (12.72 per cent),
Soraon (15.77 per cent), Bahadurpur (19.47 per cent), Saidabad (14.5 per cent), Jasra (31.52 per
cent) Shankargarh (28.82 per cent), Chaka (13.83 per cent), Karchhana (17.79 per cent),
Kaundhiara (13.73 per cent), Uroowa (10.81 per cent), Meja (18.94 per cent), Koraon (26.85 per
cent) and Manda (18.64 per cent).
Simarly blocks where area under oilseeds was above 5 per cent of net sown ara are:
Shankargarh (9.46 per cent), Meja (8.35 per cent) and Manda (6.81 per cent).
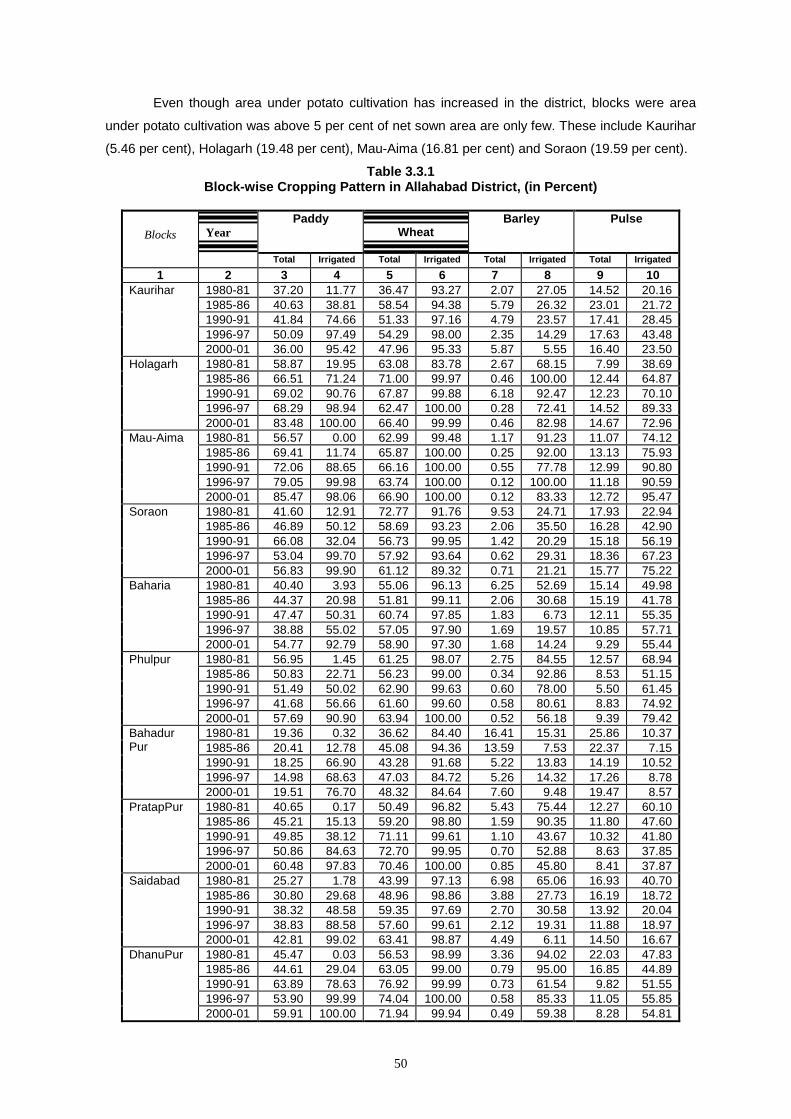
50
Even though area under potato cultivation has increased in the district, blocks were area
under potato cultivation was above 5 per cent of net sown area are only few. These include Kaurihar
(5.46 per cent), Holagarh (19.48 per cent), Mau-Aima (16.81 per cent) and Soraon (19.59 per cent).
Table 3.3.1 Block-wise Cropping Pattern in Allahabad District, (in Percent)
Paddy
Wheat Barley Pulse
Blocks Year
Total Irrigated Total Irrigated Total Irrigated Total Irrigated
1 2 3 4 5 6 7 8 9 10 1980-81 37.20 11.77 36.47 93.27 2.07 27.05 14.52 20.161985-86 40.63 38.81 58.54 94.38 5.79 26.32 23.01 21.721990-91 41.84 74.66 51.33 97.16 4.79 23.57 17.41 28.451996-97 50.09 97.49 54.29 98.00 2.35 14.29 17.63 43.48
Kaurihar
2000-01 36.00 95.42 47.96 95.33 5.87 5.55 16.40 23.501980-81 58.87 19.95 63.08 83.78 2.67 68.15 7.99 38.691985-86 66.51 71.24 71.00 99.97 0.46 100.00 12.44 64.871990-91 69.02 90.76 67.87 99.88 6.18 92.47 12.23 70.101996-97 68.29 98.94 62.47 100.00 0.28 72.41 14.52 89.33
Holagarh
2000-01 83.48 100.00 66.40 99.99 0.46 82.98 14.67 72.961980-81 56.57 0.00 62.99 99.48 1.17 91.23 11.07 74.121985-86 69.41 11.74 65.87 100.00 0.25 92.00 13.13 75.931990-91 72.06 88.65 66.16 100.00 0.55 77.78 12.99 90.801996-97 79.05 99.98 63.74 100.00 0.12 100.00 11.18 90.59
Mau-Aima
2000-01 85.47 98.06 66.90 100.00 0.12 83.33 12.72 95.471980-81 41.60 12.91 72.77 91.76 9.53 24.71 17.93 22.941985-86 46.89 50.12 58.69 93.23 2.06 35.50 16.28 42.901990-91 66.08 32.04 56.73 99.95 1.42 20.29 15.18 56.191996-97 53.04 99.70 57.92 93.64 0.62 29.31 18.36 67.23
Soraon
2000-01 56.83 99.90 61.12 89.32 0.71 21.21 15.77 75.221980-81 40.40 3.93 55.06 96.13 6.25 52.69 15.14 49.981985-86 44.37 20.98 51.81 99.11 2.06 30.68 15.19 41.781990-91 47.47 50.31 60.74 97.85 1.83 6.73 12.11 55.351996-97 38.88 55.02 57.05 97.90 1.69 19.57 10.85 57.71
Baharia
2000-01 54.77 92.79 58.90 97.30 1.68 14.24 9.29 55.441980-81 56.95 1.45 61.25 98.07 2.75 84.55 12.57 68.941985-86 50.83 22.71 56.23 99.00 0.34 92.86 8.53 51.151990-91 51.49 50.02 62.90 99.63 0.60 78.00 5.50 61.451996-97 41.68 56.66 61.60 99.60 0.58 80.61 8.83 74.92
Phulpur
2000-01 57.69 90.90 63.94 100.00 0.52 56.18 9.39 79.421980-81 19.36 0.32 36.62 84.40 16.41 15.31 25.86 10.371985-86 20.41 12.78 45.08 94.36 13.59 7.53 22.37 7.151990-91 18.25 66.90 43.28 91.68 5.22 13.83 14.19 10.521996-97 14.98 68.63 47.03 84.72 5.26 14.32 17.26 8.78
Bahadur Pur
2000-01 19.51 76.70 48.32 84.64 7.60 9.48 19.47 8.571980-81 40.65 0.17 50.49 96.82 5.43 75.44 12.27 60.101985-86 45.21 15.13 59.20 98.80 1.59 90.35 11.80 47.601990-91 49.85 38.12 71.11 99.61 1.10 43.67 10.32 41.801996-97 50.86 84.63 72.70 99.95 0.70 52.88 8.63 37.85
PratapPur
2000-01 60.48 97.83 70.46 100.00 0.85 45.80 8.41 37.871980-81 25.27 1.78 43.99 97.13 6.98 65.06 16.93 40.701985-86 30.80 29.68 48.96 98.86 3.88 27.73 16.19 18.721990-91 38.32 48.58 59.35 97.69 2.70 30.58 13.92 20.041996-97 38.83 88.58 57.60 99.61 2.12 19.31 11.88 18.97
Saidabad
2000-01 42.81 99.02 63.41 98.87 4.49 6.11 14.50 16.671980-81 45.47 0.03 56.53 98.99 3.36 94.02 22.03 47.831985-86 44.61 29.04 63.05 99.00 0.79 95.00 16.85 44.891990-91 63.89 78.63 76.92 99.99 0.73 61.54 9.82 51.551996-97 53.90 99.99 74.04 100.00 0.58 85.33 11.05 55.85
DhanuPur
2000-01 59.91 100.00 71.94 99.94 0.49 59.38 8.28 54.81
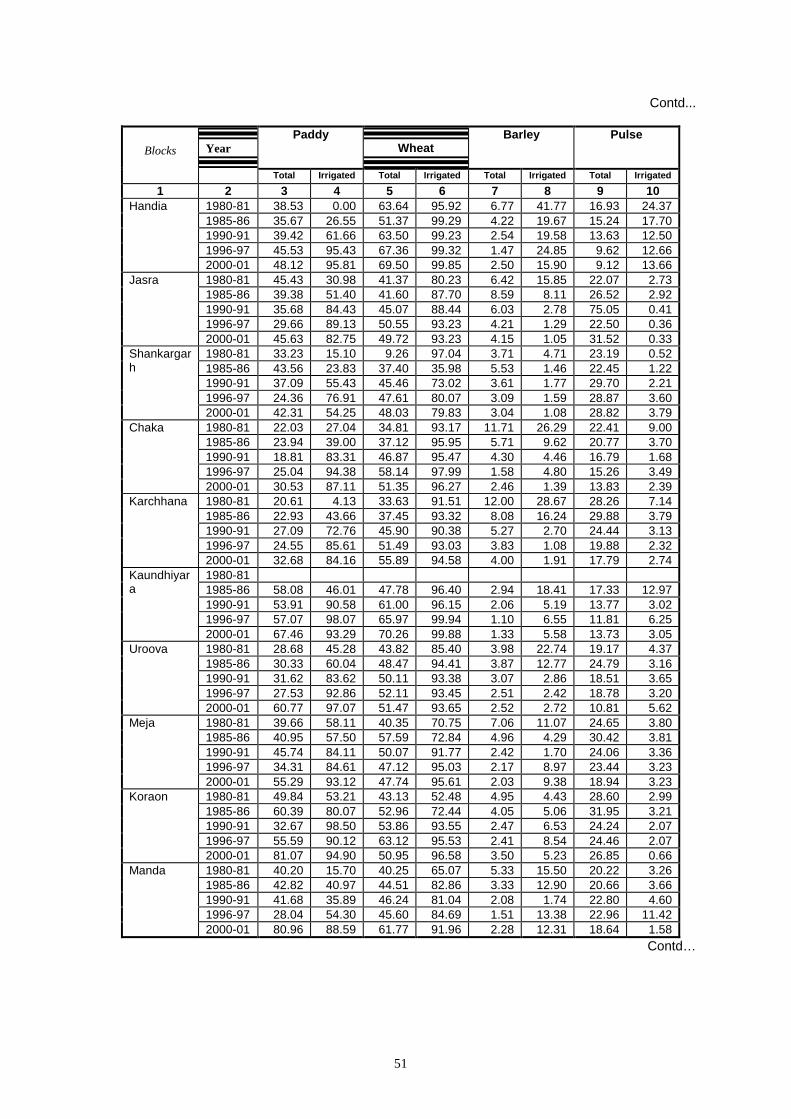
51
Contd...
Paddy Wheat
Barley Pulse Blocks Year
Total Irrigated Total Irrigated Total Irrigated Total Irrigated
1 2 3 4 5 6 7 8 9 10 1980-81 38.53 0.00 63.64 95.92 6.77 41.77 16.93 24.371985-86 35.67 26.55 51.37 99.29 4.22 19.67 15.24 17.701990-91 39.42 61.66 63.50 99.23 2.54 19.58 13.63 12.501996-97 45.53 95.43 67.36 99.32 1.47 24.85 9.62 12.66
Handia
2000-01 48.12 95.81 69.50 99.85 2.50 15.90 9.12 13.661980-81 45.43 30.98 41.37 80.23 6.42 15.85 22.07 2.731985-86 39.38 51.40 41.60 87.70 8.59 8.11 26.52 2.921990-91 35.68 84.43 45.07 88.44 6.03 2.78 75.05 0.411996-97 29.66 89.13 50.55 93.23 4.21 1.29 22.50 0.36
Jasra
2000-01 45.63 82.75 49.72 93.23 4.15 1.05 31.52 0.331980-81 33.23 15.10 9.26 97.04 3.71 4.71 23.19 0.521985-86 43.56 23.83 37.40 35.98 5.53 1.46 22.45 1.221990-91 37.09 55.43 45.46 73.02 3.61 1.77 29.70 2.211996-97 24.36 76.91 47.61 80.07 3.09 1.59 28.87 3.60
Shankargarh
2000-01 42.31 54.25 48.03 79.83 3.04 1.08 28.82 3.791980-81 22.03 27.04 34.81 93.17 11.71 26.29 22.41 9.001985-86 23.94 39.00 37.12 95.95 5.71 9.62 20.77 3.701990-91 18.81 83.31 46.87 95.47 4.30 4.46 16.79 1.681996-97 25.04 94.38 58.14 97.99 1.58 4.80 15.26 3.49
Chaka
2000-01 30.53 87.11 51.35 96.27 2.46 1.39 13.83 2.391980-81 20.61 4.13 33.63 91.51 12.00 28.67 28.26 7.141985-86 22.93 43.66 37.45 93.32 8.08 16.24 29.88 3.791990-91 27.09 72.76 45.90 90.38 5.27 2.70 24.44 3.131996-97 24.55 85.61 51.49 93.03 3.83 1.08 19.88 2.32
Karchhana
2000-01 32.68 84.16 55.89 94.58 4.00 1.91 17.79 2.741980-81 1985-86 58.08 46.01 47.78 96.40 2.94 18.41 17.33 12.971990-91 53.91 90.58 61.00 96.15 2.06 5.19 13.77 3.021996-97 57.07 98.07 65.97 99.94 1.10 6.55 11.81 6.25
Kaundhiyara
2000-01 67.46 93.29 70.26 99.88 1.33 5.58 13.73 3.051980-81 28.68 45.28 43.82 85.40 3.98 22.74 19.17 4.371985-86 30.33 60.04 48.47 94.41 3.87 12.77 24.79 3.161990-91 31.62 83.62 50.11 93.38 3.07 2.86 18.51 3.651996-97 27.53 92.86 52.11 93.45 2.51 2.42 18.78 3.20
Uroova
2000-01 60.77 97.07 51.47 93.65 2.52 2.72 10.81 5.621980-81 39.66 58.11 40.35 70.75 7.06 11.07 24.65 3.801985-86 40.95 57.50 57.59 72.84 4.96 4.29 30.42 3.811990-91 45.74 84.11 50.07 91.77 2.42 1.70 24.06 3.361996-97 34.31 84.61 47.12 95.03 2.17 8.97 23.44 3.23
Meja
2000-01 55.29 93.12 47.74 95.61 2.03 9.38 18.94 3.231980-81 49.84 53.21 43.13 52.48 4.95 4.43 28.60 2.991985-86 60.39 80.07 52.96 72.44 4.05 5.06 31.95 3.211990-91 32.67 98.50 53.86 93.55 2.47 6.53 24.24 2.071996-97 55.59 90.12 63.12 95.53 2.41 8.54 24.46 2.07
Koraon
2000-01 81.07 94.90 50.95 96.58 3.50 5.23 26.85 0.661980-81 40.20 15.70 40.25 65.07 5.33 15.50 20.22 3.261985-86 42.82 40.97 44.51 82.86 3.33 12.90 20.66 3.661990-91 41.68 35.89 46.24 81.04 2.08 1.74 22.80 4.601996-97 28.04 54.30 45.60 84.69 1.51 13.38 22.96 11.42
Manda
2000-01 80.96 88.59 61.77 91.96 2.28 12.31 18.64 1.58Contd…
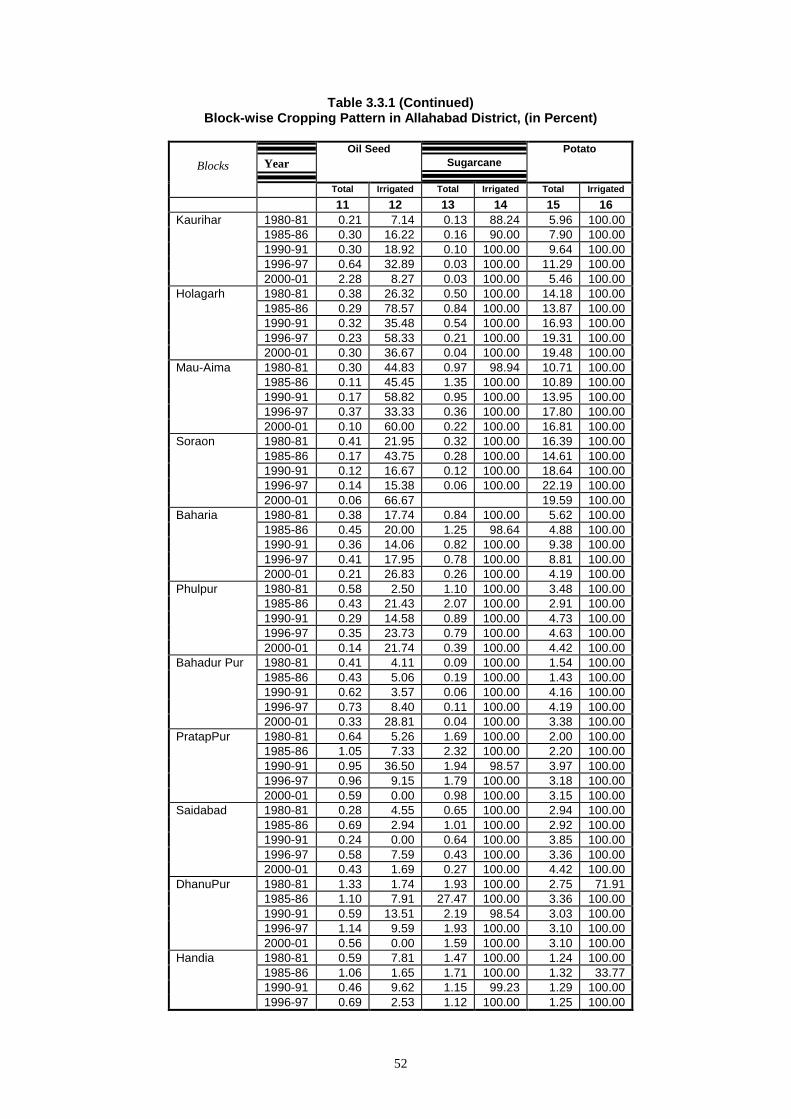
52
Table 3.3.1 (Continued) Block-wise Cropping Pattern in Allahabad District, (in Percent)
Oil Seed
Sugarcane Potato
Blocks Year
Total Irrigated Total Irrigated Total Irrigated
11 12 13 14 15 16 1980-81 0.21 7.14 0.13 88.24 5.96 100.00 1985-86 0.30 16.22 0.16 90.00 7.90 100.00 1990-91 0.30 18.92 0.10 100.00 9.64 100.00 1996-97 0.64 32.89 0.03 100.00 11.29 100.00
Kaurihar
2000-01 2.28 8.27 0.03 100.00 5.46 100.00 1980-81 0.38 26.32 0.50 100.00 14.18 100.00 1985-86 0.29 78.57 0.84 100.00 13.87 100.00 1990-91 0.32 35.48 0.54 100.00 16.93 100.00 1996-97 0.23 58.33 0.21 100.00 19.31 100.00
Holagarh
2000-01 0.30 36.67 0.04 100.00 19.48 100.00 1980-81 0.30 44.83 0.97 98.94 10.71 100.00 1985-86 0.11 45.45 1.35 100.00 10.89 100.00 1990-91 0.17 58.82 0.95 100.00 13.95 100.00 1996-97 0.37 33.33 0.36 100.00 17.80 100.00
Mau-Aima
2000-01 0.10 60.00 0.22 100.00 16.81 100.00 1980-81 0.41 21.95 0.32 100.00 16.39 100.00 1985-86 0.17 43.75 0.28 100.00 14.61 100.00 1990-91 0.12 16.67 0.12 100.00 18.64 100.00 1996-97 0.14 15.38 0.06 100.00 22.19 100.00
Soraon
2000-01 0.06 66.67 19.59 100.00 1980-81 0.38 17.74 0.84 100.00 5.62 100.00 1985-86 0.45 20.00 1.25 98.64 4.88 100.00 1990-91 0.36 14.06 0.82 100.00 9.38 100.00 1996-97 0.41 17.95 0.78 100.00 8.81 100.00
Baharia
2000-01 0.21 26.83 0.26 100.00 4.19 100.00 1980-81 0.58 2.50 1.10 100.00 3.48 100.00 1985-86 0.43 21.43 2.07 100.00 2.91 100.00 1990-91 0.29 14.58 0.89 100.00 4.73 100.00 1996-97 0.35 23.73 0.79 100.00 4.63 100.00
Phulpur
2000-01 0.14 21.74 0.39 100.00 4.42 100.00 1980-81 0.41 4.11 0.09 100.00 1.54 100.00 1985-86 0.43 5.06 0.19 100.00 1.43 100.00 1990-91 0.62 3.57 0.06 100.00 4.16 100.00 1996-97 0.73 8.40 0.11 100.00 4.19 100.00
Bahadur Pur
2000-01 0.33 28.81 0.04 100.00 3.38 100.00 1980-81 0.64 5.26 1.69 100.00 2.00 100.00 1985-86 1.05 7.33 2.32 100.00 2.20 100.00 1990-91 0.95 36.50 1.94 98.57 3.97 100.00 1996-97 0.96 9.15 1.79 100.00 3.18 100.00
PratapPur
2000-01 0.59 0.00 0.98 100.00 3.15 100.00 1980-81 0.28 4.55 0.65 100.00 2.94 100.00 1985-86 0.69 2.94 1.01 100.00 2.92 100.00 1990-91 0.24 0.00 0.64 100.00 3.85 100.00 1996-97 0.58 7.59 0.43 100.00 3.36 100.00
Saidabad
2000-01 0.43 1.69 0.27 100.00 4.42 100.00 1980-81 1.33 1.74 1.93 100.00 2.75 71.91 1985-86 1.10 7.91 27.47 100.00 3.36 100.00 1990-91 0.59 13.51 2.19 98.54 3.03 100.00 1996-97 1.14 9.59 1.93 100.00 3.10 100.00
DhanuPur
2000-01 0.56 0.00 1.59 100.00 3.10 100.00 1980-81 0.59 7.81 1.47 100.00 1.24 100.00 1985-86 1.06 1.65 1.71 100.00 1.32 33.77 1990-91 0.46 9.62 1.15 99.23 1.29 100.00
Handia
1996-97 0.69 2.53 1.12 100.00 1.25 100.00
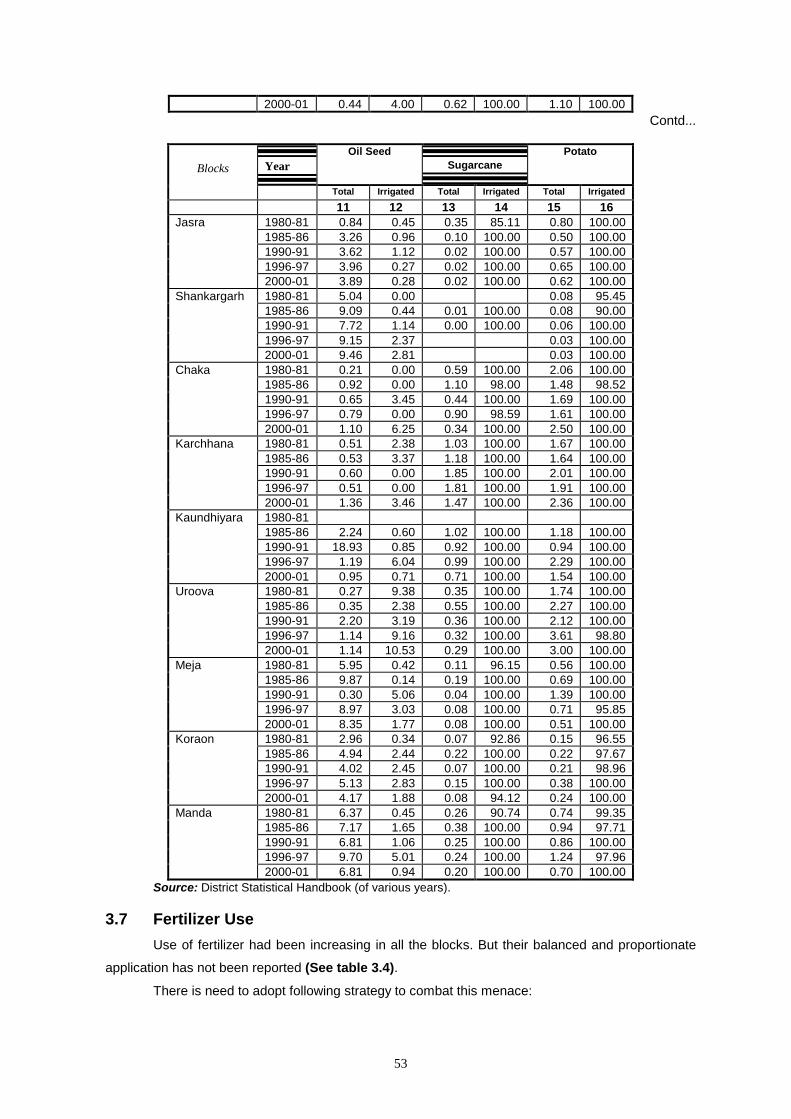
53
2000-01 0.44 4.00 0.62 100.00 1.10 100.00 Contd...
Oil Seed
Sugarcane Potato
Blocks Year
Total Irrigated Total Irrigated Total Irrigated
11 12 13 14 15 16 1980-81 0.84 0.45 0.35 85.11 0.80 100.00 1985-86 3.26 0.96 0.10 100.00 0.50 100.00 1990-91 3.62 1.12 0.02 100.00 0.57 100.00 1996-97 3.96 0.27 0.02 100.00 0.65 100.00
Jasra
2000-01 3.89 0.28 0.02 100.00 0.62 100.00 1980-81 5.04 0.00 0.08 95.45 1985-86 9.09 0.44 0.01 100.00 0.08 90.00 1990-91 7.72 1.14 0.00 100.00 0.06 100.00 1996-97 9.15 2.37 0.03 100.00
Shankargarh
2000-01 9.46 2.81 0.03 100.00 1980-81 0.21 0.00 0.59 100.00 2.06 100.00 1985-86 0.92 0.00 1.10 98.00 1.48 98.52 1990-91 0.65 3.45 0.44 100.00 1.69 100.00 1996-97 0.79 0.00 0.90 98.59 1.61 100.00
Chaka
2000-01 1.10 6.25 0.34 100.00 2.50 100.00 1980-81 0.51 2.38 1.03 100.00 1.67 100.00 1985-86 0.53 3.37 1.18 100.00 1.64 100.00 1990-91 0.60 0.00 1.85 100.00 2.01 100.00 1996-97 0.51 0.00 1.81 100.00 1.91 100.00
Karchhana
2000-01 1.36 3.46 1.47 100.00 2.36 100.00 1980-81 1985-86 2.24 0.60 1.02 100.00 1.18 100.00 1990-91 18.93 0.85 0.92 100.00 0.94 100.00 1996-97 1.19 6.04 0.99 100.00 2.29 100.00
Kaundhiyara
2000-01 0.95 0.71 0.71 100.00 1.54 100.00 1980-81 0.27 9.38 0.35 100.00 1.74 100.00 1985-86 0.35 2.38 0.55 100.00 2.27 100.00 1990-91 2.20 3.19 0.36 100.00 2.12 100.00 1996-97 1.14 9.16 0.32 100.00 3.61 98.80
Uroova
2000-01 1.14 10.53 0.29 100.00 3.00 100.00 1980-81 5.95 0.42 0.11 96.15 0.56 100.00 1985-86 9.87 0.14 0.19 100.00 0.69 100.00 1990-91 0.30 5.06 0.04 100.00 1.39 100.00 1996-97 8.97 3.03 0.08 100.00 0.71 95.85
Meja
2000-01 8.35 1.77 0.08 100.00 0.51 100.00 1980-81 2.96 0.34 0.07 92.86 0.15 96.55 1985-86 4.94 2.44 0.22 100.00 0.22 97.67 1990-91 4.02 2.45 0.07 100.00 0.21 98.96 1996-97 5.13 2.83 0.15 100.00 0.38 100.00
Koraon
2000-01 4.17 1.88 0.08 94.12 0.24 100.00 1980-81 6.37 0.45 0.26 90.74 0.74 99.35 1985-86 7.17 1.65 0.38 100.00 0.94 97.71 1990-91 6.81 1.06 0.25 100.00 0.86 100.00 1996-97 9.70 5.01 0.24 100.00 1.24 97.96
Manda
2000-01 6.81 0.94 0.20 100.00 0.70 100.00 Source: District Statistical Handbook (of various years).
3.7 Fertilizer Use Use of fertilizer had been increasing in all the blocks. But their balanced and proportionate
application has not been reported (See table 3.4).
There is need to adopt following strategy to combat this menace:
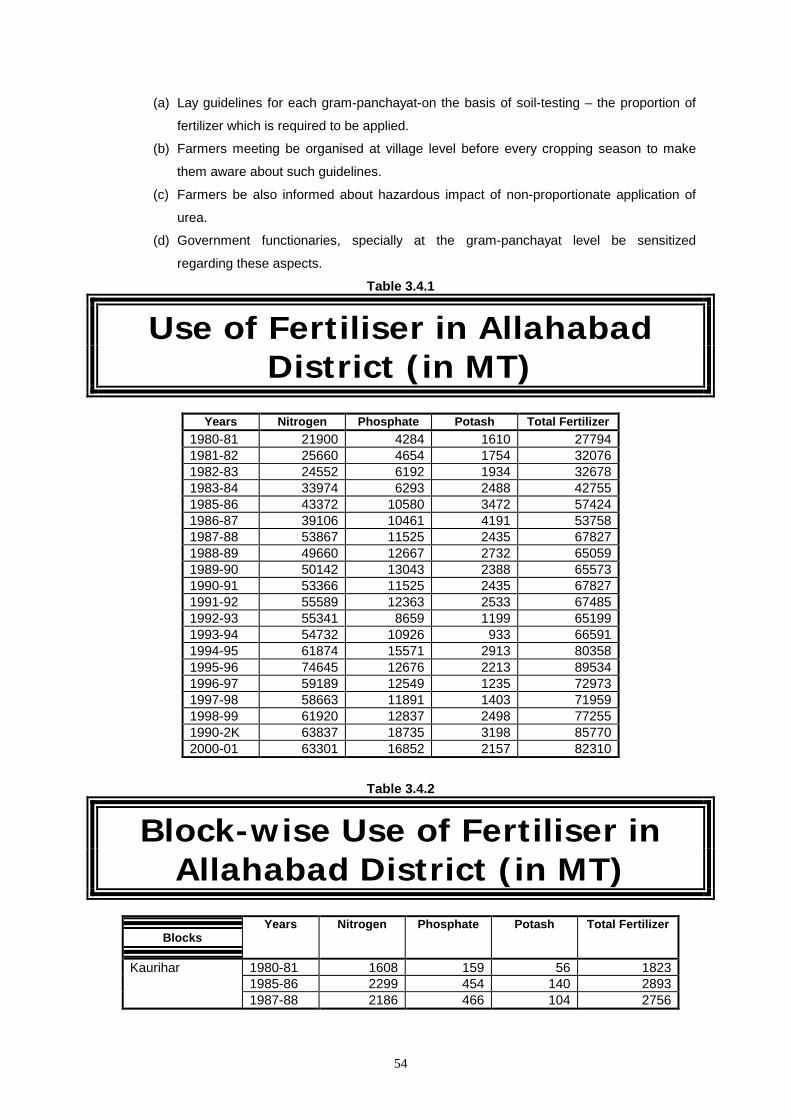
54
(a) Lay guidelines for each gram-panchayat-on the basis of soil-testing – the proportion of
fertilizer which is required to be applied.
(b) Farmers meeting be organised at village level before every cropping season to make
them aware about such guidelines.
(c) Farmers be also informed about hazardous impact of non-proportionate application of
urea.
(d) Government functionaries, specially at the gram-panchayat level be sensitized
regarding these aspects.
Table 3.4.1
Use of Fertiliser in Allahabad District (in MT)
Years Nitrogen Phosphate Potash Total Fertilizer
1980-81 21900 4284 1610 27794 1981-82 25660 4654 1754 32076 1982-83 24552 6192 1934 32678 1983-84 33974 6293 2488 42755 1985-86 43372 10580 3472 57424 1986-87 39106 10461 4191 53758 1987-88 53867 11525 2435 67827 1988-89 49660 12667 2732 65059 1989-90 50142 13043 2388 65573 1990-91 53366 11525 2435 67827 1991-92 55589 12363 2533 67485 1992-93 55341 8659 1199 65199 1993-94 54732 10926 933 66591 1994-95 61874 15571 2913 80358 1995-96 74645 12676 2213 89534 1996-97 59189 12549 1235 72973 1997-98 58663 11891 1403 71959 1998-99 61920 12837 2498 77255 1990-2K 63837 18735 3198 85770 2000-01 63301 16852 2157 82310
Table 3.4.2
Block-wise Use of Fertiliser in Allahabad District (in MT)
Blocks Years Nitrogen Phosphate Potash Total Fertilizer
1980-81 1608 159 56 18231985-86 2299 454 140 2893
Kaurihar
1987-88 2186 466 104 2756
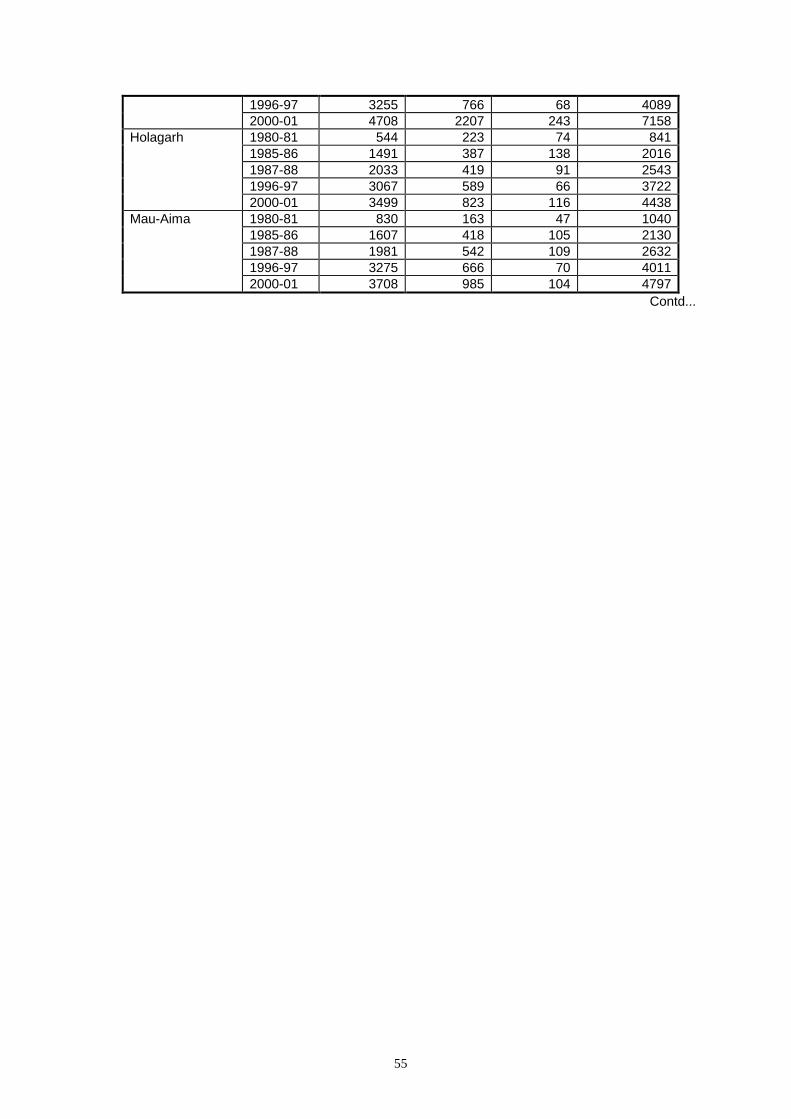
55
1996-97 3255 766 68 4089 2000-01 4708 2207 243 71581980-81 544 223 74 8411985-86 1491 387 138 20161987-88 2033 419 91 25431996-97 3067 589 66 3722
Holagarh
2000-01 3499 823 116 44381980-81 830 163 47 10401985-86 1607 418 105 21301987-88 1981 542 109 26321996-97 3275 666 70 4011
Mau-Aima
2000-01 3708 985 104 4797Contd...
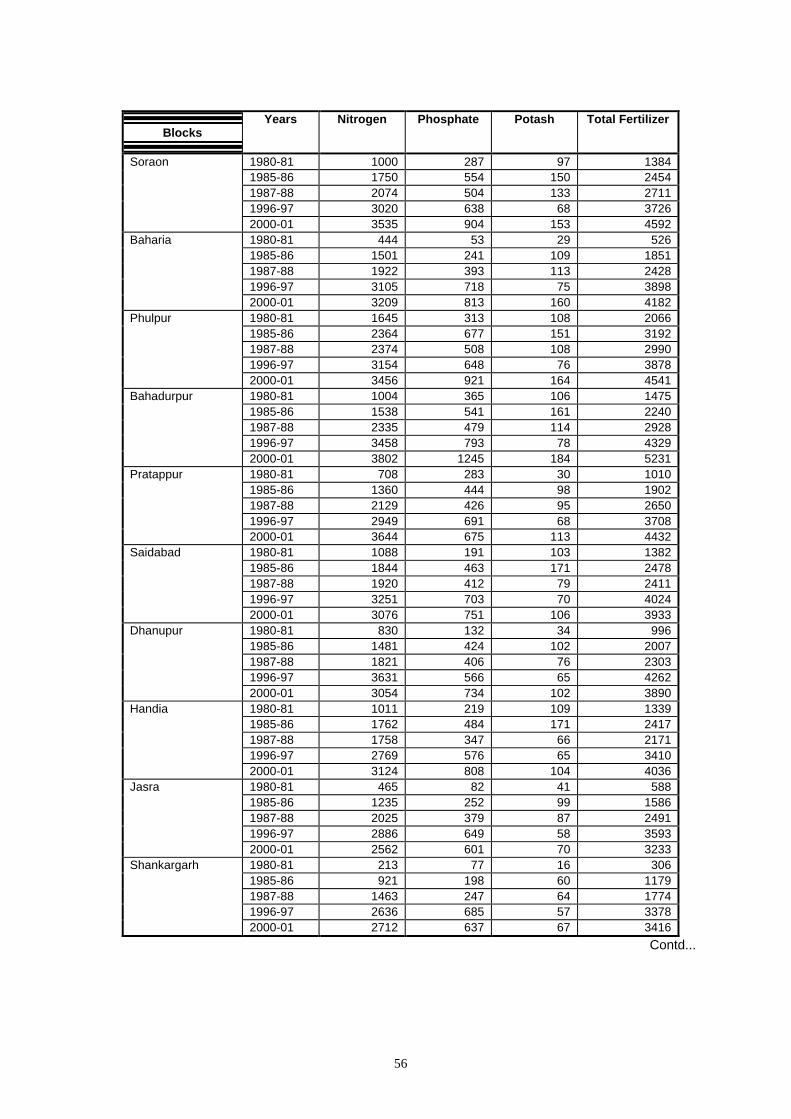
56
Blocks Years Nitrogen Phosphate Potash Total Fertilizer
1980-81 1000 287 97 13841985-86 1750 554 150 24541987-88 2074 504 133 27111996-97 3020 638 68 3726
Soraon
2000-01 3535 904 153 45921980-81 444 53 29 5261985-86 1501 241 109 18511987-88 1922 393 113 24281996-97 3105 718 75 3898
Baharia
2000-01 3209 813 160 41821980-81 1645 313 108 20661985-86 2364 677 151 31921987-88 2374 508 108 29901996-97 3154 648 76 3878
Phulpur
2000-01 3456 921 164 45411980-81 1004 365 106 14751985-86 1538 541 161 22401987-88 2335 479 114 29281996-97 3458 793 78 4329
Bahadurpur
2000-01 3802 1245 184 52311980-81 708 283 30 10101985-86 1360 444 98 19021987-88 2129 426 95 26501996-97 2949 691 68 3708
Pratappur
2000-01 3644 675 113 44321980-81 1088 191 103 13821985-86 1844 463 171 24781987-88 1920 412 79 24111996-97 3251 703 70 4024
Saidabad
2000-01 3076 751 106 39331980-81 830 132 34 9961985-86 1481 424 102 20071987-88 1821 406 76 23031996-97 3631 566 65 4262
Dhanupur
2000-01 3054 734 102 38901980-81 1011 219 109 13391985-86 1762 484 171 24171987-88 1758 347 66 21711996-97 2769 576 65 3410
Handia
2000-01 3124 808 104 40361980-81 465 82 41 5881985-86 1235 252 99 15861987-88 2025 379 87 24911996-97 2886 649 58 3593
Jasra
2000-01 2562 601 70 32331980-81 213 77 16 3061985-86 921 198 60 11791987-88 1463 247 64 17741996-97 2636 685 57 3378
Shankargarh
2000-01 2712 637 67 3416Contd...
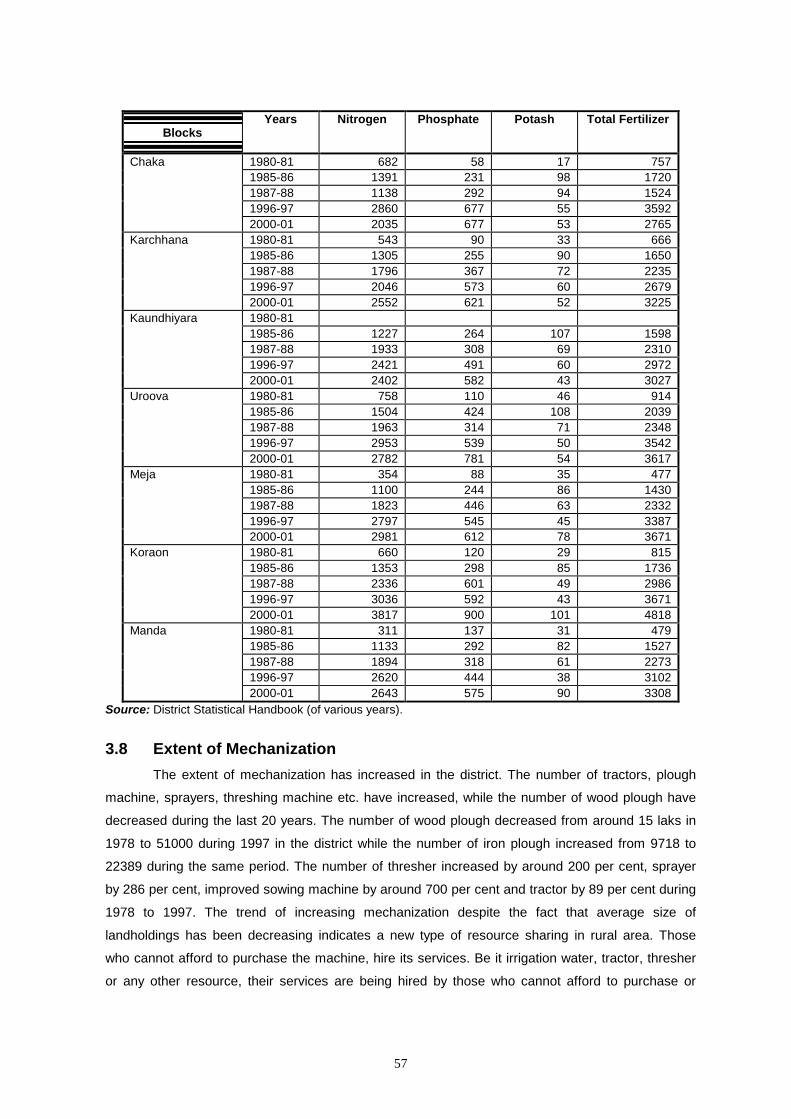
57
Blocks Years Nitrogen Phosphate Potash Total Fertilizer
1980-81 682 58 17 7571985-86 1391 231 98 17201987-88 1138 292 94 15241996-97 2860 677 55 3592
Chaka
2000-01 2035 677 53 27651980-81 543 90 33 6661985-86 1305 255 90 16501987-88 1796 367 72 22351996-97 2046 573 60 2679
Karchhana
2000-01 2552 621 52 32251980-81 1985-86 1227 264 107 15981987-88 1933 308 69 23101996-97 2421 491 60 2972
Kaundhiyara
2000-01 2402 582 43 30271980-81 758 110 46 9141985-86 1504 424 108 20391987-88 1963 314 71 23481996-97 2953 539 50 3542
Uroova
2000-01 2782 781 54 36171980-81 354 88 35 4771985-86 1100 244 86 14301987-88 1823 446 63 23321996-97 2797 545 45 3387
Meja
2000-01 2981 612 78 36711980-81 660 120 29 8151985-86 1353 298 85 17361987-88 2336 601 49 29861996-97 3036 592 43 3671
Koraon
2000-01 3817 900 101 48181980-81 311 137 31 4791985-86 1133 292 82 15271987-88 1894 318 61 22731996-97 2620 444 38 3102
Manda
2000-01 2643 575 90 3308Source: District Statistical Handbook (of various years).
3.8 Extent of Mechanization The extent of mechanization has increased in the district. The number of tractors, plough
machine, sprayers, threshing machine etc. have increased, while the number of wood plough have
decreased during the last 20 years. The number of wood plough decreased from around 15 laks in
1978 to 51000 during 1997 in the district while the number of iron plough increased from 9718 to
22389 during the same period. The number of thresher increased by around 200 per cent, sprayer
by 286 per cent, improved sowing machine by around 700 per cent and tractor by 89 per cent during
1978 to 1997. The trend of increasing mechanization despite the fact that average size of
landholdings has been decreasing indicates a new type of resource sharing in rural area. Those
who cannot afford to purchase the machine, hire its services. Be it irrigation water, tractor, thresher
or any other resource, their services are being hired by those who cannot afford to purchase or
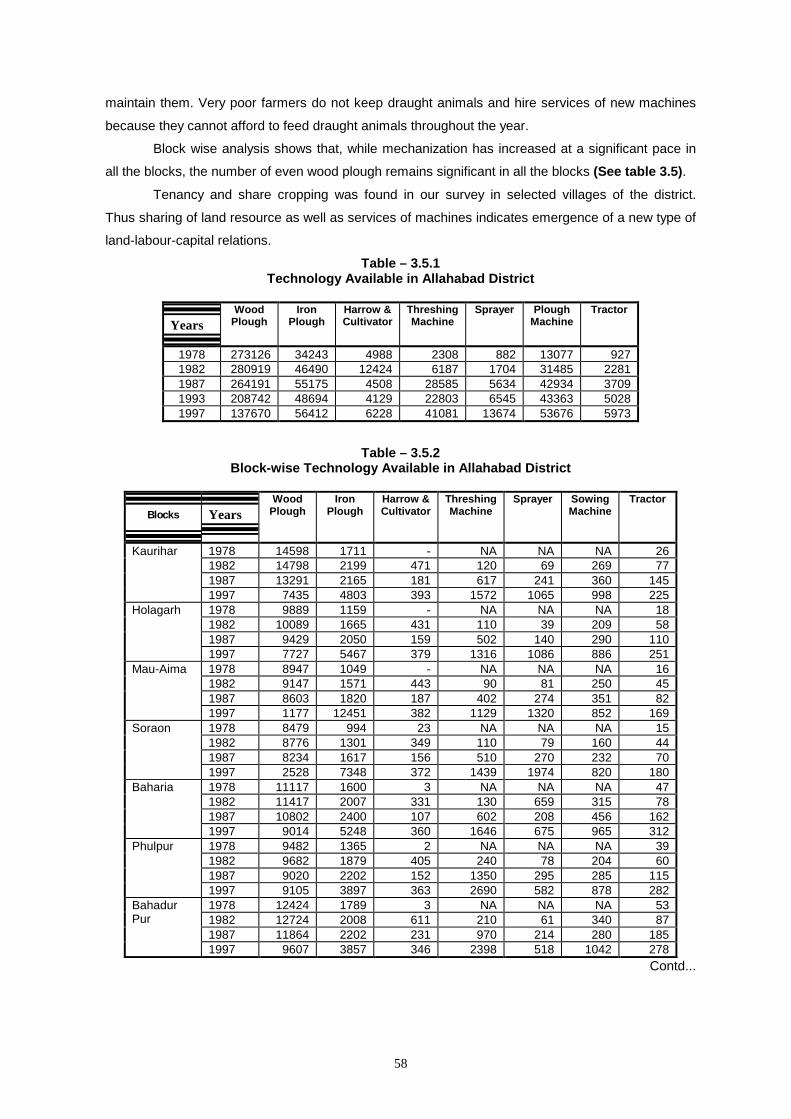
58
maintain them. Very poor farmers do not keep draught animals and hire services of new machines
because they cannot afford to feed draught animals throughout the year.
Block wise analysis shows that, while mechanization has increased at a significant pace in
all the blocks, the number of even wood plough remains significant in all the blocks (See table 3.5).
Tenancy and share cropping was found in our survey in selected villages of the district.
Thus sharing of land resource as well as services of machines indicates emergence of a new type of
land-labour-capital relations.
Table – 3.5.1 Technology Available in Allahabad District
Years Wood
Plough Iron
Plough Harrow & Cultivator
Threshing Machine
Sprayer Plough Machine
Tractor
1978 273126 34243 4988 2308 882 13077 927 1982 280919 46490 12424 6187 1704 31485 2281 1987 264191 55175 4508 28585 5634 42934 3709 1993 208742 48694 4129 22803 6545 43363 5028 1997 137670 56412 6228 41081 13674 53676 5973
Table – 3.5.2 Block-wise Technology Available in Allahabad District
Blocks Years Wood
Plough Iron
Plough Harrow & Cultivator
Threshing Machine
Sprayer Sowing Machine
Tractor
1978 14598 1711 - NA NA NA 261982 14798 2199 471 120 69 269 771987 13291 2165 181 617 241 360 145
Kaurihar
1997 7435 4803 393 1572 1065 998 2251978 9889 1159 - NA NA NA 181982 10089 1665 431 110 39 209 581987 9429 2050 159 502 140 290 110
Holagarh
1997 7727 5467 379 1316 1086 886 2511978 8947 1049 - NA NA NA 161982 9147 1571 443 90 81 250 451987 8603 1820 187 402 274 351 82
Mau-Aima
1997 1177 12451 382 1129 1320 852 1691978 8479 994 23 NA NA NA 151982 8776 1301 349 110 79 160 441987 8234 1617 156 510 270 232 70
Soraon
1997 2528 7348 372 1439 1974 820 1801978 11117 1600 3 NA NA NA 471982 11417 2007 331 130 659 315 781987 10802 2400 107 602 208 456 162
Baharia
1997 9014 5248 360 1646 675 965 3121978 9482 1365 2 NA NA NA 391982 9682 1879 405 240 78 204 601987 9020 2202 152 1350 295 285 115
Phulpur
1997 9105 3897 363 2690 582 878 2821978 12424 1789 3 NA NA NA 531982 12724 2008 611 210 61 340 871987 11864 2202 231 970 214 280 185
Bahadur Pur
1997 9607 3857 346 2398 518 1042 278Contd...
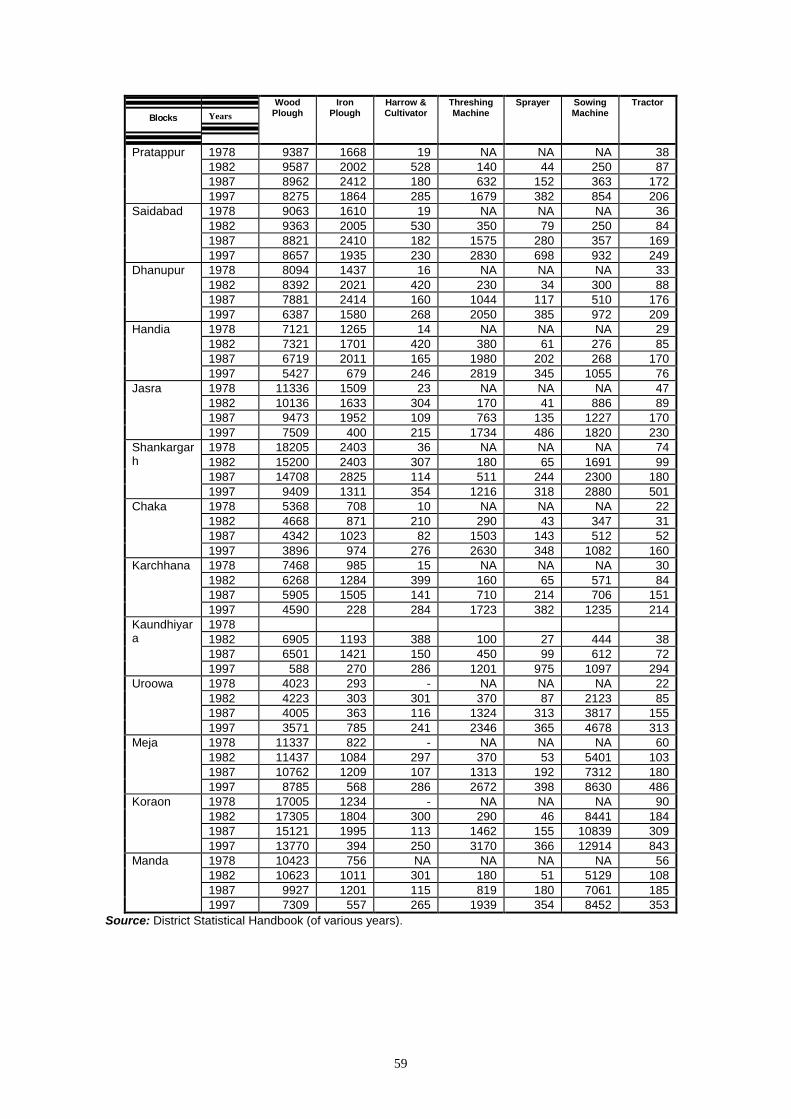
59
Blocks Years Wood
Plough Iron
Plough Harrow & Cultivator
Threshing Machine
Sprayer Sowing Machine
Tractor
1978 9387 1668 19 NA NA NA 381982 9587 2002 528 140 44 250 871987 8962 2412 180 632 152 363 172
Pratappur
1997 8275 1864 285 1679 382 854 2061978 9063 1610 19 NA NA NA 361982 9363 2005 530 350 79 250 841987 8821 2410 182 1575 280 357 169
Saidabad
1997 8657 1935 230 2830 698 932 2491978 8094 1437 16 NA NA NA 331982 8392 2021 420 230 34 300 881987 7881 2414 160 1044 117 510 176
Dhanupur
1997 6387 1580 268 2050 385 972 2091978 7121 1265 14 NA NA NA 291982 7321 1701 420 380 61 276 851987 6719 2011 165 1980 202 268 170
Handia
1997 5427 679 246 2819 345 1055 761978 11336 1509 23 NA NA NA 471982 10136 1633 304 170 41 886 891987 9473 1952 109 763 135 1227 170
Jasra
1997 7509 400 215 1734 486 1820 2301978 18205 2403 36 NA NA NA 741982 15200 2403 307 180 65 1691 991987 14708 2825 114 511 244 2300 180
Shankargarh
1997 9409 1311 354 1216 318 2880 5011978 5368 708 10 NA NA NA 221982 4668 871 210 290 43 347 311987 4342 1023 82 1503 143 512 52
Chaka
1997 3896 974 276 2630 348 1082 1601978 7468 985 15 NA NA NA 301982 6268 1284 399 160 65 571 841987 5905 1505 141 710 214 706 151
Karchhana
1997 4590 228 284 1723 382 1235 2141978 1982 6905 1193 388 100 27 444 381987 6501 1421 150 450 99 612 72
Kaundhiyara
1997 588 270 286 1201 975 1097 2941978 4023 293 - NA NA NA 221982 4223 303 301 370 87 2123 851987 4005 363 116 1324 313 3817 155
Uroowa
1997 3571 785 241 2346 365 4678 3131978 11337 822 - NA NA NA 601982 11437 1084 297 370 53 5401 1031987 10762 1209 107 1313 192 7312 180
Meja
1997 8785 568 286 2672 398 8630 4861978 17005 1234 - NA NA NA 901982 17305 1804 300 290 46 8441 1841987 15121 1995 113 1462 155 10839 309
Koraon
1997 13770 394 250 3170 366 12914 8431978 10423 756 NA NA NA NA 561982 10623 1011 301 180 51 5129 1081987 9927 1201 115 819 180 7061 185
Manda
1997 7309 557 265 1939 354 8452 353Source: District Statistical Handbook (of various years).
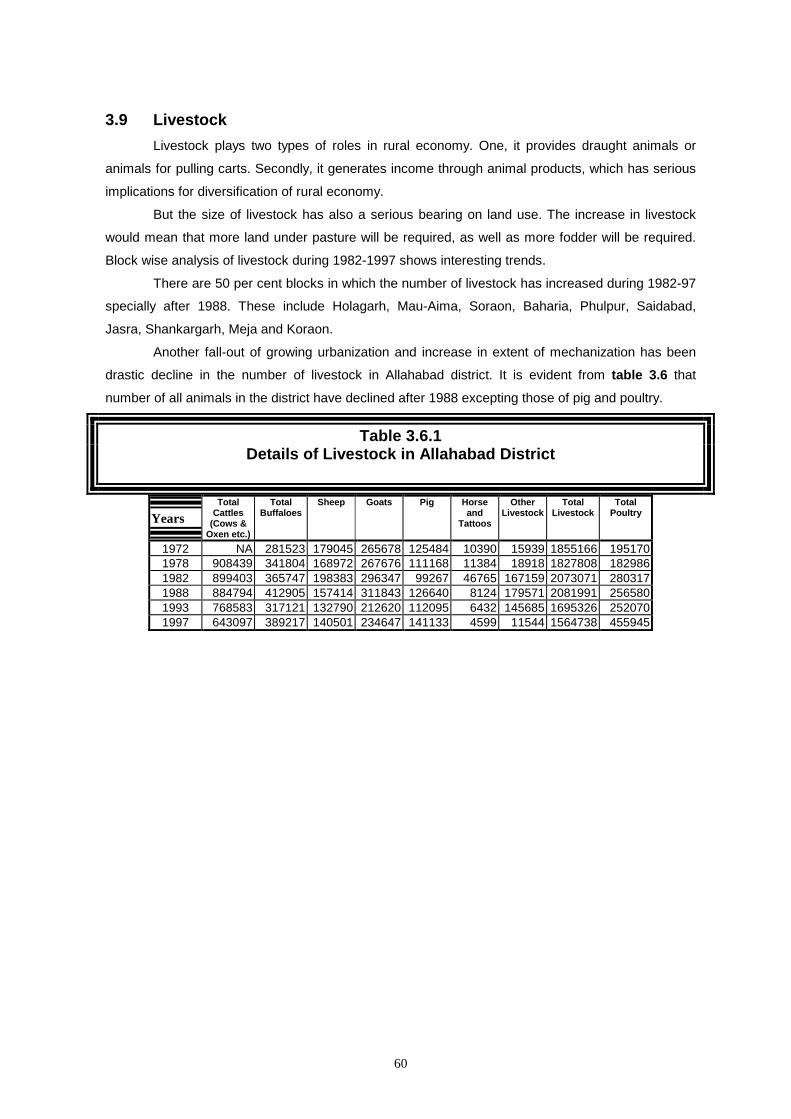
60
3.9 Livestock Livestock plays two types of roles in rural economy. One, it provides draught animals or
animals for pulling carts. Secondly, it generates income through animal products, which has serious
implications for diversification of rural economy.
But the size of livestock has also a serious bearing on land use. The increase in livestock
would mean that more land under pasture will be required, as well as more fodder will be required.
Block wise analysis of livestock during 1982-1997 shows interesting trends.
There are 50 per cent blocks in which the number of livestock has increased during 1982-97
specially after 1988. These include Holagarh, Mau-Aima, Soraon, Baharia, Phulpur, Saidabad,
Jasra, Shankargarh, Meja and Koraon.
Another fall-out of growing urbanization and increase in extent of mechanization has been
drastic decline in the number of livestock in Allahabad district. It is evident from table 3.6 that
number of all animals in the district have declined after 1988 excepting those of pig and poultry.
Table 3.6.1 Details of Livestock in Allahabad District
Years Total
Cattles (Cows &
Oxen etc.)
Total Buffaloes
Sheep
Goats Pig Horse and
Tattoos
Other Livestock
Total Livestock
Total Poultry
1972 NA 281523 179045 265678 125484 10390 15939 1855166 195170 1978 908439 341804 168972 267676 111168 11384 18918 1827808 182986 1982 899403 365747 198383 296347 99267 46765 167159 2073071 280317 1988 884794 412905 157414 311843 126640 8124 179571 2081991 256580 1993 768583 317121 132790 212620 112095 6432 145685 1695326 252070 1997 643097 389217 140501 234647 141133 4599 11544 1564738 455945
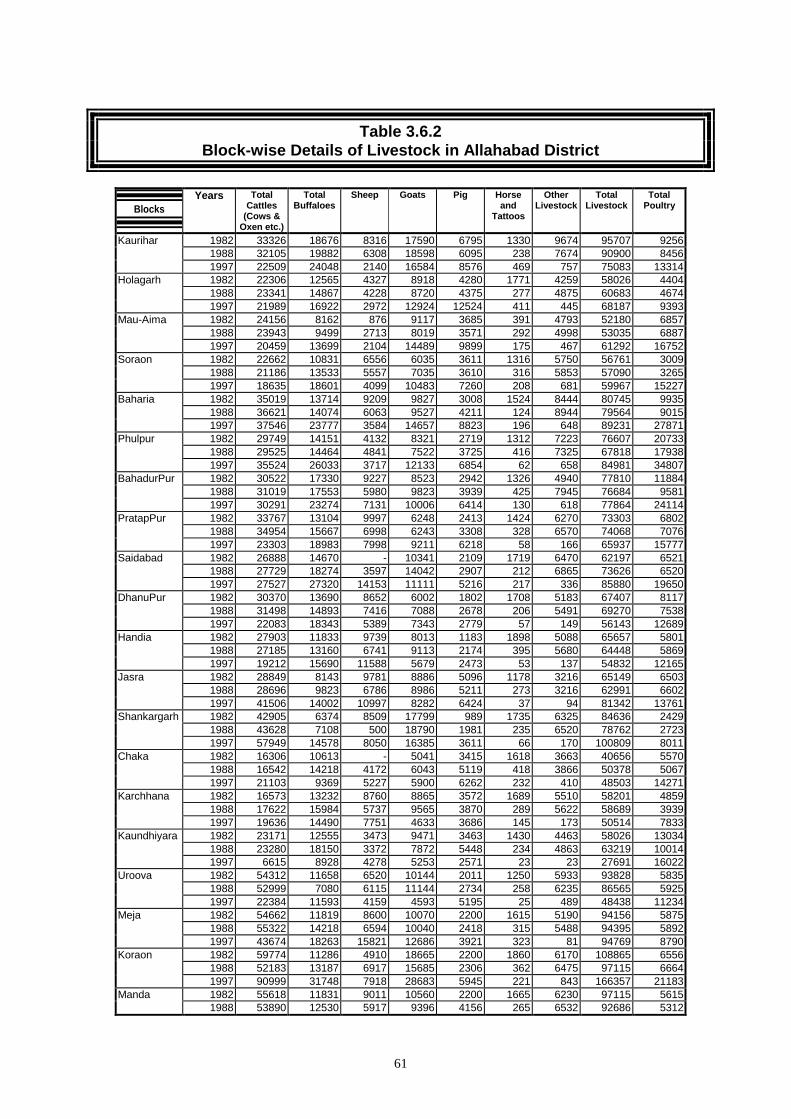
61
Table 3.6.2 Block-wise Details of Livestock in Allahabad District
Blocks Years Total
Cattles (Cows &
Oxen etc.)
Total Buffaloes
Sheep
Goats Pig Horse and
Tattoos
Other Livestock
Total Livestock
Total Poultry
1982 33326 18676 8316 17590 6795 1330 9674 95707 92561988 32105 19882 6308 18598 6095 238 7674 90900 8456
Kaurihar
1997 22509 24048 2140 16584 8576 469 757 75083 133141982 22306 12565 4327 8918 4280 1771 4259 58026 44041988 23341 14867 4228 8720 4375 277 4875 60683 4674
Holagarh
1997 21989 16922 2972 12924 12524 411 445 68187 93931982 24156 8162 876 9117 3685 391 4793 52180 68571988 23943 9499 2713 8019 3571 292 4998 53035 6887
Mau-Aima
1997 20459 13699 2104 14489 9899 175 467 61292 167521982 22662 10831 6556 6035 3611 1316 5750 56761 30091988 21186 13533 5557 7035 3610 316 5853 57090 3265
Soraon
1997 18635 18601 4099 10483 7260 208 681 59967 152271982 35019 13714 9209 9827 3008 1524 8444 80745 99351988 36621 14074 6063 9527 4211 124 8944 79564 9015
Baharia
1997 37546 23777 3584 14657 8823 196 648 89231 278711982 29749 14151 4132 8321 2719 1312 7223 76607 207331988 29525 14464 4841 7522 3725 416 7325 67818 17938
Phulpur
1997 35524 26033 3717 12133 6854 62 658 84981 348071982 30522 17330 9227 8523 2942 1326 4940 77810 118841988 31019 17553 5980 9823 3939 425 7945 76684 9581
BahadurPur
1997 30291 23274 7131 10006 6414 130 618 77864 241141982 33767 13104 9997 6248 2413 1424 6270 73303 68021988 34954 15667 6998 6243 3308 328 6570 74068 7076
PratapPur
1997 23303 18983 7998 9211 6218 58 166 65937 157771982 26888 14670 - 10341 2109 1719 6470 62197 65211988 27729 18274 3597 14042 2907 212 6865 73626 6520
Saidabad
1997 27527 27320 14153 11111 5216 217 336 85880 196501982 30370 13690 8652 6002 1802 1708 5183 67407 81171988 31498 14893 7416 7088 2678 206 5491 69270 7538
DhanuPur
1997 22083 18343 5389 7343 2779 57 149 56143 126891982 27903 11833 9739 8013 1183 1898 5088 65657 58011988 27185 13160 6741 9113 2174 395 5680 64448 5869
Handia
1997 19212 15690 11588 5679 2473 53 137 54832 121651982 28849 8143 9781 8886 5096 1178 3216 65149 65031988 28696 9823 6786 8986 5211 273 3216 62991 6602
Jasra
1997 41506 14002 10997 8282 6424 37 94 81342 137611982 42905 6374 8509 17799 989 1735 6325 84636 24291988 43628 7108 500 18790 1981 235 6520 78762 2723
Shankargarh
1997 57949 14578 8050 16385 3611 66 170 100809 80111982 16306 10613 - 5041 3415 1618 3663 40656 55701988 16542 14218 4172 6043 5119 418 3866 50378 5067
Chaka
1997 21103 9369 5227 5900 6262 232 410 48503 142711982 16573 13232 8760 8865 3572 1689 5510 58201 48591988 17622 15984 5737 9565 3870 289 5622 58689 3939
Karchhana
1997 19636 14490 7751 4633 3686 145 173 50514 78331982 23171 12555 3473 9471 3463 1430 4463 58026 130341988 23280 18150 3372 7872 5448 234 4863 63219 10014
Kaundhiyara
1997 6615 8928 4278 5253 2571 23 23 27691 160221982 54312 11658 6520 10144 2011 1250 5933 93828 58351988 52999 7080 6115 11144 2734 258 6235 86565 5925
Uroova
1997 22384 11593 4159 4593 5195 25 489 48438 112341982 54662 11819 8600 10070 2200 1615 5190 94156 58751988 55322 14218 6594 10040 2418 315 5488 94395 5892
Meja
1997 43674 18263 15821 12686 3921 323 81 94769 87901982 59774 11286 4910 18665 2200 1860 6170 108865 65561988 52183 13187 6917 15685 2306 362 6475 97115 6664
Koraon
1997 90999 31748 7918 28683 5945 221 843 166357 211831982 55618 11831 9011 10560 2200 1665 6230 97115 5615Manda
1988 53890 12530 5917 9396 4156 265 6532 92686 5312
62
1997 35746 23297 7812 7222 4293 13 34 78417 16720Source: District Statistical Handbook (of various years).
PART – B Land Use Plan Related to Agricultural Land
In Allahabad district the average size of landholding was 0.75 hectare as per the 1995-96
agricultural census and 91.43 per cent holdings belonged to the small and marginal farmers, while
they accounted for only 57.25 per cent of total area under all landholdings.
The net sown area as percentage of total reporting area increased from around 64 per cent
to above 67 per cent after 1994-95.
But the analysis of block-wise net sown area shows that in most of the blocks the proportion
of net sown area had been above 70.0 per cent during 2000-01 or during some past years. There
were only 4 out of 20 blocks where net sown area had been low. These are Chaka, Karchana,
Uroowa and Meja. Net sown area in Chaka was low because it is on the urban fringe. There is need
to regulate land use on urban fringes. In other blocks net sown area could be increased through
micro water shed management programmes.
The cropping intensity of the Allahabad district had almost consistently increased since
1960-61, and has increased to 157.3 during the period 2000-01.
The most important factor which has effected cropping intensity is irrigation.
The irrigation intensity i.e. net irrigated area as percentage of net sown area has increased
from 23.16 per cent in 1960-61 to 71.31 per cent in 2000-01. This trend was discernible in all the
blocks of the district as well.
Furthermore, gross irrigated area as percentage of net irrigated area has also increased
during the last twenty five years from around 118.46 in 1980-81 to around 162.8 in 2000-01 with
fluctuating trends during intervening periods.
Canals and Tubewells are now the major sources of irrigation in Allahabad district, and
account for more than 97 per cent of net irrigated area.
There is another aspect of analysis of sources of irrigation. The role of public sources
continues to be very important. Because canals and government tubewells together account for
more than 60 per cent of net irrigated area in the district. That means, public investment in irrigation
will continue to play an important role in increasing gross irrigated area, which in turn would help in
increasing the cropping intensity in many blocks of the district.
The cropping pattern in the district has vastly changed during the last 30 years.
The main crops viz. paddy, wheat and potato have witnessed large increases in their
productivity also during the period 1960-61 to 1998-99.
Thus farmers have shifted to crops, which are highly irrigated, fertilizer use is higher on
them and whose productivity is also comparatively very high.
63
We need to make efforts to increase production of more pulses, oilseeds and spices.
Cropping rotation also needs to be changed. Following steps are imperative to achieve it.
(a) More thrust be given for developing high yielding varieties for these crops.
(b) Rain fed areas should be encouraged to cultivate these crops.
(c) Orchards, fallow land and land under social forestry could be used for growing such crops.
(d) Processing industries of oilseeds and spices be promoted at local level with support for
technology up gradation, packaging and market access facilities.
Use of fertilizer had been increasing in all the blocks. But their balanced and proportionate
application has not been reported.
There is need to adopt following strategy to combat this menace:
(a) Circulate guidelines for each gram-panchayat-on the basis of soil-testing – the proportion of
fertilizer which is required to be applied.
(b) Farmers' meeting be organised at village level before every cropping season to make them
aware about such guidelines.
(c) Farmers be also informed about hazardous impact of non-proportionate application of urea.
(d) Government functionaries, specially at the gram-panchayat level be sensitised regarding
these aspects.
The extent of mechanisation has increased in the district. The number of tractors, sowing
machine, sprayers, threshing machine etc. have increased, while the number of wood plough have
decreased during the last 20 years.
The trend of increasing mechanisation despite the fact that average size of landholdings has
been decreasing indicates a new type of resource sharing in rural area. Those who cannot afford to
purchase the equipment or machine, hire its services. Be it irrigation water, tractor, thresher or any
other machine, their services are being hired by those who cannot afford to purchase or maintain
them. Very poor farmers do not keep draught animals and hire services of new machines because
they cannot afford to feed draught animals throughout the year.
Tenancy and share cropping was found in our survey in selected villages of the district.
Thus sharing of land resource as well as services of machines indicates emergence of a new type of
land-labour-capital relations.
Livestock plays two types of roles in rural economy, one it provides draught animals or for
pulling carts. Secondly it generates income through animal products, which has serious implications
for diversification of rural economy.
But the size of livestock has also a serious bearing on land use. The increase in livestock
would mean that more land under pasture will be required, as well as more fodder will be required.
Another fall-out of growing urbanisation and increase in extent of mechanisation has been
drastic decline in the number of livestock in Allahabad district. The number of all animals in the
district have declined excepting those of pig and poultry after 1988.
3.10 Agricultural Production System and Framework for Land Use Plan
64
It was found that the majority of land owners who leased out their land belonged to medium,
small or marginal farmers. The fact that even small and marginal farmers were leasing out their land,
revealed two trends - one, in case of uneconomic holdings farmers want to search other
opportunities and will be content to get the market rent for their land yet they would prefer to retain
the land instead of selling it out right. Moreover, the new generation, if educated seeks jobs in cities,
and prefers to lease out the land. The other aspect was in regard to changing relationship. The
exploitative relationship between tenant/share cropper and the land lord is fast changing. It is now
purely an economic arrangement of mutual interests. Small and marginal farmers also lease-out
land to other small and marginal farmers. Thus enterprising farmers are continuing agricultural
activities by pooling resources from fellow farmers, while some other farmers are trying to make
efforts in non-agricultural activities also.
Thus the new form of economic arrangement under tenancy was giving way to emergence
of new enterprising farmers who were seeking ways to pool resources for higher productivity and
application of new technology.
Dependency relationship based tenancy was declining because not many cultivators wanted
to be tied up for the whole of year with some small parcel of land which they did not own, and further
depend on the landlord for resources and credit. Landless or near landless people also now want to
keep options open for seeking job elsewhere as well. So they preferred to work as casual
agricultural labour during peak periods rather than working as an attached labour or as a tenant.
On the other hand leasing-out by small farmers was on the increase because many small
farmers wanted to get job outside agriculture and at the same time wanted some income from their
land also. This was possible only by leasing-out land to fellow farmers at mutually agreed terms.
This kind of tenancy was free from both the dependency and exploitative relationship.
Sharing of machines and equipments was also found to be widely prevalent among farmers
of this district. It was found that almost all farmers owning agricultural machines and equipments
hired out or shared their services with other farmers. many agricultural tools were also found to be
shared among farmers on the exchange basis.
3.11 Factors Inhibiting Growth The immediate factors which inhibited growth among small and marginal farmers were: lack
of resources, capital deficiency and lack of facility to sell at remunerative prices. The other factors
included the problems of water logging, floods, drying of canals during summer, etc.
3.12 Framework for Agricultural Growth Among small and marginal farmers, agricultural productivity is hampered by poor logistical
support and weak infrastructure. If food production is to be increased in a sustainable way, these
deficiencies must be corrected and favourable economic framework for agriculture should be
evolved. Such actions need to be backed up by practices aimed at maintaining or enhancing fertility
and productivity.
The first step is to protect the best land for agriculture. In view of the scarcity of high quality
arable land and the rising demand for food and other agricultural products, the land that is most
suitable for crops should be reserved for agriculture. Government should map and monitor the more
65
productive areas of farm land and adopt planning and zoning policies to prevent the loss of prime
land to urban settlements. Village Land Management Committee and local authorities should be
entrusted with responsibility to ensure that these policies are implemented in their areas.
We have found that the number of small and marginal farmers in the district is predominant.
It was also found that the immediate factors which inhibited growth among small and marginal
farmers were lack of resources, capital deficiency and lack of facility to sell at remunerative prices.
The most important factor which could become basis for future restructuring of agricultural
production system related to tenancy. It was found the majority of land owners who leased out their
land (without entering into any written or formal contract) belonged to the category of medium, small
or marginal farmers. This was for two reasons – one in case of uneconomic holdings, farmers
wanted to search other opportunities and would be content to get the market rent for their land. Yet
they would prefer to retain the land instead of selling it outright. The other aspect was in regard to
non-exploitative nature of relationship between the lessor and the lessess. It is now purely an
economic arrangement in which small and marginal farmers are also leasing out land to other small
and marginal farmers. Thus enterprising farmers are continuing agricultural activities by pooling
resources from fellow farmers, while some other farmers are seeking opportunities in non-
agricultural activities also. Thus the new form of economic arrangement was giving way to pooling of
resources by enterprising farmers, while other farmers who were leasing out their land were treating
their land as a share capital for which they will receive the rent as well as the share in profit. The
process of pooling of resources was further strengthened by a simultaneous process of sharing of
machines and equipments. it was found that almost all farmers owning agricultural machines and
equipments hired out or shared their services with other farmers.
It seems to us that a limited restructuring of the production process in agriculture can be
such that it serves the interests of small and marginal farmers and at the same time protects wider
interests of the farming community.
One major step in this direction would be to allow formation of Collective Farming Society
and Confederation of Farming Societies. In the collective farming society framework, tenancy to
such farming societies could be permitted under specified conditions. In particular such societies
may be formed of small and marginal farmers for a complete package of inputs, and it may then be
permissible for any member of such a society to lease out land to the society or to any other
member of the society.
At the next level, a confederation of such Collective Farming Societies could be formed
which will work as service societies. These confederations would provide high cost machinery and
equipments to Collective Farming Societies on rent. The idea essentially is that it should be possible
to increase number of viable farms by permitting some of the non-viable farmers to go out of
agricultural business and seek other jobs and economic opportunities. This should on the one hand,
improve productivity of labour on the expanded farms and on the other aid in much needed shift of
labour away from agriculture.
3.13 Collective Farming Society
66
1. Collective farming units be allowed to be registered under a separate Collective Farming
Society Registration Act.
2. Only small and marginal farmers be allowed to become members of such a society.
3. The number of members of a society should not be above twenty and below five.
4. Those who become members of such a collective farming society will be allowed to lease
out their land to the society for a minimum of ten years on a fixed annual rent.
5. A collective farming society will not bring under its purview more than ten hectares of
irrigated land.
6. A collective farming society will be allowed to pool its resources on hire or through raising
capital from its members.
7. The produce will be shared among members in proportion to the share amount of each
member.
8. The share amount of each member will be the weighted sum of (a) money invested
under capital raising scheme plus, (b) the amount fixed as annual rent for the land
leased out to the society, (c) operational holdings of actual cultivators.
3.14 Confederation of Collective Farming Societies For storage facilities, providing transportation facilities and to work as marketing syndicates
of farming societies, a confederation of ten to twenty corporate farming societies be allowed to be
formed.
These confederations will work in the following areas:
1. Marketing of agricultural goods at national and international level.
2. Provide transportation and storage facilities to Collective Farming Societies against such
stored goods.
3. Function as cushions against speculative prices.
4. The confederation will also act as counselling centre for farmers projecting the production
and demands of each agricultural commodity for the next two years.
5. Provide high costing tools and machines to Collective Farming Societies for land levelling,
soil testing, land reclamation and other activities related to land and water management on
rental basis.
6. Help in technological innovations and in increasing productive efficiency.
67
Chapter – 4
Land Use Plan
(Other than Agricultural Land)
The land use pattern in the district has been changing slowly but steadily. The discussion on
land use pattern is divided into two parts. One deals with the land use related to agriculture and the
other part deals with all categories of land use other than agriculture. We have already discussed
land use related to agriculture in Chapter – 3.
The categories related to land use other than agriculture have witnessed change due to
factors like population increase, urbanization, land degradation floods etc.
Following categories of land use may be combined under the heading other than agricultural
categories:
(i) Forest
(ii) Land put to non-agricultural uses
(iii) Barren and unculturable land
(iv) Culturable waste
(v) Permanent pastures and other grazing land
(vi) Land under miscellaneous trees, crops and groves not included in net area sown.
Our focus in preparing land use plan has been four fold –
(i) Agricultural land be transferred for use to other purposes.
(ii) Maximum area should not be brought under vegetative cover i.e.
(a) Increase forest
(b) Increase area under miscellaneous trees and groves.
(c) Increase area under pasture and grazing land.
(iii) Use culturable waste and other fallow land for such purposes. Therefore, efforts
should be made to convert land under these categories into forest, orchards or
grazing land.
(iv) Barren and unculturable land be used for constructing buildings or infra-structural
facilities.
Land use pattern has shown no discernible change during the last four years i.e. 1997-2001
in the district.
68
PART – A
4.1 District Level Analysis of Land Use Pattern and Land Use Plan 4.1.1 Forest
The forest land was around 2.7 per cent of total reporting area during the period 1970-71 to
1997-98. Thereafter it increased to around 3.6 per cent. There are four blocks in the district where
area under forest has some sizable proportion. These are: Shankargarh (10.23 per cent), Meja (9.16
per cent), Koraon (8.24 per cent) and Manda (13.75 per cent). The area under culturable waste was
above 5.0 per cent of total reporting area in the following blocks: Kaurihar, Baharia, Phulpur,
Bahadurpur, Chaka and Meja, while area under other fallow was above 5.0 per cent of total
reporting area in Kaurihar, Shankargarh, Meja and Manda blocks (See table 4.1).
The area under forest could be brought to around 5 per cent of total reporting area, if some
part of the land under other fallow and some part of land under culturable waste is brought under
forest. This could be done by forming Joint Forest Management Committees consisting of plant
growers from poor peasantry class and representatives of forest department and land use
committee. A cell should be formed to provide them the financial support and infra-structural support
so that they could get suitable plants, methods to protect them and finally marketing of forest
produce.
Secondly, development of such forests should be linked with watershed management in the
area. For this purpose an area of 500 hectares to 1000 hectares should be choosen as unit for
micro-watershed management.
This would include (i) construction of water retention structures (ii) clearing and desilting of
natural courses of drainage systems and (iii) restoration/reconstruction of ponds/ tanks in totally
barren lands or low lying lands.
Thirdly programmes like Pradhan Mantri Rojgar Yojana etc. should be now utilised for
construction of bundhis, management of wild resources including fisheries, drainage maintenance
and enhancement etc.
Fourthly, more emphasis will have to be laid on energy plantation which would provide fuel
wood besides growing of fruit trees rather than timber linked growth of forests.
Private Micro Forests Private micro forest is different from orchards, as orchards generally comprise fruit bearing
plants. The concept of private micro forest envisages that private individuals could also grow various
varieties of plants. We have in the past found that eucalyptus had been grown in private land
because it was expected to fetch good amount. The private waste land could also be used for
growing timber. energy plants, etc. This could also be linked with purification of surroundings. For
this purpose plants related to different planets (Navgrah) and different Nakshatra which are 27 in
numbers could be planted as per specified arrangement.
Even plants with medicinal value could be grown in such land if people could be informed
about their medicinal and commercial value.
4.1.2 Land Put to Non-agricultural Uses
69
Area under land put to non-agricultural uses has been continuously increasing over the past
40 years. It was around 9.5 per cent during 1960-61 and has risen to around 12 per cent by the end
of year 2000 (See table 4.1).
Land in this category has been steadily increasing. However, this increase is faster in blocks
located at the urban fringe. Chaka is one such block where land put to non-agricultural uses is 21.22
per cent of the total reporting areas.
Besides Allahabad, there are nine townships in Allahabad district. These have also affected
growth of land put to non-agricultural uses.
Townships and Proportion of Land Put to Other Uses in Allahabad District
Name of Township Name of Block % of land put to other uses Lal Gopal Ganj Phulpur Phulpur 11.28 Mau-Aima Mau-Aima 12.55 Bharatganj Manda 9.92 Handia Handia 14.89 Sirsa Meja 9.95 Shankargarh Shankargarh 8.65 Koraon Koraon 4.64 Jhusi Bahadurpur 11.75
Besides these, there are some non-notified local markets. Land put to non-agricultural uses
is also high in them. These include Kaurihar (16.91 per cent), Soraon (14.15 per cent) and Saidabad
(14.02 per cent).
Regulation of Land Use at Urban Fringes There is need to regulate land use at urban fringes. This could be done by setting up an
Allahabad Urban Fringe Development Authority. The UFDA could decide on the following:
(i) Conservation of green areas such as orchards, agriculture, social forestry and allied
activities.
(ii) Development of water management and drainage system. Ponds and other water retention
structures be revived. Any encroachment on such land should be identified and legal
proceedings against encroachers be initiated.
(iii) The provisions made under Zamindari Abolition and Land Reforms Acts (specially section
143 and 154) and Consolidation of Holdings Act be used effectively to check diversion of
agricultural land for non-agricultural purposes.
(iv) Heavy fine should be imposed (say ten times the cost of the land) in case of such diversion
on the owner of the land.
(v) In addition to it, if the agricultural land had been sold then capital gain tax should be
imposed on purchaser of the land. Because huge capital gain accrues to the builders who
develop colonies in such land.
(vi) The first priority be given to development of social services in the fringe area which will
include hospitals, educational centres, training centres for farmers and agro-based
industries.
70
(vii) Barren and uncultivable land should be identified for development of micro-industrial estates
and then for developing multistoried residential complexes which are land saving as well.
Uroowa is one block where proportion of land under category of land put to non-agricultural
uses is very high because the area of the block is small and a large part of it is covered by rail and
road network.
Besides urban fringes, there is need to restrict the rate of increase of area under land put to
non-agricultural uses, in rural areas in general.
This could be made possible by adopting following steps.
(a) Discourage migration of people of nearby villages. This could be done by increasing
transport facility and by improving road networks.
(b) Strengthen household industries of rural areas by providing them institutional support
and market facilities.
(c) Develop green belt around city and any construction in the green belt area be strictly
prohibited.
(d) Encourage multi-storey buildings and economic flats to weaker sections.
One important aspect of land put to non-agricultural uses is increasing number of residential
houses. However, since population growth rate is faster, per person living area is decreasing. Even
more disturbing factor is that per person open area in house premises is also declining. This is the
trend in even rural areas. Hence space for community uses and common recreation places must be
developed even in rural areas. In city planning we leave space for parks, playgrounds and
recreation spots. Such planning should also be done for rural areas. Watershed management could
then be linked with development of parks and recreation places. Some area could also be reserved
for floriculture and horticulture.
Regulation of Land Use along Road Side There has been a tendency to change land use along road side – specially national
highways and state highways. Houses and shops are constructed or such land is put to even other
non-agricultural uses. As a result of this contiguous effect leads to further expansion of settlements
near highways and such places become accident prone. Therefore, there is need to regulate land
use along roadside. Following measures could be adopted in this respect:
(i) A green strip be developed on both sides of road. Such green strip on each side should not
be less than 10 meter wide.
(ii) Wherever, highways are connected with other roads, construction along side even such
connecting roads be prohibited for a length of at least one kilometer.
(iii) Those who construct houses or buildings on agricultural lands along side road should be
fined heavily (say ten times the cost of the land).
The rate of increase of area under the category of land put to non-agricultural uses could
then be restricted to around 13.5 per cent of total reporting area by the year 2010.
4.1.3 Barren and Unculturable Land
71
Barren and unculturable land could be used for further expansion of residential places,
playgrounds and construction of building for common uses such as school or panchayat bhawan. It
could also be used as Khalihan if it is nearby fields. And it could be used for cremation ground or
graveyard if it is far away from habitation.
Thus, barren and unculturable land could be shifted for use as land put to non-agricultural
purposes. Some part of it could also be used for developing as pasture and grazing land.
We hope that through these measures, area under barren and unculturable land could be
reduced from 3.5 per cent to 1.0 per cent of reporting area in district Allahabad.
4.1.4 Culturable Waste This is a category showing non-enterprise. To our mind, there should be no such category.
If cultivation is not possible then it could be converted into area for social forestry or developed as
pasture and other grazing land.
Currently area under culturable waste is 2.46 per cent of total reporting area (See table
4.1). A part of it (say around 1.5 per cent) could be converted into social forestry and the rest i.e.
around 0.9 per cent could be developed as pasture and other grazing land. At some places, such
land could also be used for fodder cultivation – specially those areas, which are owned by private
individuals.
Support should be provided for developing pasture land and growing fodder.
Culturable Waste along River Side Allahabad had two major rivers and many tributories flowing through it. The patches of land
along side these rivers are undulating and at some places with high mounds. These areas could be
developed as reserved forest strips with one to two kilometers' width. Plant varieties which suit the
local soils could be grown in these reserved forest strips.
Development of these reserved forest strips should also be linked with river water pollution
control systems. It means that water which goes through drainage courses and which meets these
rivers should be treated before it reaches the river. The management of reserved strip forest should
be entrusted with the responsibility to operate the treatment plants.
Besides reserved forest strips, parks and picnic spots could be developed at various points
along the river route. Such parks/picnic spots could become centres of sight seeing and attraction
for tourists as well.
4.1.5 Land under Miscellaneous Trees, Crops, and Groves not included in Net Sown Area
Land use under this category had been the first victim of population growth and conversion
for other uses.
Land under this category could be increased by 1.0 per cent of total reporting area by
converting 1.0 per cent of total reporting area under other fallow land for growing miscellaneous
trees and groves. We propose this because we feel that it would be difficult to bring back all the
other fallow land under cultivation.
Reduction of such area increases run off of rain water. Such areas are best suited for agro-
forestry. The main types of agro-forestry system are:
72
(a) alley cropping – where annual crops are grown between lines of trees that produce
valuable mulching material.
(b) orchard systems – where the trees provide edible fruits, medicines and fuel wood, while
the ground layer is cropped or grazed.
(c) growth of scattered trees with pasture at the ground or grazing land.
Conserve Genetic Resources: Land under the above category should also be used to
conserve genetic resources. This could be done by focussing on following programmes.
♦ Support grassroots associations of farmers and gardeners for the maintenance of traditional and local cultivars and breeds. Involve women's groups, Record farmers knowledge of traditional and local cultivars and breeds,
♦ Develop a common information service for exchange in information and germplasm among grassroots, state and national agencies.
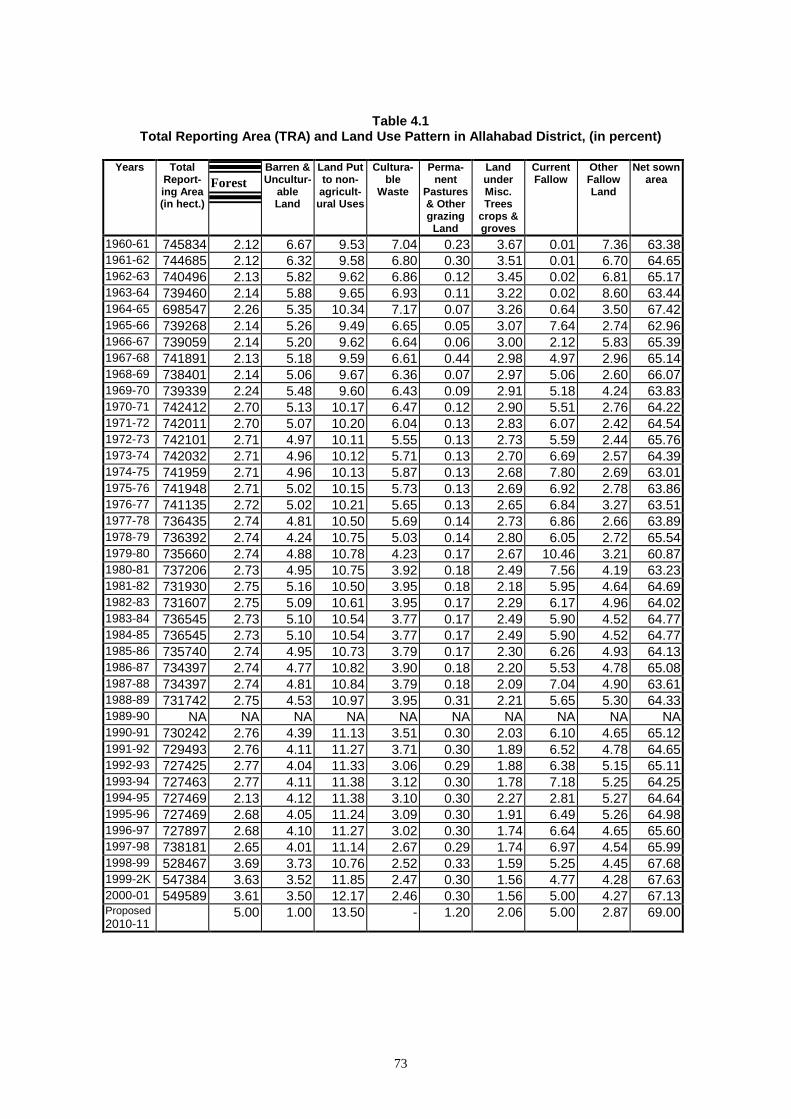
73
Table 4.1
Total Reporting Area (TRA) and Land Use Pattern in Allahabad District, (in percent)
Years Total Report-ing Area (in hect.)
Forest Barren & Uncultur-
able Land
Land Put to non-
agricult-ural Uses
Cultura-ble
Waste
Perma-nent
Pastures & Other grazing
Land
Land under Misc. Trees
crops & groves
Current Fallow
Other Fallow Land
Net sown area
1960-61 745834 2.12 6.67 9.53 7.04 0.23 3.67 0.01 7.36 63.381961-62 744685 2.12 6.32 9.58 6.80 0.30 3.51 0.01 6.70 64.651962-63 740496 2.13 5.82 9.62 6.86 0.12 3.45 0.02 6.81 65.171963-64 739460 2.14 5.88 9.65 6.93 0.11 3.22 0.02 8.60 63.441964-65 698547 2.26 5.35 10.34 7.17 0.07 3.26 0.64 3.50 67.421965-66 739268 2.14 5.26 9.49 6.65 0.05 3.07 7.64 2.74 62.961966-67 739059 2.14 5.20 9.62 6.64 0.06 3.00 2.12 5.83 65.391967-68 741891 2.13 5.18 9.59 6.61 0.44 2.98 4.97 2.96 65.141968-69 738401 2.14 5.06 9.67 6.36 0.07 2.97 5.06 2.60 66.071969-70 739339 2.24 5.48 9.60 6.43 0.09 2.91 5.18 4.24 63.831970-71 742412 2.70 5.13 10.17 6.47 0.12 2.90 5.51 2.76 64.221971-72 742011 2.70 5.07 10.20 6.04 0.13 2.83 6.07 2.42 64.541972-73 742101 2.71 4.97 10.11 5.55 0.13 2.73 5.59 2.44 65.761973-74 742032 2.71 4.96 10.12 5.71 0.13 2.70 6.69 2.57 64.391974-75 741959 2.71 4.96 10.13 5.87 0.13 2.68 7.80 2.69 63.011975-76 741948 2.71 5.02 10.15 5.73 0.13 2.69 6.92 2.78 63.861976-77 741135 2.72 5.02 10.21 5.65 0.13 2.65 6.84 3.27 63.511977-78 736435 2.74 4.81 10.50 5.69 0.14 2.73 6.86 2.66 63.891978-79 736392 2.74 4.24 10.75 5.03 0.14 2.80 6.05 2.72 65.541979-80 735660 2.74 4.88 10.78 4.23 0.17 2.67 10.46 3.21 60.871980-81 737206 2.73 4.95 10.75 3.92 0.18 2.49 7.56 4.19 63.231981-82 731930 2.75 5.16 10.50 3.95 0.18 2.18 5.95 4.64 64.691982-83 731607 2.75 5.09 10.61 3.95 0.17 2.29 6.17 4.96 64.021983-84 736545 2.73 5.10 10.54 3.77 0.17 2.49 5.90 4.52 64.771984-85 736545 2.73 5.10 10.54 3.77 0.17 2.49 5.90 4.52 64.771985-86 735740 2.74 4.95 10.73 3.79 0.17 2.30 6.26 4.93 64.131986-87 734397 2.74 4.77 10.82 3.90 0.18 2.20 5.53 4.78 65.081987-88 734397 2.74 4.81 10.84 3.79 0.18 2.09 7.04 4.90 63.611988-89 731742 2.75 4.53 10.97 3.95 0.31 2.21 5.65 5.30 64.331989-90 NA NA NA NA NA NA NA NA NA NA1990-91 730242 2.76 4.39 11.13 3.51 0.30 2.03 6.10 4.65 65.121991-92 729493 2.76 4.11 11.27 3.71 0.30 1.89 6.52 4.78 64.651992-93 727425 2.77 4.04 11.33 3.06 0.29 1.88 6.38 5.15 65.111993-94 727463 2.77 4.11 11.38 3.12 0.30 1.78 7.18 5.25 64.251994-95 727469 2.13 4.12 11.38 3.10 0.30 2.27 2.81 5.27 64.641995-96 727469 2.68 4.05 11.24 3.09 0.30 1.91 6.49 5.26 64.981996-97 727897 2.68 4.10 11.27 3.02 0.30 1.74 6.64 4.65 65.601997-98 738181 2.65 4.01 11.14 2.67 0.29 1.74 6.97 4.54 65.991998-99 528467 3.69 3.73 10.76 2.52 0.33 1.59 5.25 4.45 67.681999-2K 547384 3.63 3.52 11.85 2.47 0.30 1.56 4.77 4.28 67.632000-01 549589 3.61 3.50 12.17 2.46 0.30 1.56 5.00 4.27 67.13Proposed 2010-11
5.00 1.00 13.50 - 1.20 2.06 5.00 2.87 69.00
74
4.2 Some General Suggestions 4.2.1 District Level (i) District Land Use Committee should be strengthened. The Committee must meet at least
once in a year and take stock of changes which have occurred during past one year. It
should also be informed about up-dating of records and changes which have taken place
during the year.
(ii) As regards its constitution, it should also include District Panchayat Adyaksha, BDOs and
some more representatives of farmers.
(iii) Each line department and BDO should be asked to furnish informations in a pre-structured
proforma.
(iv) The annual proceedings be documented and action plans drawn in the meeting be
circulated to all concerned departments and functionaries.
4.2.2 Block Level (i) Need for Block Level Land Use Committee (BLUC)
There is Land Use Committee at district level. There are Land Management Committees at
the village level. But there are no land use committees at the block level.
Land records were maintained with a view to fix land revenue by the revenue department.
There had been no systematic effort to maintain land records to identify land use categories
on the basis of their potential development and quality.
The development perspective requires that unit for land use planning be made at block
level. Because at district level it remains too generalised, while at village level, it would
create operational problems in coordinating various line departments who have bearing on
the land use. Therefore, there is need to create a planning cum implementing agency at the
block level.
The Block level Land Use Committee may be formed with following as their members:
Block Pramukh - President
B.D.O. - Convenor
A.D.O. (Stat.) - Secretary
Other Members will include representatives from concerned line departments and some
specialists, and
Three B.D.C. Members (to be selected by Kshetra Panchayat Members)
Block level Land Use Committee may take up the following issues for planning and
implementation in the block:
(ii) Salinity and Alkalinity
The problem of alkalinity arises when infiltration rate of water in soil is low. This results in
higher run off of surface water and creates problems of water logging in adjoining areas. As
the water gets muddy, it also creates pollution of water streams. Reclamation of such land
will have multiple effect. Such as increase in the infiltration rate, increase in recharge of
ground water, reduction in water logging and control on water polluation.
75
Following steps should be encouraged for reclamation of such land:
(a) Construction of field bunds – through boundary mounds,
(b) Levelling of fields,
(c) Use of gypsum/pyrites, depending upon the degree of alkalinity,
(d) Rotation of crops.
Group of farmers be formed for their collective action. Then such groups could be provided
financial, technical and infra-structural support for reclamation of alkaline land.
(iii) Water Managment
Reforms are needed to facilitate water management systems for various reasons:
(a) rain and surface water needs to be preserved instead of being allowed to go waste via
drain courses;
(b) natural drain courses should not be allowed to be obstructed otherwise it leads to
avoidable water-logging
Increase in the number of private tubewells results in the lowering of level of ground water,
therefore water management should include recharging by using rain/surface water.
By reducing run off we can check removal of top fertile soil on the one hand and maintain
infiltration on the other. the catchment area of each water route should be mapped out and
the programme to manage rain water should start from the highest land and end at the
drainage basin.
Water harvesting will involve shaping farm land and sometimes also the catchment area of
water course to slow the flow of water and thereby increase infiltration into soil. There are
several cheap ways to make contours, if this is taken up collectively.
The sloppy areas and those along the drainage or field boundary which otherwise are not
suitable for agriculture needs conservation efforts with optimum plant productivity. The strip
plantations of multipurpose trees or shelter belts for crop lands will provide wood/leaf fodder
and also ameliorate environment.
Water reservoir tanks/ponds/bundhis be constructed at places where main drain routes
meet. Such land should be mapped and brought under community/panchayat ownership.
No other construction be allowed to take place on such land through suitable modification in
laws.
Drain network-allowing disposal of waste household water as well as community water
using posts should be linked with natural drainage (by gravity flow) courses. Thus there
should be micro drains (for disposal of household waste water), which will have to be
connected to a community drain and finally the entire waste water has to be drained to other
reservoir sites after proper treatment.
Area along the drainage route should be allowed for fodder cultivation and if possible for
farm forestry. Fodder cultivation and farm forestry needs to be developed in chronically
water-logged areas. To facilitate this, land along drain routes and water-logged land be kept
outside the purview of tenancy provisions. Secondly, land owners of such land be permitted
76
to form fodder or farm forest production units and lease out their land to such collective
production units.
(iv) Protection of Communal Land
Common resource property has been one of the most important source of sustenance of
livelihood of less privileged communities in many backward and remote areas.
A support system for maintenance and quality improvement in land use is needed to protect
grazing land, land under trees, bushes etc. as well as protection of land for chak road and
drainage system is also necessary. Through detailed mapping of each village, community
management and these (water recharging, drainage, trees) etc. should be brought under
communal ownership which should become non transferable and any activity that leads to
their destruction should become unlawful.
The role of common resource property and its allocation systems becomes crucial in
management of these natural resources. It must be emphasized that management of such
resources be vested with the local communities who will take a longer view. Outside
commercial interest will come and go with narrow economic interest only.
Effective communal property rights and resource management systems could be developed
by empowering panchayats to develop modes of their use in their respective panchayats
and by providing them technical and managerial skill as well as the needed capital
resources.
(v) Culturable Waste Lands and Fallow Land
Culturable waste land could be brought under vegetative cover by providing necessary
institutional and infra-structural support.
We suggest following measures to facilitate their proper use.
(a) Identification of Records: Presently such lands are identified and delineated through
revenue records. Block Level Land Use Committee (BLUC) be entrusted with the
responsibility to identify and delineate such land in each block. Land Management
Committees of each Gram Panchayat should be involved in the process.
(b) Preparation of Land Use Maps: Land use maps for all the villages be prepared by the
proposed BLUC.
(c) Put Such Land outside the Purview of Tenancy Clause: These types of land require
huge investment and long waitings for their reclamation. If they remain within the
purview of Tenancy Clause, it would be difficult for farmers to pool such land and invest
on them, because farmers generally prefer to invest on prime land rather than on
degraded land.
(d) Lease Out Such Land to Landless Peasants' Societies: Most of such land is under
State or Gram Samaj ownership. Distribution of small parcel of such land to individual
small farmers or land less peasants will not work. Because individual peasants in these
categories have neither the sufficient capital to invest nor they could wait for longer
77
periods to reap the profits of their investments. Landless Peasants' Societies could be
expected to make long term heavy investments provided such land are leased out to
them for sufficiently a longer duration, and they are provided cheaper loans for this
purpose.
(vi) A New Model for Culturable Waste and Degraded Land
For taking up regeneration activities of culturable waste and degraded land we will have to
keep the following factors in mind:
(a) Size of such land in contiguity;
(b) Nature of regeneration programme;
(c) Raising of capital and acquisition of technical support
(d) Incentive for participation of interested landless peasants and capacity building;
(e) Changes in the tenural rights over such land; and
(f) Distribution of benefits.
Keeping these in view we suggest another model in which local people could be involved,
and its economic viability could be ensured.
We suggest that a joint venture of state sector with local organisation be formed for this
purpose.
As a first step a Collective Land Development Society (or Self Help Group for Land
Development) be formed at local level. This Collective Land Development Society or SHG
should enter into a contract with any state department, which has been approved for the
purpose by the government.
(vii) Land Development Society/SHG for Land Development
(a) A Land Development Society or SHG shall be formed for a land chunk of 10
to 25 acres.
(b) The chunk of land be divided into 10-20 equal size sub-chunks.
(c) Lease out around 1 acre of such sub-chunk land piece to one landless family each.
(d) The tenure holder, in turn, will have to become member of the Land Development
Society or SHG.
(viii) Joint Venture
A Public Corporate Organisation (approved by the government for the purpose) will then
enter into an agreement with Land Development Society or SHG for a minimum of ten years
for jointly developing the land and for its utilization.
(a) Members of Land Development Society or SHG would provide land and labour;
(b) Public Corporate Organisation will provide capital, technology and technical know-how;
(c) A joint management system will be evolved;
(d) One-third of the profit shall be ploughed back for further raising the capital stock of the
joint venture.
78
(e) The rest of the profit shall be shared on 50:50 basis between the state unit and Land
Development Society.
4.2.3 Village Level (i) The land use plan is almost finalized after consolidation of holdings is implemented in a
village. It provides land for various purposes in the village besides consolidating holdings.
These include -
(a) provision of roads and public irrigation channels,
(b) provision of land for house sites for scheduled castes and other weaker sections,
(c) provision of sector roads, inter village roads and link roads,
(d) provision of land for community purposes namely – schools, playgrounds, panchayat
ghar, hospital, cremation ground, graveyards, threshing floor, manure pits, pasture land,
plantation trees, flaying sites etc.
(e) solving of common disputes in the village regarding roads/naalis for irrigation for each
field through chak roads and chak naalis.
The problem is that powerful persons in the village influence functionaries of the
consolidation work and get some of government and community land located near their
farms. And once consolidation work is over, they easily encroach upon such community
land.
Therefore effort should be made that Bachat and Gram Sabha land is not left scattered at
many places. The consolidation process should also consolidate government and gram
sabha land in one or two large consolidated chaks.
The land which had been carved out as orchard, grazing land or pond/tank in the past,
should not be allowed to be transferred for other purposes by new rounds of consolidation –
neither through chak carvation nor through readjustment of gram sabha land.
(ii) Whenever chakbandi is declared, illegal felling of trees takes place, land under orchards or
pasture or such other uses is sought to be shown as land under cultivation. This happens on
a large scale specially on Gaon Sabha and government land. In order to check such
changes in land use on the eve of consolidation, revenue officials and consolidation officials
should jointly prepare reports and send report to concerned courts for quick action. The
power to decide such cases should be assigned to concerned SDM.
Similarly provisions of Consolidation of Holdings Act and Manual regarding provision of
inter-village link road, bachat land, Gaon Sabha and Government land and other common
property resources should be widely made known to people so that its strict implementation
is done with peoples participation.
(iii) After consolidation is over land use for each plot of the villages is well defined.
It should be the responsibility of LMC to see that land use is not alterned. There should be
training of LMC members to make them aware of their roles and responsibilities.
(iv) Land Management Committee should be treated as Chakbandi Committee during the period
of consolidation. Formation of separate committee does not prove helpful as it is at the
79
mercy of consolidation department and Pradhan only and ceases to exist after consolidation
work is over.
(v) All members of Chakbandi Committee should sign the final land use map prepared after
consolidation work is over.
(vi) The map of the village should be made available to all the members of Land Management
Committee, free of cost.
(vii) Encroachers of government and/or gram sabha land should be severely penalised and
eviction proceedings against them should be made more stringent.
(viii) Land capability maps be prepared for each village. The land use of each type of land could
then be planned for effective, efficient, sustainable and profitable use.
The land capability map will indicate about the texture and quality of soil. It will also give
information about limitations of the land such as erosion, water logging, degree of alkalinity
or salinity etc.
Thus land capability maps would provide necessary inputs for land use planning i.e.
suitability of land for agriculture, horticulture, forestry etc. It will also indicate as to what
measures would be needed for improving land for its optimum utilisation.
(ix) The Land Management Committee at the village level be revamped. And there should be
fair representation of weaker sections, beneficiaries of land allottees, self help groups and
all the hamlets/communities of the village.
The committee should meet once every six months, develop plans for water conservation,
drainage channels, regeneration of degraded land, effective use of lands in the category of
(a) barren and uncultivable land, (b) pastures, (c) orchards groves and land under trees and
(d) fallow land.
(x) There are already legal provisions under consolidation of Holdings Act and Supreme Court
Judgements in regard to protection of land uses. These should be widely circulated among
members of Land Management Committee. Proceedings for eviction of encroachers should
be launched in right earnest. The provision should be made in law for eviction of
unauthorised occupation of Gram Sabha land by summary proceedings.
(xi) The gaon sabha land or pond or forest land should be given on lease to self help groups or
tree growers society or such other collective groups rather than to individuals.
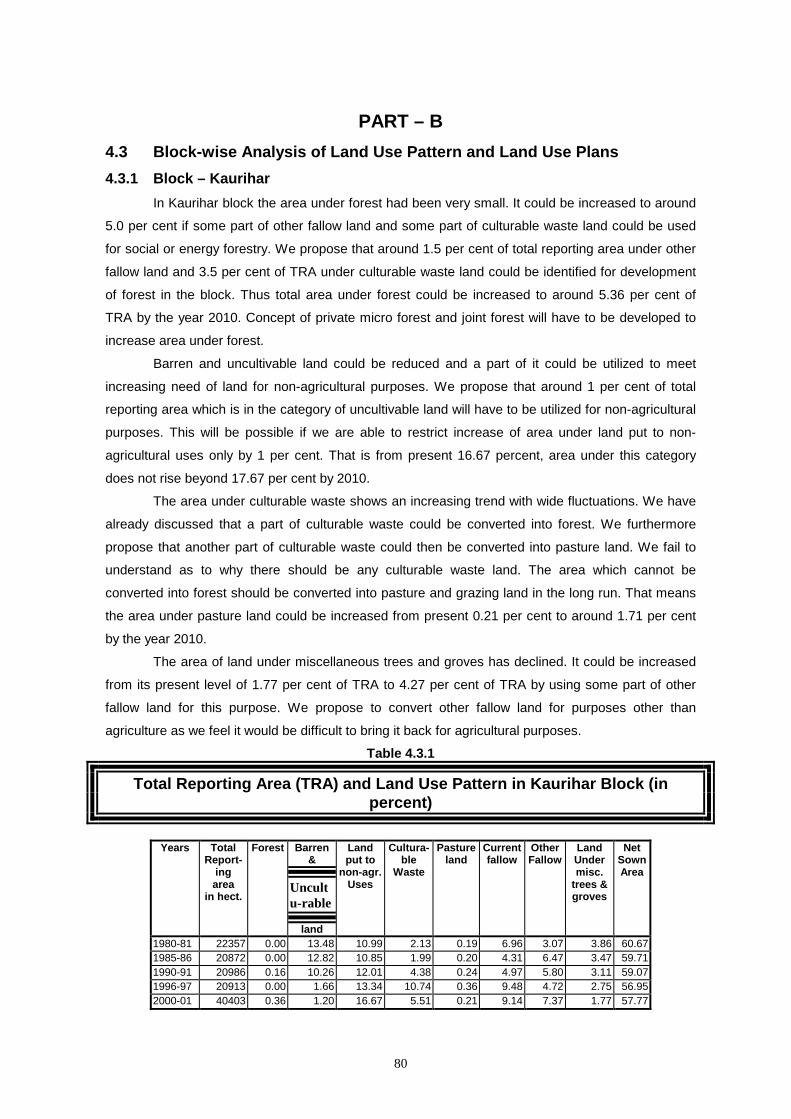
80
PART – B
4.3 Block-wise Analysis of Land Use Pattern and Land Use Plans 4.3.1 Block – Kaurihar In Kaurihar block the area under forest had been very small. It could be increased to around
5.0 per cent if some part of other fallow land and some part of culturable waste land could be used
for social or energy forestry. We propose that around 1.5 per cent of total reporting area under other
fallow land and 3.5 per cent of TRA under culturable waste land could be identified for development
of forest in the block. Thus total area under forest could be increased to around 5.36 per cent of
TRA by the year 2010. Concept of private micro forest and joint forest will have to be developed to
increase area under forest.
Barren and uncultivable land could be reduced and a part of it could be utilized to meet
increasing need of land for non-agricultural purposes. We propose that around 1 per cent of total
reporting area which is in the category of uncultivable land will have to be utilized for non-agricultural
purposes. This will be possible if we are able to restrict increase of area under land put to non-
agricultural uses only by 1 per cent. That is from present 16.67 percent, area under this category
does not rise beyond 17.67 per cent by 2010.
The area under culturable waste shows an increasing trend with wide fluctuations. We have
already discussed that a part of culturable waste could be converted into forest. We furthermore
propose that another part of culturable waste could then be converted into pasture land. We fail to
understand as to why there should be any culturable waste land. The area which cannot be
converted into forest should be converted into pasture and grazing land in the long run. That means
the area under pasture land could be increased from present 0.21 per cent to around 1.71 per cent
by the year 2010.
The area of land under miscellaneous trees and groves has declined. It could be increased
from its present level of 1.77 per cent of TRA to 4.27 per cent of TRA by using some part of other
fallow land for this purpose. We propose to convert other fallow land for purposes other than
agriculture as we feel it would be difficult to bring it back for agricultural purposes.
Table 4.3.1
Total Reporting Area (TRA) and Land Use Pattern in Kaurihar Block (in percent)
Years Total
Report-ing area
in hect.
Forest Barren &
Uncultu-rable
land
Land put to
non-agr.Uses
Cultura-ble
Waste
Pastureland
Currentfallow
Other Fallow
Land Under misc.
trees & groves
Net Sown Area
1980-81 22357 0.00 13.48 10.99 2.13 0.19 6.96 3.07 3.86 60.67 1985-86 20872 0.00 12.82 10.85 1.99 0.20 4.31 6.47 3.47 59.71 1990-91 20986 0.16 10.26 12.01 4.38 0.24 4.97 5.80 3.11 59.07 1996-97 20913 0.00 1.66 13.34 10.74 0.36 9.48 4.72 2.75 56.95 2000-01 40403 0.36 1.20 16.67 5.51 0.21 9.14 7.37 1.77 57.77

81
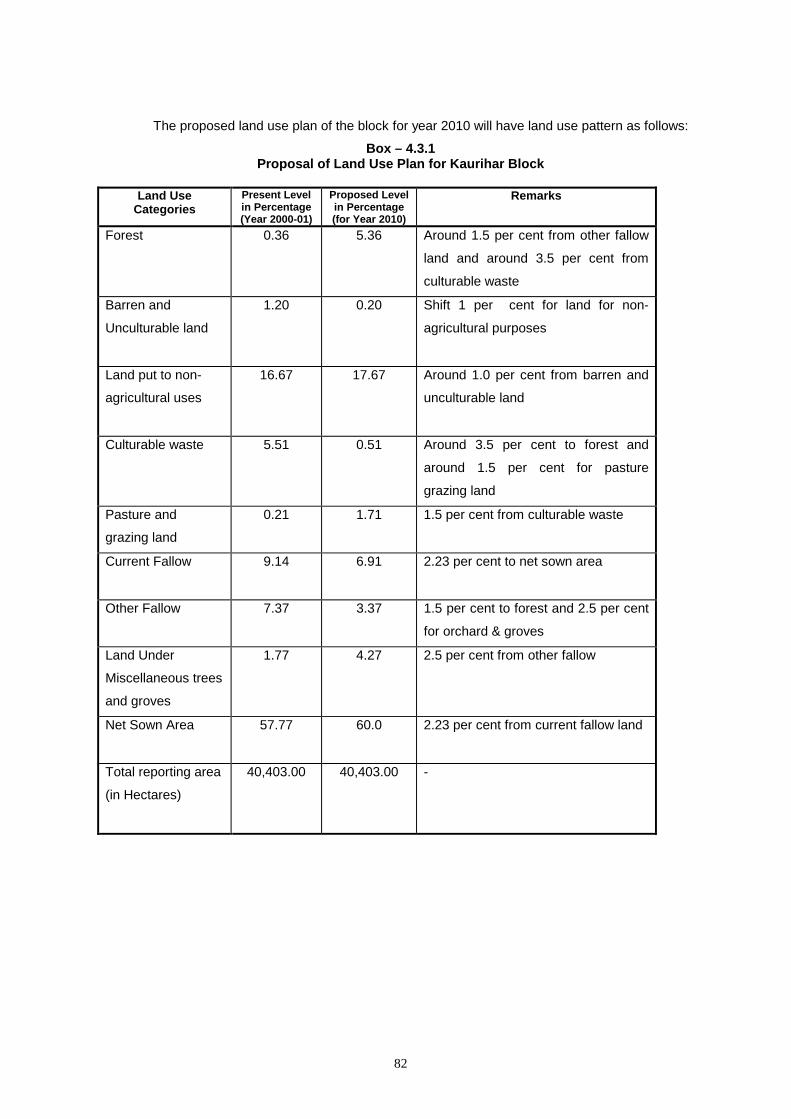
82
The proposed land use plan of the block for year 2010 will have land use pattern as follows:
Box – 4.3.1 Proposal of Land Use Plan for Kaurihar Block
Land Use
Categories Present Level in Percentage (Year 2000-01)
Proposed Level in Percentage (for Year 2010)
Remarks
Forest 0.36 5.36 Around 1.5 per cent from other fallow
land and around 3.5 per cent from
culturable waste
Barren and
Unculturable land
1.20 0.20 Shift 1 per cent for land for non-
agricultural purposes
Land put to non-
agricultural uses
16.67 17.67 Around 1.0 per cent from barren and
unculturable land
Culturable waste 5.51 0.51 Around 3.5 per cent to forest and
around 1.5 per cent for pasture
grazing land
Pasture and
grazing land
0.21 1.71 1.5 per cent from culturable waste
Current Fallow
9.14 6.91 2.23 per cent to net sown area
Other Fallow 7.37 3.37 1.5 per cent to forest and 2.5 per cent
for orchard & groves
Land Under
Miscellaneous trees
and groves
1.77 4.27 2.5 per cent from other fallow
Net Sown Area
57.77 60.0 2.23 per cent from current fallow land
Total reporting area
(in Hectares)
40,403.00 40,403.00 -
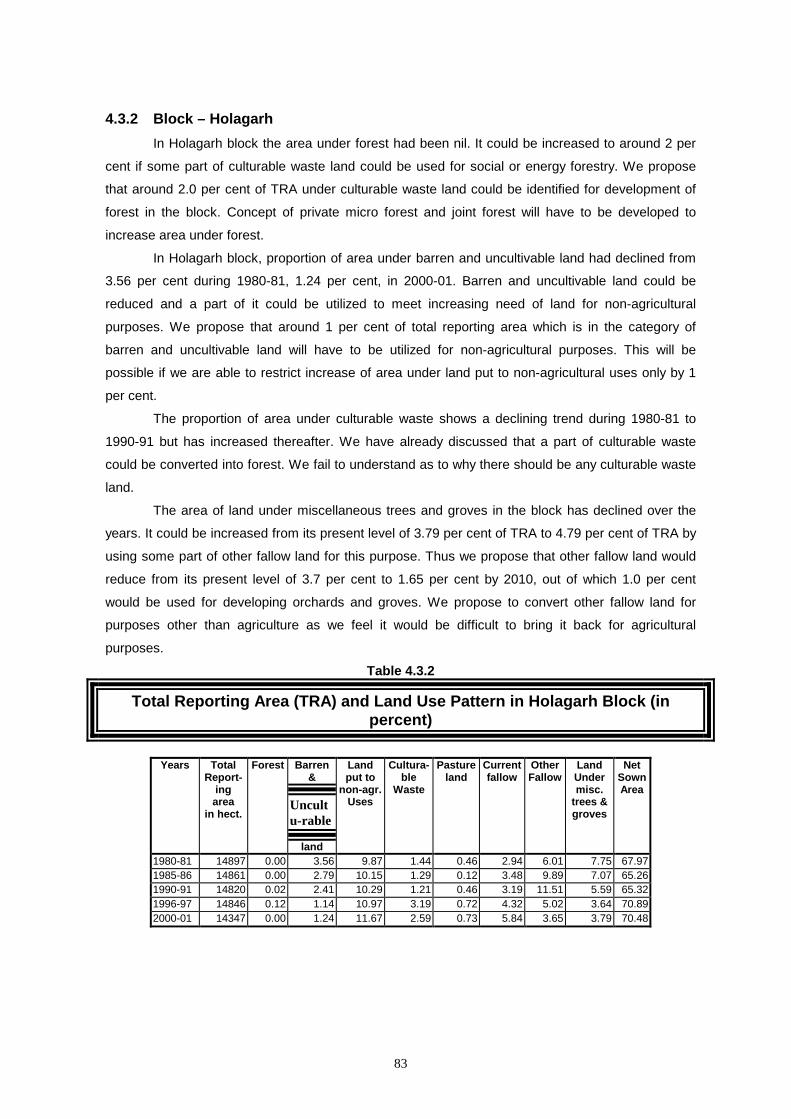
83
4.3.2 Block – Holagarh In Holagarh block the area under forest had been nil. It could be increased to around 2 per
cent if some part of culturable waste land could be used for social or energy forestry. We propose
that around 2.0 per cent of TRA under culturable waste land could be identified for development of
forest in the block. Concept of private micro forest and joint forest will have to be developed to
increase area under forest.
In Holagarh block, proportion of area under barren and uncultivable land had declined from
3.56 per cent during 1980-81, 1.24 per cent, in 2000-01. Barren and uncultivable land could be
reduced and a part of it could be utilized to meet increasing need of land for non-agricultural
purposes. We propose that around 1 per cent of total reporting area which is in the category of
barren and uncultivable land will have to be utilized for non-agricultural purposes. This will be
possible if we are able to restrict increase of area under land put to non-agricultural uses only by 1
per cent.
The proportion of area under culturable waste shows a declining trend during 1980-81 to
1990-91 but has increased thereafter. We have already discussed that a part of culturable waste
could be converted into forest. We fail to understand as to why there should be any culturable waste
land.
The area of land under miscellaneous trees and groves in the block has declined over the
years. It could be increased from its present level of 3.79 per cent of TRA to 4.79 per cent of TRA by
using some part of other fallow land for this purpose. Thus we propose that other fallow land would
reduce from its present level of 3.7 per cent to 1.65 per cent by 2010, out of which 1.0 per cent
would be used for developing orchards and groves. We propose to convert other fallow land for
purposes other than agriculture as we feel it would be difficult to bring it back for agricultural
purposes.
Table 4.3.2
Total Reporting Area (TRA) and Land Use Pattern in Holagarh Block (in percent)
Years Total
Report-ing area
in hect.
Forest Barren &
Uncultu-rable
land
Land put to
non-agr.Uses
Cultura-ble
Waste
Pastureland
Currentfallow
Other Fallow
Land Under misc.
trees & groves
Net Sown Area
1980-81 14897 0.00 3.56 9.87 1.44 0.46 2.94 6.01 7.75 67.97 1985-86 14861 0.00 2.79 10.15 1.29 0.12 3.48 9.89 7.07 65.26 1990-91 14820 0.02 2.41 10.29 1.21 0.46 3.19 11.51 5.59 65.32 1996-97 14846 0.12 1.14 10.97 3.19 0.72 4.32 5.02 3.64 70.89 2000-01 14347 0.00 1.24 11.67 2.59 0.73 5.84 3.65 3.79 70.48

84
The proposed land use plan of the block for year 2010 will have land use pattern as follows:
Box – 4.3.2 Proposal of Land Use Plan for Holagarh Block
Land Use
Categories Present Level in Percentage (Year 2000-01)
Proposed Level in Percentage (for Year 2010)
Remarks
Forest - 2.00 2.0 per cent from culturable waste
Barren and
Unculturable land
1.24 0.24 Shift 1.0 per cent for land for non-
agricultural purposes
Land put to non-
agricultural uses
11.67 12.67 Around 1.0 per cent from barren and
unculturable land
Culturable waste 2.59 0.59 Around 2.0 per cent to forest
Pasture and
grazing land
0.73 1.73 1.0 per cent from other fallow land
Current Fallow
5.84 5.84 -
Other Fallow 3.65 1.65 1.0 per cent to pasture and grazing
land and 1.0 per cent for orchard &
groves
Land Under
Miscellaneous trees
and groves
3.79 4.79 1.0 per cent from other fallow
Net Sown Area
70.48 70.48 -
Total reporting area
(in Hectares)
14,347.00 14,347.00 -
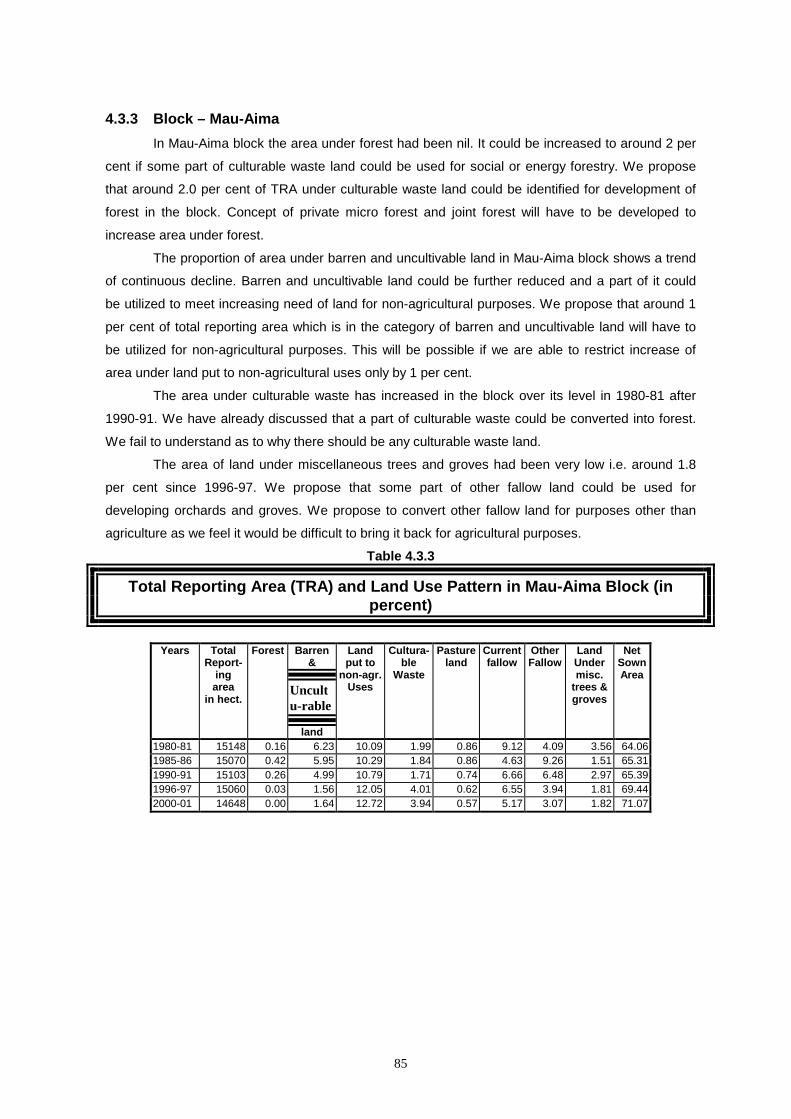
85
4.3.3 Block – Mau-Aima In Mau-Aima block the area under forest had been nil. It could be increased to around 2 per
cent if some part of culturable waste land could be used for social or energy forestry. We propose
that around 2.0 per cent of TRA under culturable waste land could be identified for development of
forest in the block. Concept of private micro forest and joint forest will have to be developed to
increase area under forest.
The proportion of area under barren and uncultivable land in Mau-Aima block shows a trend
of continuous decline. Barren and uncultivable land could be further reduced and a part of it could
be utilized to meet increasing need of land for non-agricultural purposes. We propose that around 1
per cent of total reporting area which is in the category of barren and uncultivable land will have to
be utilized for non-agricultural purposes. This will be possible if we are able to restrict increase of
area under land put to non-agricultural uses only by 1 per cent.
The area under culturable waste has increased in the block over its level in 1980-81 after
1990-91. We have already discussed that a part of culturable waste could be converted into forest.
We fail to understand as to why there should be any culturable waste land.
The area of land under miscellaneous trees and groves had been very low i.e. around 1.8
per cent since 1996-97. We propose that some part of other fallow land could be used for
developing orchards and groves. We propose to convert other fallow land for purposes other than
agriculture as we feel it would be difficult to bring it back for agricultural purposes.
Table 4.3.3
Total Reporting Area (TRA) and Land Use Pattern in Mau-Aima Block (in percent)
Years Total
Report-ing area
in hect.
Forest Barren &
Uncultu-rable
land
Land put to
non-agr.Uses
Cultura-ble
Waste
Pastureland
Currentfallow
Other Fallow
Land Under misc.
trees & groves
Net Sown Area
1980-81 15148 0.16 6.23 10.09 1.99 0.86 9.12 4.09 3.56 64.06 1985-86 15070 0.42 5.95 10.29 1.84 0.86 4.63 9.26 1.51 65.31 1990-91 15103 0.26 4.99 10.79 1.71 0.74 6.66 6.48 2.97 65.39 1996-97 15060 0.03 1.56 12.05 4.01 0.62 6.55 3.94 1.81 69.44 2000-01 14648 0.00 1.64 12.72 3.94 0.57 5.17 3.07 1.82 71.07
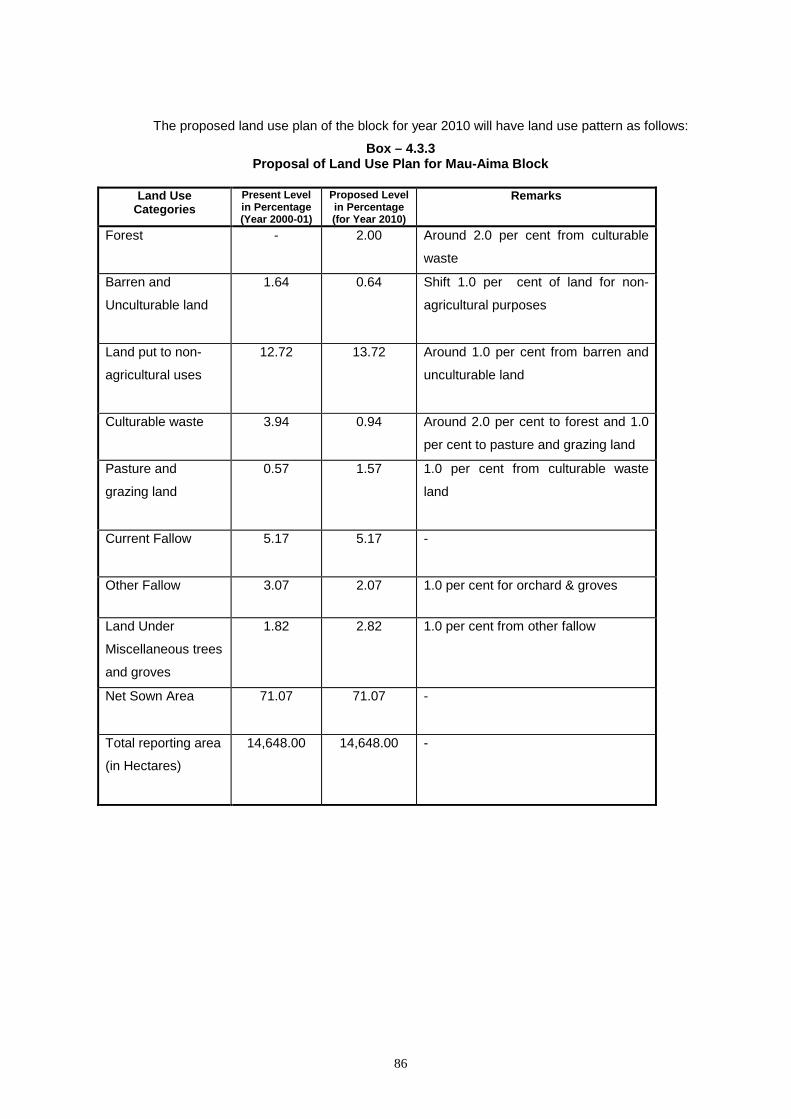
86
The proposed land use plan of the block for year 2010 will have land use pattern as follows:
Box – 4.3.3 Proposal of Land Use Plan for Mau-Aima Block
Land Use
Categories Present Level in Percentage (Year 2000-01)
Proposed Level in Percentage (for Year 2010)
Remarks
Forest - 2.00 Around 2.0 per cent from culturable
waste
Barren and
Unculturable land
1.64 0.64 Shift 1.0 per cent of land for non-
agricultural purposes
Land put to non-
agricultural uses
12.72 13.72 Around 1.0 per cent from barren and
unculturable land
Culturable waste 3.94 0.94 Around 2.0 per cent to forest and 1.0
per cent to pasture and grazing land
Pasture and
grazing land
0.57 1.57 1.0 per cent from culturable waste
land
Current Fallow
5.17 5.17 -
Other Fallow 3.07 2.07 1.0 per cent for orchard & groves
Land Under
Miscellaneous trees
and groves
1.82 2.82 1.0 per cent from other fallow
Net Sown Area
71.07 71.07 -
Total reporting area
(in Hectares)
14,648.00 14,648.00 -
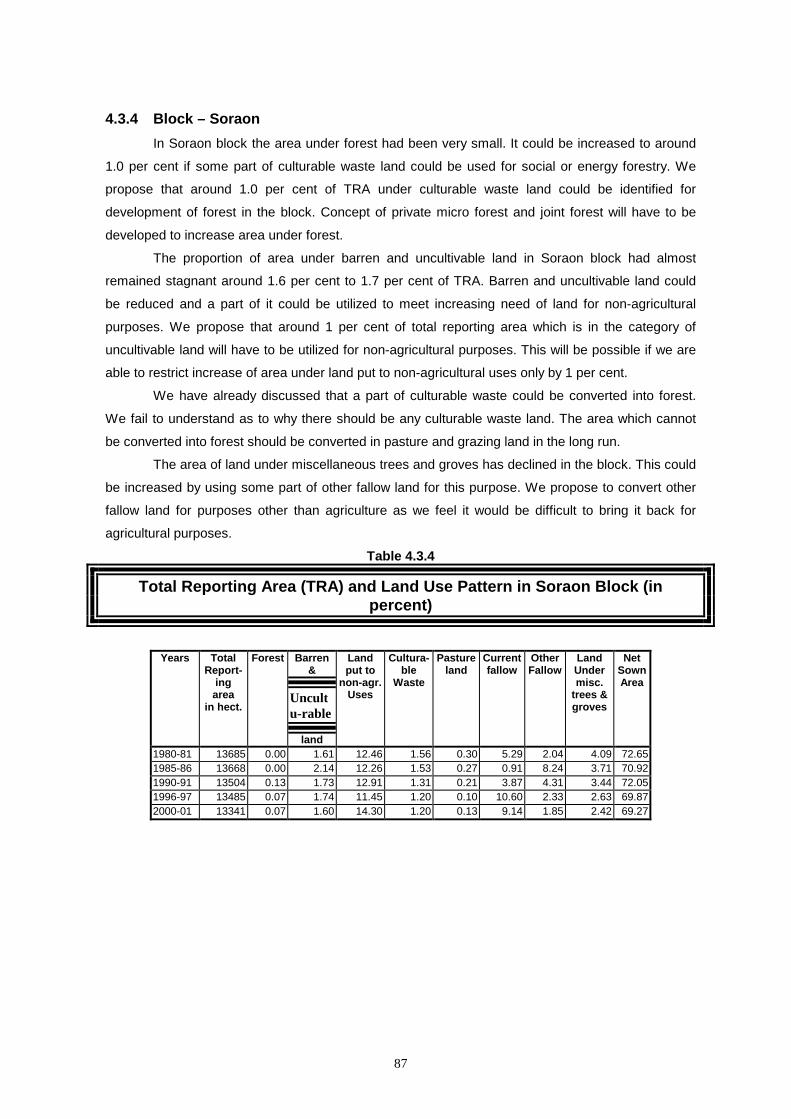
87
4.3.4 Block – Soraon In Soraon block the area under forest had been very small. It could be increased to around
1.0 per cent if some part of culturable waste land could be used for social or energy forestry. We
propose that around 1.0 per cent of TRA under culturable waste land could be identified for
development of forest in the block. Concept of private micro forest and joint forest will have to be
developed to increase area under forest.
The proportion of area under barren and uncultivable land in Soraon block had almost
remained stagnant around 1.6 per cent to 1.7 per cent of TRA. Barren and uncultivable land could
be reduced and a part of it could be utilized to meet increasing need of land for non-agricultural
purposes. We propose that around 1 per cent of total reporting area which is in the category of
uncultivable land will have to be utilized for non-agricultural purposes. This will be possible if we are
able to restrict increase of area under land put to non-agricultural uses only by 1 per cent.
We have already discussed that a part of culturable waste could be converted into forest.
We fail to understand as to why there should be any culturable waste land. The area which cannot
be converted into forest should be converted in pasture and grazing land in the long run.
The area of land under miscellaneous trees and groves has declined in the block. This could
be increased by using some part of other fallow land for this purpose. We propose to convert other
fallow land for purposes other than agriculture as we feel it would be difficult to bring it back for
agricultural purposes.
Table 4.3.4
Total Reporting Area (TRA) and Land Use Pattern in Soraon Block (in percent)
Years Total Report-
ing area
in hect.
Forest Barren &
Uncultu-rable
land
Land put to
non-agr.Uses
Cultura-ble
Waste
Pastureland
Currentfallow
Other Fallow
Land Under misc.
trees & groves
Net Sown Area
1980-81 13685 0.00 1.61 12.46 1.56 0.30 5.29 2.04 4.09 72.65 1985-86 13668 0.00 2.14 12.26 1.53 0.27 0.91 8.24 3.71 70.92 1990-91 13504 0.13 1.73 12.91 1.31 0.21 3.87 4.31 3.44 72.05 1996-97 13485 0.07 1.74 11.45 1.20 0.10 10.60 2.33 2.63 69.87 2000-01 13341 0.07 1.60 14.30 1.20 0.13 9.14 1.85 2.42 69.27

88
The proposed land use plan of the block for year 2010 will have land use pattern as follows:
Box – 4.3.4 Proposal of Land Use Plan for Soraon Block
Land Use Categories
Present Level in Percentage (Year 2000-01)
Proposed Level in Percentage (for Year 2010)
Remarks
Forest 0.07 1.07 Around 1.0per cent from culturable
waste
Barren and
Unculturable land
1.60 0.60 Shift 1.0 per cent of such land for
non-agricultural purposes
Land put to non-
agricultural uses
14.30 15.30 Around 1.0 per cent from barren and
unculturable land
Culturable waste 1.20 0.20 Around 1.0 per cent to forest
Pasture and
grazing land
0.13 0.51 -
Current Fallow
9.14 9.14 -
Other Fallow 1.85 0.85 Around 1.0 per cent to orchards
Land Under
Miscellaneous trees
and groves
2.42 3.42 1.0 per cent from other fallow land
Net Sown Area
76.32 76.32 -
Total reporting area
(in Hectares)
13,341.00 13,341.00 -
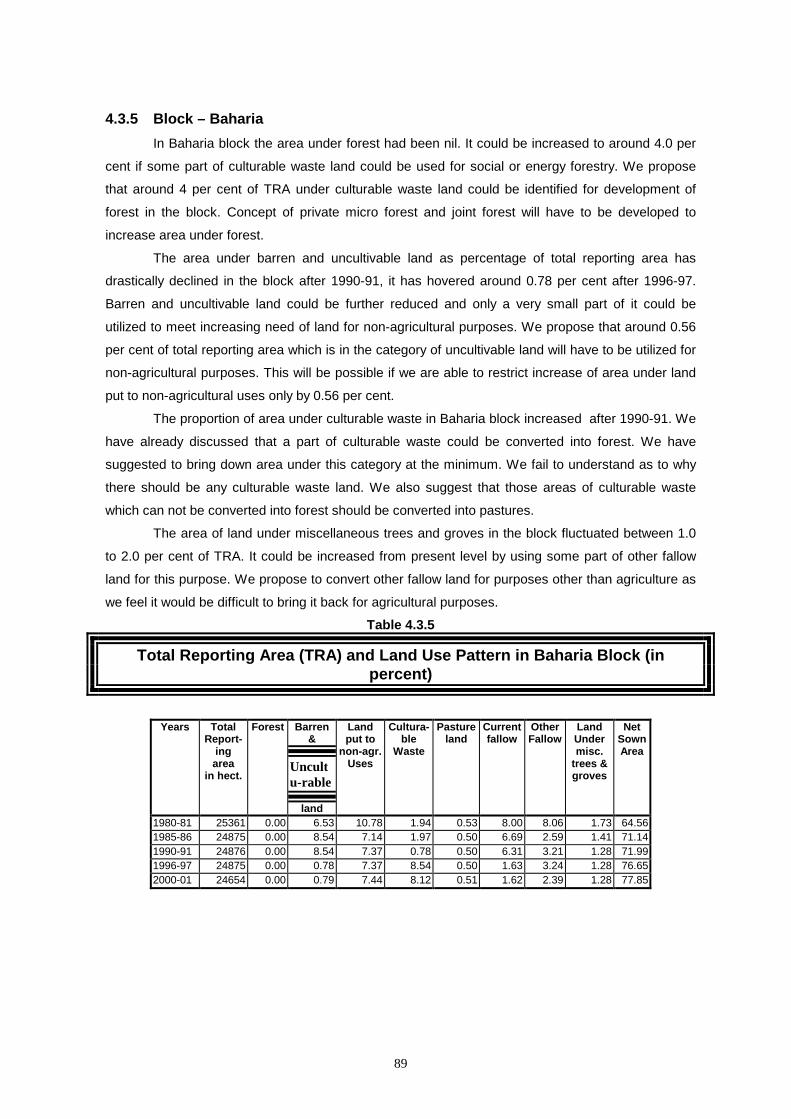
89
4.3.5 Block – Baharia In Baharia block the area under forest had been nil. It could be increased to around 4.0 per
cent if some part of culturable waste land could be used for social or energy forestry. We propose
that around 4 per cent of TRA under culturable waste land could be identified for development of
forest in the block. Concept of private micro forest and joint forest will have to be developed to
increase area under forest.
The area under barren and uncultivable land as percentage of total reporting area has
drastically declined in the block after 1990-91, it has hovered around 0.78 per cent after 1996-97.
Barren and uncultivable land could be further reduced and only a very small part of it could be
utilized to meet increasing need of land for non-agricultural purposes. We propose that around 0.56
per cent of total reporting area which is in the category of uncultivable land will have to be utilized for
non-agricultural purposes. This will be possible if we are able to restrict increase of area under land
put to non-agricultural uses only by 0.56 per cent.
The proportion of area under culturable waste in Baharia block increased after 1990-91. We
have already discussed that a part of culturable waste could be converted into forest. We have
suggested to bring down area under this category at the minimum. We fail to understand as to why
there should be any culturable waste land. We also suggest that those areas of culturable waste
which can not be converted into forest should be converted into pastures.
The area of land under miscellaneous trees and groves in the block fluctuated between 1.0
to 2.0 per cent of TRA. It could be increased from present level by using some part of other fallow
land for this purpose. We propose to convert other fallow land for purposes other than agriculture as
we feel it would be difficult to bring it back for agricultural purposes.
Table 4.3.5
Total Reporting Area (TRA) and Land Use Pattern in Baharia Block (in percent)
Years Total Report-
ing area
in hect.
Forest Barren &
Uncultu-rable
land
Land put to
non-agr.Uses
Cultura-ble
Waste
Pastureland
Currentfallow
Other Fallow
Land Under misc.
trees & groves
Net Sown Area
1980-81 25361 0.00 6.53 10.78 1.94 0.53 8.00 8.06 1.73 64.56 1985-86 24875 0.00 8.54 7.14 1.97 0.50 6.69 2.59 1.41 71.14 1990-91 24876 0.00 8.54 7.37 0.78 0.50 6.31 3.21 1.28 71.99 1996-97 24875 0.00 0.78 7.37 8.54 0.50 1.63 3.24 1.28 76.65 2000-01 24654 0.00 0.79 7.44 8.12 0.51 1.62 2.39 1.28 77.85

90
The proposed land use plan of the block for year 2010 will have land use pattern as follows:
Box – 4.3.5 Proposal of Land Use Plan for Baharia Block
Land Use
Categories Present Level in Percentage (Year 2000-01)
Proposed Level in Percentage (for Year 2010)
Remarks
Forest - 4.0 Around 4.0 per cent from culturable
waste land
Barren and
Unculturable land
0.79 0.23 Shift 0.56 per cent for land for non-
agricultural purposes
Land put to non-
agricultural uses
7.44 8.0 Around 0.56 per cent from barren and
unculturable land
Culturable waste 8.12 2.12 Around 4.0 per cent to forest and 2.0
per cent to grazing land
Pasture and
grazing land
0.51 2.51 2.0 per cent from culturable waste
land
Current Fallow
1.62 1.62 -
Other Fallow 2.39 1.39 1.0 per cent for orchard & groves
Land Under
Miscellaneous trees
and groves
1.28 2.28 1.0 per cent from other fallow
Net Sown Area
77.85 77.85 -
Total reporting area
(in Hectares)
24,654.00 24,654.00 -
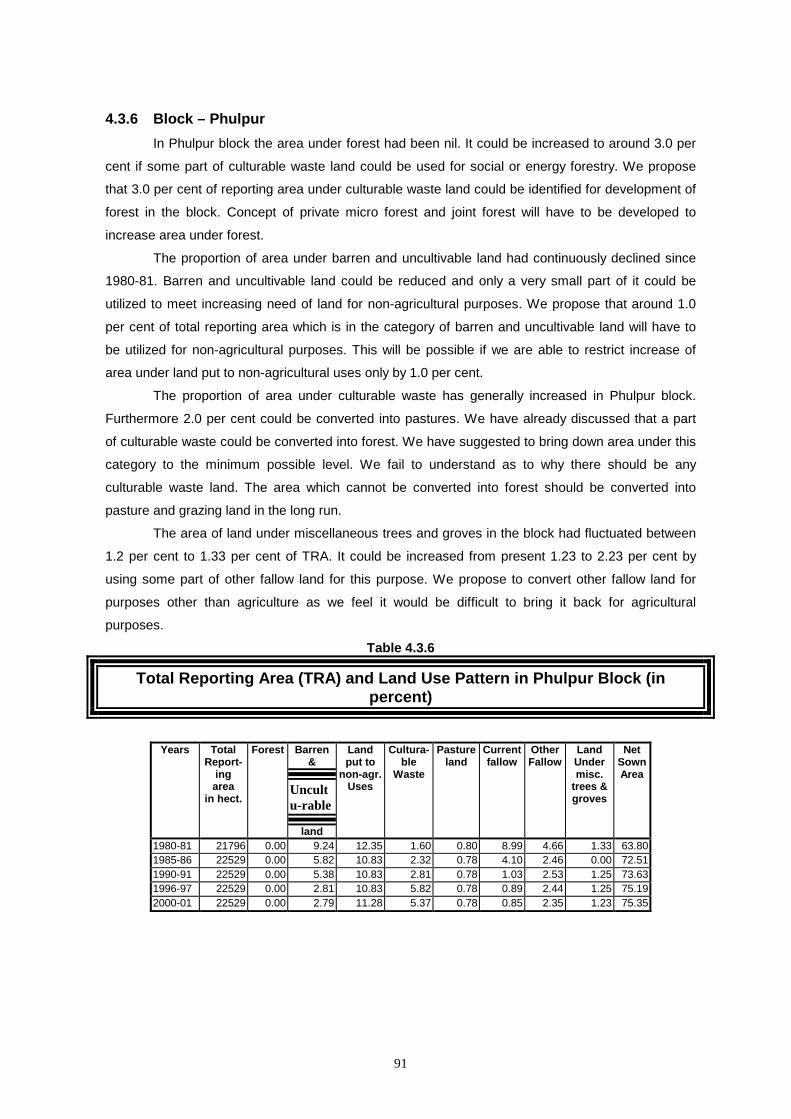
91
4.3.6 Block – Phulpur In Phulpur block the area under forest had been nil. It could be increased to around 3.0 per
cent if some part of culturable waste land could be used for social or energy forestry. We propose
that 3.0 per cent of reporting area under culturable waste land could be identified for development of
forest in the block. Concept of private micro forest and joint forest will have to be developed to
increase area under forest.
The proportion of area under barren and uncultivable land had continuously declined since
1980-81. Barren and uncultivable land could be reduced and only a very small part of it could be
utilized to meet increasing need of land for non-agricultural purposes. We propose that around 1.0
per cent of total reporting area which is in the category of barren and uncultivable land will have to
be utilized for non-agricultural purposes. This will be possible if we are able to restrict increase of
area under land put to non-agricultural uses only by 1.0 per cent.
The proportion of area under culturable waste has generally increased in Phulpur block.
Furthermore 2.0 per cent could be converted into pastures. We have already discussed that a part
of culturable waste could be converted into forest. We have suggested to bring down area under this
category to the minimum possible level. We fail to understand as to why there should be any
culturable waste land. The area which cannot be converted into forest should be converted into
pasture and grazing land in the long run.
The area of land under miscellaneous trees and groves in the block had fluctuated between
1.2 per cent to 1.33 per cent of TRA. It could be increased from present 1.23 to 2.23 per cent by
using some part of other fallow land for this purpose. We propose to convert other fallow land for
purposes other than agriculture as we feel it would be difficult to bring it back for agricultural
purposes.
Table 4.3.6
Total Reporting Area (TRA) and Land Use Pattern in Phulpur Block (in percent)
Years Total Report-
ing area
in hect.
Forest Barren &
Uncultu-rable
land
Land put to
non-agr.Uses
Cultura-ble
Waste
Pastureland
Currentfallow
Other Fallow
Land Under misc.
trees & groves
Net Sown Area
1980-81 21796 0.00 9.24 12.35 1.60 0.80 8.99 4.66 1.33 63.80 1985-86 22529 0.00 5.82 10.83 2.32 0.78 4.10 2.46 0.00 72.51 1990-91 22529 0.00 5.38 10.83 2.81 0.78 1.03 2.53 1.25 73.63 1996-97 22529 0.00 2.81 10.83 5.82 0.78 0.89 2.44 1.25 75.19 2000-01 22529 0.00 2.79 11.28 5.37 0.78 0.85 2.35 1.23 75.35
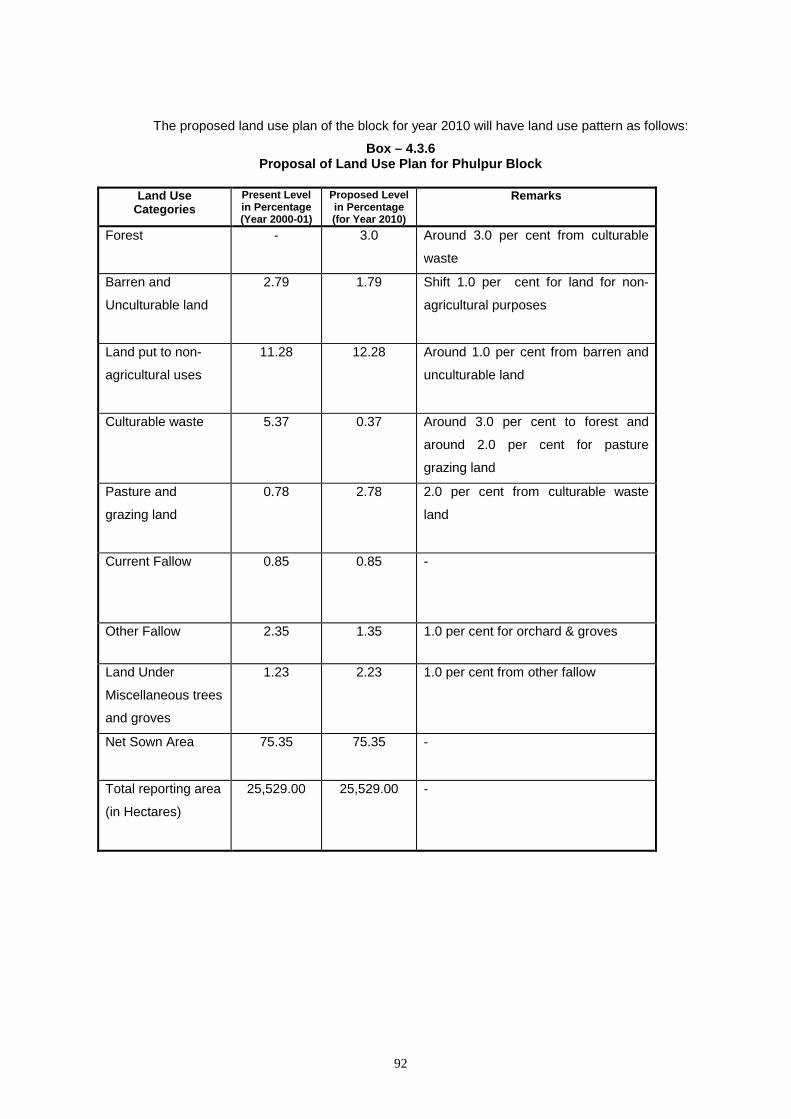
92
The proposed land use plan of the block for year 2010 will have land use pattern as follows:
Box – 4.3.6 Proposal of Land Use Plan for Phulpur Block
Land Use
Categories Present Level in Percentage (Year 2000-01)
Proposed Level in Percentage (for Year 2010)
Remarks
Forest - 3.0 Around 3.0 per cent from culturable
waste
Barren and
Unculturable land
2.79 1.79 Shift 1.0 per cent for land for non-
agricultural purposes
Land put to non-
agricultural uses
11.28 12.28 Around 1.0 per cent from barren and
unculturable land
Culturable waste 5.37 0.37 Around 3.0 per cent to forest and
around 2.0 per cent for pasture
grazing land
Pasture and
grazing land
0.78 2.78 2.0 per cent from culturable waste
land
Current Fallow
0.85 0.85 -
Other Fallow 2.35 1.35 1.0 per cent for orchard & groves
Land Under
Miscellaneous trees
and groves
1.23 2.23 1.0 per cent from other fallow
Net Sown Area
75.35 75.35 -
Total reporting area
(in Hectares)
25,529.00 25,529.00 -
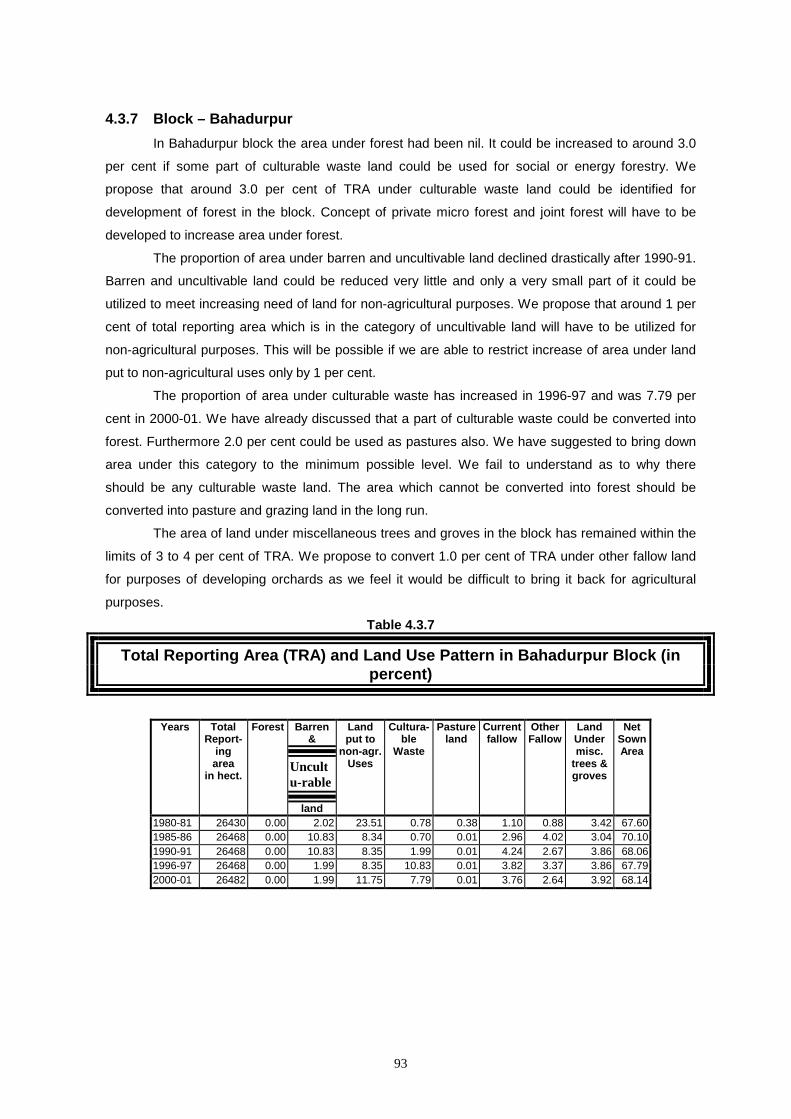
93
4.3.7 Block – Bahadurpur In Bahadurpur block the area under forest had been nil. It could be increased to around 3.0
per cent if some part of culturable waste land could be used for social or energy forestry. We
propose that around 3.0 per cent of TRA under culturable waste land could be identified for
development of forest in the block. Concept of private micro forest and joint forest will have to be
developed to increase area under forest.
The proportion of area under barren and uncultivable land declined drastically after 1990-91.
Barren and uncultivable land could be reduced very little and only a very small part of it could be
utilized to meet increasing need of land for non-agricultural purposes. We propose that around 1 per
cent of total reporting area which is in the category of uncultivable land will have to be utilized for
non-agricultural purposes. This will be possible if we are able to restrict increase of area under land
put to non-agricultural uses only by 1 per cent.
The proportion of area under culturable waste has increased in 1996-97 and was 7.79 per
cent in 2000-01. We have already discussed that a part of culturable waste could be converted into
forest. Furthermore 2.0 per cent could be used as pastures also. We have suggested to bring down
area under this category to the minimum possible level. We fail to understand as to why there
should be any culturable waste land. The area which cannot be converted into forest should be
converted into pasture and grazing land in the long run.
The area of land under miscellaneous trees and groves in the block has remained within the
limits of 3 to 4 per cent of TRA. We propose to convert 1.0 per cent of TRA under other fallow land
for purposes of developing orchards as we feel it would be difficult to bring it back for agricultural
purposes.
Table 4.3.7
Total Reporting Area (TRA) and Land Use Pattern in Bahadurpur Block (in percent)
Years Total Report-
ing area
in hect.
Forest Barren &
Uncultu-rable
land
Land put to
non-agr.Uses
Cultura-ble
Waste
Pastureland
Currentfallow
Other Fallow
Land Under misc.
trees & groves
Net Sown Area
1980-81 26430 0.00 2.02 23.51 0.78 0.38 1.10 0.88 3.42 67.60 1985-86 26468 0.00 10.83 8.34 0.70 0.01 2.96 4.02 3.04 70.10 1990-91 26468 0.00 10.83 8.35 1.99 0.01 4.24 2.67 3.86 68.06 1996-97 26468 0.00 1.99 8.35 10.83 0.01 3.82 3.37 3.86 67.79 2000-01 26482 0.00 1.99 11.75 7.79 0.01 3.76 2.64 3.92 68.14
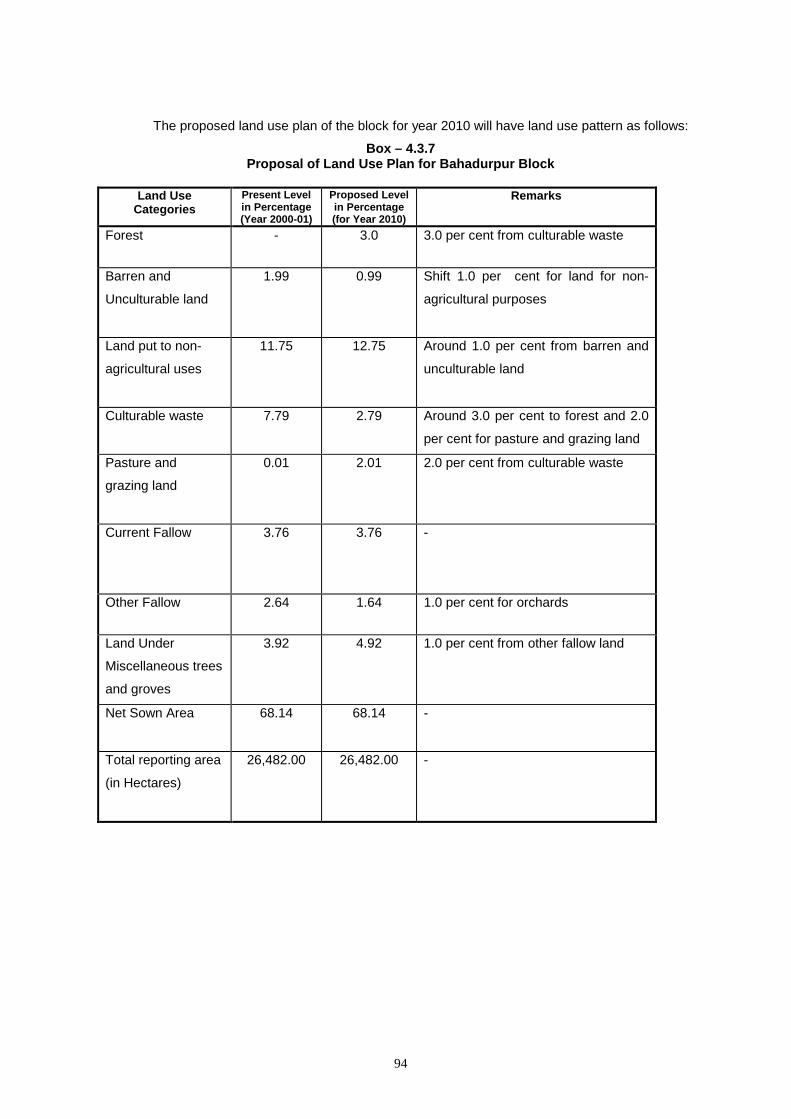
94
The proposed land use plan of the block for year 2010 will have land use pattern as follows:
Box – 4.3.7 Proposal of Land Use Plan for Bahadurpur Block
Land Use
Categories Present Level in Percentage (Year 2000-01)
Proposed Level in Percentage (for Year 2010)
Remarks
Forest - 3.0 3.0 per cent from culturable waste
Barren and
Unculturable land
1.99 0.99 Shift 1.0 per cent for land for non-
agricultural purposes
Land put to non-
agricultural uses
11.75 12.75 Around 1.0 per cent from barren and
unculturable land
Culturable waste 7.79 2.79 Around 3.0 per cent to forest and 2.0
per cent for pasture and grazing land
Pasture and
grazing land
0.01 2.01 2.0 per cent from culturable waste
Current Fallow
3.76 3.76 -
Other Fallow 2.64 1.64 1.0 per cent for orchards
Land Under
Miscellaneous trees
and groves
3.92 4.92 1.0 per cent from other fallow land
Net Sown Area
68.14 68.14 -
Total reporting area
(in Hectares)
26,482.00 26,482.00 -
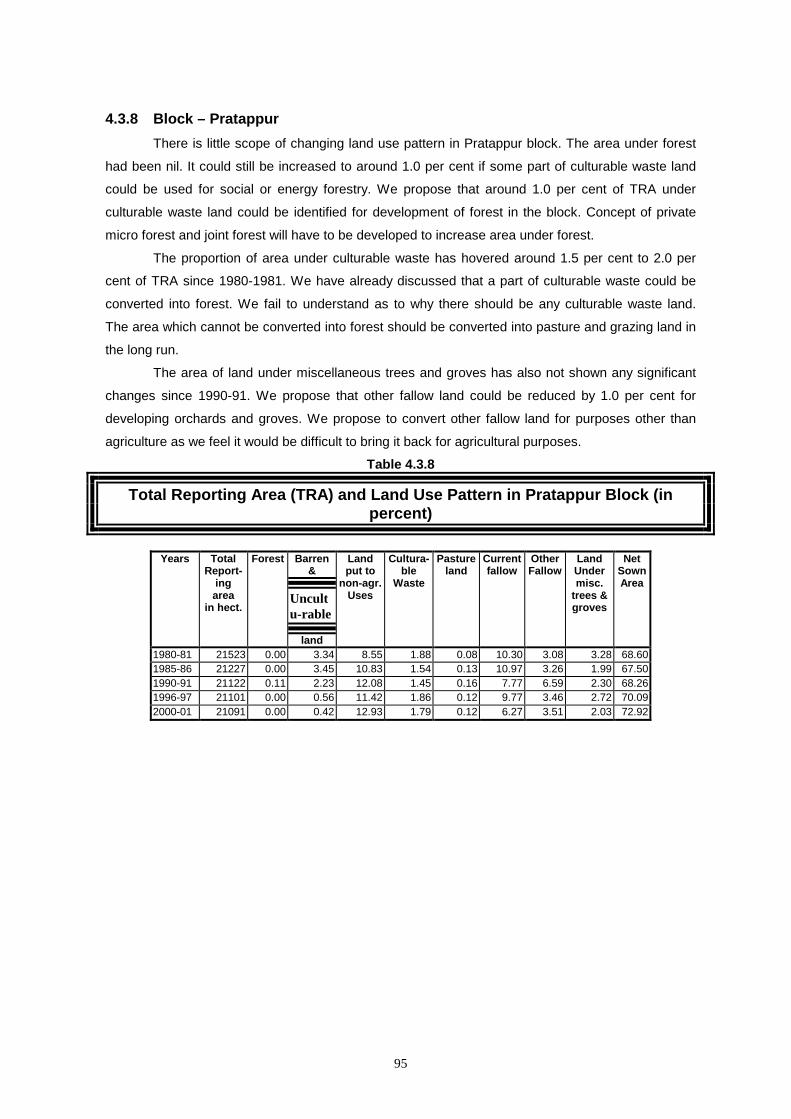
95
4.3.8 Block – Pratappur There is little scope of changing land use pattern in Pratappur block. The area under forest
had been nil. It could still be increased to around 1.0 per cent if some part of culturable waste land
could be used for social or energy forestry. We propose that around 1.0 per cent of TRA under
culturable waste land could be identified for development of forest in the block. Concept of private
micro forest and joint forest will have to be developed to increase area under forest.
The proportion of area under culturable waste has hovered around 1.5 per cent to 2.0 per
cent of TRA since 1980-1981. We have already discussed that a part of culturable waste could be
converted into forest. We fail to understand as to why there should be any culturable waste land.
The area which cannot be converted into forest should be converted into pasture and grazing land in
the long run.
The area of land under miscellaneous trees and groves has also not shown any significant
changes since 1990-91. We propose that other fallow land could be reduced by 1.0 per cent for
developing orchards and groves. We propose to convert other fallow land for purposes other than
agriculture as we feel it would be difficult to bring it back for agricultural purposes.
Table 4.3.8
Total Reporting Area (TRA) and Land Use Pattern in Pratappur Block (in percent)
Years Total
Report-ing area
in hect.
Forest Barren &
Uncultu-rable
land
Land put to
non-agr.Uses
Cultura-ble
Waste
Pastureland
Currentfallow
Other Fallow
Land Under misc.
trees & groves
Net Sown Area
1980-81 21523 0.00 3.34 8.55 1.88 0.08 10.30 3.08 3.28 68.60 1985-86 21227 0.00 3.45 10.83 1.54 0.13 10.97 3.26 1.99 67.50 1990-91 21122 0.11 2.23 12.08 1.45 0.16 7.77 6.59 2.30 68.26 1996-97 21101 0.00 0.56 11.42 1.86 0.12 9.77 3.46 2.72 70.09 2000-01 21091 0.00 0.42 12.93 1.79 0.12 6.27 3.51 2.03 72.92
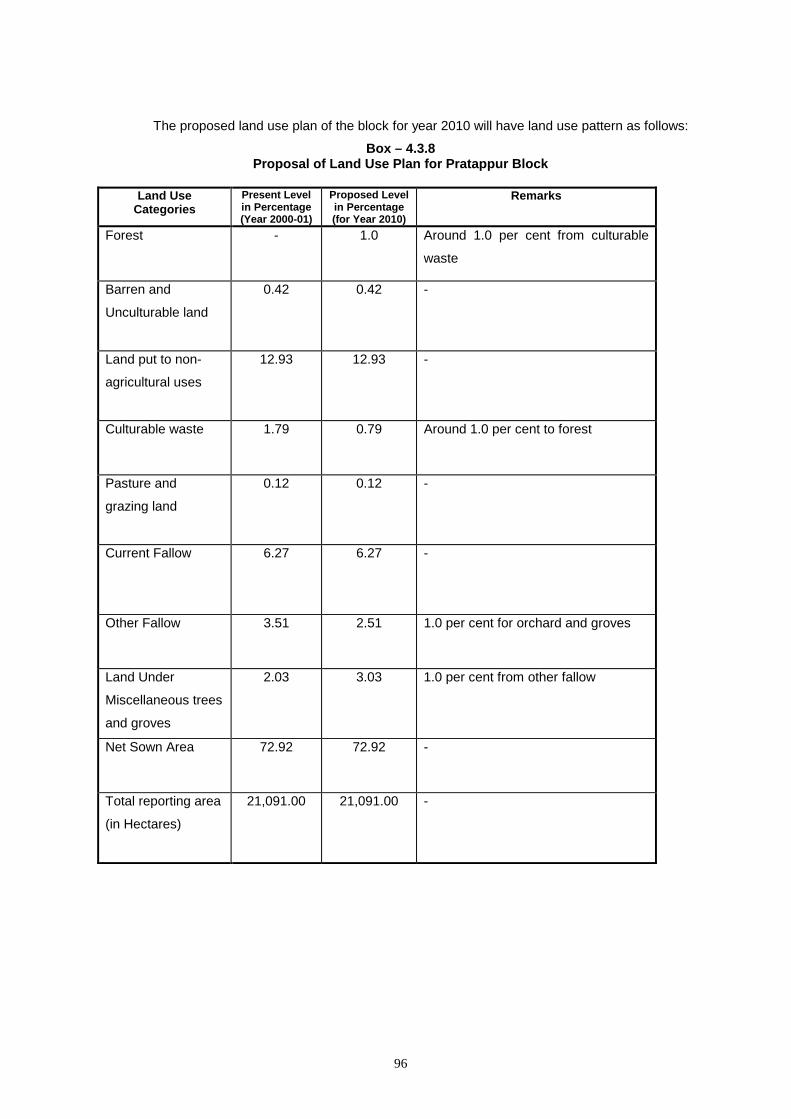
96
The proposed land use plan of the block for year 2010 will have land use pattern as follows:
Box – 4.3.8 Proposal of Land Use Plan for Pratappur Block
Land Use
Categories Present Level in Percentage (Year 2000-01)
Proposed Level in Percentage (for Year 2010)
Remarks
Forest - 1.0 Around 1.0 per cent from culturable
waste
Barren and
Unculturable land
0.42 0.42 -
Land put to non-
agricultural uses
12.93 12.93 -
Culturable waste 1.79 0.79 Around 1.0 per cent to forest
Pasture and
grazing land
0.12 0.12 -
Current Fallow
6.27 6.27 -
Other Fallow 3.51 2.51 1.0 per cent for orchard and groves
Land Under
Miscellaneous trees
and groves
2.03 3.03 1.0 per cent from other fallow
Net Sown Area
72.92 72.92 -
Total reporting area
(in Hectares)
21,091.00 21,091.00 -
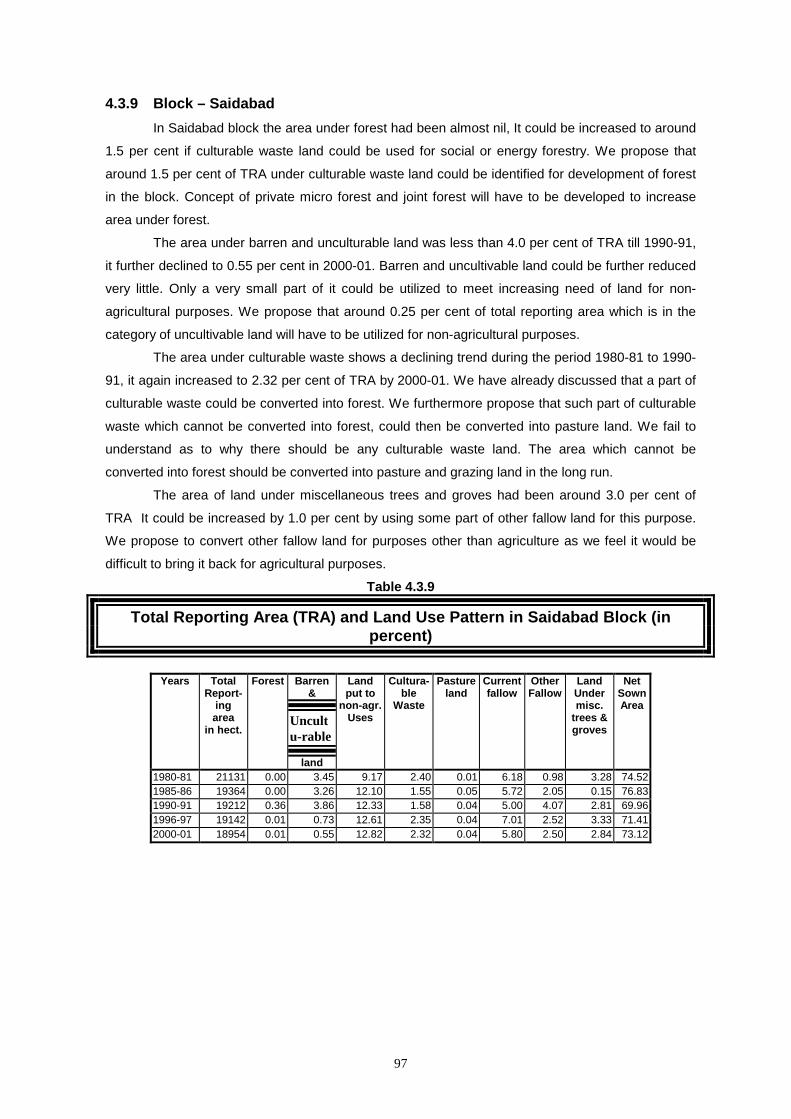
97
4.3.9 Block – Saidabad In Saidabad block the area under forest had been almost nil, It could be increased to around
1.5 per cent if culturable waste land could be used for social or energy forestry. We propose that
around 1.5 per cent of TRA under culturable waste land could be identified for development of forest
in the block. Concept of private micro forest and joint forest will have to be developed to increase
area under forest.
The area under barren and unculturable land was less than 4.0 per cent of TRA till 1990-91,
it further declined to 0.55 per cent in 2000-01. Barren and uncultivable land could be further reduced
very little. Only a very small part of it could be utilized to meet increasing need of land for non-
agricultural purposes. We propose that around 0.25 per cent of total reporting area which is in the
category of uncultivable land will have to be utilized for non-agricultural purposes.
The area under culturable waste shows a declining trend during the period 1980-81 to 1990-
91, it again increased to 2.32 per cent of TRA by 2000-01. We have already discussed that a part of
culturable waste could be converted into forest. We furthermore propose that such part of culturable
waste which cannot be converted into forest, could then be converted into pasture land. We fail to
understand as to why there should be any culturable waste land. The area which cannot be
converted into forest should be converted into pasture and grazing land in the long run.
The area of land under miscellaneous trees and groves had been around 3.0 per cent of
TRA It could be increased by 1.0 per cent by using some part of other fallow land for this purpose.
We propose to convert other fallow land for purposes other than agriculture as we feel it would be
difficult to bring it back for agricultural purposes.
Table 4.3.9
Total Reporting Area (TRA) and Land Use Pattern in Saidabad Block (in percent)
Years Total
Report-ing area
in hect.
Forest Barren &
Uncultu-rable
land
Land put to
non-agr.Uses
Cultura-ble
Waste
Pastureland
Currentfallow
Other Fallow
Land Under misc.
trees & groves
Net Sown Area
1980-81 21131 0.00 3.45 9.17 2.40 0.01 6.18 0.98 3.28 74.52 1985-86 19364 0.00 3.26 12.10 1.55 0.05 5.72 2.05 0.15 76.83 1990-91 19212 0.36 3.86 12.33 1.58 0.04 5.00 4.07 2.81 69.96 1996-97 19142 0.01 0.73 12.61 2.35 0.04 7.01 2.52 3.33 71.41 2000-01 18954 0.01 0.55 12.82 2.32 0.04 5.80 2.50 2.84 73.12
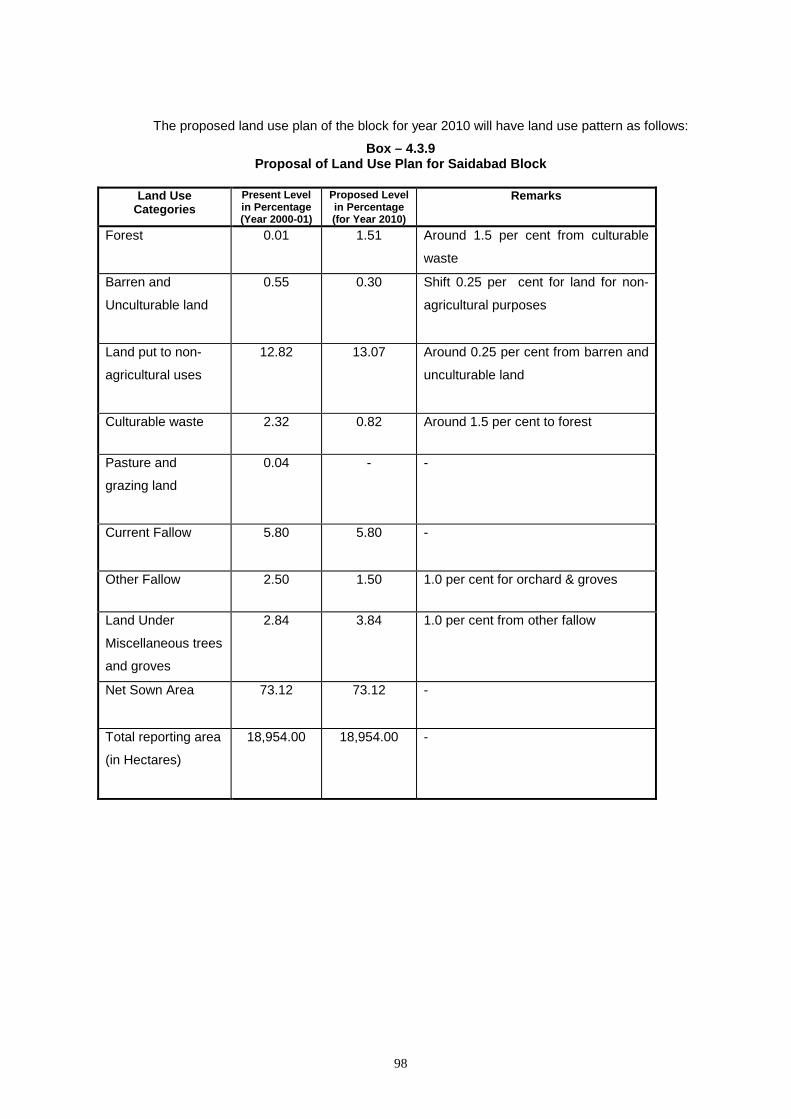
98
The proposed land use plan of the block for year 2010 will have land use pattern as follows:
Box – 4.3.9 Proposal of Land Use Plan for Saidabad Block
Land Use
Categories Present Level in Percentage (Year 2000-01)
Proposed Level in Percentage (for Year 2010)
Remarks
Forest 0.01 1.51 Around 1.5 per cent from culturable
waste
Barren and
Unculturable land
0.55 0.30 Shift 0.25 per cent for land for non-
agricultural purposes
Land put to non-
agricultural uses
12.82 13.07 Around 0.25 per cent from barren and
unculturable land
Culturable waste 2.32 0.82 Around 1.5 per cent to forest
Pasture and
grazing land
0.04 - -
Current Fallow
5.80 5.80 -
Other Fallow 2.50 1.50 1.0 per cent for orchard & groves
Land Under
Miscellaneous trees
and groves
2.84 3.84 1.0 per cent from other fallow
Net Sown Area
73.12 73.12 -
Total reporting area
(in Hectares)
18,954.00 18,954.00 -
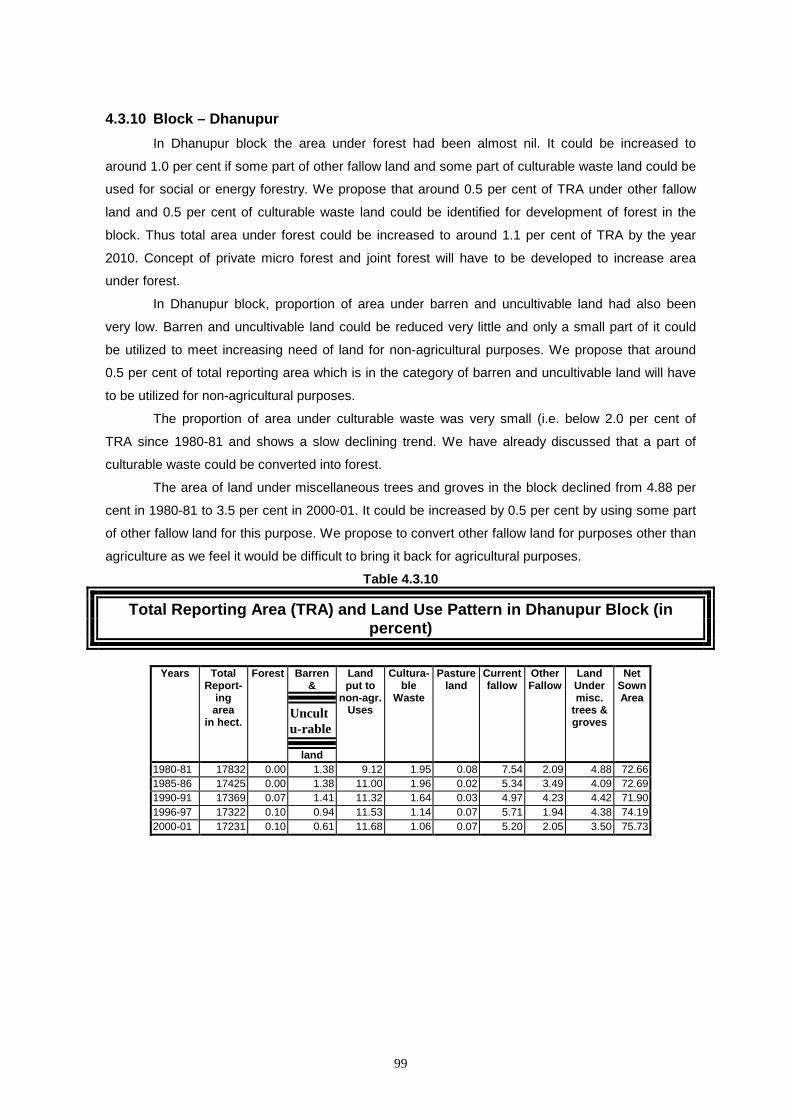
99
4.3.10 Block – Dhanupur In Dhanupur block the area under forest had been almost nil. It could be increased to
around 1.0 per cent if some part of other fallow land and some part of culturable waste land could be
used for social or energy forestry. We propose that around 0.5 per cent of TRA under other fallow
land and 0.5 per cent of culturable waste land could be identified for development of forest in the
block. Thus total area under forest could be increased to around 1.1 per cent of TRA by the year
2010. Concept of private micro forest and joint forest will have to be developed to increase area
under forest.
In Dhanupur block, proportion of area under barren and uncultivable land had also been
very low. Barren and uncultivable land could be reduced very little and only a small part of it could
be utilized to meet increasing need of land for non-agricultural purposes. We propose that around
0.5 per cent of total reporting area which is in the category of barren and uncultivable land will have
to be utilized for non-agricultural purposes.
The proportion of area under culturable waste was very small (i.e. below 2.0 per cent of
TRA since 1980-81 and shows a slow declining trend. We have already discussed that a part of
culturable waste could be converted into forest.
The area of land under miscellaneous trees and groves in the block declined from 4.88 per
cent in 1980-81 to 3.5 per cent in 2000-01. It could be increased by 0.5 per cent by using some part
of other fallow land for this purpose. We propose to convert other fallow land for purposes other than
agriculture as we feel it would be difficult to bring it back for agricultural purposes.
Table 4.3.10
Total Reporting Area (TRA) and Land Use Pattern in Dhanupur Block (in percent)
Years Total
Report-ing area
in hect.
Forest Barren &
Uncultu-rable
land
Land put to
non-agr.Uses
Cultura-ble
Waste
Pastureland
Currentfallow
Other Fallow
Land Under misc.
trees & groves
Net Sown Area
1980-81 17832 0.00 1.38 9.12 1.95 0.08 7.54 2.09 4.88 72.66 1985-86 17425 0.00 1.38 11.00 1.96 0.02 5.34 3.49 4.09 72.69 1990-91 17369 0.07 1.41 11.32 1.64 0.03 4.97 4.23 4.42 71.90 1996-97 17322 0.10 0.94 11.53 1.14 0.07 5.71 1.94 4.38 74.19 2000-01 17231 0.10 0.61 11.68 1.06 0.07 5.20 2.05 3.50 75.73
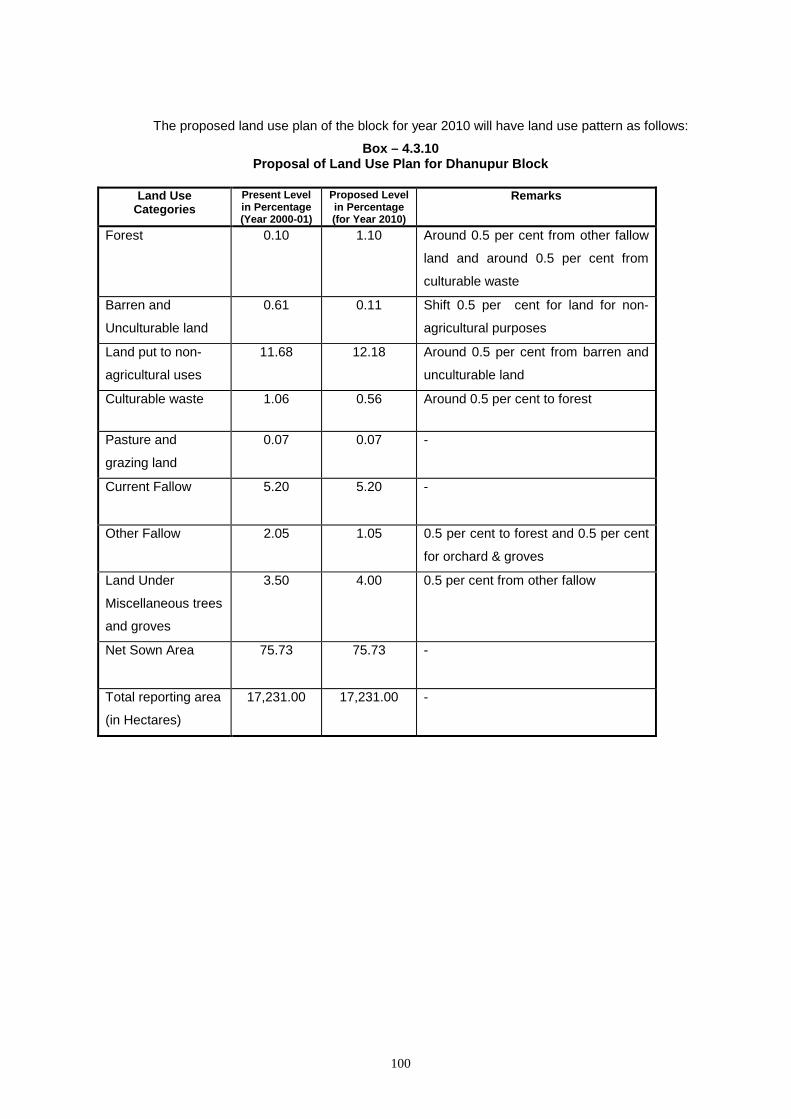
100
The proposed land use plan of the block for year 2010 will have land use pattern as follows:
Box – 4.3.10 Proposal of Land Use Plan for Dhanupur Block
Land Use
Categories Present Level in Percentage (Year 2000-01)
Proposed Level in Percentage (for Year 2010)
Remarks
Forest 0.10 1.10 Around 0.5 per cent from other fallow
land and around 0.5 per cent from
culturable waste
Barren and
Unculturable land
0.61 0.11 Shift 0.5 per cent for land for non-
agricultural purposes
Land put to non-
agricultural uses
11.68 12.18 Around 0.5 per cent from barren and
unculturable land
Culturable waste 1.06 0.56 Around 0.5 per cent to forest
Pasture and
grazing land
0.07 0.07 -
Current Fallow
5.20 5.20 -
Other Fallow 2.05 1.05 0.5 per cent to forest and 0.5 per cent
for orchard & groves
Land Under
Miscellaneous trees
and groves
3.50 4.00 0.5 per cent from other fallow
Net Sown Area
75.73 75.73 -
Total reporting area
(in Hectares)
17,231.00 17,231.00 -
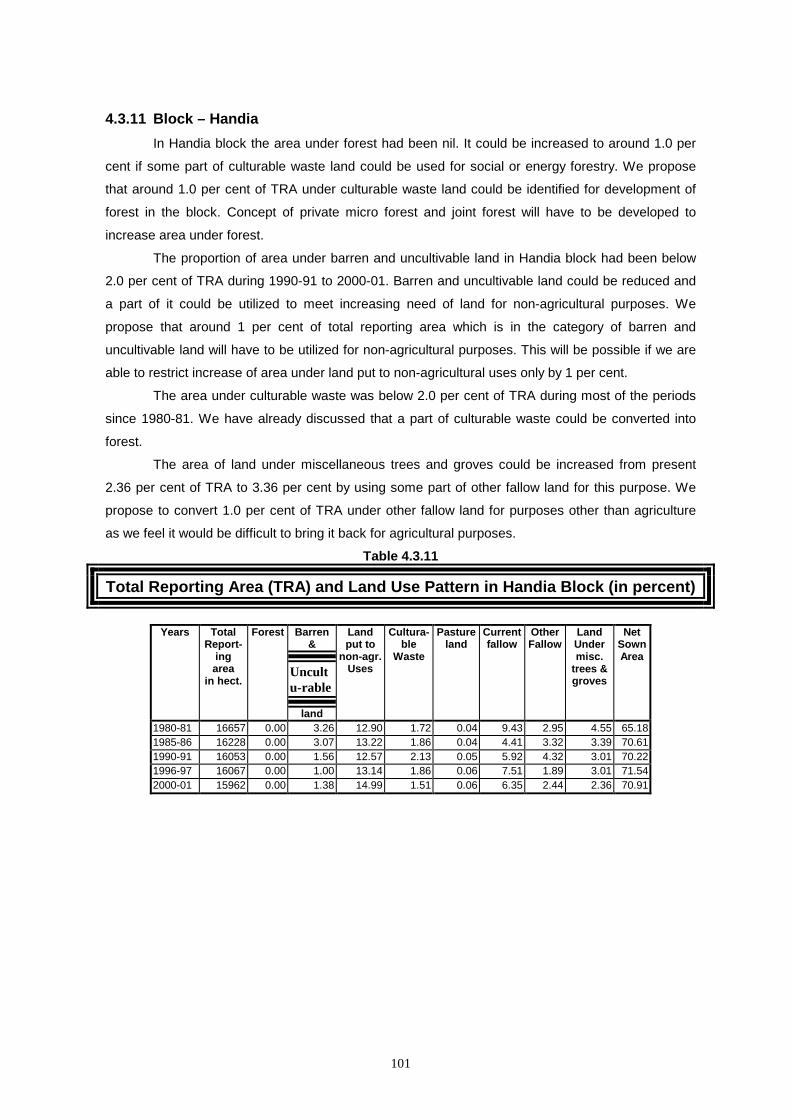
101
4.3.11 Block – Handia In Handia block the area under forest had been nil. It could be increased to around 1.0 per
cent if some part of culturable waste land could be used for social or energy forestry. We propose
that around 1.0 per cent of TRA under culturable waste land could be identified for development of
forest in the block. Concept of private micro forest and joint forest will have to be developed to
increase area under forest.
The proportion of area under barren and uncultivable land in Handia block had been below
2.0 per cent of TRA during 1990-91 to 2000-01. Barren and uncultivable land could be reduced and
a part of it could be utilized to meet increasing need of land for non-agricultural purposes. We
propose that around 1 per cent of total reporting area which is in the category of barren and
uncultivable land will have to be utilized for non-agricultural purposes. This will be possible if we are
able to restrict increase of area under land put to non-agricultural uses only by 1 per cent.
The area under culturable waste was below 2.0 per cent of TRA during most of the periods
since 1980-81. We have already discussed that a part of culturable waste could be converted into
forest.
The area of land under miscellaneous trees and groves could be increased from present
2.36 per cent of TRA to 3.36 per cent by using some part of other fallow land for this purpose. We
propose to convert 1.0 per cent of TRA under other fallow land for purposes other than agriculture
as we feel it would be difficult to bring it back for agricultural purposes.
Table 4.3.11
Total Reporting Area (TRA) and Land Use Pattern in Handia Block (in percent)
Years Total
Report-ing area
in hect.
Forest Barren &
Uncultu-rable
land
Land put to
non-agr.Uses
Cultura-ble
Waste
Pastureland
Currentfallow
Other Fallow
Land Under misc.
trees & groves
Net Sown Area
1980-81 16657 0.00 3.26 12.90 1.72 0.04 9.43 2.95 4.55 65.18 1985-86 16228 0.00 3.07 13.22 1.86 0.04 4.41 3.32 3.39 70.61 1990-91 16053 0.00 1.56 12.57 2.13 0.05 5.92 4.32 3.01 70.22 1996-97 16067 0.00 1.00 13.14 1.86 0.06 7.51 1.89 3.01 71.54 2000-01 15962 0.00 1.38 14.99 1.51 0.06 6.35 2.44 2.36 70.91
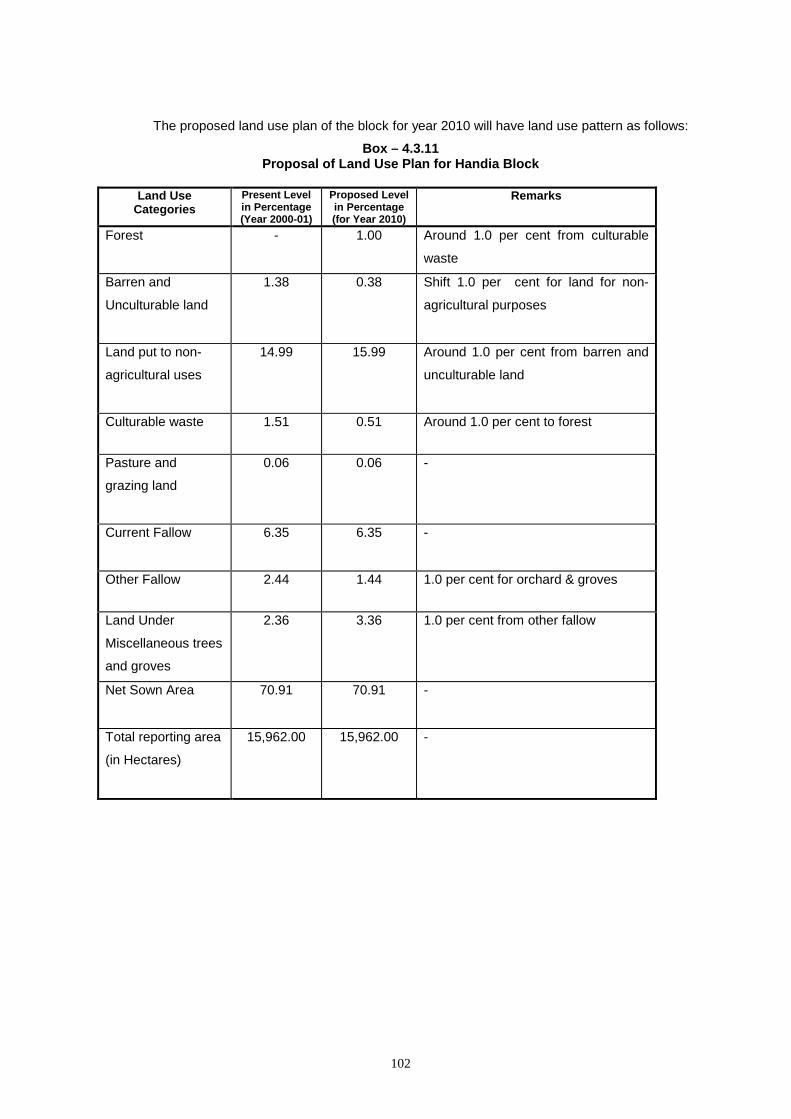
102
The proposed land use plan of the block for year 2010 will have land use pattern as follows:
Box – 4.3.11 Proposal of Land Use Plan for Handia Block
Land Use
Categories Present Level in Percentage (Year 2000-01)
Proposed Level in Percentage (for Year 2010)
Remarks
Forest - 1.00 Around 1.0 per cent from culturable
waste
Barren and
Unculturable land
1.38 0.38 Shift 1.0 per cent for land for non-
agricultural purposes
Land put to non-
agricultural uses
14.99 15.99 Around 1.0 per cent from barren and
unculturable land
Culturable waste 1.51 0.51 Around 1.0 per cent to forest
Pasture and
grazing land
0.06 0.06 -
Current Fallow
6.35 6.35 -
Other Fallow 2.44 1.44 1.0 per cent for orchard & groves
Land Under
Miscellaneous trees
and groves
2.36 3.36 1.0 per cent from other fallow
Net Sown Area
70.91 70.91 -
Total reporting area
(in Hectares)
15,962.00 15,962.00 -
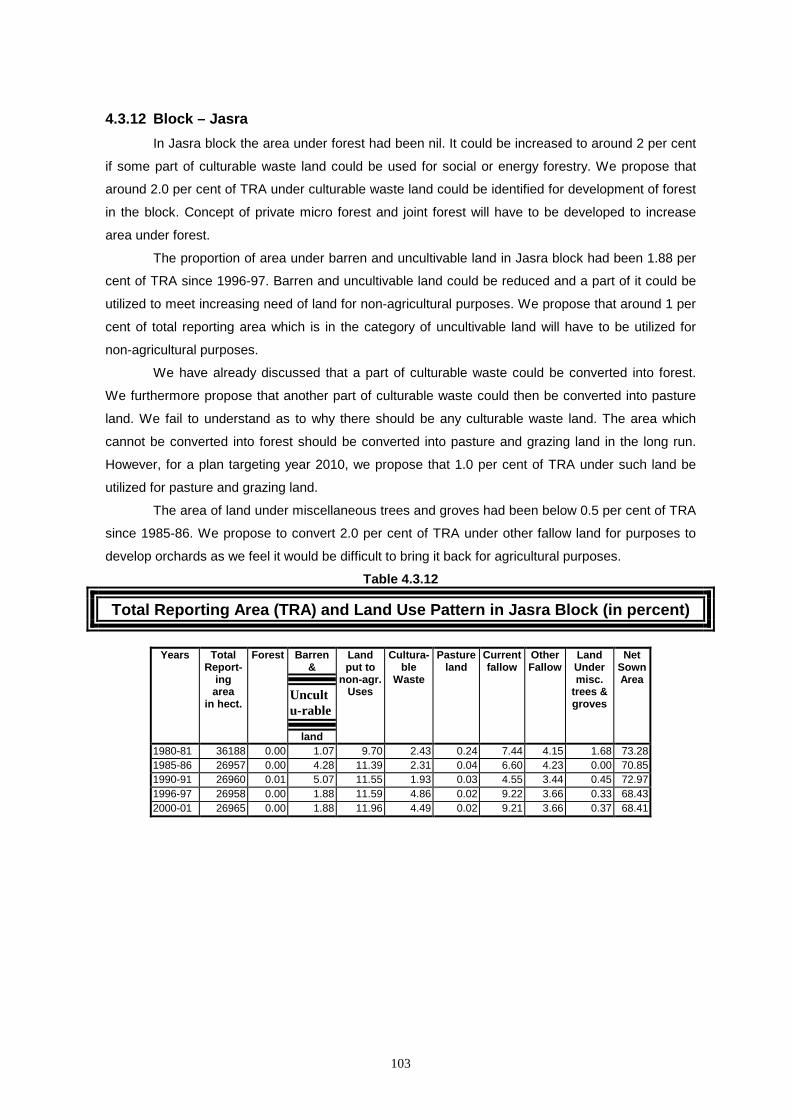
103
4.3.12 Block – Jasra In Jasra block the area under forest had been nil. It could be increased to around 2 per cent
if some part of culturable waste land could be used for social or energy forestry. We propose that
around 2.0 per cent of TRA under culturable waste land could be identified for development of forest
in the block. Concept of private micro forest and joint forest will have to be developed to increase
area under forest.
The proportion of area under barren and uncultivable land in Jasra block had been 1.88 per
cent of TRA since 1996-97. Barren and uncultivable land could be reduced and a part of it could be
utilized to meet increasing need of land for non-agricultural purposes. We propose that around 1 per
cent of total reporting area which is in the category of uncultivable land will have to be utilized for
non-agricultural purposes.
We have already discussed that a part of culturable waste could be converted into forest.
We furthermore propose that another part of culturable waste could then be converted into pasture
land. We fail to understand as to why there should be any culturable waste land. The area which
cannot be converted into forest should be converted into pasture and grazing land in the long run.
However, for a plan targeting year 2010, we propose that 1.0 per cent of TRA under such land be
utilized for pasture and grazing land.
The area of land under miscellaneous trees and groves had been below 0.5 per cent of TRA
since 1985-86. We propose to convert 2.0 per cent of TRA under other fallow land for purposes to
develop orchards as we feel it would be difficult to bring it back for agricultural purposes.
Table 4.3.12
Total Reporting Area (TRA) and Land Use Pattern in Jasra Block (in percent)
Years Total
Report-ing area
in hect.
Forest Barren &
Uncultu-rable
land
Land put to
non-agr.Uses
Cultura-ble
Waste
Pastureland
Currentfallow
Other Fallow
Land Under misc.
trees & groves
Net Sown Area
1980-81 36188 0.00 1.07 9.70 2.43 0.24 7.44 4.15 1.68 73.28 1985-86 26957 0.00 4.28 11.39 2.31 0.04 6.60 4.23 0.00 70.85 1990-91 26960 0.01 5.07 11.55 1.93 0.03 4.55 3.44 0.45 72.97 1996-97 26958 0.00 1.88 11.59 4.86 0.02 9.22 3.66 0.33 68.43 2000-01 26965 0.00 1.88 11.96 4.49 0.02 9.21 3.66 0.37 68.41

104
The proposed land use plan of the block for year 2010 will have land use pattern as follows:
Box – 4.3.12 Proposal of Land Use Plan for Jasra Block
Land Use
Categories Present Level in Percentage (Year 2000-01)
Proposed Level in Percentage (for Year 2010)
Remarks
Forest - 2.00 Around 2.0 per cent from culturable
waste
Barren and
Unculturable land
1.88 0.88 Shift 1.0 per cent such land for non-
agricultural purposes
Land put to non-
agricultural uses
11.96 12.96 Around 1.0 per cent from barren and
unculturable land
Culturable waste 4.49 1.49 Around 2.0 per cent to forest and
around 1.0 per cent for pasture
grazing land
Pasture and
grazing land
0.02 1.02 1.0 per cent from culturable waste
land
Current Fallow
9.21 9.21 -
Other Fallow 3.66 1.66 Around 2.0 per cent for orchards
Land Under
Miscellaneous trees
and groves
0.37 2.37 2.0 per cent from other fallow land
Net Sown Area
68.41 68.41 -
Total reporting area
(in Hectares)
26,965.00 26,965.00 -
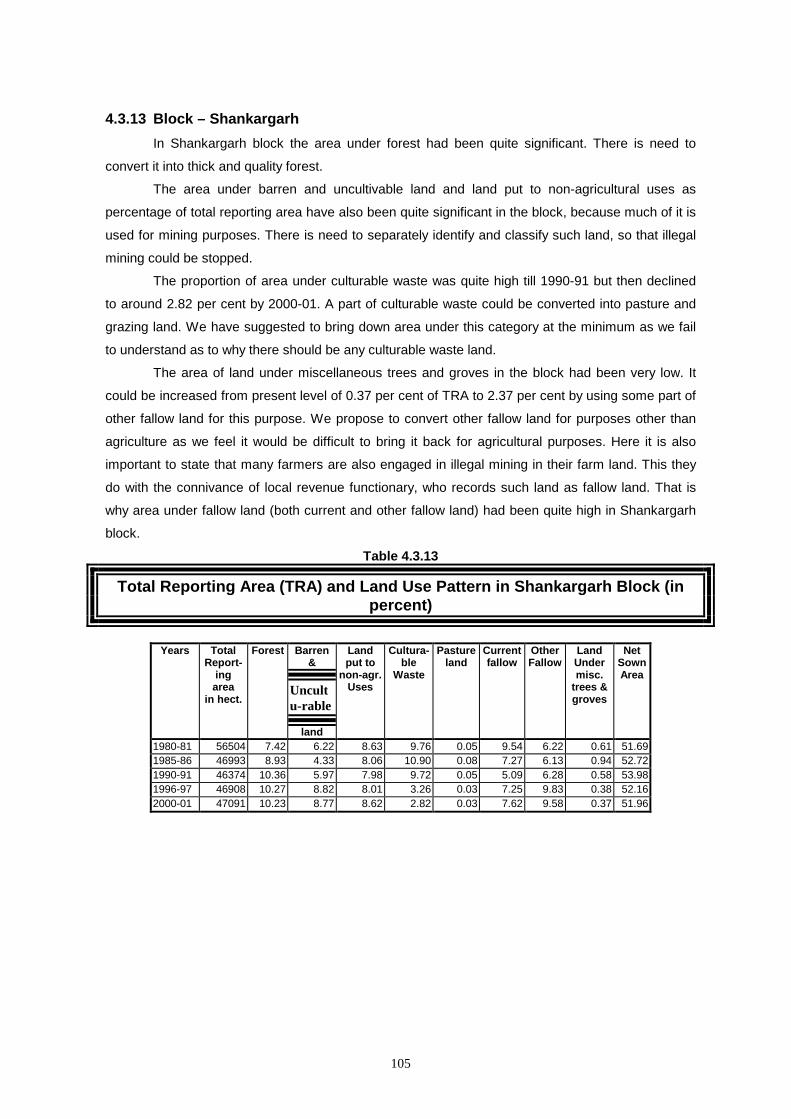
105
4.3.13 Block – Shankargarh In Shankargarh block the area under forest had been quite significant. There is need to
convert it into thick and quality forest.
The area under barren and uncultivable land and land put to non-agricultural uses as
percentage of total reporting area have also been quite significant in the block, because much of it is
used for mining purposes. There is need to separately identify and classify such land, so that illegal
mining could be stopped.
The proportion of area under culturable waste was quite high till 1990-91 but then declined
to around 2.82 per cent by 2000-01. A part of culturable waste could be converted into pasture and
grazing land. We have suggested to bring down area under this category at the minimum as we fail
to understand as to why there should be any culturable waste land.
The area of land under miscellaneous trees and groves in the block had been very low. It
could be increased from present level of 0.37 per cent of TRA to 2.37 per cent by using some part of
other fallow land for this purpose. We propose to convert other fallow land for purposes other than
agriculture as we feel it would be difficult to bring it back for agricultural purposes. Here it is also
important to state that many farmers are also engaged in illegal mining in their farm land. This they
do with the connivance of local revenue functionary, who records such land as fallow land. That is
why area under fallow land (both current and other fallow land) had been quite high in Shankargarh
block.
Table 4.3.13
Total Reporting Area (TRA) and Land Use Pattern in Shankargarh Block (in percent)
Years Total
Report-ing area
in hect.
Forest Barren &
Uncultu-rable
land
Land put to
non-agr.Uses
Cultura-ble
Waste
Pastureland
Currentfallow
Other Fallow
Land Under misc.
trees & groves
Net Sown Area
1980-81 56504 7.42 6.22 8.63 9.76 0.05 9.54 6.22 0.61 51.69 1985-86 46993 8.93 4.33 8.06 10.90 0.08 7.27 6.13 0.94 52.72 1990-91 46374 10.36 5.97 7.98 9.72 0.05 5.09 6.28 0.58 53.98 1996-97 46908 10.27 8.82 8.01 3.26 0.03 7.25 9.83 0.38 52.16 2000-01 47091 10.23 8.77 8.62 2.82 0.03 7.62 9.58 0.37 51.96

106
The proposed land use plan of the block for year 2010 will have land use pattern as follows:
Box – 4.3.13 Proposal of Land Use Plan for Shankargarh Block
Land Use
Categories Present Level in Percentage (Year 2000-01)
Proposed Level in Percentage (for Year 2010)
Remarks
Forest 10.23 10.23 -
Barren and
Unculturable land
8.77 8.00 Shift 0.77 per cent for land for non-
agricultural purposes
Land put to non-
agricultural uses
8.62 9.39 Around 0.77 per cent from barren and
uncultivable land
Culturable waste 2.82 1.82 Around 1.0 per cent to pasture and
grazing land
Pasture and
grazing land
0.03 1.03 Around 1.0 per cent from culturable
waste
Current Fallow
7.62 7.62 -
Other Fallow 9.58 7.58 2.0 per cent for orchard & groves
Land Under
Miscellaneous trees
and groves
0.37 2.37 2.0 per cent from other fallow
Net Sown Area
51.96 51.96 -
Total reporting area
(in Hectares)
47,091.00 47,091.00 -
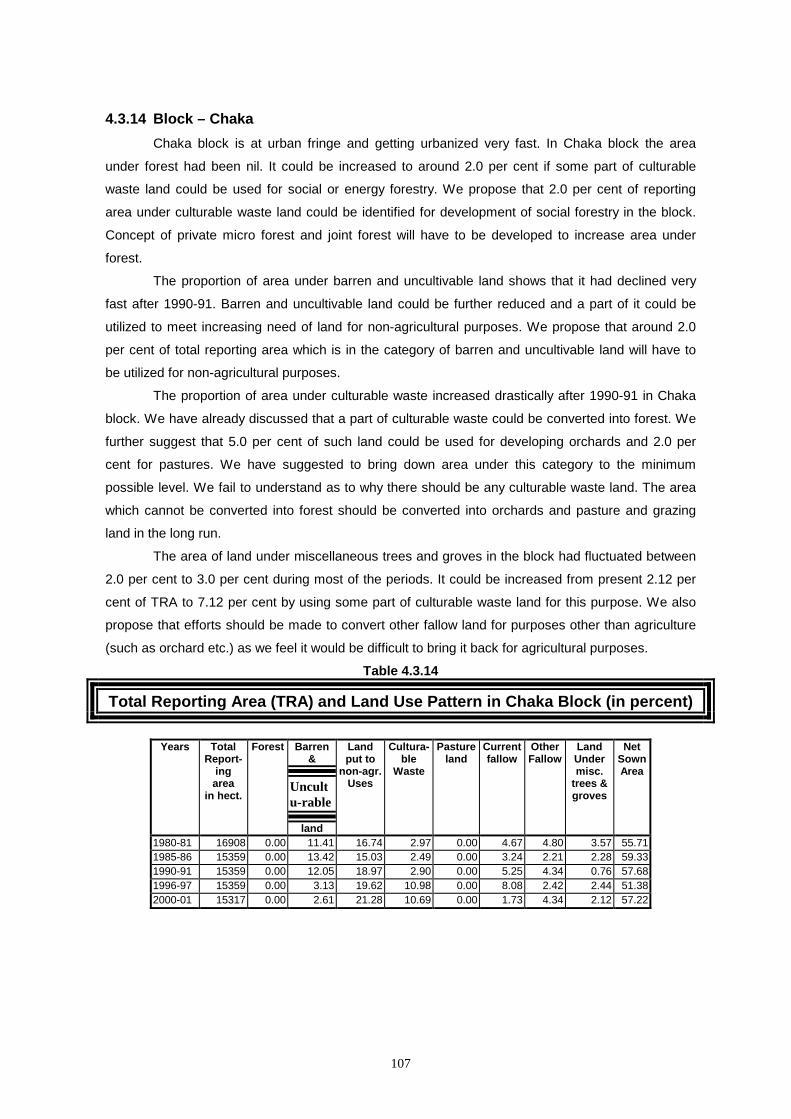
107
4.3.14 Block – Chaka Chaka block is at urban fringe and getting urbanized very fast. In Chaka block the area
under forest had been nil. It could be increased to around 2.0 per cent if some part of culturable
waste land could be used for social or energy forestry. We propose that 2.0 per cent of reporting
area under culturable waste land could be identified for development of social forestry in the block.
Concept of private micro forest and joint forest will have to be developed to increase area under
forest.
The proportion of area under barren and uncultivable land shows that it had declined very
fast after 1990-91. Barren and uncultivable land could be further reduced and a part of it could be
utilized to meet increasing need of land for non-agricultural purposes. We propose that around 2.0
per cent of total reporting area which is in the category of barren and uncultivable land will have to
be utilized for non-agricultural purposes.
The proportion of area under culturable waste increased drastically after 1990-91 in Chaka
block. We have already discussed that a part of culturable waste could be converted into forest. We
further suggest that 5.0 per cent of such land could be used for developing orchards and 2.0 per
cent for pastures. We have suggested to bring down area under this category to the minimum
possible level. We fail to understand as to why there should be any culturable waste land. The area
which cannot be converted into forest should be converted into orchards and pasture and grazing
land in the long run.
The area of land under miscellaneous trees and groves in the block had fluctuated between
2.0 per cent to 3.0 per cent during most of the periods. It could be increased from present 2.12 per
cent of TRA to 7.12 per cent by using some part of culturable waste land for this purpose. We also
propose that efforts should be made to convert other fallow land for purposes other than agriculture
(such as orchard etc.) as we feel it would be difficult to bring it back for agricultural purposes.
Table 4.3.14
Total Reporting Area (TRA) and Land Use Pattern in Chaka Block (in percent)
Years Total
Report-ing area
in hect.
Forest Barren &
Uncultu-rable
land
Land put to
non-agr.Uses
Cultura-ble
Waste
Pastureland
Currentfallow
Other Fallow
Land Under misc.
trees & groves
Net Sown Area
1980-81 16908 0.00 11.41 16.74 2.97 0.00 4.67 4.80 3.57 55.71 1985-86 15359 0.00 13.42 15.03 2.49 0.00 3.24 2.21 2.28 59.33 1990-91 15359 0.00 12.05 18.97 2.90 0.00 5.25 4.34 0.76 57.68 1996-97 15359 0.00 3.13 19.62 10.98 0.00 8.08 2.42 2.44 51.38 2000-01 15317 0.00 2.61 21.28 10.69 0.00 1.73 4.34 2.12 57.22
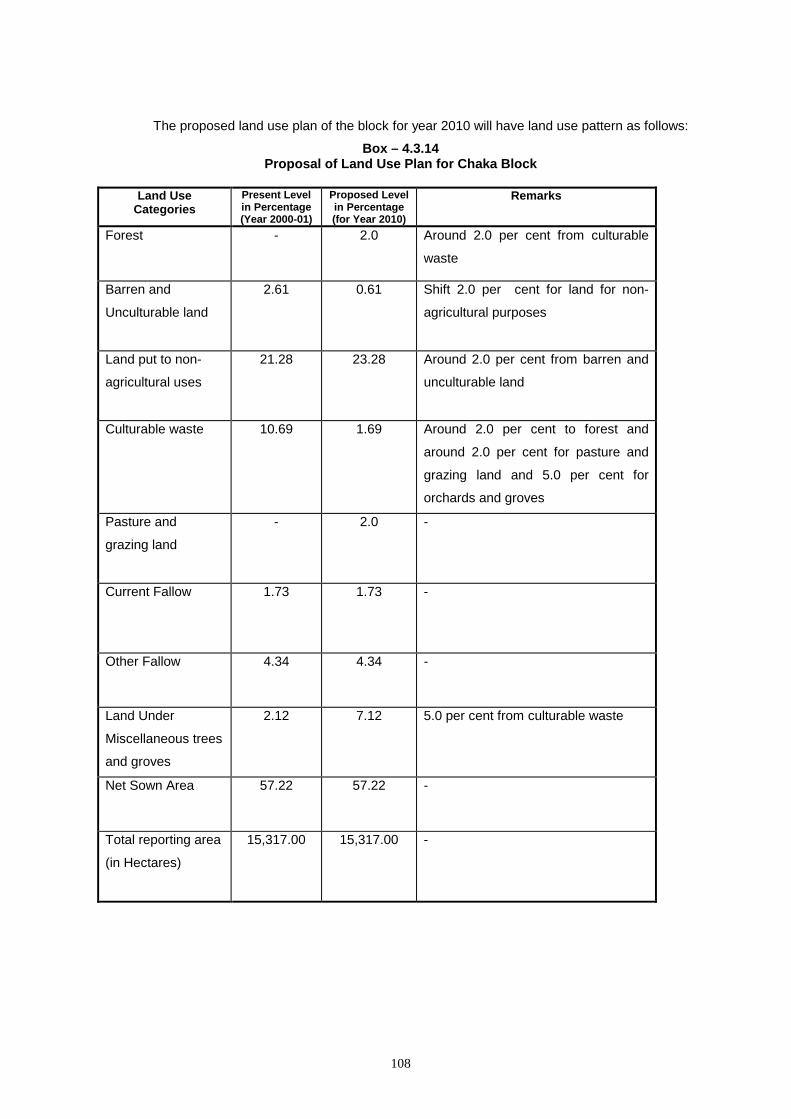
108
The proposed land use plan of the block for year 2010 will have land use pattern as follows:
Box – 4.3.14 Proposal of Land Use Plan for Chaka Block
Land Use
Categories Present Level in Percentage (Year 2000-01)
Proposed Level in Percentage (for Year 2010)
Remarks
Forest - 2.0 Around 2.0 per cent from culturable
waste
Barren and
Unculturable land
2.61 0.61 Shift 2.0 per cent for land for non-
agricultural purposes
Land put to non-
agricultural uses
21.28 23.28 Around 2.0 per cent from barren and
unculturable land
Culturable waste 10.69 1.69 Around 2.0 per cent to forest and
around 2.0 per cent for pasture and
grazing land and 5.0 per cent for
orchards and groves
Pasture and
grazing land
- 2.0 -
Current Fallow
1.73 1.73 -
Other Fallow 4.34 4.34 -
Land Under
Miscellaneous trees
and groves
2.12 7.12 5.0 per cent from culturable waste
Net Sown Area
57.22 57.22 -
Total reporting area
(in Hectares)
15,317.00 15,317.00 -
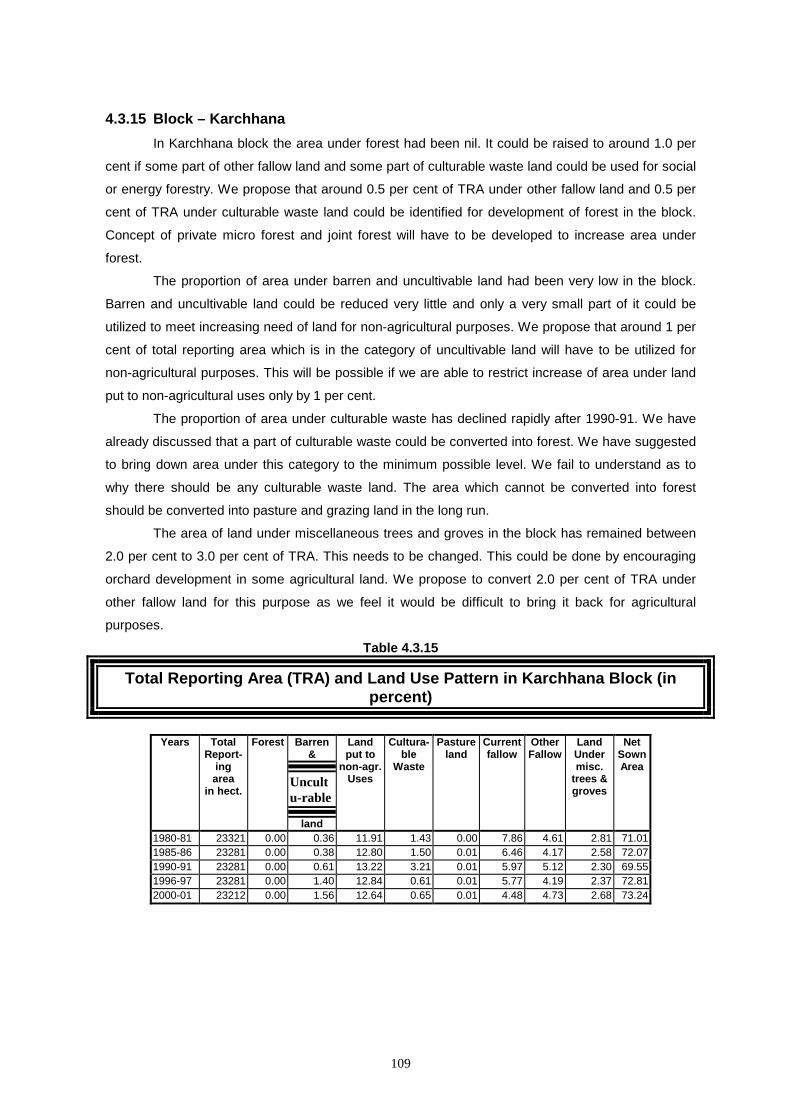
109
4.3.15 Block – Karchhana In Karchhana block the area under forest had been nil. It could be raised to around 1.0 per
cent if some part of other fallow land and some part of culturable waste land could be used for social
or energy forestry. We propose that around 0.5 per cent of TRA under other fallow land and 0.5 per
cent of TRA under culturable waste land could be identified for development of forest in the block.
Concept of private micro forest and joint forest will have to be developed to increase area under
forest.
The proportion of area under barren and uncultivable land had been very low in the block.
Barren and uncultivable land could be reduced very little and only a very small part of it could be
utilized to meet increasing need of land for non-agricultural purposes. We propose that around 1 per
cent of total reporting area which is in the category of uncultivable land will have to be utilized for
non-agricultural purposes. This will be possible if we are able to restrict increase of area under land
put to non-agricultural uses only by 1 per cent.
The proportion of area under culturable waste has declined rapidly after 1990-91. We have
already discussed that a part of culturable waste could be converted into forest. We have suggested
to bring down area under this category to the minimum possible level. We fail to understand as to
why there should be any culturable waste land. The area which cannot be converted into forest
should be converted into pasture and grazing land in the long run.
The area of land under miscellaneous trees and groves in the block has remained between
2.0 per cent to 3.0 per cent of TRA. This needs to be changed. This could be done by encouraging
orchard development in some agricultural land. We propose to convert 2.0 per cent of TRA under
other fallow land for this purpose as we feel it would be difficult to bring it back for agricultural
purposes.
Table 4.3.15
Total Reporting Area (TRA) and Land Use Pattern in Karchhana Block (in percent)
Years Total
Report-ing area
in hect.
Forest Barren &
Uncultu-rable
land
Land put to
non-agr.Uses
Cultura-ble
Waste
Pastureland
Currentfallow
Other Fallow
Land Under misc.
trees & groves
Net Sown Area
1980-81 23321 0.00 0.36 11.91 1.43 0.00 7.86 4.61 2.81 71.01 1985-86 23281 0.00 0.38 12.80 1.50 0.01 6.46 4.17 2.58 72.07 1990-91 23281 0.00 0.61 13.22 3.21 0.01 5.97 5.12 2.30 69.55 1996-97 23281 0.00 1.40 12.84 0.61 0.01 5.77 4.19 2.37 72.81 2000-01 23212 0.00 1.56 12.64 0.65 0.01 4.48 4.73 2.68 73.24
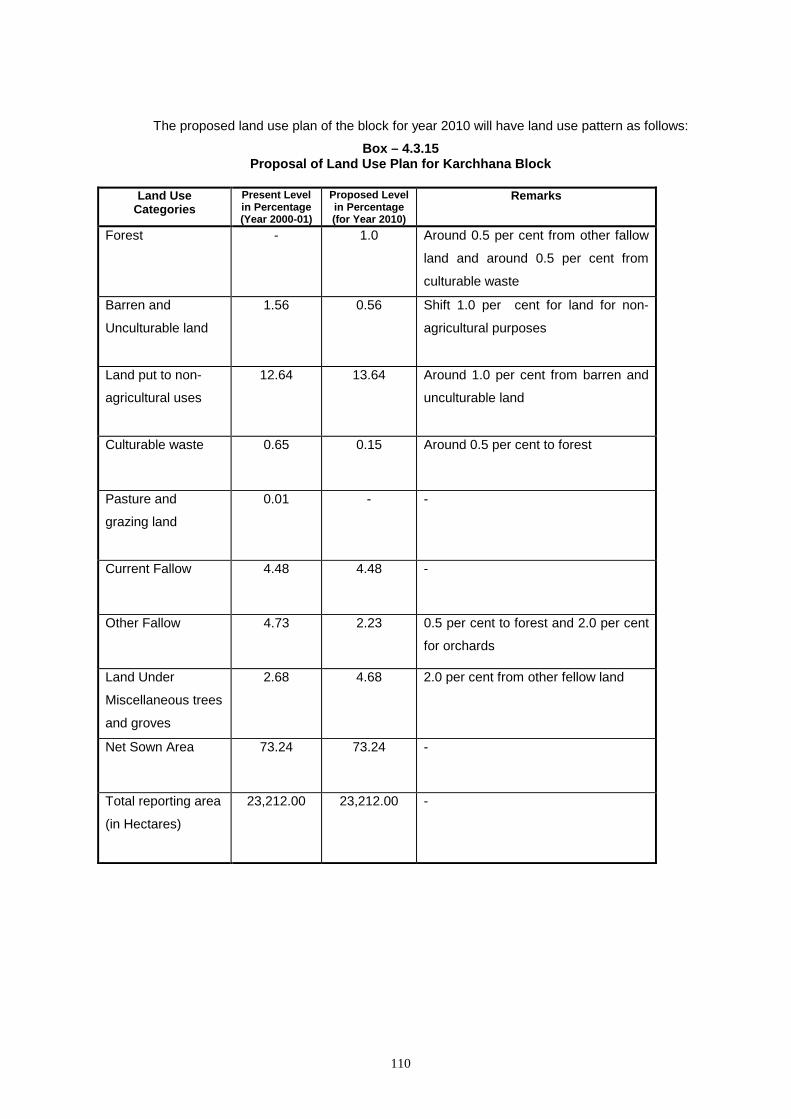
110
The proposed land use plan of the block for year 2010 will have land use pattern as follows:
Box – 4.3.15 Proposal of Land Use Plan for Karchhana Block
Land Use
Categories Present Level in Percentage (Year 2000-01)
Proposed Level in Percentage (for Year 2010)
Remarks
Forest - 1.0 Around 0.5 per cent from other fallow
land and around 0.5 per cent from
culturable waste
Barren and
Unculturable land
1.56 0.56 Shift 1.0 per cent for land for non-
agricultural purposes
Land put to non-
agricultural uses
12.64 13.64 Around 1.0 per cent from barren and
unculturable land
Culturable waste 0.65 0.15 Around 0.5 per cent to forest
Pasture and
grazing land
0.01 - -
Current Fallow
4.48 4.48 -
Other Fallow 4.73 2.23 0.5 per cent to forest and 2.0 per cent
for orchards
Land Under
Miscellaneous trees
and groves
2.68 4.68 2.0 per cent from other fellow land
Net Sown Area
73.24 73.24 -
Total reporting area
(in Hectares)
23,212.00 23,212.00 -
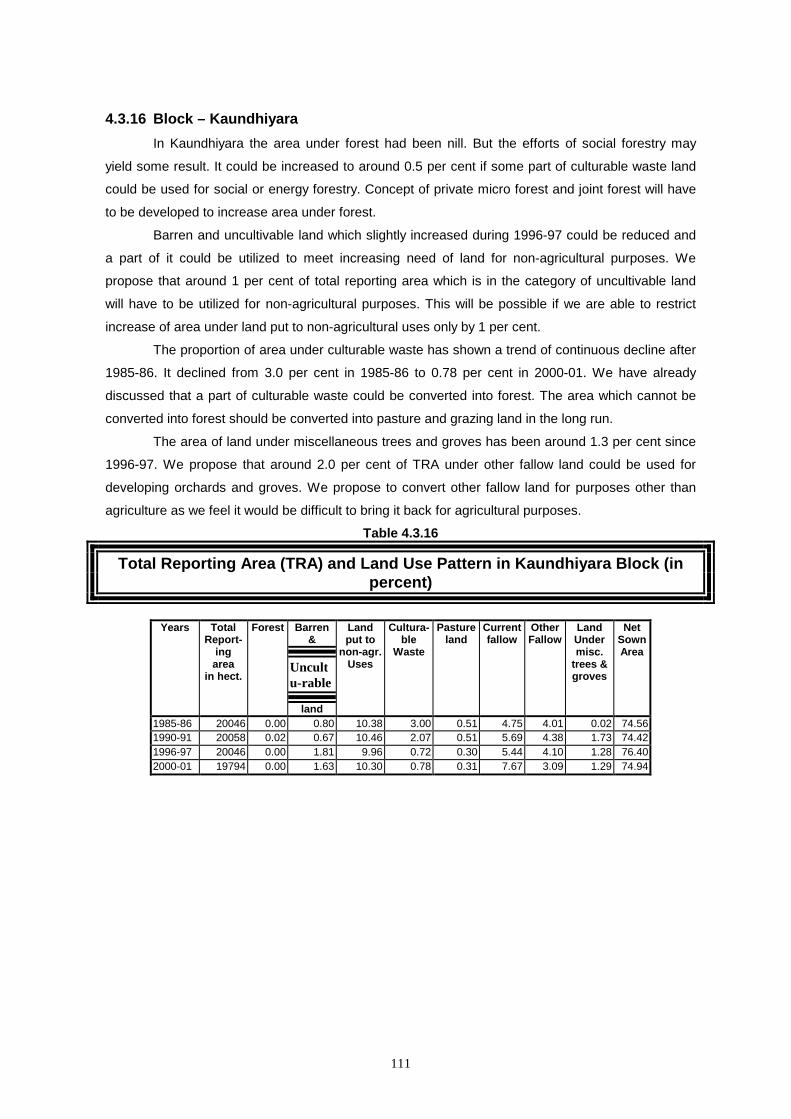
111
4.3.16 Block – Kaundhiyara In Kaundhiyara the area under forest had been nill. But the efforts of social forestry may
yield some result. It could be increased to around 0.5 per cent if some part of culturable waste land
could be used for social or energy forestry. Concept of private micro forest and joint forest will have
to be developed to increase area under forest.
Barren and uncultivable land which slightly increased during 1996-97 could be reduced and
a part of it could be utilized to meet increasing need of land for non-agricultural purposes. We
propose that around 1 per cent of total reporting area which is in the category of uncultivable land
will have to be utilized for non-agricultural purposes. This will be possible if we are able to restrict
increase of area under land put to non-agricultural uses only by 1 per cent.
The proportion of area under culturable waste has shown a trend of continuous decline after
1985-86. It declined from 3.0 per cent in 1985-86 to 0.78 per cent in 2000-01. We have already
discussed that a part of culturable waste could be converted into forest. The area which cannot be
converted into forest should be converted into pasture and grazing land in the long run.
The area of land under miscellaneous trees and groves has been around 1.3 per cent since
1996-97. We propose that around 2.0 per cent of TRA under other fallow land could be used for
developing orchards and groves. We propose to convert other fallow land for purposes other than
agriculture as we feel it would be difficult to bring it back for agricultural purposes.
Table 4.3.16
Total Reporting Area (TRA) and Land Use Pattern in Kaundhiyara Block (in percent)
Years Total
Report-ing area
in hect.
Forest Barren &
Uncultu-rable
land
Land put to
non-agr.Uses
Cultura-ble
Waste
Pastureland
Currentfallow
Other Fallow
Land Under misc.
trees & groves
Net Sown Area
1985-86 20046 0.00 0.80 10.38 3.00 0.51 4.75 4.01 0.02 74.56 1990-91 20058 0.02 0.67 10.46 2.07 0.51 5.69 4.38 1.73 74.42 1996-97 20046 0.00 1.81 9.96 0.72 0.30 5.44 4.10 1.28 76.40 2000-01 19794 0.00 1.63 10.30 0.78 0.31 7.67 3.09 1.29 74.94
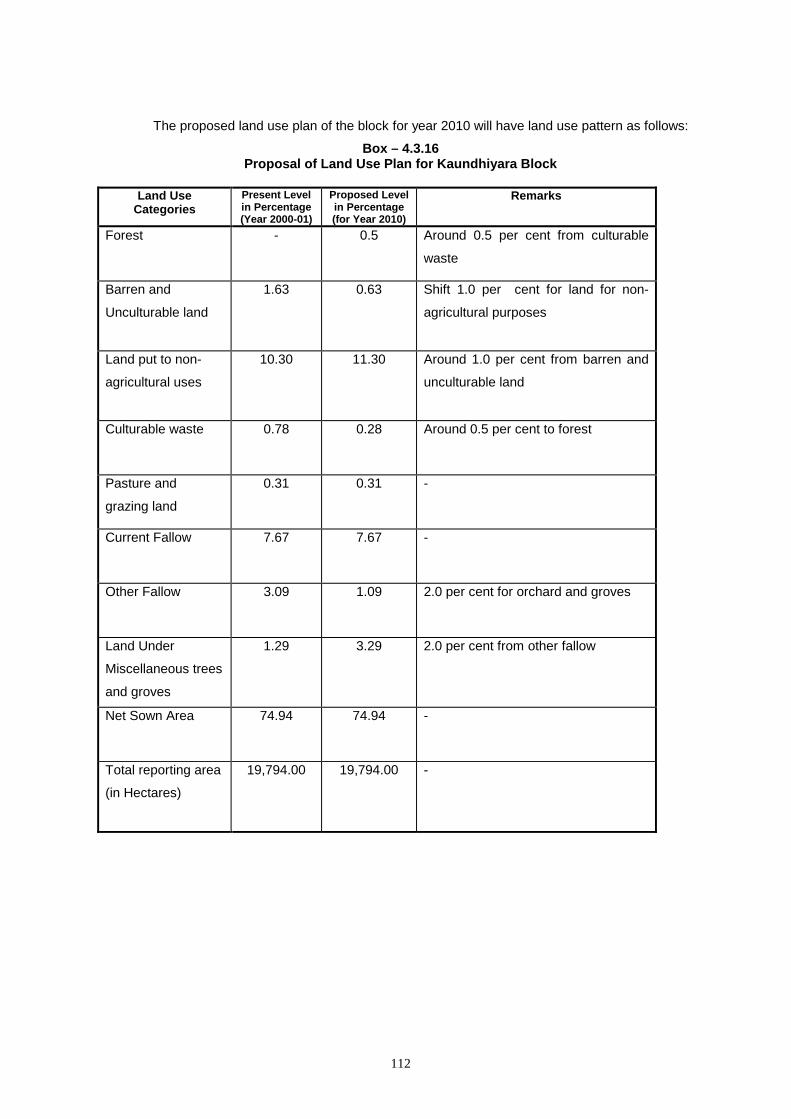
112
The proposed land use plan of the block for year 2010 will have land use pattern as follows:
Box – 4.3.16 Proposal of Land Use Plan for Kaundhiyara Block
Land Use
Categories Present Level in Percentage (Year 2000-01)
Proposed Level in Percentage (for Year 2010)
Remarks
Forest - 0.5 Around 0.5 per cent from culturable
waste
Barren and
Unculturable land
1.63 0.63 Shift 1.0 per cent for land for non-
agricultural purposes
Land put to non-
agricultural uses
10.30 11.30 Around 1.0 per cent from barren and
unculturable land
Culturable waste 0.78 0.28 Around 0.5 per cent to forest
Pasture and
grazing land
0.31 0.31 -
Current Fallow
7.67 7.67 -
Other Fallow 3.09 1.09 2.0 per cent for orchard and groves
Land Under
Miscellaneous trees
and groves
1.29 3.29 2.0 per cent from other fallow
Net Sown Area
74.94 74.94 -
Total reporting area
(in Hectares)
19,794.00 19,794.00 -
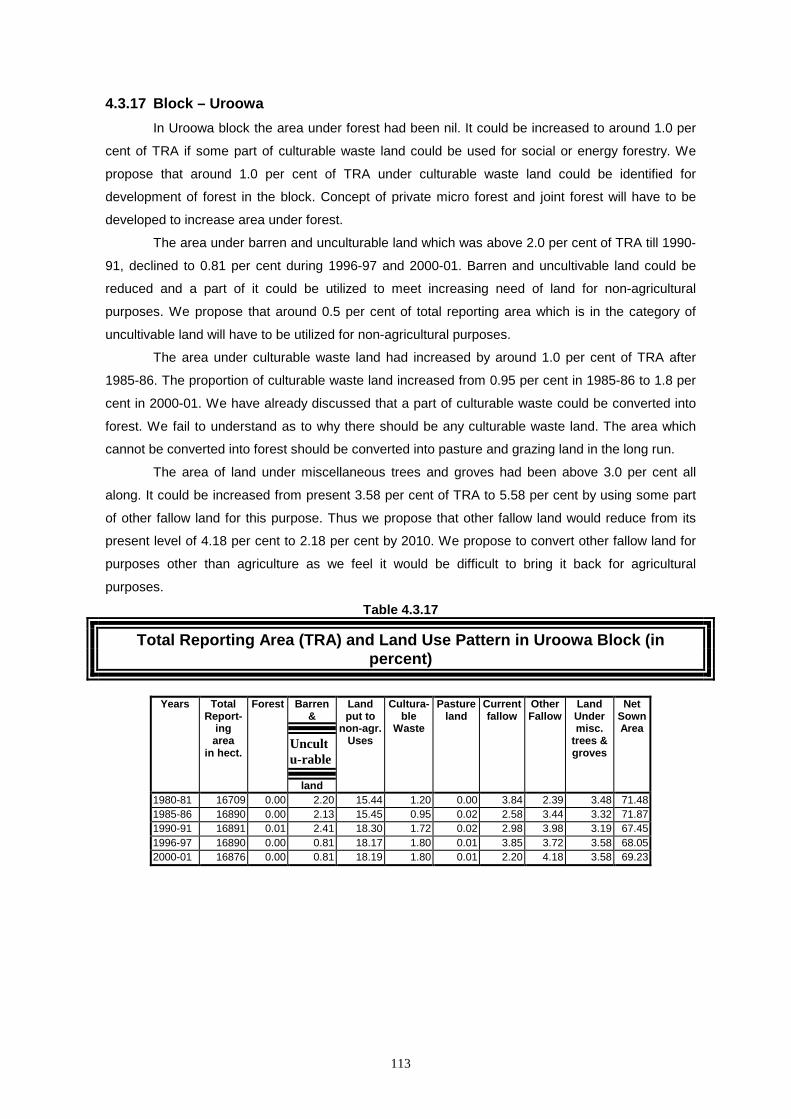
113
4.3.17 Block – Uroowa In Uroowa block the area under forest had been nil. It could be increased to around 1.0 per
cent of TRA if some part of culturable waste land could be used for social or energy forestry. We
propose that around 1.0 per cent of TRA under culturable waste land could be identified for
development of forest in the block. Concept of private micro forest and joint forest will have to be
developed to increase area under forest.
The area under barren and unculturable land which was above 2.0 per cent of TRA till 1990-
91, declined to 0.81 per cent during 1996-97 and 2000-01. Barren and uncultivable land could be
reduced and a part of it could be utilized to meet increasing need of land for non-agricultural
purposes. We propose that around 0.5 per cent of total reporting area which is in the category of
uncultivable land will have to be utilized for non-agricultural purposes.
The area under culturable waste land had increased by around 1.0 per cent of TRA after
1985-86. The proportion of culturable waste land increased from 0.95 per cent in 1985-86 to 1.8 per
cent in 2000-01. We have already discussed that a part of culturable waste could be converted into
forest. We fail to understand as to why there should be any culturable waste land. The area which
cannot be converted into forest should be converted into pasture and grazing land in the long run.
The area of land under miscellaneous trees and groves had been above 3.0 per cent all
along. It could be increased from present 3.58 per cent of TRA to 5.58 per cent by using some part
of other fallow land for this purpose. Thus we propose that other fallow land would reduce from its
present level of 4.18 per cent to 2.18 per cent by 2010. We propose to convert other fallow land for
purposes other than agriculture as we feel it would be difficult to bring it back for agricultural
purposes.
Table 4.3.17
Total Reporting Area (TRA) and Land Use Pattern in Uroowa Block (in percent)
Years Total
Report-ing area
in hect.
Forest Barren &
Uncultu-rable
land
Land put to
non-agr.Uses
Cultura-ble
Waste
Pastureland
Currentfallow
Other Fallow
Land Under misc.
trees & groves
Net Sown Area
1980-81 16709 0.00 2.20 15.44 1.20 0.00 3.84 2.39 3.48 71.48 1985-86 16890 0.00 2.13 15.45 0.95 0.02 2.58 3.44 3.32 71.87 1990-91 16891 0.01 2.41 18.30 1.72 0.02 2.98 3.98 3.19 67.45 1996-97 16890 0.00 0.81 18.17 1.80 0.01 3.85 3.72 3.58 68.05 2000-01 16876 0.00 0.81 18.19 1.80 0.01 2.20 4.18 3.58 69.23
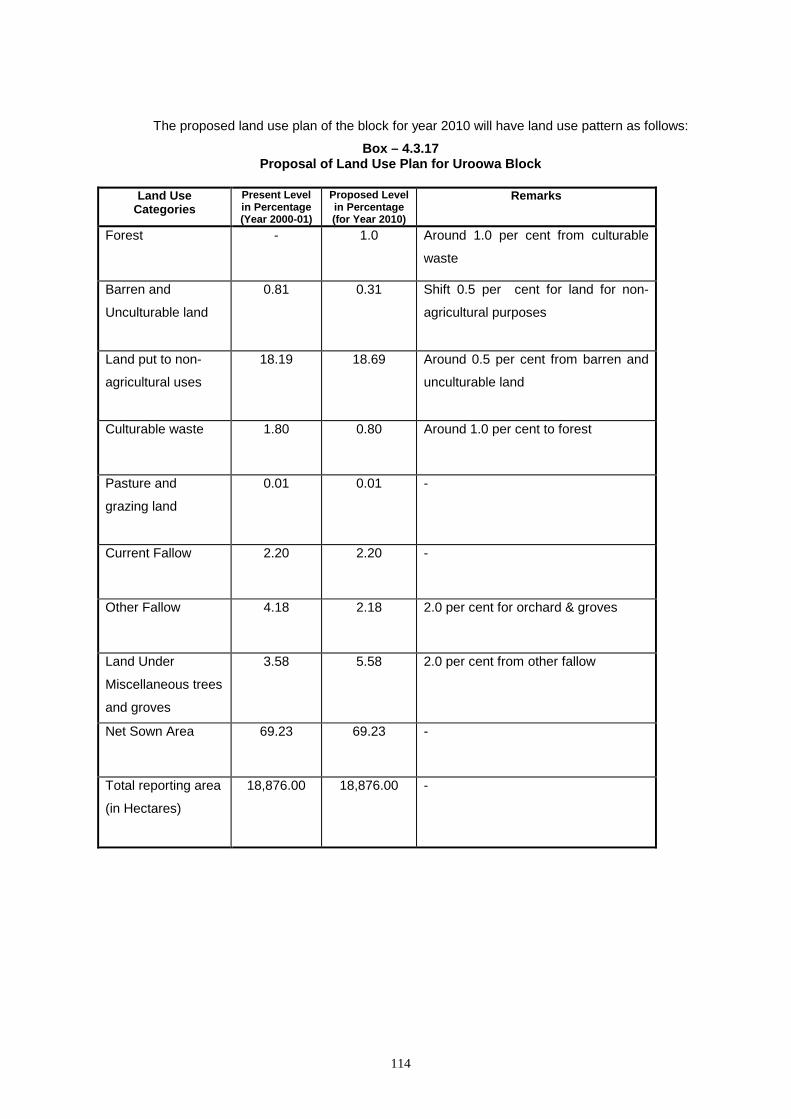
114
The proposed land use plan of the block for year 2010 will have land use pattern as follows:
Box – 4.3.17 Proposal of Land Use Plan for Uroowa Block
Land Use
Categories Present Level in Percentage (Year 2000-01)
Proposed Level in Percentage (for Year 2010)
Remarks
Forest - 1.0 Around 1.0 per cent from culturable
waste
Barren and
Unculturable land
0.81 0.31 Shift 0.5 per cent for land for non-
agricultural purposes
Land put to non-
agricultural uses
18.19 18.69 Around 0.5 per cent from barren and
unculturable land
Culturable waste 1.80 0.80 Around 1.0 per cent to forest
Pasture and
grazing land
0.01 0.01 -
Current Fallow
2.20 2.20 -
Other Fallow 4.18 2.18 2.0 per cent for orchard & groves
Land Under
Miscellaneous trees
and groves
3.58 5.58 2.0 per cent from other fallow
Net Sown Area
69.23 69.23 -
Total reporting area
(in Hectares)
18,876.00 18,876.00 -
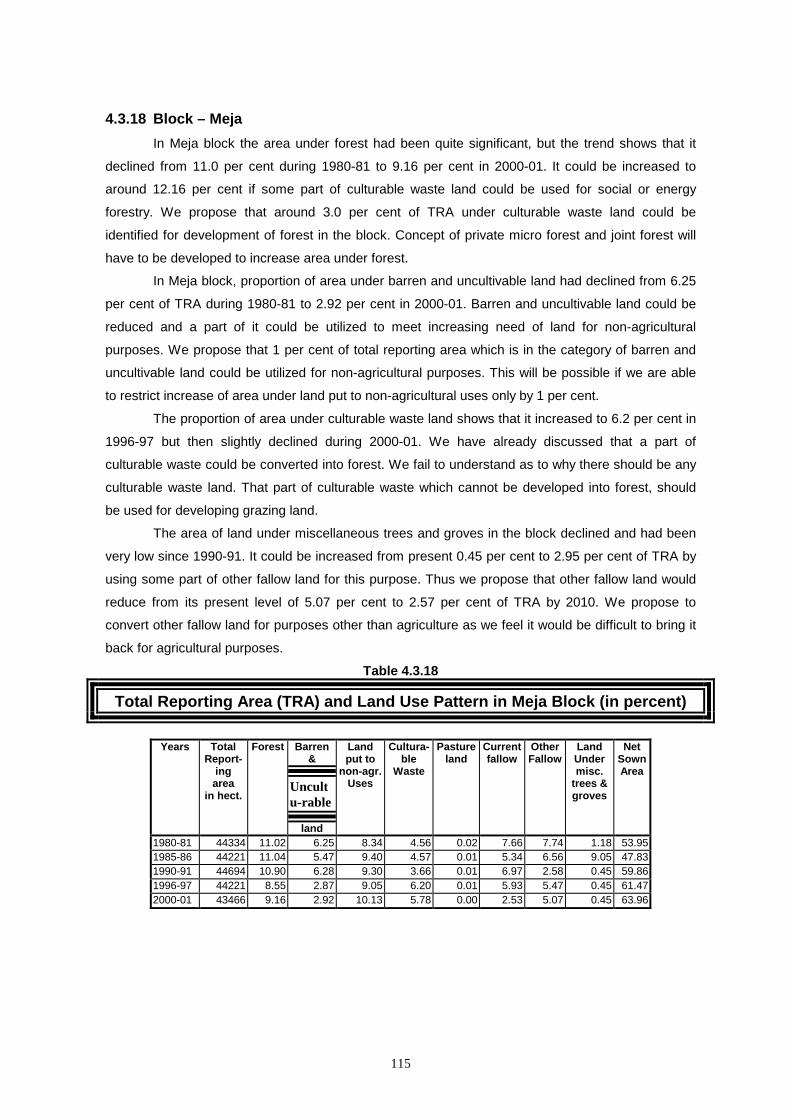
115
4.3.18 Block – Meja In Meja block the area under forest had been quite significant, but the trend shows that it
declined from 11.0 per cent during 1980-81 to 9.16 per cent in 2000-01. It could be increased to
around 12.16 per cent if some part of culturable waste land could be used for social or energy
forestry. We propose that around 3.0 per cent of TRA under culturable waste land could be
identified for development of forest in the block. Concept of private micro forest and joint forest will
have to be developed to increase area under forest.
In Meja block, proportion of area under barren and uncultivable land had declined from 6.25
per cent of TRA during 1980-81 to 2.92 per cent in 2000-01. Barren and uncultivable land could be
reduced and a part of it could be utilized to meet increasing need of land for non-agricultural
purposes. We propose that 1 per cent of total reporting area which is in the category of barren and
uncultivable land could be utilized for non-agricultural purposes. This will be possible if we are able
to restrict increase of area under land put to non-agricultural uses only by 1 per cent.
The proportion of area under culturable waste land shows that it increased to 6.2 per cent in
1996-97 but then slightly declined during 2000-01. We have already discussed that a part of
culturable waste could be converted into forest. We fail to understand as to why there should be any
culturable waste land. That part of culturable waste which cannot be developed into forest, should
be used for developing grazing land.
The area of land under miscellaneous trees and groves in the block declined and had been
very low since 1990-91. It could be increased from present 0.45 per cent to 2.95 per cent of TRA by
using some part of other fallow land for this purpose. Thus we propose that other fallow land would
reduce from its present level of 5.07 per cent to 2.57 per cent of TRA by 2010. We propose to
convert other fallow land for purposes other than agriculture as we feel it would be difficult to bring it
back for agricultural purposes.
Table 4.3.18
Total Reporting Area (TRA) and Land Use Pattern in Meja Block (in percent)
Years Total
Report-ing area
in hect.
Forest Barren &
Uncultu-rable
land
Land put to
non-agr.Uses
Cultura-ble
Waste
Pastureland
Currentfallow
Other Fallow
Land Under misc.
trees & groves
Net Sown Area
1980-81 44334 11.02 6.25 8.34 4.56 0.02 7.66 7.74 1.18 53.95 1985-86 44221 11.04 5.47 9.40 4.57 0.01 5.34 6.56 9.05 47.83 1990-91 44694 10.90 6.28 9.30 3.66 0.01 6.97 2.58 0.45 59.86 1996-97 44221 8.55 2.87 9.05 6.20 0.01 5.93 5.47 0.45 61.47 2000-01 43466 9.16 2.92 10.13 5.78 0.00 2.53 5.07 0.45 63.96

116
The proposed land use plan of the block for year 2010 will have land use pattern as follows:
Box – 4.3.18 Proposal of Land Use Plan for Meja Block
Land Use
Categories Present Level in Percentage (Year 2000-01)
Proposed Level in Percentage (for Year 2010)
Remarks
Forest 9.16 12.16 Around 3.0 per cent from culturable
waste
Barren and
Unculturable land
2.92 1.92 Shift 1.0 per cent for land for non-
agricultural purposes
Land put to non-
agricultural uses
10.13 11.13 Around 1.0 per cent from barren and
unculturable land
Culturable waste 5.78 0.78 Around 3.0 per cent to forest and 2.0
per cent for pastures & grazing land
Pasture and
grazing land
- 2.0 2.0 per cent from culturable waste
Current Fallow
2.53 2.53 -
Other Fallow 5.07 2.57 2.5 per cent for orchard & groves
Land Under
Miscellaneous trees
and groves
0.45 2.95 2.5 per cent from other fallow
Net Sown Area
63.96 63.96 -
Total reporting area
(in Hectares)
43,466.00 43,466.00 -
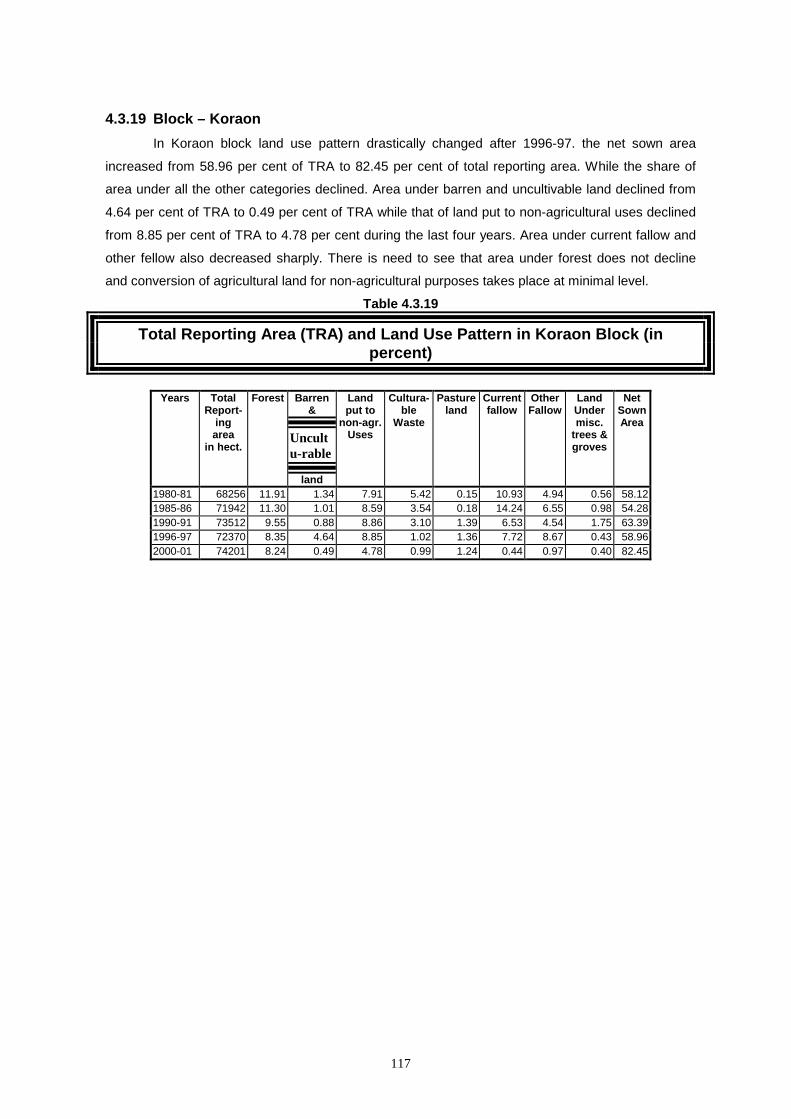
117
4.3.19 Block – Koraon In Koraon block land use pattern drastically changed after 1996-97. the net sown area
increased from 58.96 per cent of TRA to 82.45 per cent of total reporting area. While the share of
area under all the other categories declined. Area under barren and uncultivable land declined from
4.64 per cent of TRA to 0.49 per cent of TRA while that of land put to non-agricultural uses declined
from 8.85 per cent of TRA to 4.78 per cent during the last four years. Area under current fallow and
other fellow also decreased sharply. There is need to see that area under forest does not decline
and conversion of agricultural land for non-agricultural purposes takes place at minimal level.
Table 4.3.19
Total Reporting Area (TRA) and Land Use Pattern in Koraon Block (in percent)
Years Total
Report-ing area
in hect.
Forest Barren &
Uncultu-rable
land
Land put to
non-agr.Uses
Cultura-ble
Waste
Pastureland
Currentfallow
Other Fallow
Land Under misc.
trees & groves
Net Sown Area
1980-81 68256 11.91 1.34 7.91 5.42 0.15 10.93 4.94 0.56 58.12 1985-86 71942 11.30 1.01 8.59 3.54 0.18 14.24 6.55 0.98 54.28 1990-91 73512 9.55 0.88 8.86 3.10 1.39 6.53 4.54 1.75 63.39 1996-97 72370 8.35 4.64 8.85 1.02 1.36 7.72 8.67 0.43 58.96 2000-01 74201 8.24 0.49 4.78 0.99 1.24 0.44 0.97 0.40 82.45
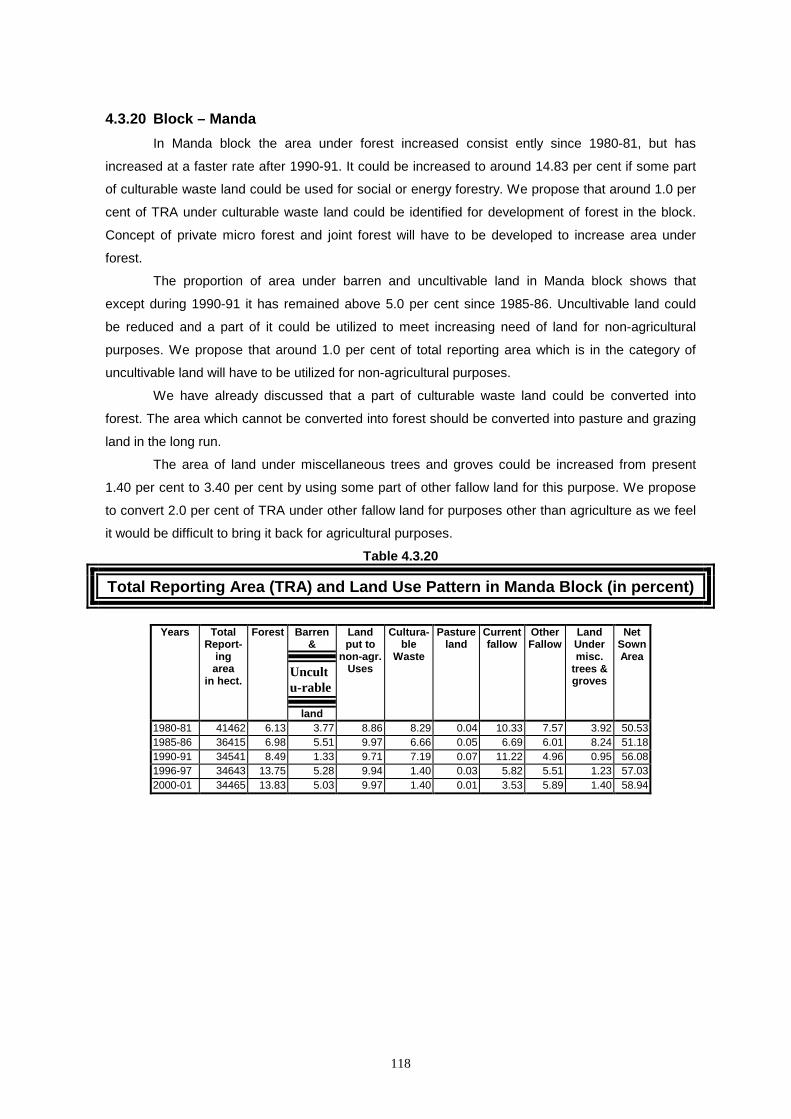
118
4.3.20 Block – Manda In Manda block the area under forest increased consist ently since 1980-81, but has
increased at a faster rate after 1990-91. It could be increased to around 14.83 per cent if some part
of culturable waste land could be used for social or energy forestry. We propose that around 1.0 per
cent of TRA under culturable waste land could be identified for development of forest in the block.
Concept of private micro forest and joint forest will have to be developed to increase area under
forest.
The proportion of area under barren and uncultivable land in Manda block shows that
except during 1990-91 it has remained above 5.0 per cent since 1985-86. Uncultivable land could
be reduced and a part of it could be utilized to meet increasing need of land for non-agricultural
purposes. We propose that around 1.0 per cent of total reporting area which is in the category of
uncultivable land will have to be utilized for non-agricultural purposes.
We have already discussed that a part of culturable waste land could be converted into
forest. The area which cannot be converted into forest should be converted into pasture and grazing
land in the long run.
The area of land under miscellaneous trees and groves could be increased from present
1.40 per cent to 3.40 per cent by using some part of other fallow land for this purpose. We propose
to convert 2.0 per cent of TRA under other fallow land for purposes other than agriculture as we feel
it would be difficult to bring it back for agricultural purposes.
Table 4.3.20
Total Reporting Area (TRA) and Land Use Pattern in Manda Block (in percent)
Years Total
Report-ing area
in hect.
Forest Barren &
Uncultu-rable
land
Land put to
non-agr.Uses
Cultura-ble
Waste
Pastureland
Currentfallow
Other Fallow
Land Under misc.
trees & groves
Net Sown Area
1980-81 41462 6.13 3.77 8.86 8.29 0.04 10.33 7.57 3.92 50.53 1985-86 36415 6.98 5.51 9.97 6.66 0.05 6.69 6.01 8.24 51.18 1990-91 34541 8.49 1.33 9.71 7.19 0.07 11.22 4.96 0.95 56.08 1996-97 34643 13.75 5.28 9.94 1.40 0.03 5.82 5.51 1.23 57.03 2000-01 34465 13.83 5.03 9.97 1.40 0.01 3.53 5.89 1.40 58.94
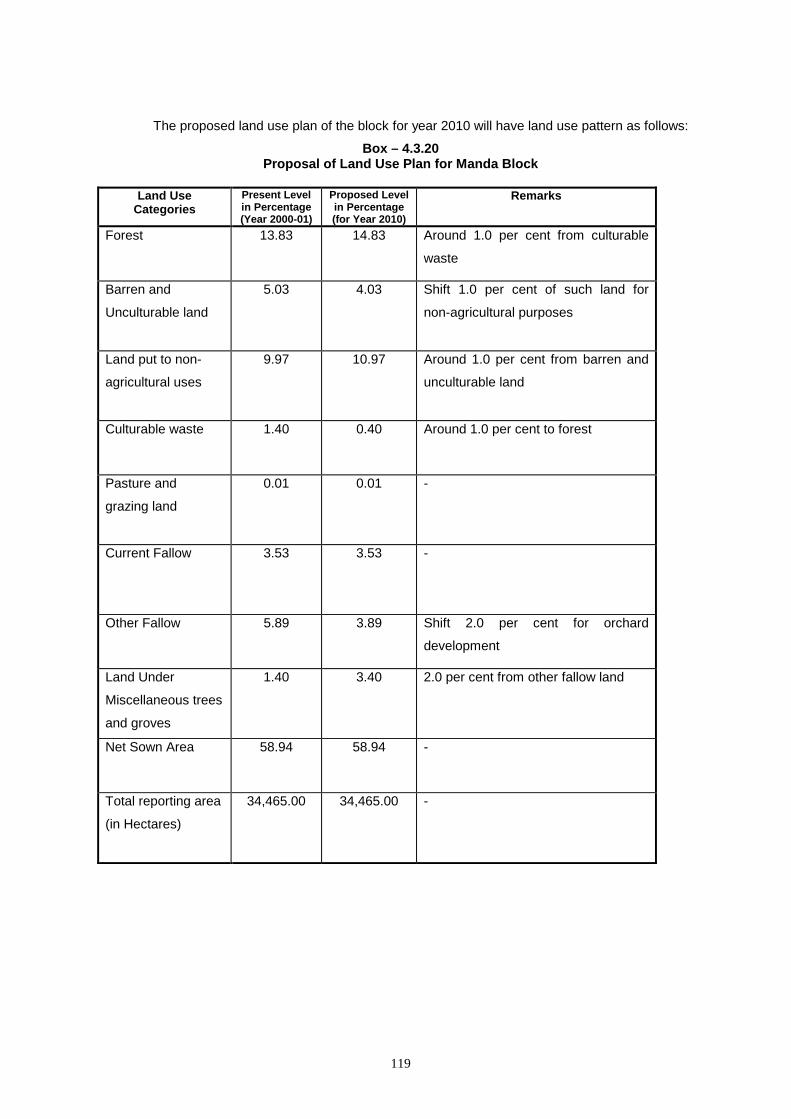
119
The proposed land use plan of the block for year 2010 will have land use pattern as follows:
Box – 4.3.20 Proposal of Land Use Plan for Manda Block
Land Use
Categories Present Level in Percentage (Year 2000-01)
Proposed Level in Percentage (for Year 2010)
Remarks
Forest 13.83 14.83 Around 1.0 per cent from culturable
waste
Barren and
Unculturable land
5.03 4.03 Shift 1.0 per cent of such land for
non-agricultural purposes
Land put to non-
agricultural uses
9.97 10.97 Around 1.0 per cent from barren and
unculturable land
Culturable waste 1.40 0.40 Around 1.0 per cent to forest
Pasture and
grazing land
0.01 0.01 -
Current Fallow
3.53 3.53 -
Other Fallow 5.89 3.89 Shift 2.0 per cent for orchard
development
Land Under
Miscellaneous trees
and groves
1.40 3.40 2.0 per cent from other fallow land
Net Sown Area
58.94 58.94 -
Total reporting area
(in Hectares)
34,465.00 34,465.00 -
120
Chapter – 5
Conclusion and Suggestions
The total area of Allahabad district reduced from 7261.00 sq.km. to 5437.20 sq.km. due to
carving out of new districts.
The number of residential houses have been increasing at the rate of around 24 per cent or
more per decade. Though this is an obvious off shoot of increase in population, it will have serious
implication for land use planning during the coming decades. These implications would have two
aspects. One, more and more land would be brought under the category 'land put to non-agricultural
purposes'. Secondly, planning for housing in both urban and rural areas will have to be given
serious thought such as:
(i) how land saving devices could be adopted;
(ii) how civic amenities could be provided;
(iii) what kind of infra-structural facilities will be needed to be developed; and
(iv) what kind of common use facilities will be required to be developed.
Though Allahabad had been divided, the area under urban limits increased from 89 sq.km.
in 1961 to 146.8 sq.km. in 1981. i.e. an increase of 64.94 per cent during two decades. The share of
urban population has increased from 18.12 per cent in 1961 to 24.72 per cent in 2001.
The decinnial growth rate of population had been very high during the last three decades.
This has resulted in the pressure of population on land.
The pressure on land in Allahabad continues to increase because a sizable work-force was
found to be engaged in agricultural activities.
It was also found that whereas the proportion of agricultural labourers has increased during
1981-91, the proportion of workers in household industry and in other services have declined during
the same period.
6.1 Land Use Plan Related to Agricultural Land In Allahabad district the average size of landholding was 0.75 hectare as per the 1995-96
agricultural census and 91.43 per cent holdings belonged to the small and marginal farmers, while
they accounted for only 57.25 per cent of total area under all landholdings.
The net sown area as percentage of total reporting area increased from around 64 per cent
to above 67 per cent after 1994-95.
But the analysis of block-wise net sown area shows that in most of the blocks the proportion
of net sown area had been above 70.0 per cent during 2000-01 or during some past years. There
121
were only 4 out of 20 blocks where net sown area had been low. These are Chaka, Karchana,
Uroowa and Meja. Net sown area in Chaka was low because it is on the urban fringe. There is need
to regulate land use on urban fringes. In other blocks net sown area could be increased through
micro water shed management programmes.
The cropping intensity of the Allahabad district had almost consistently increased since
1960-61, and has increased to 157.3 during the period 2000-01.
The most important factor which has effected cropping intensity is irrigation.
The irrigation intensity i.e. net irrigated area as percentage of net sown area has increased
from 23.16 per cent in 1960-61 to 71.31 per cent in 2000-01. This trend was discernible in all the
blocks of the district as well.
Furthermore, gross irrigated area as percentage of net irrigated area has also increased
during the last twenty five years from around 118.46 in 1980-81 to around 162.8 in 2000-01 with
fluctuating trends during intervening periods.
Canals and Tubewells are now the major sources of irrigation in Allahabad district, and
account for more than 97 per cent of net irrigated area.
There is another aspect of analysis of sources of irrigation. The role of public sources
continues to be very important. Because canals and government tubewells together account for
more than 60 per cent of net irrigated area in the district. That means, public investment in irrigation
will continue to play an important role in increasing gross irrigated area, which in turn would help in
increasing the cropping intensity in many blocks of the district.
The cropping pattern in the district has vastly changed during the last 30 years.
The main crops viz. paddy, wheat and potato have witnessed large increases in their
productivity also during the period 1960-61 to 1998-99.
Thus farmers have shifted to crops, which are highly irrigated, fertilizer use is higher on
them and whose productivity is also comparatively very high.
We need to make efforts to increase production of more pulses, oilseeds and spices.
Cropping rotation also needs to be changed. Following steps are imperative to achieve it.
(a) More thrust be given for developing high yielding varieties for these crops.
(b) Rain fed areas should be encouraged to cultivate these crops.
(c) Orchards, fallow land and land under social forestry could be used for growing such crops.
(d) Processing industries of oilseeds and spices be promoted at local level with support for
technology up gradation, packaging and market access facilities.
Use of fertilizer had been increasing in all the blocks. But their balanced and proportionate
application has not been reported.
There is need to adopt following strategy to combat this menace:
(a) Circulate guidelines for each gram-panchayat-on the basis of soil-testing – the proportion of
fertilizer which is required to be applied.
(b) Farmers' meeting be organised at village level before every cropping season to make them
aware about such guidelines.
(c) Farmers be also informed about hazardous impact of non-proportionate application of urea.
122
(d) Government functionaries, specially at the gram-panchayat level be sensitised regarding
these aspects.
The extent of mechanisation has increased in the district. The number of tractors, sowing
machine, sprayers, threshing machine etc. have increased, while the number of wood plough have
decreased during the last 20 years.
The trend of increasing mechanisation despite the fact that average size of landholdings has
been decreasing indicates a new type of resource sharing in rural area. Those who cannot afford to
purchase the equipment or machine, hire its services. Be it irrigation water, tractor, thresher or any
other machine, their services are being hired by those who cannot afford to purchase or maintain
them. Very poor farmers do not keep draught animals and hire services of new machines because
they cannot afford to feed draught animals throughout the year.
Tenancy and share cropping was found in our survey in selected villages of the district.
Thus sharing of land resource as well as services of machines indicates emergence of a new type of
land-labour-capital relations.
Livestock plays two types of roles in rural economy, one it provides draught animals or for
pulling carts. Secondly it generates income through animal products, which has serious implications
for diversification of rural economy.
But the size of livestock has also a serious bearing on land use. The increase in livestock
would mean that more land under pasture will be required, as well as more fodder will be required.
Another fall-out of growing urbanisation and increase in extent of mechanisation has been
drastic decline in the number of livestock in Allahabad district. The number of all animals in the
district have declined excepting those of pig and poultry after 1988.
Agricultural Production System and Framework for Land
Use Plan
It was found that the majority of land owners who leased out their land belonged to medium,
small or marginal farmers. The fact that even small and marginal farmers were leasing out their land,
revealed two trends - one, in case of uneconomic holdings farmers want to search other
opportunities and will be content to get the market rent for their land yet they would prefer to retain
the land instead of selling it out right. Moreover, the new generation, if educated seeks jobs in cities,
and prefers to lease out the land. The other aspect was in regard to changing relationship. The
exploitative relationship between tenant/share cropper and the land lord is fast changing. It is now
purely an economic arrangement of mutual interests. Small and marginal farmers also lease-out
land to other small and marginal farmers. Thus enterprising farmers are continuing agricultural
activities by pooling resources from fellow farmers, while some other farmers are trying to make
efforts in non-agricultural activities also.
123
Thus the new form of economic arrangement under tenancy was giving way to emergence
of new enterprising farmers who were seeking ways to pool resources for higher productivity and
application of new technology.
Dependency relationship based tenancy was declining because not many cultivators wanted
to be tied up for the whole of year with some small parcel of land which they did not own, and further
depend on the landlord for resources and credit. Landless or near landless people also now want to
keep options open for seeking job elsewhere as well. So they preferred to work as casual
agricultural labour during peak periods rather than working as an attached labour or as a tenant.
On the other hand leasing-out by small farmers was on the increase because many small
farmers wanted to get job outside agriculture and at the same time wanted some income from their
land also. This was possible only by leasing-out land to fellow farmers at mutually agreed terms.
This kind of tenancy was free from both the dependency and exploitative relationship.
Sharing of machines and equipments was also found to be widely prevalent among farmers
of this district. It was found that almost all farmers owning agricultural machines and equipments
hired out or shared their services with other farmers. many agricultural tools were also found to be
shared among farmers on the exchange basis.
Factors Inhibiting Growth
The immediate factors which inhibited growth among small and marginal farmers were: lack
of resources, capital deficiency and lack of facility to sell at remunerative prices. The other factors
included the problems of water logging, floods, drying of canals during summer, etc.
Framework for Agricultural Growth
Among small and marginal farmers, agricultural productivity is hampered by poor logistical
support and weak infrastructure. If food production is to be increased in a sustainable way, these
deficiencies must be corrected and favourable economic framework for agriculture should be
evolved. Such actions need to be backed up by practices aimed at maintaining or enhancing fertility
and productivity.
The first step is to protect the best land for agriculture. In view of the scarcity of high quality
arable land and the rising demand for food and other agricultural products, the land that is most
suitable for crops should be reserved for agriculture. Government should map and monitor the more
productive areas of farm land and adopt planning and zoning policies to prevent the loss of prime
land to urban settlements. Village Land Management Committee and local authorities should be
entrusted with responsibility to ensure that these policies are implemented in their areas.
We have found that the number of small and marginal farmers in the district is predominant.
It was also found that the immediate factors which inhibited growth among small and marginal
farmers were lack of resources, capital deficiency and lack of facility to sell at remunerative prices.
The most important factor which could become basis for future restructuring of agricultural
124
production system related to tenancy. It was found the majority of land owners who leased out their
land (without entering into any written or formal contract) belonged to the category of medium, small
or marginal farmers. This was for two reasons – one in case of uneconomic holdings, farmers
wanted to search other opportunities and would be content to get the market rent for their land. Yet
they would prefer to retain the land instead of selling it outright. The other aspect was in regard to
non-exploitative nature of relationship between the lessor and the lessess. It is now purely an
economic arrangement in which small and marginal farmers are also leasing out land to other small
and marginal farmers. Thus enterprising farmers are continuing agricultural activities by pooling
resources from fellow farmers, while some other farmers are seeking opportunities in non-
agricultural activities also. Thus the new form of economic arrangement was giving way to pooling of
resources by enterprising farmers, while other farmers who were leasing out their land were treating
their land as a share capital for which they will receive the rent as well as the share in profit. The
process of pooling of resources was further strengthened by a simultaneous process of sharing of
machines and equipments. it was found that almost all farmers owning agricultural machines and
equipments hired out or shared their services with other farmers.
It seems to us that a limited restructuring of the production process in agriculture can be
such that it serves the interests of small and marginal farmers and at the same time protects wider
interests of the farming community.
One major step in this direction would be to allow formation of Collective Farming Society
and Confederation of Farming Societies. In the collective farming society framework, tenancy to
such farming societies could be permitted under specified conditions. In particular such societies
may be formed of small and marginal farmers for a complete package of inputs, and it may then be
permissible for any member of such a society to lease out land to the society or to any other
member of the society.
At the next level, a confederation of such Collective Farming Societies could be formed
which will work as service societies. These confederations would provide high cost machinery and
equipments to Collective Farming Societies on rent. The idea essentially is that it should be possible
to increase number of viable farms by permitting some of the non-viable farmers to go out of
agricultural business and seek other jobs and economic opportunities. This should on the one hand,
improve productivity of labour on the expanded farms and on the other aid in much needed shift of
labour away from agriculture.
Collective Farming Society
1. Collective farming units be allowed to be registered under a separate Collective Farming
Society Registration Act.
2. Only small and marginal farmers be allowed to become members of such a society.
3. The number of members of a society should not be above twenty and below five.
4. Those who become members of such a collective farming society will be allowed to lease
out their land to the society for a minimum of ten years on a fixed annual rent.
125
5. A collective farming society will not bring under its purview more than ten hectares of
irrigated land.
6. A collective farming society will be allowed to pool its resources on hire or through raising
capital from its members.
7. The produce will be shared among members in proportion to the share amount of each
member.
8. The share amount of each member will be the weighted sum of (a) money invested under
capital raising scheme plus, (b) the amount fixed as annual rent for the land leased out to
the society, (c) operational holdings of actual cultivators.
Confederation of Collective Farming Societies
For storage facilities, providing transportation facilities and to work as marketing syndicates
of farming societies, a confederation of ten to twenty corporate farming societies be allowed to be
formed.
These confederations will work in the following areas:
1. Marketing of agricultural goods at national and international level.
2. Provide transportation and storage facilities to Collective Farming Societies against such
stored goods.
3. Function as cushions against speculative prices.
4. The confederation will also act as counselling centre for farmers projecting the production
and demands of each agricultural commodity for the next two years.
5. Provide high costing tools and machines to Collective Farming Societies for land levelling,
soil testing, land reclamation and other activities related to land and water management on
rental basis.
6. Help in technological innovations and in increasing productive efficiency.
6.2 District Level Analysis of Land Use Pattern and Land Use Plan (Other than Agricultural Land)
Our focus in preparing land use plan has been three fold –
(i) Agricultural land be transferred for use to other purposes.
(ii) Maximum area be brought under vegetative cover i.e.
(a) Increase forest
(b) Increase area under miscellaneous trees and groves.
(c) Increase area under pasture and grazing land in that order.
(iii) Use culturable waste and other fallow land for such purposes. Therefore, efforts
should be made to convert land under these categories into forest, orchards or
grazing land.
(iv) Barren and unculturable land be used for constructing buildings or infra-structural
facilities.
Forest
126
The forest land was around 2.7 per cent of total reporting area during the period 1970-71 to
1997-98. Thereafter it increased to around 3.6 per cent. There are four blocks in the district where
area under forest has some sizable proportion. These are: Shankargarh (10.23 per cent), Meja (9.16
per cent), Koraon (8.24 per cent) and Manda (13.75 per cent). The area under culturable waste was
above 5.0 per cent of total reporting area in the following blocks: Kaurihar, Baharia, Phulpur,
Bahadurpur, Chaka and Meja, while area under other fallow was above 5.0 per cent of total
reporting area in Kaurihar, Shankargarh, Meja and Manda blocks.
The area under forest could be brought to around 5 per cent of total reporting area, if some
part of the land under other fallow and some part of land under culturable waste is brought under
forest. This could be done by forming Joint Forest Management Committees consisting of plant
growers from poor peasantry class and representatives of forest department and land use
committee. A cell should be formed to provide them the financial support and infra-structural support
so that they could get suitable plants, methods to protect them and finally marketing of forest
produce.
Secondly, development of such forests should be linked with watershed management in the
area. For this purpose an area of 500 hectares to 1000 hectares should be choosen as unit for
micro-watershed management.
This would include (i) construction of water retention structures (ii) clearing and desilting of
natural courses of drainage systems and (iii) restoration/reconstruction of ponds/ tanks in totally
barren lands or low lying lands.
Thirdly programmes like Pradhan Mantri Rojgar Yojana etc. should be now utilised for
construction of bundhis, management of wild resources including fisheries, drainage maintenance
and enhancement etc.
Fourthly, more emphasis will have to be laid on energy plantation which would provide fuel
wood besides growing of fruit trees rather than timber linked growth of forests.
Private Micro Forests
Private micro forest is different from orchards, as orchards generally comprise fruit bearing
plants. The concept of private micro forest envisages that private individuals could also grow various
varieties of plants. We have in the past found that eucalyptus had been grown in private land
because it was expected to fetch good amount. The private waste land could also be used for
growing timber, energy plants, etc. This could also be linked with purification of surroundings. For
this purpose plants related to different planets (Navgrah) and different Nakshatra which are 27 in
numbers could be planted as per specified arrangement.
Even plants with medicinal value could be grown in such land if people could be informed
about their medicinal and commercial value.
Land Put to Non-agricultural Uses Area under land put to non-agricultural uses has been continuously increasing over the past
40 years. It was around 9.5 per cent during 1960-61 and has risen to around 12 per cent by the end
of year 2000.
127
Land in this category has been steadily increasing. However, this increase is faster in blocks
located at the urban fringe. Chaka is one such block where land put to non-agricultural uses is 21.22
per cent of the total reporting areas.
Besides Allahabad, there are nine townships in Allahabad district. These have also affected
growth of land put to non-agricultural uses.
Besides these, there are some non-notified local markets. Land put to non-agricultural uses
is also high in them. These include Kaurihar (16.91 per cent), Soraon (14.15 per cent) and Saidabad
(14.02 per cent).
Regulation of Land Use at Urban Fringes
There is need to regulate land use at urban fringes. This could be done by setting up an
Allahabad Urban Fringe Development Authority. The UFDA could decide on the following:
(i) Conservation of green areas such as orchards, agriculture, social forestry and allied
activities.
(ii) Development of water management and drainage system. Ponds and other water retention
structures be revived. Any encroachment on such land should be identified and legal
proceedings against encroachers be initiated.
(iii) The provisions made under Zamindari Abolition and Land Reforms Acts (specially section
143 and 154) and Consolidation of Holdings Act be used effectively to check diversion of
agricultural land for non-agricultural purposes.
(iv) Heavy fine should be imposed (say ten times the cost of the land) in case of such diversion,
on the owner of the land.
(v) In addition to it, if the agricultural land had been sold then capital gain tax should be
imposed on purchaser of the land. Because huge capital gain accrues to the builders who
develop colonies in such land.
(vi) Priority be given to development of social services in the fringe area which will include
hospitals, educational centres, training centres for farmers and agro-based industries.
(vii) Barren and culturable land should be identified for development of micro-industrial estates
and then for developing multistoried residential complexes which are land saving as well.
Uroowa is one block where proportion of land under category of land put to non-agricultural
uses is very high because the area of the block is small and a large part of it is covered by rail and
road network.
Besides urban fringes there is need to restrict the rate of increase of area under land put to
non-agricultural uses, in rural areas in general.
This could be made possible by adopting following steps.
(a) Discourage migration of people of nearby villages. This could be done by increasing
transport facility and by improving road networks.
(b) Strengthen household industries of rural areas by providing them institutional support
and market facilities.
(c) Develop green belt around city and any construction in the green belt area be strictly
prohibited.
128
(d) Encourage multi-story buildings and economic flats to weaker sections.
One important aspect of land put to non-agricultural uses is increasing number of residential
houses. However, since population growth rate is faster, per person living area is decreasing. Even
more disturbing factor is that per person open area in house premises is also declining. This is the
trend in even rural areas. Hence space for community uses and common recreation places must be
developed even in rural areas. In city planning we leave space for parks, playgrounds and
recreation spots. Such planning should also be done for rural areas. Watershed management could
then be linked with development of parks and recreation places. Some area could also be reserved
for floriculture and horticulture.
Regulation of Land Use along Road Side
There has been a tendency to change land use along road side – specially national
highways and state highways. Houses and shops are constructed or such land is put to even other
non-agricultural uses. As a result of this contiguous effect leads to further expansion of settlements
near highways and such places become accident prone. Therefore, there is need to regulate land
use along roadside. Following measures could be adopted in this respect:
(i) A green strip be developed on both sides of road. Such green strip on each side should not
be less than 10 meter wide.
(ii) Wherever, highways are connected with other roads, construction along side even such
connecting roads be prohibited for a length of at least one kilometer.
(iii) Those who construct houses or buildings on agricultural lands along side road should be
fined heavily (say ten times the cost of the land).
The rate of increase of area under the category of land put to non-agricultural uses could
then be restricted to around 13.5 per cent of total reporting area by the year 2010.
Barren and Unculturable Land Barren and unculturable land could be used for further expansion of residential places,
playgrounds and construction of building for common uses such as school or panchayat bhawan. It
could also be used as Khalihan if it is nearby fields. And it could be used for cremation ground or
graveyard if it is far away from habitation.
Thus, barren and unculturable land could be shifted for use as land put to non-agricultural
purposes. Some part of it could also be used for developing as pasture and grazing land.
We hope that through these measures, area under barren and unculturable land could be
reduced from 3.5 per cent to 1.0 per cent of reporting area in district Allahabad.
Culturable Waste This is a category showing non-enterprise. To our mind, there should be no such category.
If cultivation is not possible then it could be converted into area for social forestry or developed as
pasture and other grazing land.
Currently area under culturable waste is 2.46 per cent of total reporting area. A part of it
(say around 1.5 per cent) could be converted into social forestry and the rest i.e. around 0.9 per cent
could be developed as pasture and other grazing land. At some places, such land could also be
used for fodder cultivation – specially those areas, which are owned by private individuals.
129
Support should be provided for developing pasture land and growing fodder.
Culturable Waste along River Side Allahabad had two major rivers and many tributories flowing through it. The patches of land
along side these rivers are undulating and at some place with high mounds. These areas could be
developed as reserved forest strips with one to two kilometers' width. Plant varieties which suit the
local soils could be grown in these reserved forest strips.
Development of these reserved forest strips should also be linked with river water pollution
control systems. It means that water which goes through drainage courses and which meets these
rivers should be treated before it reaches the river. The management of reserved strip forest should
be entrusted with the responsibility to operate the treatment plants.
Besides reserved forest strips, parks and picnic spots could be developed at various points
along the river route. Such parks/picnic spots could become centres of sight seeing and attraction
for tourists as well.
Land under Miscellaneous Trees, Crops, and Groves not included in Net Sown Area
Land use under this category had been the first victim of population growth and conversion
for other uses.
Land under this category could be increased by 1.0 per cent of total reporting area by
converting 1.0 per cent of total reporting area under other fallow land for growing miscellaneous
trees and groves. We propose this because we feel that it would be difficult to bring back all the
other fallow land under cultivation.
Reduction of such area increases run off of rain water. Such areas are best suited for agro-
forestry. The main types of agro-forestry system are:
(a) alley cropping – where annual crops are grown between lines of trees that produce
valuable mulching material.
(b) orchard systems – where the trees provide edible fruits, medicines and fuel wood, while
the ground layer is cropped or grazed.
(c) growth of scattered trees with pasture at the ground or grazing land.
Conserve Genetic Resources: Land under the above category should also be used to
conserve genetic resources. This could be done by focussing on following programmes.
♦ Support grassroots associations of farmers and gardeners for the maintenance of traditional and local cultivars and breeds. Involve women's groups, Record farmers knowledge of traditional and local cultivars and breeds,
♦ Develop a common information service for exchange in information and germplasm among grassroots, state and national agencies.
6.3 Some General Suggestions 6.3.1 District Level (i) District Land Use Committee should be strengthened. The Committee must meet at least
once in a year and take stock of changes which have occurred during past one year. It
should also be informed about up-dating of records and changes which have taken place
during the year.
130
(ii) As regards its constitution, it should also include District Panchayat Adyaksha, BDOs and
some more representatives of farmers.
(iii) Each line department and BDO should be asked to furnish informations in a pre-structured
proforma.
(iv) The annual proceedings be documented and action plans drawn in the meeting be
circulated to all concerned departments and functionaries.
6.3.2 Block Level (i) Need for Block Level Land Use Committee (BLUC)
There is Land Use Committee at district level. There are Land Management Committees at
the village level. But there are no land use committees at the block level.
Land records were maintained with a view to fix land revenue by the revenue department.
There had been no systematic effort to maintain land records to identify land use categories
on the basis of their potential development and quality.
The development perspective requires that unit for land use planning by made at block
level. Because at district level it remains too generalised, while at village level, it would
create operational problems in coordinating various line departments who have bearing on
the land use. Therefore, there is need to create a planning cum implementing agency at he
block level.
The Block level Land Use Committee may be formed with following as their members:
Block Pramukh - President
B.D.O. - Convenor
A.D.O. (Stat.) - Secretary
Other Members will include representatives from concerned line departments and some
specialists, and
Three B.D.C. Members (to be selected by Kshetra Panchayat Members)
Block level Land Use Committee may take up the following issues for planning and
implementation in the block:
(ii) Salinity and Alkalinity
The problem of alkalinity arises when infiltration rate of water in soil is low. This results in
higher run off of surface water and creates problems of water logging in adjoining areas. As
the water gets muddy, it also creates pollution of water streams. Reclamation of such land
will have multiple effect. Such as increase in the infiltration rate, increase in recharge of
ground water, reduction in water logging and control on water polluation.
Following steps should be encouraged for reclamation of such land:
(a) Construction of field bunds – through boundary mounds,
(b) Levelling of fields,
(c) Use of gypsum/pyrites, depending upon the degree of alkalinity,
(d) Rotation of crops.
Group of farmers be formed for their collective action. Then such groups could be provided
financial, technical and infra-structural support for reclamation of alkaline land.
131
(iii) Water Managment Reforms are needed to facilitate water management systems for various reasons:
(a) rain and surface water needs to be preserved instead of being allowed to go waste via
drain courses;
(b) natural drain courses should not be allowed to be obstructed otherwise it leads to
avoidable water-logging
Increase in the number of private tubewells results in the lowering of level of ground water,
therefore water management should include recharging by using rain/surface water.
By reducing run off we can check removal of top fertile soil on the one hand and maintain
infiltration on the other. the catchment area of each water route should be mapped out and
the programme to manage rain water should start from the highest land and end at the
drainage basin.
Water harvesting will involve shaping farm land and sometimes also the catchment area of
water course to slow the flow of water and thereby increase infiltration into soil. There are
several cheap ways to make contours, if this is taken up collectively.
The sloppy areas and those along the drainage or field boundary which otherwise are not
suitable for agriculture needs conservation efforts with optimum plant productivity. The strip
plantations of multipurpose trees or shelter belts for crop lands will provide wood/leaf fodder
and also ameliorate environment.
Water reservoir tanks/ponds/bundhis be constructed at places where main drain routes
meet. Such land should be mapped and brought under community/panchayat ownership.
No other construction be allowed to take place on such land through suitable modification in
laws.
Drain network-allowing disposal of waste household water as well as community water
using posts should be linked with natural drainage (by gravity flow) courses. Thus there
should be micro drains (for disposal of household waste water), which will have to be
connected to a community drain and finally the entire waste water has to be drained to other
reservoir sites after proper treatment.
Area along the drainage route should be allowed for fodder cultivation and if possible for
farm forestry. Fodder cultivation and farm forestry needs to be developed in chronically
water-logged areas. To facilitate this, land along drain routes and water-logged land be kept
outside the purview of tenancy provisions. Secondly, land owners of such land be permitted
to form fodder or farm forest production units and lease out their land to such collective
production units.
(iv) Protection of Communal Land Common resource property has been one of the most important source of sustenance of
livelihood of less privileged communities in many backward and remote areas.
132
A support system for maintenance and quality improvement in land use is needed to protect
grazing land, land under trees, bushes etc. as well as protection of land for chak road and
drainage system is also necessary. Through detailed mapping of each village, common
resource property (water recharging, drainage, trees) etc. should be brought under
community management and these should become non transferable and any activity that
leads to their destruction should become unlawful.
The role of common resource property and its allocation systems becomes crucial in
management of these natural resources. It must be emphasized that management of such
resources be vested with the local communities who will take a longer view. Outside
commercial interest will come and go with narrow economic interest only.
Effective communal property rights and resource management systems could be developed
by empowering panchayats to develop modes of their use in their respective panchayats
and by providing them technical and managerial skill as well as the needed capital
resources.
(v) Culturable Waste Lands and Fallow Land Culturable waste land could be brought under vegetable cover by providing necessary
institutional and infra-structural support.
We suggest following measures to facilitate their proper use.
(a) Identification of Records: Presently such lands are identified and delineated through
revenue records. Block Level Land Use Committee (BLUC) be entrusted with the
responsibility to identify and delineate such land in each block. Land Management
Committees of each Gram Panchayat should be involved in the process.
(b) Preparation of Land Use Maps: Land use maps for all the villages be prepared by the
proposed BLUC.
(c) Put Such Land outside the Purview of Tenancy Clause: These types of land require
huge investment and long waitings for their reclamation. If they remain within the
purview of Tenancy Clause, it would be difficult for farmers to pool such land and invest
on them, because farmers generally prefer to invest on prime land rather than on
degraded land.
(d) Lease Out Such Land to Landless Peasants' Societies: Most of such land is under
State or Gram Samaj ownership. Distribution of small parcel of such land to individual
small farmers or land less peasants will not work. Because individual peasants in these
categories have neither the sufficient capital to invest nor they could wait for longer
periods to reap the profits of their investments. Landless Peasants' Societies could be
expected to make long term heavy investments provided such land are leased out to
them for sufficiently a longer duration, and they are provided cheaper loans for this
purpose.
133
(vi) A New Model for Culturable Waste and Degraded Land For taking up regeneration activities of culturable waste and degraded land we will have to
keep the following factors in mind:
(a) Size of such land in contiguity;
(b) Nature of regeneration programme;
(c) Raising of capital and acquisition of technical support
(d) Incentive for participation of interested landless peasants and capacity building;
(e) Changes in the tenural rights over such land; and
(f) Distribution of benefits.
Keeping these in view we suggest another model in which local people could be involved,
and its economic viability could be ensured.
We suggest that a joint venture of state sector with local organisation be formed for this
purpose.
As a first step a Collective Land Development Society (or Self Help Group for Land
Development) be formed at local level. This Collective Land Development Society or SHG
should enter into a contract with any state department, which has been approved for the
purpose by the government.
(vii) Land Development Society/SHG for Land Development (a) A Land Development Society or SHG shall be formed for a land chunk of 10 to 25
acres.
(b) The chunk of land be divided into 10-20 equal size sub-chunks.
(c) Lease out around 1 acre of such sub-chunk land piece to one landless family each.
(d) The tenure holder, in turn, will have to become member of the Land Development
Society or SHG.
(viii) Joint Venture A Public Corporate Organisation (approved by the government for the purpose) will then
enter into an agreement with Land Development Society or SHG for a minimum of ten years
for jointly developing the land and for its utilization.
(a) Members of Land Development Society or SHG would provide land and labour;
(b) Public Corporate Organisation will provide capital, technology and technical know-how;
(c) A joint management system will be evolved;
(d) One-third of the profit shall be ploughed back for further raising the capital stock of the
joint venture.
(e) The rest of the profit shall be shared on 50:50 basis between the state unit and Land
Development Society.
6.3.3 Village Level
134
(i) The land use plan is almost finalized after consolidation of holdings is implemented in a
village. It provides land for various purposes in the village besides consolidating holdings.
These include -
(a) provision of roads and public irrigation channels,
(b) provision of land for house sites for scheduled castes and other weaker sections,
(c) provision of sector roads, inter village roads and link roads,
(d) provision of land for community purposes namely – schools, playgrounds, panchayat
ghar, hospital, cremation ground, graveyards, threshing floor, manure pits, pasture land,
plantation trees, flaying sites etc.
(e) solving of common disputes in the village regarding roads/naalis for irrigation for each
field through chak roads and chak naalis.
The problem is that powerful persons in the village influence functionaries of the
consolidation work and get some of government and community land located near their
farms. And once consolidation work is over, they easily encroach upon such community
land.
Therefore effort should be made that Bachat and Gram Sabha land is not left scattered at
many places. The consolidation process should also consolidate government and gram
sabha land in one or two large consolidated chaks.
The land which had been carved out as orchard, grazing land or pond/tank in the past,
should not be allowed to be transferred for other purposes by new rounds of consolidation –
neither through chak carvation nor through readjustment of gram sabha land.
(ii) Whenever chakbandi is declared, illegal felling of trees takes place, land under orchards or
pasture or such other uses is sought to be shown as land under cultivation. This happens on
a large scale specially on Gaon Sabha and government land. In order to check such
changes in land use on the eve of consolidation, revenue officials and consolidation officials
should jointly prepare reports and send report to concerned courts for quick action. The
power to decide such cases should be assigned to concerned SDM.
Similarly provisions of Consolidation of Holdings Act and Manual regarding provision of
inter-village link road, bachat land, Gaon Sabha and Government land and other common
property resources should be widely made known to people so that its strict implementation
is done with peoples participation.
(iii) After consolidation is over land use for each plot of the villages is well defined.
It should be the responsibility of LMC to see that land use is not alterned. There should be
training of LMC members to make them aware of their roles and responsibilities.
(iv) Land Management Committee should be treated as Chakbandi Committee during the period
of consolidation. Formation of separate committee does not prove helpful as it is at the
mercy of consolidation department and Pradhan only and ceases to exist after consolidation
work is over.
(v) All members of Chakbandi Committee should sign the final land use map prepared after
consolidation work is over.
135
(vi) The map of the village should be made available to all the members of Land Management
Committee, free of cost.
(vii) Encroachers of government and/or gram sabha land should be severely penalised and
eviction proceedings against them should be made more stringent.
(viii) Land capability maps he prepared for each village. The land use of each type of land could
then be planned for effective, efficient, sustainable and profitable use.
The land capability map will indicate about the texture and quality of soil. It will also give
information about limitations of the land such as erosion, water logging, degree of alkalinity
or salinity etc.
Thus land capability maps would provide necessary inputs for land use planning i.e.
suitability of land for agriculture, horticulture, forestry etc. It will also indicate as to what
measures would be needed for improving land for its optimum utilisation.
(ix) The Land Management Committee at the village level be revamped. And there should be
fair representation of weaker sections, beneficiaries of land allottees, self help groups and
all the hamlets/communities of the village.
The committee should meet once every six months, develop plans for water conservation,
drainage channels, regeneration of degraded land, effective use of lands in the category of
(a) barren and uncultivable land, (b) pastures, (c) orchards groves and land under trees and
(d) fallow land.
(x) There are already legal provisions under consolidation of Holdings Act and Supreme Court
Judgements in regard to protection of land uses. These should be widely circulated among
members of Land Management Committee. Proceedings for eviction of encroachers should
be launched in right earnest. The provision should be made in law for eviction of
unauthorised occupation of Gram Sabha land by summary proceedings.
(xi) The gaon sabha land or pond or forest land should be given on lease to self help groups or
tree growers society or such other collective groups rather than to individuals.
136
6.4 Block Level Plans for Year 2010
The proposed land use plan of the Kaurihar block for year 2010 will have land use pattern
as follows:
Box - 6.4.1 Proposal of Land Use Plan for Kaurihar Block
Land Use
Categories Present Level in Percentage (Year 2000-01)
Proposed Level in Percentage (for Year 2010)
Remarks
Forest 0.36 5.36 Around 1.5 per cent from other fallow
land and around 3.5 per cent from
culturable waste
Barren and
Unculturable land
1.20 0.20 Shift 1 per cent for land for non-
agricultural purposes
Land put to non-
agricultural uses
16.67 17.67 Around 1.0 per cent from barren and
unculturable land
Culturable waste 5.51 0.51 Around 3.5 per cent to forest and
around 1.5 per cent for pasture
grazing land
Pasture and
grazing land
0.21 1.71 1.5 per cent from culturable waste
Current Fallow
9.14 6.91 2.23 per cent to net sown area
Other Fallow 7.37 3.37 1.5 per cent to forest and 2.5 per cent
for orchard & groves
Land Under
Miscellaneous trees
and groves
1.77 4.27 2.5 per cent from other fallow
Net Sown Area
57.77 60.0 2.23 per cent from current fallow land
Total reporting area
(in Hectares)
40,403.00 40,403.00 -
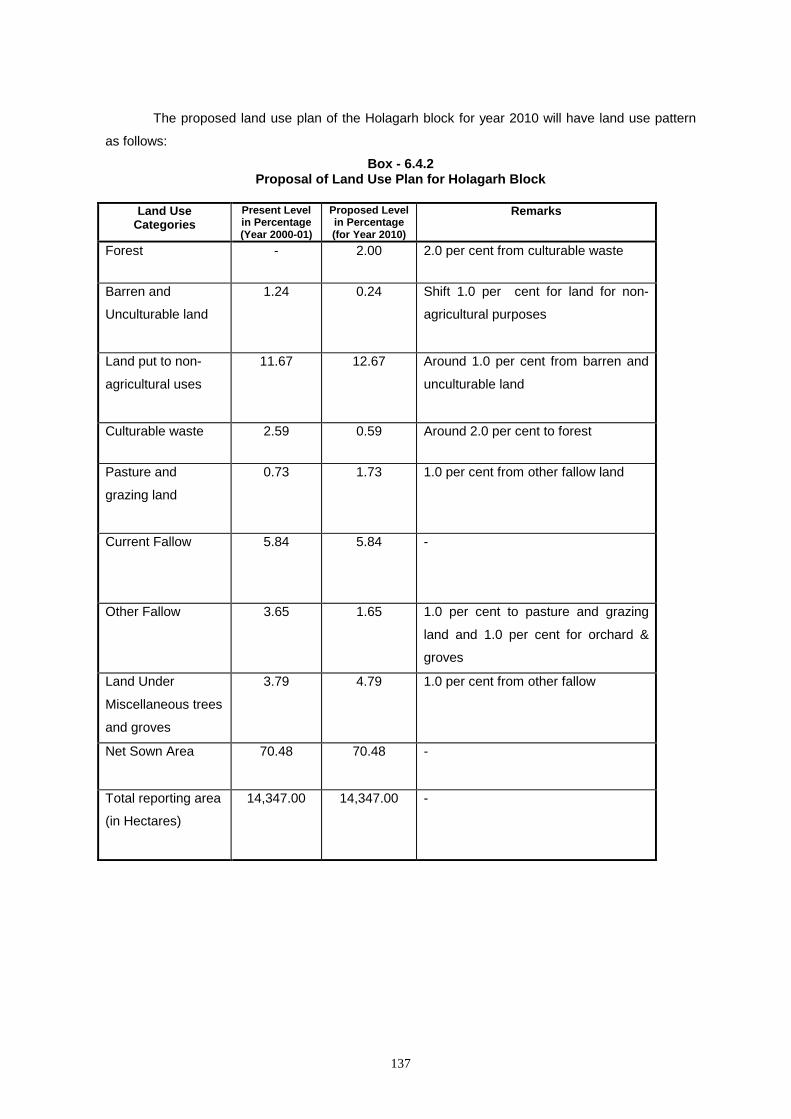
137
The proposed land use plan of the Holagarh block for year 2010 will have land use pattern
as follows:
Box - 6.4.2 Proposal of Land Use Plan for Holagarh Block
Land Use
Categories Present Level in Percentage (Year 2000-01)
Proposed Level in Percentage (for Year 2010)
Remarks
Forest - 2.00 2.0 per cent from culturable waste
Barren and
Unculturable land
1.24 0.24 Shift 1.0 per cent for land for non-
agricultural purposes
Land put to non-
agricultural uses
11.67 12.67 Around 1.0 per cent from barren and
unculturable land
Culturable waste 2.59 0.59 Around 2.0 per cent to forest
Pasture and
grazing land
0.73 1.73 1.0 per cent from other fallow land
Current Fallow
5.84 5.84 -
Other Fallow 3.65 1.65 1.0 per cent to pasture and grazing
land and 1.0 per cent for orchard &
groves
Land Under
Miscellaneous trees
and groves
3.79 4.79 1.0 per cent from other fallow
Net Sown Area
70.48 70.48 -
Total reporting area
(in Hectares)
14,347.00 14,347.00 -

138
The proposed land use plan of the Mau-Aima block for year 2010 will have land use pattern
as follows:
Box - 6.4.3 Proposal of Land Use Plan for Mau-Aima Block
Land Use
Categories Present Level in Percentage (Year 2000-01)
Proposed Level in Percentage (for Year 2010)
Remarks
Forest - 2.00 Around 2.0 per cent from culturable
waste
Barren and
Unculturable land
1.64 0.64 Shift 1.0 per cent of land for non-
agricultural purposes
Land put to non-
agricultural uses
12.72 13.72 Around 1.0 per cent from barren and
unculturable land
Culturable waste 3.94 0.94 Around 2.0 per cent to forest and 1.0
per cent to pasture and grazing land
Pasture and
grazing land
0.57 1.57 1.0 per cent from culturable waste
land
Current Fallow
5.17 5.17 -
Other Fallow 3.07 2.07 1.0 per cent for orchard & groves
Land Under
Miscellaneous trees
and groves
1.82 2.82 1.0 per cent from other fallow
Net Sown Area
71.07 71.07 -
Total reporting area
(in Hectares)
14,648.00 14,648.00 -

139
The proposed land use plan of the Soraon block for year 2010 will have land use pattern as
follows:
Box - 6.4.4 Proposal of Land Use Plan for Soraon Block
Land Use
Categories Present Level in Percentage (Year 2000-01)
Proposed Level in Percentage (for Year 2010)
Remarks
Forest 0.07 1.07 Around 1.0per cent from culturable
waste
Barren and
Unculturable land
1.60 0.60 Shift 1.0 per cent of such land for
non-agricultural purposes
Land put to non-
agricultural uses
14.30 15.30 Around 1.0 per cent from barren and
unculturable land
Culturable waste 1.20 0.20 Around 1.0 per cent to forest
Pasture and
grazing land
0.13 0.51 -
Current Fallow
9.14 9.14 -
Other Fallow 1.85 0.85 Around 1.0 per cent to orchards
Land Under
Miscellaneous trees
and groves
2.42 3.42 1.0 per cent from other fallow land
Net Sown Area
76.32 76.32 -
Total reporting area
(in Hectares)
13,341.00 13,341.00 -

140
The proposed land use plan of the block Baharia for year 2010 will have land use pattern as
follows:
Box - 6.4.5 Proposal of Land Use Plan for Baharia Block
Land Use
Categories Present Level in Percentage (Year 2000-01)
Proposed Level in Percentage (for Year 2010)
Remarks
Forest - 4.0 Around 4.0 per cent from culturable
waste land
Barren and
Unculturable land
0.79 0.23 Shift 0.56 per cent for land for non-
agricultural purposes
Land put to non-
agricultural uses
7.44 8.0 Around 0.56 per cent from barren and
unculturable land
Culturable waste 8.12 2.12 Around 4.0 per cent to forest and 2.0
per cent to grazing land
Pasture and
grazing land
0.51 2.51 2.0 per cent from culturable waste
land
Current Fallow
1.62 1.62 -
Other Fallow 2.39 1.39 1.0 per cent for orchard & groves
Land Under
Miscellaneous trees
and groves
1.28 2.28 1.0 per cent from other fallow
Net Sown Area
77.85 77.85 -
Total reporting area
(in Hectares)
24,654.00 24,654.00 -

141
The proposed land use plan of the Phulpur block for year 2010 will have land use pattern as
follows:
Box - 6.4.6 Proposal of Land Use Plan for Phulpur Block
Land Use
Categories Present Level in Percentage (Year 2000-01)
Proposed Level in Percentage (for Year 2010)
Remarks
Forest - 3.0 Around 3.0 per cent from culturable
waste
Barren and
Unculturable land
2.79 1.79 Shift 1.0 per cent for land for non-
agricultural purposes
Land put to non-
agricultural uses
11.28 12.28 Around 1.0 per cent from barren and
unculturable land
Culturable waste 5.37 0.37 Around 3.0 per cent to forest and
around 2.0 per cent for pasture
grazing land
Pasture and
grazing land
0.78 2.78 2.0 per cent from culturable waste
land
Current Fallow
0.85 0.85 -
Other Fallow 2.35 1.35 1.0 per cent for orchard & groves
Land Under
Miscellaneous trees
and groves
1.23 2.23 1.0 per cent from other fallow
Net Sown Area
75.35 75.35 -
Total reporting area
(in Hectares)
25,529.00 25,529.00 -
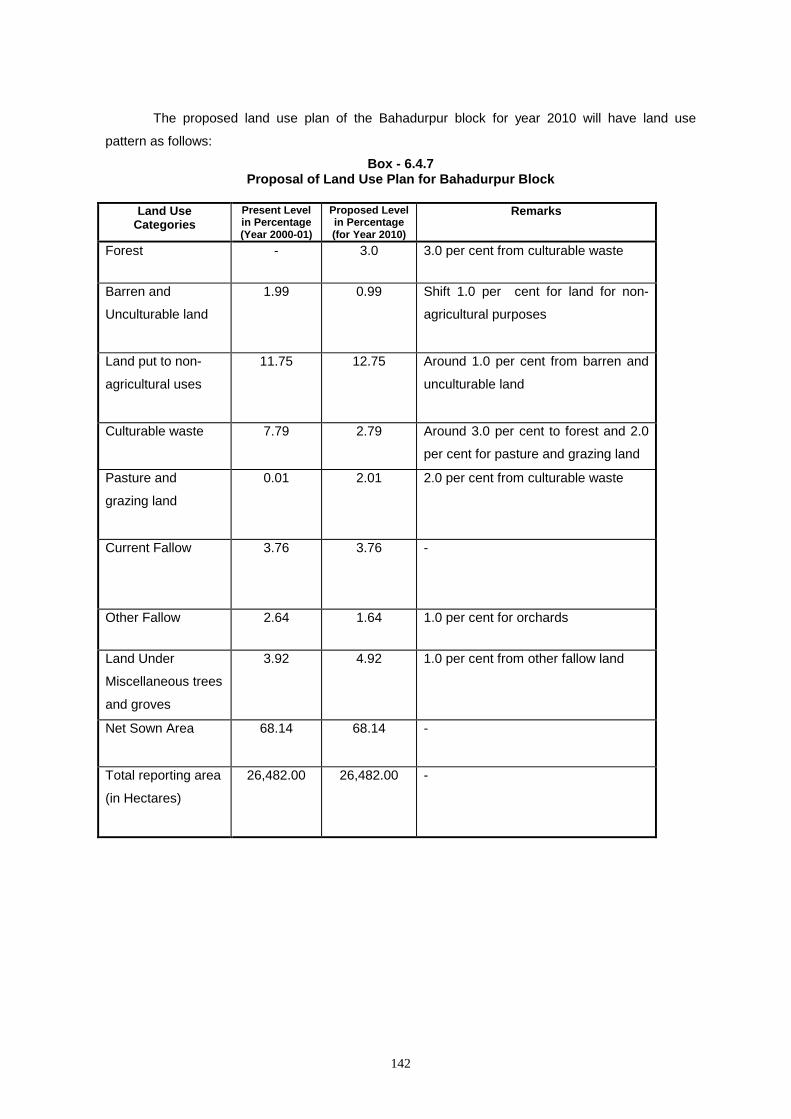
142
The proposed land use plan of the Bahadurpur block for year 2010 will have land use
pattern as follows:
Box - 6.4.7 Proposal of Land Use Plan for Bahadurpur Block
Land Use
Categories Present Level in Percentage (Year 2000-01)
Proposed Level in Percentage (for Year 2010)
Remarks
Forest - 3.0 3.0 per cent from culturable waste
Barren and
Unculturable land
1.99 0.99 Shift 1.0 per cent for land for non-
agricultural purposes
Land put to non-
agricultural uses
11.75 12.75 Around 1.0 per cent from barren and
unculturable land
Culturable waste 7.79 2.79 Around 3.0 per cent to forest and 2.0
per cent for pasture and grazing land
Pasture and
grazing land
0.01 2.01 2.0 per cent from culturable waste
Current Fallow
3.76 3.76 -
Other Fallow 2.64 1.64 1.0 per cent for orchards
Land Under
Miscellaneous trees
and groves
3.92 4.92 1.0 per cent from other fallow land
Net Sown Area
68.14 68.14 -
Total reporting area
(in Hectares)
26,482.00 26,482.00 -
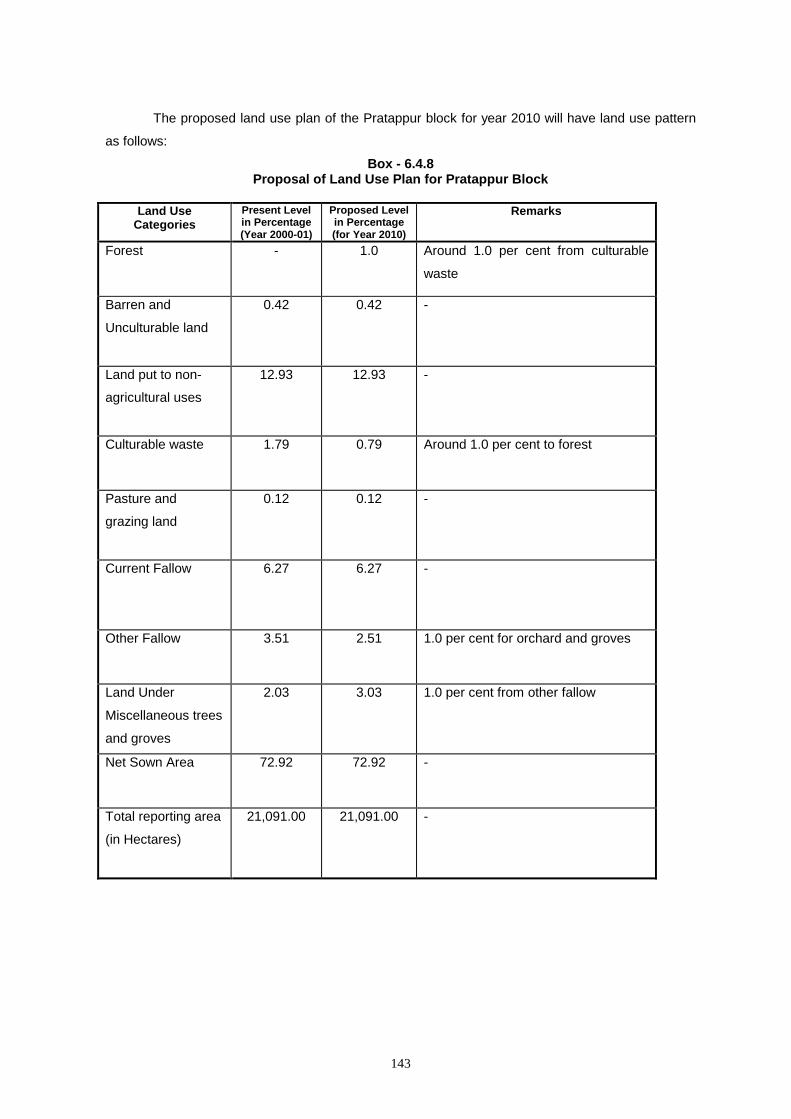
143
The proposed land use plan of the Pratappur block for year 2010 will have land use pattern
as follows:
Box - 6.4.8 Proposal of Land Use Plan for Pratappur Block
Land Use
Categories Present Level in Percentage (Year 2000-01)
Proposed Level in Percentage (for Year 2010)
Remarks
Forest - 1.0 Around 1.0 per cent from culturable
waste
Barren and
Unculturable land
0.42 0.42 -
Land put to non-
agricultural uses
12.93 12.93 -
Culturable waste 1.79 0.79 Around 1.0 per cent to forest
Pasture and
grazing land
0.12 0.12 -
Current Fallow
6.27 6.27 -
Other Fallow 3.51 2.51 1.0 per cent for orchard and groves
Land Under
Miscellaneous trees
and groves
2.03 3.03 1.0 per cent from other fallow
Net Sown Area
72.92 72.92 -
Total reporting area
(in Hectares)
21,091.00 21,091.00 -
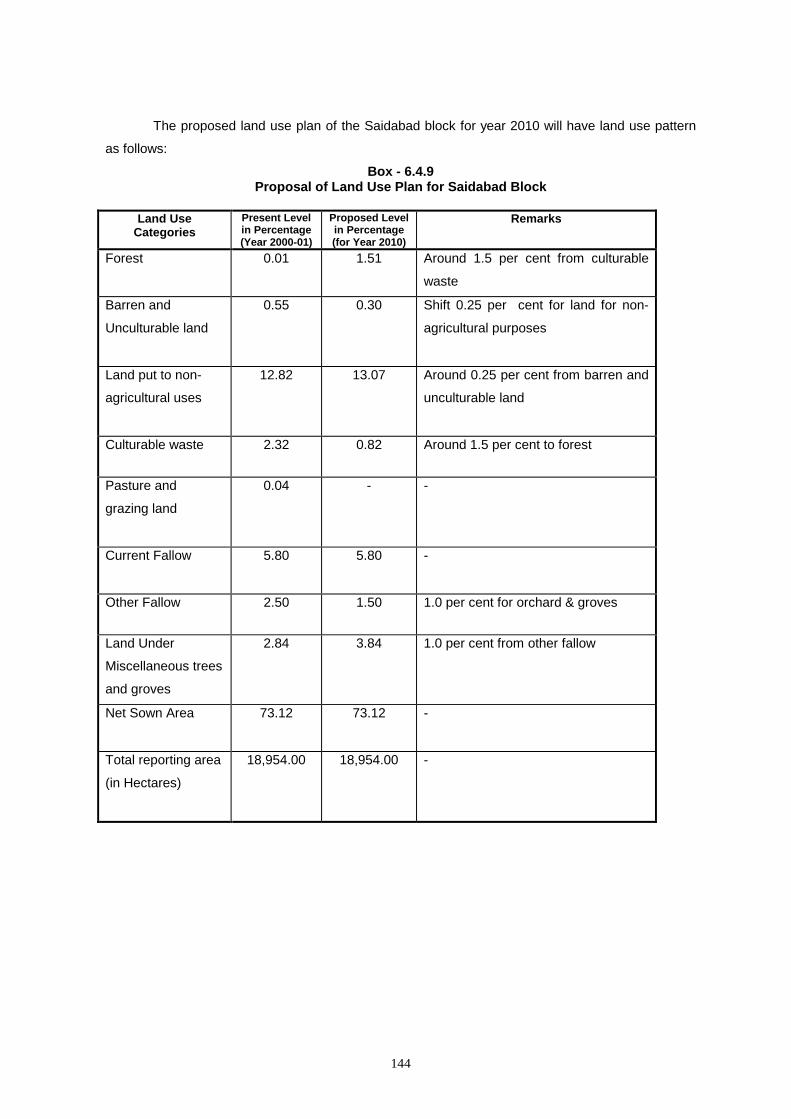
144
The proposed land use plan of the Saidabad block for year 2010 will have land use pattern
as follows:
Box - 6.4.9 Proposal of Land Use Plan for Saidabad Block
Land Use
Categories Present Level in Percentage (Year 2000-01)
Proposed Level in Percentage (for Year 2010)
Remarks
Forest 0.01 1.51 Around 1.5 per cent from culturable
waste
Barren and
Unculturable land
0.55 0.30 Shift 0.25 per cent for land for non-
agricultural purposes
Land put to non-
agricultural uses
12.82 13.07 Around 0.25 per cent from barren and
unculturable land
Culturable waste 2.32 0.82 Around 1.5 per cent to forest
Pasture and
grazing land
0.04 - -
Current Fallow
5.80 5.80 -
Other Fallow 2.50 1.50 1.0 per cent for orchard & groves
Land Under
Miscellaneous trees
and groves
2.84 3.84 1.0 per cent from other fallow
Net Sown Area
73.12 73.12 -
Total reporting area
(in Hectares)
18,954.00 18,954.00 -
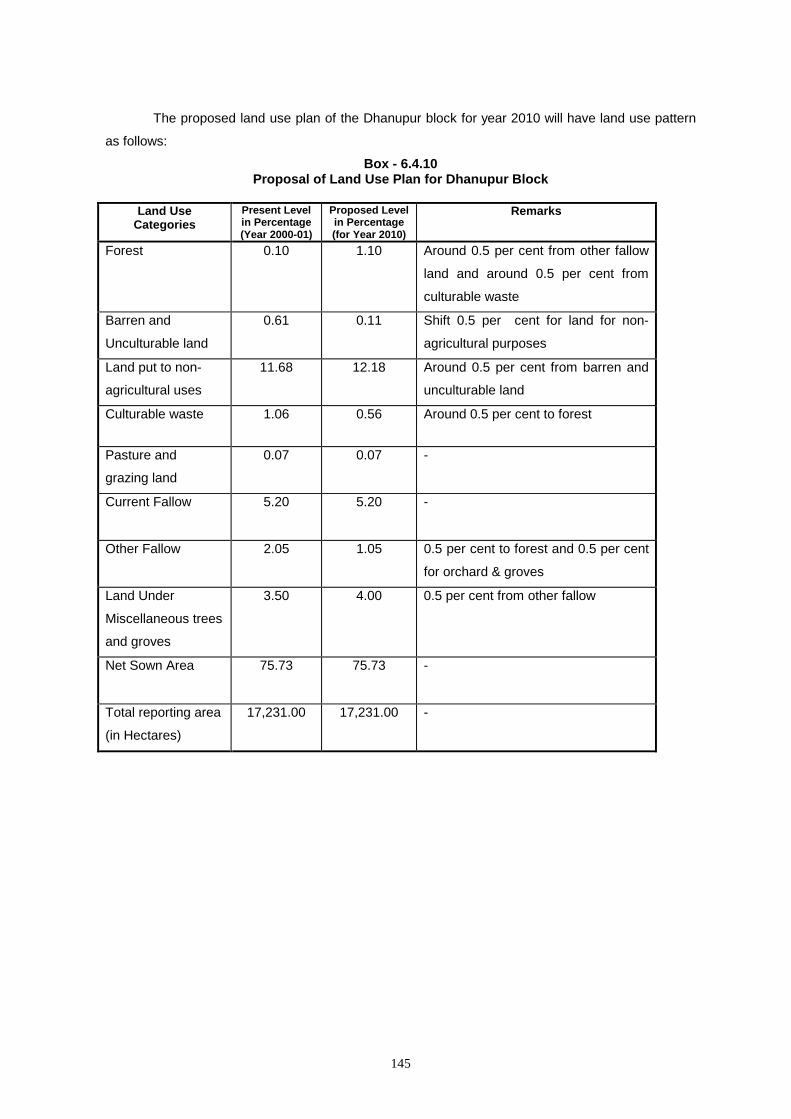
145
The proposed land use plan of the Dhanupur block for year 2010 will have land use pattern
as follows:
Box - 6.4.10 Proposal of Land Use Plan for Dhanupur Block
Land Use
Categories Present Level in Percentage (Year 2000-01)
Proposed Level in Percentage (for Year 2010)
Remarks
Forest 0.10 1.10 Around 0.5 per cent from other fallow
land and around 0.5 per cent from
culturable waste
Barren and
Unculturable land
0.61 0.11 Shift 0.5 per cent for land for non-
agricultural purposes
Land put to non-
agricultural uses
11.68 12.18 Around 0.5 per cent from barren and
unculturable land
Culturable waste 1.06 0.56 Around 0.5 per cent to forest
Pasture and
grazing land
0.07 0.07 -
Current Fallow
5.20 5.20 -
Other Fallow 2.05 1.05 0.5 per cent to forest and 0.5 per cent
for orchard & groves
Land Under
Miscellaneous trees
and groves
3.50 4.00 0.5 per cent from other fallow
Net Sown Area
75.73 75.73 -
Total reporting area
(in Hectares)
17,231.00 17,231.00 -
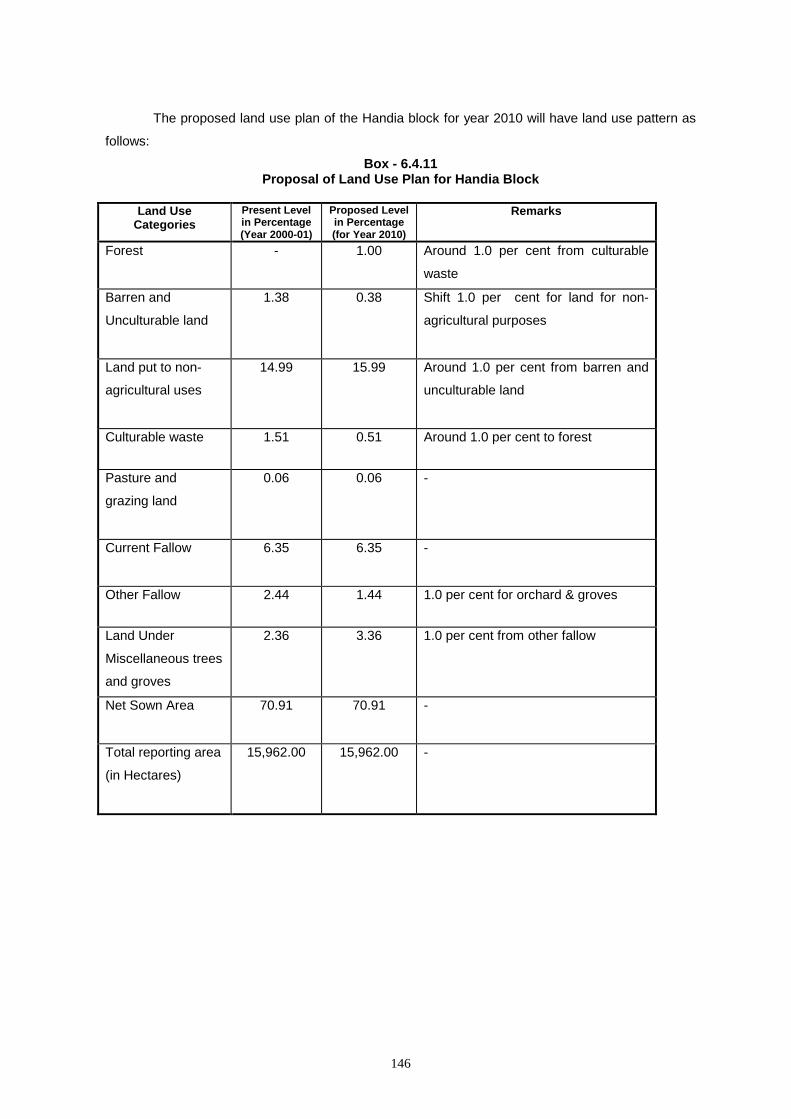
146
The proposed land use plan of the Handia block for year 2010 will have land use pattern as
follows:
Box - 6.4.11 Proposal of Land Use Plan for Handia Block
Land Use
Categories Present Level in Percentage (Year 2000-01)
Proposed Level in Percentage (for Year 2010)
Remarks
Forest - 1.00 Around 1.0 per cent from culturable
waste
Barren and
Unculturable land
1.38 0.38 Shift 1.0 per cent for land for non-
agricultural purposes
Land put to non-
agricultural uses
14.99 15.99 Around 1.0 per cent from barren and
unculturable land
Culturable waste 1.51 0.51 Around 1.0 per cent to forest
Pasture and
grazing land
0.06 0.06 -
Current Fallow
6.35 6.35 -
Other Fallow 2.44 1.44 1.0 per cent for orchard & groves
Land Under
Miscellaneous trees
and groves
2.36 3.36 1.0 per cent from other fallow
Net Sown Area
70.91 70.91 -
Total reporting area
(in Hectares)
15,962.00 15,962.00 -

147
The proposed land use plan of the Jasra block for year 2010 will have land use pattern as
follows:
Box - 6.4.12 Proposal of Land Use Plan for Jasra Block
Land Use
Categories Present Level in Percentage (Year 2000-01)
Proposed Level in Percentage (for Year 2010)
Remarks
Forest - 2.00 Around 2.0 per cent from culturable
waste
Barren and
Unculturable land
1.88 0.88 Shift 1.0 per cent such land for non-
agricultural purposes
Land put to non-
agricultural uses
11.96 12.96 Around 1.0 per cent from barren and
unculturable land
Culturable waste 4.49 1.49 Around 2.0 per cent to forest and
around 1.0 per cent for pasture
grazing land
Pasture and
grazing land
0.02 1.02 1.0 per cent from culturable waste
land
Current Fallow
9.21 9.21 -
Other Fallow 3.66 1.66 Around 2.0 per cent for orchards
Land Under
Miscellaneous trees
and groves
0.37 2.37 2.0 per cent from other fallow land
Net Sown Area
68.41 68.41 -
Total reporting area
(in Hectares)
26,965.00 26,965.00 -
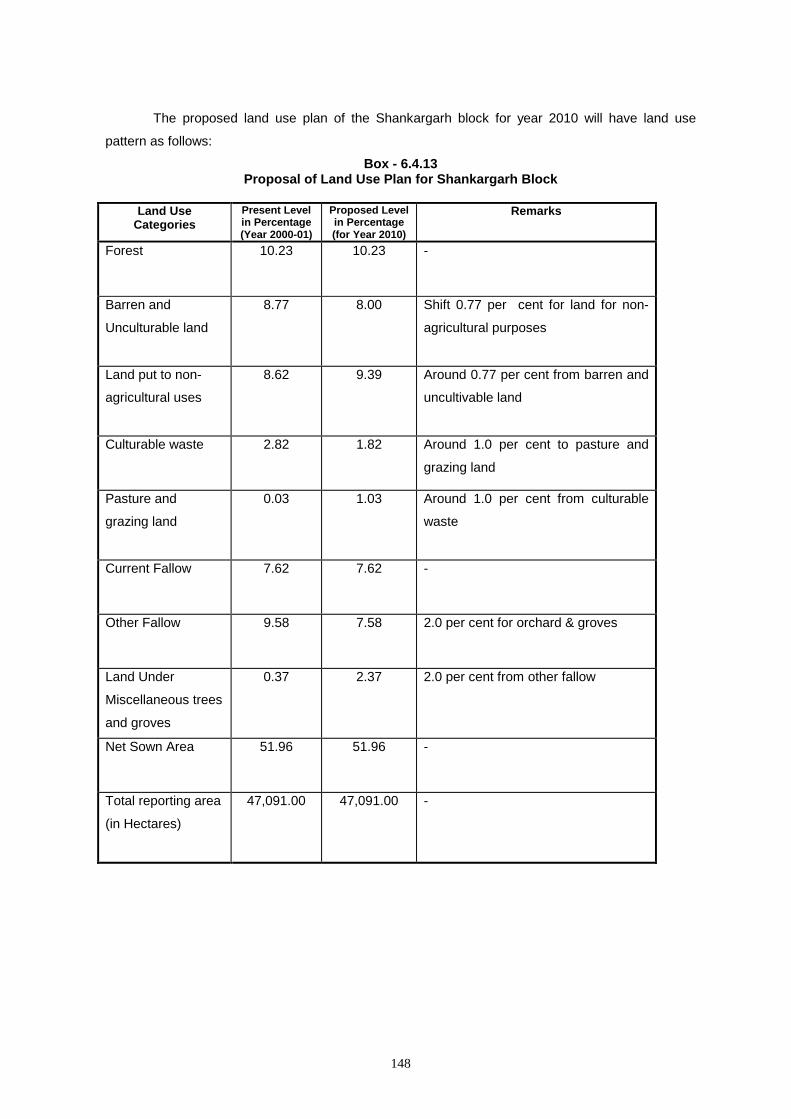
148
The proposed land use plan of the Shankargarh block for year 2010 will have land use
pattern as follows:
Box - 6.4.13 Proposal of Land Use Plan for Shankargarh Block
Land Use
Categories Present Level in Percentage (Year 2000-01)
Proposed Level in Percentage (for Year 2010)
Remarks
Forest 10.23 10.23 -
Barren and
Unculturable land
8.77 8.00 Shift 0.77 per cent for land for non-
agricultural purposes
Land put to non-
agricultural uses
8.62 9.39 Around 0.77 per cent from barren and
uncultivable land
Culturable waste 2.82 1.82 Around 1.0 per cent to pasture and
grazing land
Pasture and
grazing land
0.03 1.03 Around 1.0 per cent from culturable
waste
Current Fallow
7.62 7.62 -
Other Fallow 9.58 7.58 2.0 per cent for orchard & groves
Land Under
Miscellaneous trees
and groves
0.37 2.37 2.0 per cent from other fallow
Net Sown Area
51.96 51.96 -
Total reporting area
(in Hectares)
47,091.00 47,091.00 -
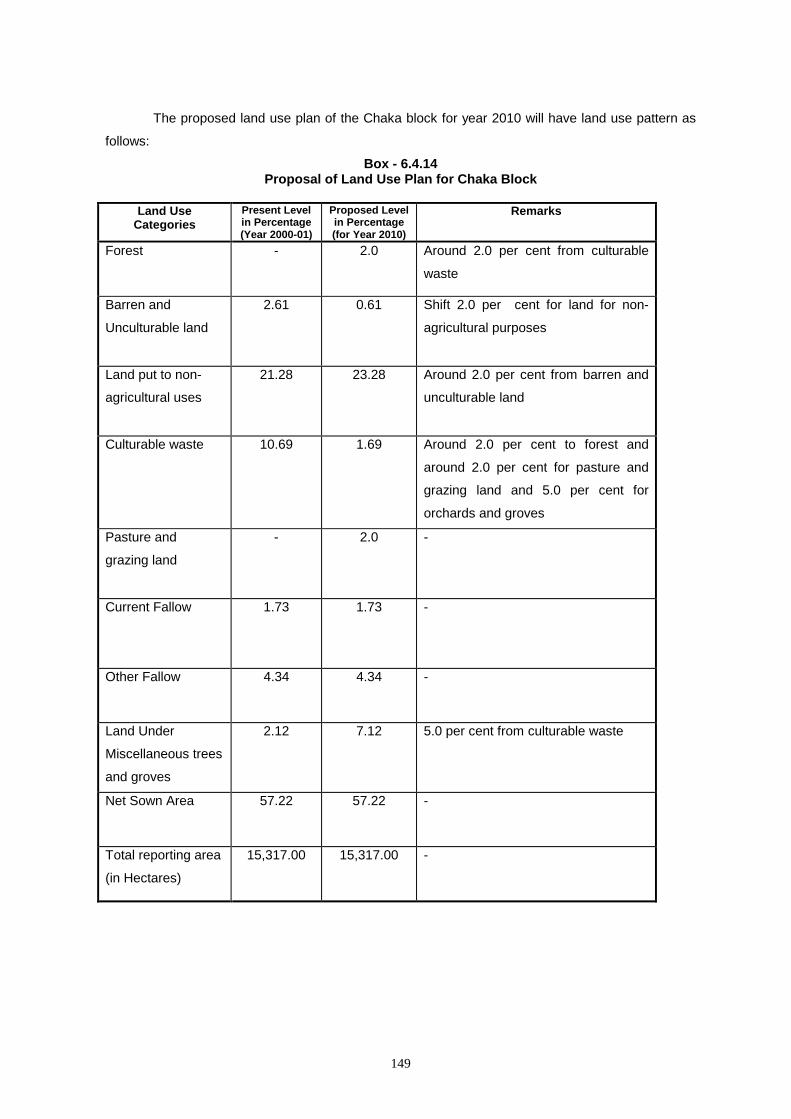
149
The proposed land use plan of the Chaka block for year 2010 will have land use pattern as
follows:
Box - 6.4.14 Proposal of Land Use Plan for Chaka Block
Land Use
Categories Present Level in Percentage (Year 2000-01)
Proposed Level in Percentage (for Year 2010)
Remarks
Forest - 2.0 Around 2.0 per cent from culturable
waste
Barren and
Unculturable land
2.61 0.61 Shift 2.0 per cent for land for non-
agricultural purposes
Land put to non-
agricultural uses
21.28 23.28 Around 2.0 per cent from barren and
unculturable land
Culturable waste 10.69 1.69 Around 2.0 per cent to forest and
around 2.0 per cent for pasture and
grazing land and 5.0 per cent for
orchards and groves
Pasture and
grazing land
- 2.0 -
Current Fallow
1.73 1.73 -
Other Fallow 4.34 4.34 -
Land Under
Miscellaneous trees
and groves
2.12 7.12 5.0 per cent from culturable waste
Net Sown Area
57.22 57.22 -
Total reporting area
(in Hectares)
15,317.00 15,317.00 -
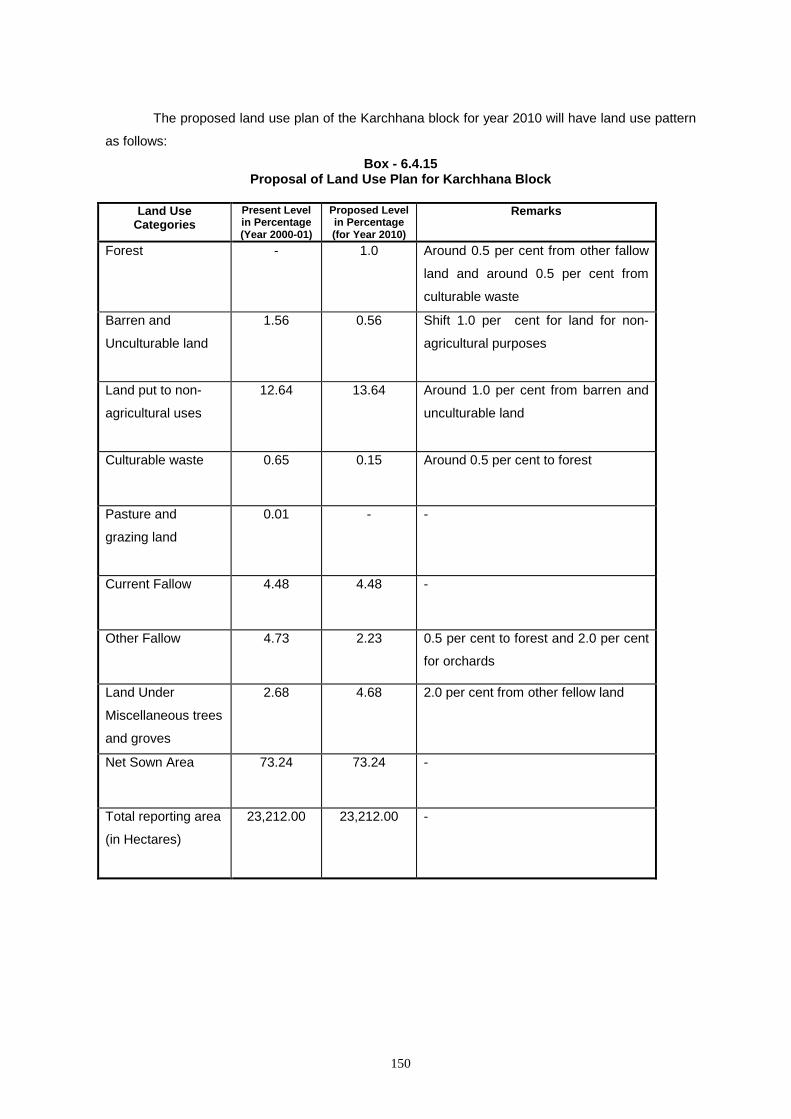
150
The proposed land use plan of the Karchhana block for year 2010 will have land use pattern
as follows:
Box - 6.4.15 Proposal of Land Use Plan for Karchhana Block
Land Use
Categories Present Level in Percentage (Year 2000-01)
Proposed Level in Percentage (for Year 2010)
Remarks
Forest - 1.0 Around 0.5 per cent from other fallow
land and around 0.5 per cent from
culturable waste
Barren and
Unculturable land
1.56 0.56 Shift 1.0 per cent for land for non-
agricultural purposes
Land put to non-
agricultural uses
12.64 13.64 Around 1.0 per cent from barren and
unculturable land
Culturable waste 0.65 0.15 Around 0.5 per cent to forest
Pasture and
grazing land
0.01 - -
Current Fallow
4.48 4.48 -
Other Fallow 4.73 2.23 0.5 per cent to forest and 2.0 per cent
for orchards
Land Under
Miscellaneous trees
and groves
2.68 4.68 2.0 per cent from other fellow land
Net Sown Area
73.24 73.24 -
Total reporting area
(in Hectares)
23,212.00 23,212.00 -

151
The proposed land use plan of the Kaundhiyara block for year 2010 will have land use
pattern as follows:
Box - 6.4.16 Proposal of Land Use Plan for Kaundhiyara Block
Land Use
Categories Present Level in Percentage (Year 2000-01)
Proposed Level in Percentage (for Year 2010)
Remarks
Forest - 0.5 Around 0.5 per cent from culturable
waste
Barren and
Unculturable land
1.63 0.63 Shift 1.0 per cent for land for non-
agricultural purposes
Land put to non-
agricultural uses
10.30 11.30 Around 1.0 per cent from barren and
unculturable land
Culturable waste 0.78 0.28 Around 0.5 per cent to forest
Pasture and
grazing land
0.31 0.31 -
Current Fallow
7.67 7.67 -
Other Fallow 3.09 1.09 2.0 per cent for orchard and groves
Land Under
Miscellaneous trees
and groves
1.29 3.29 2.0 per cent from other fallow
Net Sown Area
74.94 74.94 -
Total reporting area
(in Hectares)
19,794.00 19,794.00 -

152
The proposed land use plan of the Uroowa block for year 2010 will have land use pattern as
follows:
Box - 6.4.17 Proposal of Land Use Plan for Uroowa Block
Land Use
Categories Present Level in Percentage (Year 2000-01)
Proposed Level in Percentage (for Year 2010)
Remarks
Forest - 1.0 Around 1.0 per cent from culturable
waste
Barren and
Unculturable land
0.81 0.31 Shift 0.5 per cent for land for non-
agricultural purposes
Land put to non-
agricultural uses
18.19 18.69 Around 0.5 per cent from barren and
unculturable land
Culturable waste 1.80 0.80 Around 1.0 per cent to forest
Pasture and
grazing land
0.01 0.01 -
Current Fallow
2.20 2.20 -
Other Fallow 4.18 2.18 2.0 per cent for orchard & groves
Land Under
Miscellaneous trees
and groves
3.58 5.58 2.0 per cent from other fallow
Net Sown Area
69.23 69.23 -
Total reporting area
(in Hectares)
18,876.00 18,876.00 -

153
The proposed land use plan of the Meja block for year 2010 will have land use pattern as
follows:
Box - 6.4.18 Proposal of Land Use Plan for Meja Block
Land Use
Categories Present Level in Percentage (Year 2000-01)
Proposed Level in Percentage (for Year 2010)
Remarks
Forest 9.16 12.16 Around 3.0 per cent from culturable
waste
Barren and
Unculturable land
2.92 1.92 Shift 1.0 per cent for land for non-
agricultural purposes
Land put to non-
agricultural uses
10.13 11.13 Around 1.0 per cent from barren and
unculturable land
Culturable waste 5.78 0.78 Around 3.0 per cent to forest and 2.0
per cent for pastures & grazing land
Pasture and
grazing land
- 2.0 2.0 per cent from culturable waste
Current Fallow
2.53 2.53 -
Other Fallow 5.07 2.57 2.5 per cent for orchard & groves
Land Under
Miscellaneous trees
and groves
0.45 2.95 2.5 per cent from other fallow
Net Sown Area
63.96 63.96 -
Total reporting area
(in Hectares)
43,466.00 43,466.00 -
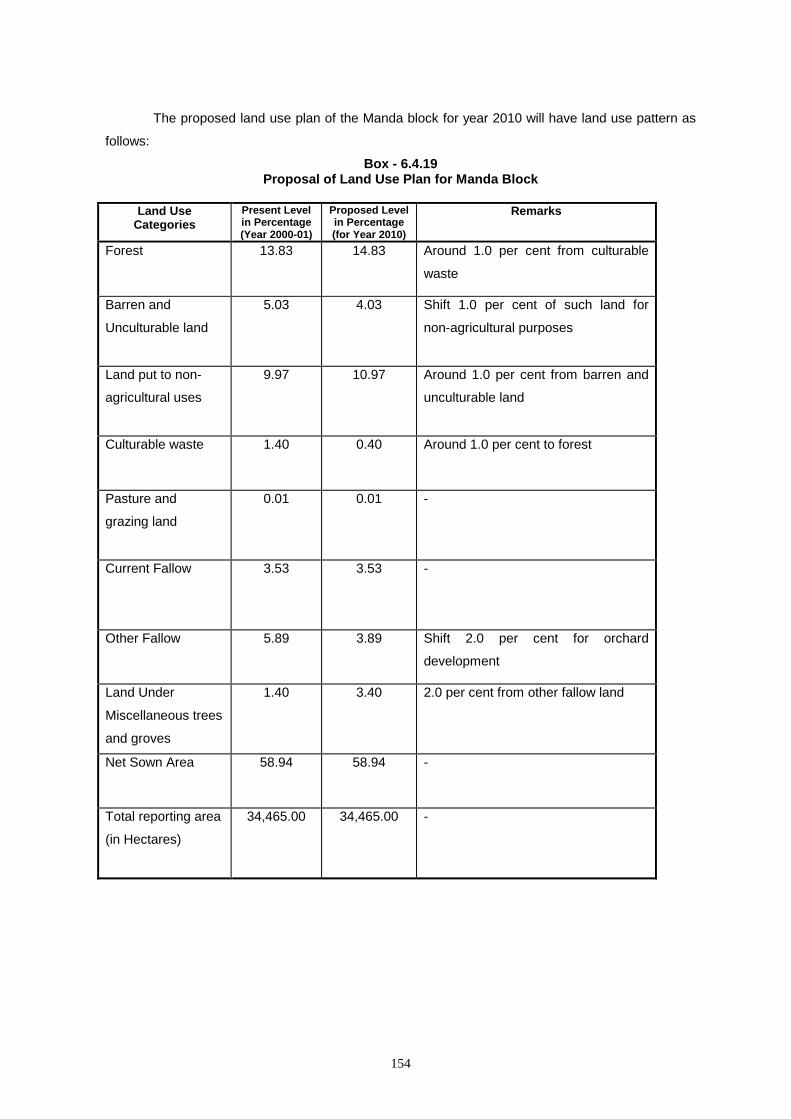
154
The proposed land use plan of the Manda block for year 2010 will have land use pattern as
follows:
Box - 6.4.19 Proposal of Land Use Plan for Manda Block
Land Use
Categories Present Level in Percentage (Year 2000-01)
Proposed Level in Percentage (for Year 2010)
Remarks
Forest 13.83 14.83 Around 1.0 per cent from culturable
waste
Barren and
Unculturable land
5.03 4.03 Shift 1.0 per cent of such land for
non-agricultural purposes
Land put to non-
agricultural uses
9.97 10.97 Around 1.0 per cent from barren and
unculturable land
Culturable waste 1.40 0.40 Around 1.0 per cent to forest
Pasture and
grazing land
0.01 0.01 -
Current Fallow
3.53 3.53 -
Other Fallow 5.89 3.89 Shift 2.0 per cent for orchard
development
Land Under
Miscellaneous trees
and groves
1.40 3.40 2.0 per cent from other fallow land
Net Sown Area
58.94 58.94 -
Total reporting area
(in Hectares)
34,465.00 34,465.00 -
155
6.5 Village Level Plans for Selected Villages 6.5.1 Land Use Plan for Golahiya Village Golhaiya village has a large forest cover, and secondly much of land is rocky and stone
covered (not fit for cultivation). And therefore, store breaking is the main occupation of most of the
workers. Land available for cultivation is small as compared to other villages. Poor villagers collect
fuel and fodder from the forest area, which is legally prohibited.
The majority of workers are stone breaker who belong to Kol community which is a non-
scheduled tribe in U.P. Kols have in-migrated to this village in 1982. They are landless and have not
been allotted land even under land distribution programme.
A nullah (drain passage) passes through the adjoining area of the village. During rainy
reason some water is conserved through a bundhi (water retention structure) which is built on the
nullah, which helps in cultivation of wheat in around 500 acres of land.
Most of the residents of village have built their houses on the hills and around half of
households have also constructed their houses on agricultural land as well.
About 20 per cent of soil is red matiyar (clay soil) and 80 per cent is red domat (loam).
Agriculture is totally dependent on monsoon.
The village land use plan for Golhaiya village will have to focus on four aspects of land use.
These are forest, stone-breaking, agriculture and water management.
Forest: Presently, forest area is under forest department, and local poor people use its
products for fuel or fodder. Our suggestion is that Golhaiya should be declared as forest village (or
Van-gram). Once this is done, it will not be treated as revenue village but as a resource village. The
resources will have to be preserved and their quality will have to be improved.
In order to preserve resources, all laws related to preservation of resources will have to be
laid down in an integral form at one place.
Secondly, its conversion for other purposes or its acquisition should be made severely
restrictive. It should not be through a notification by District Magistrate. Any conversion or
acquisition in such villages should be done only after cabinet approval and through a G.O.
Thirdly, those who have stake in preservation of resources, should have share in the
disposable produce of the resources. The stakeholders would include government, gram sabha,
workers and investors. A Joint Cooperative Forest Management Committee could be formed with
representatives of all the four to manage, invest and share the product benefits amongst them.
The forest could be divided into units and sectors. Whereas units could be leased-out to
individuals, sectors would be looked after collectivity by all unit holder members and investors
jointly. Management of all the sectors would be looked after by the Joint Cooperative Forest
Management Committee.
Stone Breaking: The stone breaking work is done by leasing-out such land to highest
bidders. We suggest that such lease should be given to Self Help Groups of mining workers on
priority basis.
156
It should also be made mandatory that renewal of lease would be done only if the land
which has been used for mining (and where no further mining is to be done) is developed as a pond
where rain water could be conserved and social forestry work is carried out on the embankment of
such ponds.
The mining work should also be allowed in such private land which are rocky and where
agriculture is not possible.
There is also need to check illegal mining. Illegal mining has been possible because many
areas described as barren and uncultivable land, culturable waste, pastures, ponds etc. in the
revenue record are being used for mining purpose.
Once the village is declared van-gram, a fresh land mapping will have to be carried out for
describing land-uses of each land plot in the village.
Agriculture: In Golhaiya, no programme of land reclamation had been launched, but there
had been individual efforts to convert some degraded land into cultivable land. Some farmers dug
their land 4 to 5 ft. deep and filled it with soil brought from outside. But after some time even this
land became usar again.
There is only one possibility. If a pond or tank could be constructed on the foots of hill then
land adjoining the hill would become cultivable.
There is another problem for labourers with small piece of land. They earn less from
cultivation than what they could earn by selling stone chips or silica on their fields.
Water Management: The land topography of the village is highly undulating, and water runs
off swifty. There is only one small dam on the drainage passage. Water so conserved is not
sufficient to cover a significant portion of cultivable land under irrigation. The water thus conserved
is also used for bathing and for cattle.
There were three ponds in the village. But water was found only in one pond, two other
ponds were dry. When hill rocks are broken and also due to rains, top soils flow to ponds, resulting
in siltation of these ponds. More water could be conserved in the village if ponds are desilted.
About twenty five years ago, irrigation department made an effort to get water through
boring. However, when they could not get water even after boring upto 350 ft., they left the effort,
and since then made no other effort in the village.
Even the number of livestock has decreased in the village. Because the number of persons
who could look after animals is declining. People are engaged in other work. There is good potential
to increase bovine cattle in the village. Because there is no problem of grazing in the village.
Most of the households in the village are related with the work of silica sand or stone
breaking.
When work is on in the factory, ash of silica sand covers the whole village. This leads to
pollution on the one hand on decline in productivity of land on the other.
6.5.2 Land Use Plan for Harro Village Kols (a non-scheduled tribe) and Patels (an OBC caste were the major caste groups in
village Harro. Whereas Kols were wage labourers (mostly worked in mines) Patels were, by and
large, cultivators.
157
The data on land use of selected households showed that landholdings have changed
mostly due to division of family. There had also been some conversion of agricultural land for non-
agricultural purposes. This was mainly for two reasons: (i) division of family and consequent need of
land for construction of houses and (ii) development of village.
Water logging was a major problem of the village. The issues of water logging and water
conservation are inter-linked. Following steps would help in proper water harvesting in the village.
(a) Domestic water disposal system be linked with the village drainage;
(b) A pullia (culvert) be constructed on the nullah (drainage);
(c) A new drainage passage be constructed;
(d) Renovate old ponds;
(e) Construct new ponds also;
(f) Remove encroachment of ponds.
As regards development or orchards, it was found that orchards were declining. This trend
could be arrested if farmers are given incentives to develop orchards in their old fallow land. The
incentives would include provision of HYV plants, techniques for their grooming, methods of
protection of trees etc.
Summer crops are not grown due to non-availability of water during that season. Villagers
send out their cattle to graze during this season. Hence even if some farmer plans to sow during
summer, he cannot do so, as it would not be possible to protect summer crops from animals.
If water retention structure could be built, and water is made available even after March,
then fodder could be grown, grazing land could be developed and even water for irrigation would be
available. This will help in growth of both agriculture and animal husbandry.
6.5.3 Land Use Plan for Fazilapur Village Waterlogging and seepage from ash ponds were the major problems of village Fazilapur.
Encroachment of ponds had added to the problem of water logging. Ponds could also become most
suitable way to conserve water in the village. Once water logging is managed and pollution from
plant and ash pond is controlled then orchards could also be developed in some land, which are
now fallow land.
(i) Seepage of ash pond could be checked only by erecting 15 ft. deep concrete walls on all
sides of ash ponds.
(ii) Soil testing of village farms be conducted regularly.
(iii) Illegal encroachment of ponds and tanks of village be removed and desiltation work be
undertaken.
(iv) Drinking water should be put to test every month. IFFCO should take responsibility/or pay
for water testing. "Polluter must pay".
(v) The nullah should be cleansed every year.
(vi) Health check-up camps be organised for those who are affected due to fly ash or pollution
of drinking water.
6.5.4 Land Use Plan for Rajepur Village
158
Village Rejepur has sizable proportion of culturable waste land, fallow land and area under
waterlogging.
Culturable waste has consistently increased in the village – from 6.2 per cent of total
reporting area in 1970-71 to 11.4 per cent in 1990-91 and 14.07 per cent during the period of
survey. The fallow land has increased from 9.2 per cent in 1990-91 to 12.0 per cent at present.
Besides these, usar (uncultivable) and sandy land consists of 7.0 per cent of total reporting area.
According to farmers, in around 15.0 per cent of land (adjoining usar land) the productivity was very
low.
The revenue record shows that habitation was on 4.0 per cent of total reporting area while
actually it was on around 6.0 per cent of village area. Similarly area under water bodies was shown
as 3 per cent in revenue records, while actually it was only in 1.0 per cent. The rest of land shown
under water bodies had been encroached upon by the powerful people of the village, and even
houses had been constructed on such land. Besides these, around 4.0 per cent land remains
waterlogged from July to March/April due to overflowing of river/nullah or canal. Continuous
waterlogging has also led to rise in the water table of ground water. Orchards have almost been
destroyed due to waterlogging.
(i) In order to overcome water logging, digging and desiltation work of river/nullah and canal
should be taken up with right earnest. There is also need to construct a new nullah on the
eastern side of the village.
(ii) Land reclamation programme be launched again after proper awareness programme.
(iii) Illegal encroachment of ponds be removed.
Besides above suggestions following steps could be taken to regulate land use in all the
village:
(i) Land Management Committee be reconstituted with representations of all sections and
entrusted with specific responsibilities related to land use in the village.
(ii) After consolidation, conversion of agricultural land for non-agricultural purposes be
prohibited. Those who have violated this norm should be penalized. A fine based on current
value of land and house be imposed.
(iii) Building tax should be collected every year from those farmers who have constructed any
house/building on farm land.
(iv) Stringent action should be taken against those who have encroached upon pond of the
village. They should be debarred from getting benefit of any government scheme and also
debarred from contesting any elections.
(v) Desiltation of drainage course should be done regularly.
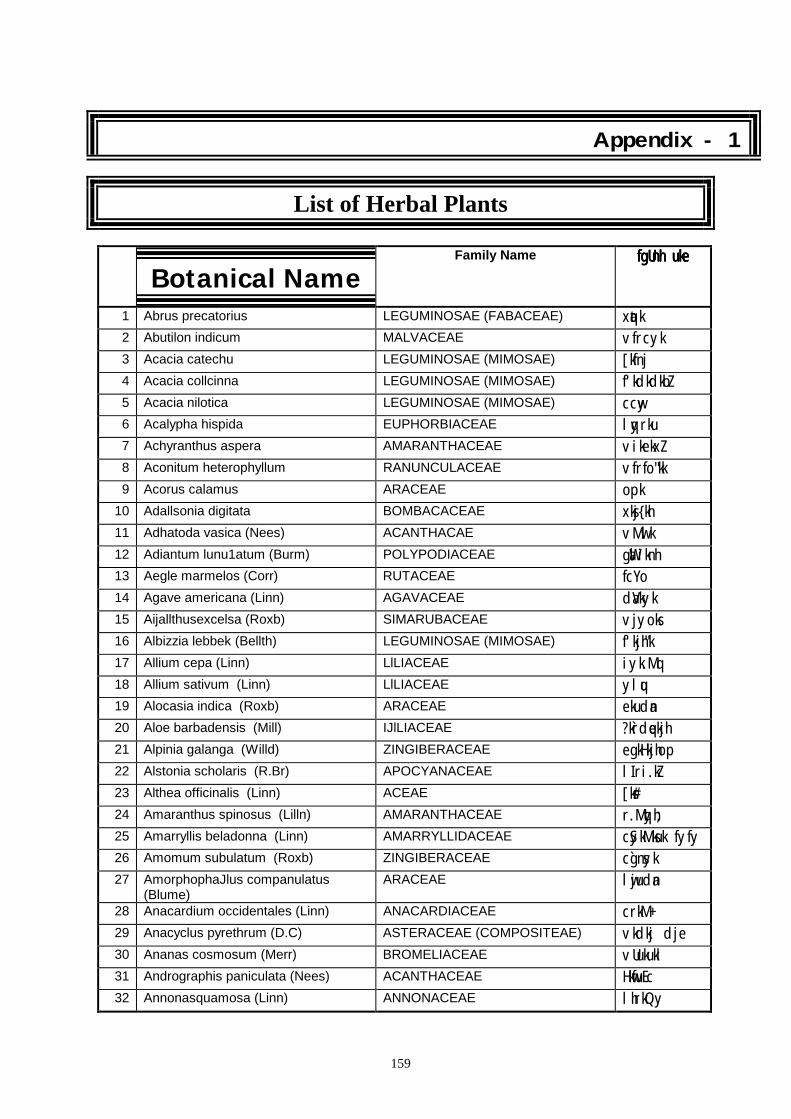
159
Appendix - 1
List of Herbal Plants
Botanical NameFamily Name fgUnh ukefgUnh ukefgUnh ukefgUnh uke
1 Abrus precatorius LEGUMINOSAE (FABACEAE) xqatk 2 Abutilon indicum MALVACEAE vfrcyk 3 Acacia catechu LEGUMINOSAE (MIMOSAE) [kfnj 4 Acacia collcinna LEGUMINOSAE (MIMOSAE) f'kdkdkbZ 5 Acacia nilotica LEGUMINOSAE (MIMOSAE) ccwy 6 Acalypha hispida EUPHORBIACEAE lqyrku 7 Achyranthus aspera AMARANTHACEAE vikekxZ 8 Aconitum heterophyllum RANUNCULACEAE vfrfo"kk 9 Acorus calamus ARACEAE opk
10 Adallsonia digitata BOMBACACEAE xksj{kh 11 Adhatoda vasica (Nees) ACANTHACAE vMwlk 12 Adiantum lunu1atum (Burm) POLYPODIACEAE gaWliknh 13 Aegle marmelos (Corr) RUTACEAE fcYo 14 Agave americana (Linn) AGAVACEAE daVkyk 15 Aijallthusexcelsa (Roxb) SIMARUBACEAE vjyoks 16 Albizzia lebbek (Bellth) LEGUMINOSAE (MIMOSAE) f'kjh"k 17 Allium cepa (Linn) LlLIACEAE iyk.Mq 18 Allium sativum (Linn) LlLIACEAE ylqu 19 Alocasia indica (Roxb) ARACEAE ekudan 20 Aloe barbadensis (Mill) IJlLIACEAE ?kr̀dqekjh 21 Alpinia galanga (Willd) ZINGIBERACEAE egkHkjhop 22 Alstonia scholaris (R.Br) APOCYANACEAE lIri.kZ 23 Althea officinalis (Linn) ACEAE [ks# 24 Amaranthus spinosus (Lilln) AMARANTHACEAE r.Mqyh; 25 Amarryllis beladonna (Linn) AMARRYLLIDACEAE cSykMksuk fyfy 26 Amomum subulatum (Roxb) ZINGIBERACEAE c`gnsyk 27 AmorphophaJlus companulatus
(Blume) ARACEAE lwjudan
28 Anacardium occidentales (Linn) ANACARDIACEAE crkM+ 29 Anacyclus pyrethrum (D.C) ASTERACEAE (COMPOSITEAE) vkdkj dje 30 Ananas cosmosum (Merr) BROMELIACEAE vUukukl 31 Andrographis paniculata (Nees) ACANTHACEAE HkwfuEc 32 Annonasquamosa (Linn) ANNONACEAE lhrkQy
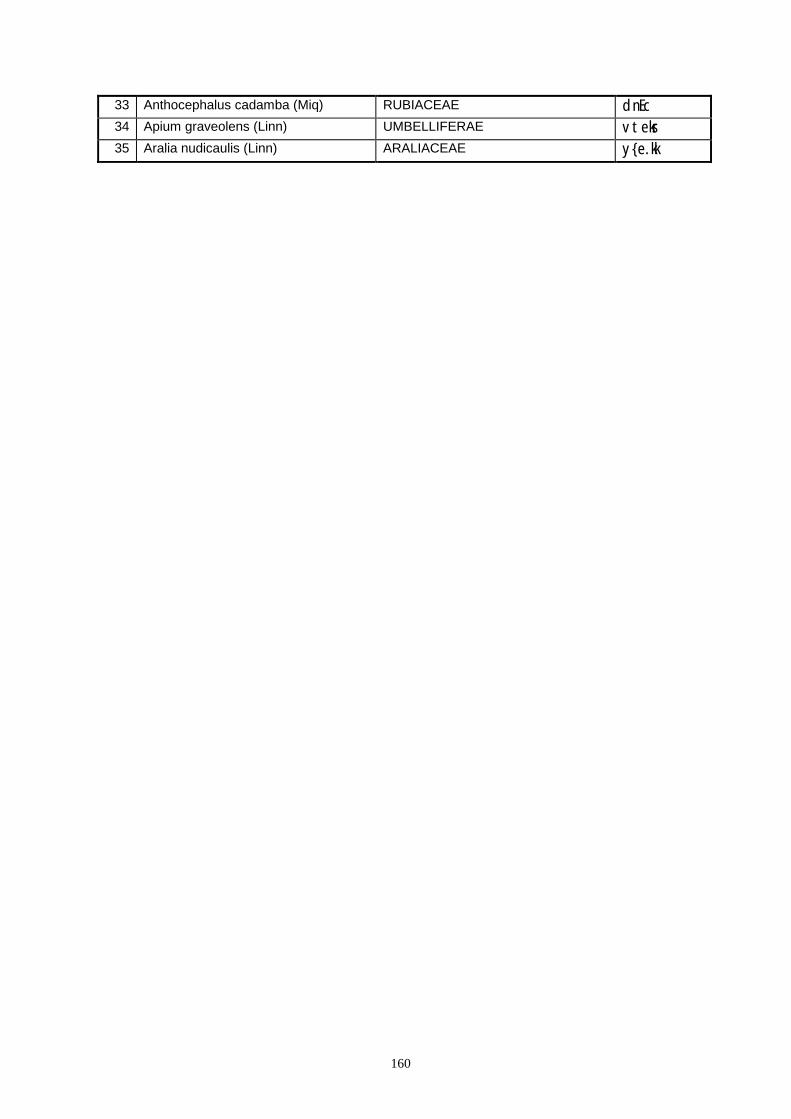
160
33 Anthocephalus cadamba (Miq) RUBIACEAE dnEc 34 Apium graveolens (Linn) UMBELLIFERAE vteksr 35 Aralia nudicaulis (Linn) ARALIACEAE y{e.kk
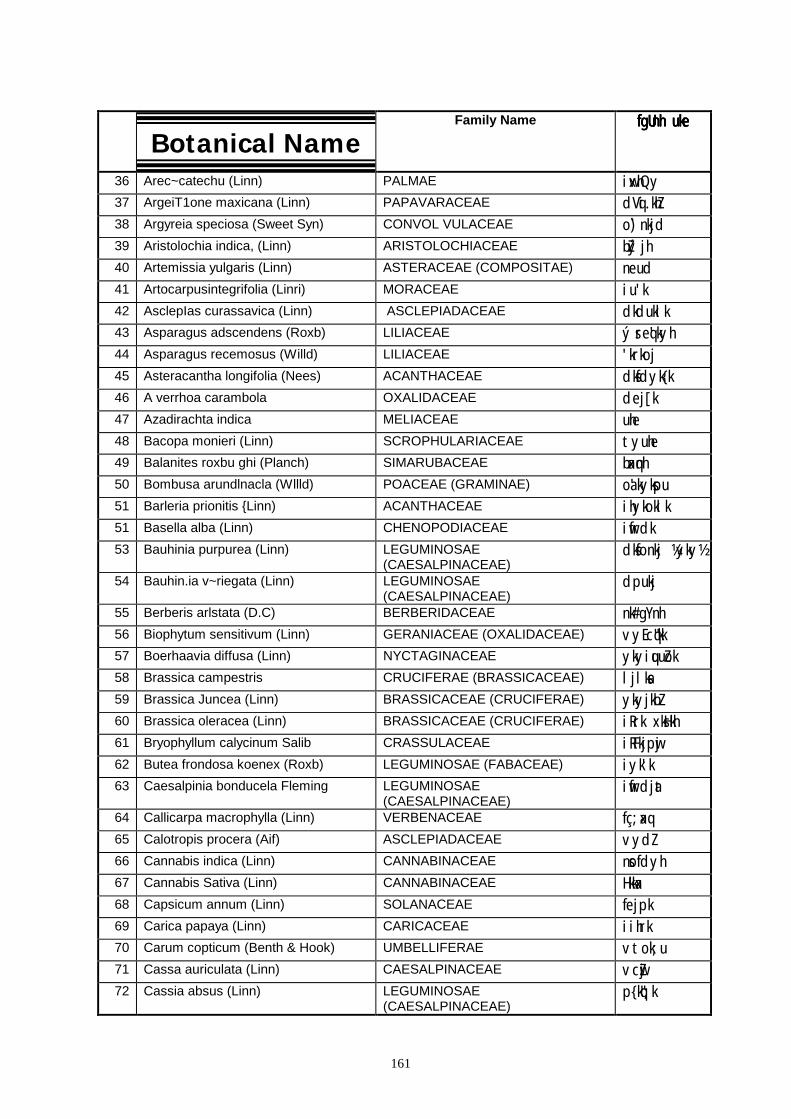
161
Botanical NameFamily Name fgUnh ukefgUnh ukefgUnh ukefgUnh uke
36 Arec~catechu (Linn) PALMAE iwxhQy 37 ArgeiT1one maxicana (Linn) PAPAVARACEAE dVqi.khZ 38 Argyreia speciosa (Sweet Syn) CONVOL VULACEAE o`)nkjd 39 Aristolochia indica, (Linn) ARISTOLOCHIACEAE bZýjh 40 Artemissia yulgaris (Linn) ASTERACEAE (COMPOSITAE) neud 41 Artocarpusintegrifolia (Linri) MORACEAE iu'k 42 AsclepIas curassavica (Linn) ASCLEPIADACEAE dkduklk 43 Asparagus adscendens (Roxb) LILIACEAE ýsreq'kyh 44 Asparagus recemosus (Willd) LILIACEAE 'krkoj 45 Asteracantha longifolia (Nees) ACANTHACEAE dksfdyk{k 46 A verrhoa carambola OXALIDACEAE dej[k 47 Azadirachta indica MELIACEAE uhe 48 Bacopa monieri (Linn) SCROPHULARIACEAE tyuhe 49 Balanites roxbu ghi (Planch) SIMARUBACEAE baxqnh 50 Bombusa arundlnacla (Wllld) POACEAE (GRAMINAE) oa'kykspu 51 Barleria prionitis {Linn) ACANTHACEAE ihykoklk 51 Basella alba (Linn) CHENOPODIACEAE iwfrdk 53 Bauhinia purpurea (Linn) LEGUMINOSAE
(CAESALPINACEAE) dksfonkj ¼yky½
54 Bauhin.ia v~riegata (Linn) LEGUMINOSAE (CAESALPINACEAE)
dpukj
55 Berberis arlstata (D.C) BERBERIDACEAE nk#gYnh 56 Biophytum sensitivum (Linn) GERANIACEAE (OXALIDACEAE) vyEcq"kk 57 Boerhaavia diffusa (Linn) NYCTAGINACEAE ykyiquuZok 58 Brassica campestris CRUCIFERAE (BRASSICACEAE) ljlksa 59 Brassica Juncea (Linn) BRASSICACEAE (CRUCIFERAE) ykyjkbZ 60 Brassica oleracea (Linn) BRASSICACEAE (CRUCIFERAE) iRrk xksHkh 61 Bryophyllum calycinum Salib CRASSULACEAE iRFkjpwj 62 Butea frondosa koenex (Roxb) LEGUMINOSAE (FABACEAE) iyk'k 63 Caesalpinia bonducela Fleming LEGUMINOSAE
(CAESALPINACEAE) iwfrdjat
64 Callicarpa macrophylla (Linn) VERBENACEAE fç;axq 65 Calotropis procera (Aif) ASCLEPIADACEAE vydZ 66 Cannabis indica (Linn) CANNABINACEAE nsofdyh 67 Cannabis Sativa (Linn) CANNABINACEAE Hkkax 68 Capsicum annum (Linn) SOLANACEAE fejpk 69 Carica papaya (Linn) CARICACEAE iihrk 70 Carum copticum (Benth & Hook) UMBELLIFERAE vtok;u 71 Cassa auriculata (Linn) CAESALPINACEAE vcZwj 72 Cassia absus (Linn) LEGUMINOSAE
(CAESALPINACEAE) p{kq";k
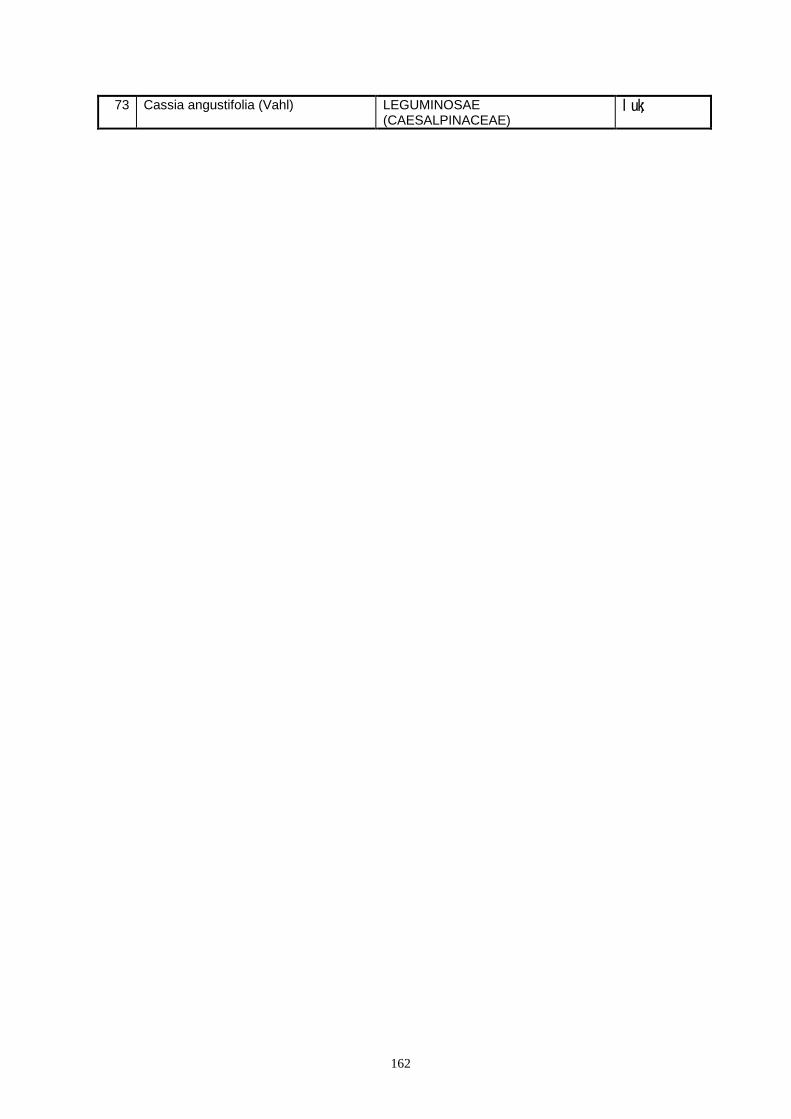
162
73 Cassia angustifolia (Vahl) LEGUMINOSAE (CAESALPINACEAE)
luk;
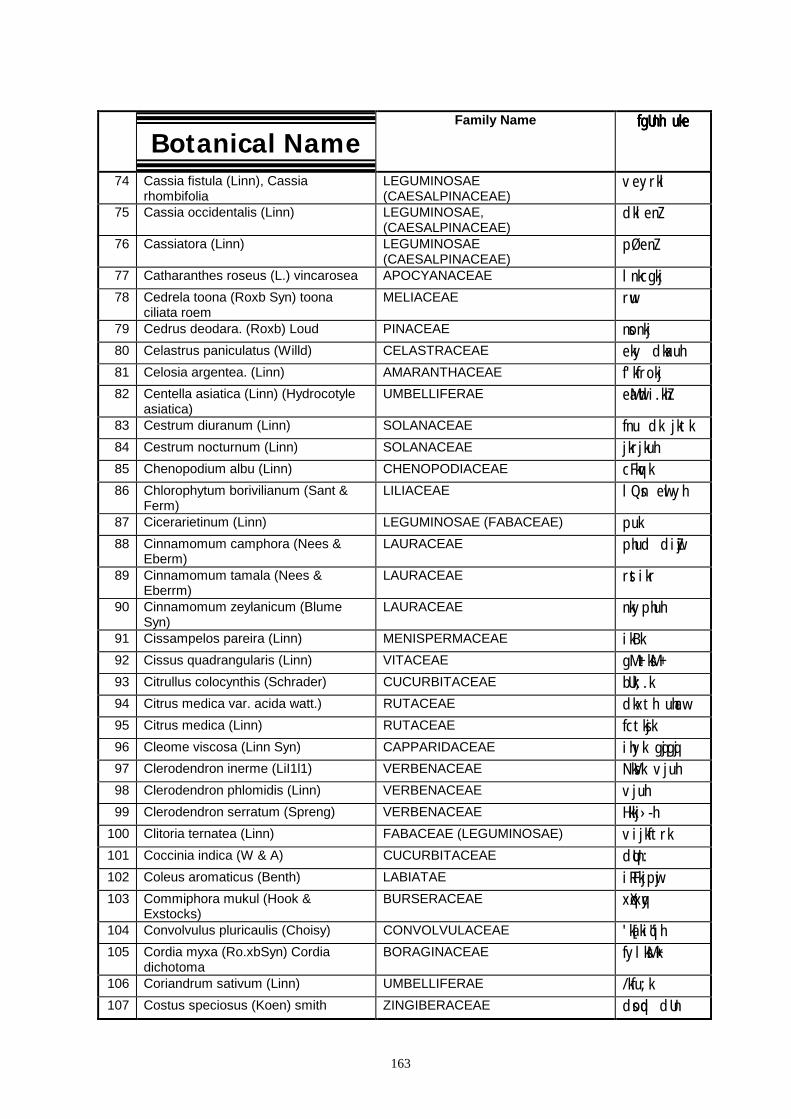
163
Botanical NameFamily Name fgUnh ukefgUnh ukefgUnh ukefgUnh uke
74 Cassia fistula (Linn), Cassia rhombifolia
LEGUMINOSAE (CAESALPINACEAE)
veyrkl
75 Cassia occidentalis (Linn) LEGUMINOSAE, (CAESALPINACEAE)
dklenZ
76 Cassiatora (Linn) LEGUMINOSAE (CAESALPINACEAE)
pØenZ
77 Catharanthes roseus (L.) vincarosea APOCYANACEAE lnkcgkj 78 Cedrela toona (Roxb Syn) toona
ciliata roem MELIACEAE rwu
79 Cedrus deodara. (Roxb) Loud PINACEAE nsonkj 80 Celastrus paniculatus (Willd) CELASTRACEAE eky dkaxuh 81 Celosia argentea. (Linn) AMARANTHACEAE f'kfrokj 82 Centella asiatica (Linn) (Hydrocotyle
asiatica) UMBELLIFERAE eaMwdi.khZ
83 Cestrum diuranum (Linn) SOLANACEAE fnu dk jktk 84 Cestrum nocturnum (Linn) SOLANACEAE jkrjkuh 85 Chenopodium albu (Linn) CHENOPODIACEAE cFkqvk 86 Chlorophytum borivilianum (Sant &
Ferm) LILIACEAE lQsn ewlyh
87 Cicerarietinum (Linn) LEGUMINOSAE (FABACEAE) puk 88 Cinnamomum camphora (Nees &
Eberm) LAURACEAE phud diZwj
89 Cinnamomum tamala (Nees & Eberrm)
LAURACEAE rstikr
90 Cinnamomum zeylanicum (Blume Syn)
LAURACEAE nkyphuh
91 Cissampelos pareira (Linn) MENISPERMACEAE ikBk 92 Cissus quadrangularis (Linn) VITACEAE gM+tksM+ 93 Citrullus colocynthis (Schrader) CUCURBITACEAE bUk;.k 94 Citrus medica var. acida watt.) RUTACEAE dkxth uhacw 95 Citrus medica (Linn) RUTACEAE fctksjk 96 Cleome viscosa (Linn Syn) CAPPARIDACEAE ihyk gqjgqj 97 Clerodendron inerme (LiI1l1) VERBENACEAE NksVk vjuh 98 Clerodendron phlomidis (Linn) VERBENACEAE vjuh 99 Clerodendron serratum (Spreng) VERBENACEAE Hkkj›-h
100 Clitoria ternatea (Linn) FABACEAE (LEGUMINOSAE) vijkftrk 101 Coccinia indica (W & A) CUCURBITACEAE dqUn: 102 Coleus aromaticus (Benth) LABIATAE iRFkjpwj 103 Commiphora mukul (Hook &
Exstocks) BURSERACEAE xqXxqy
104 Convolvulus pluricaulis (Choisy) CONVOLVULACEAE 'ka[kiq"ih 105 Cordia myxa (Ro.xbSyn) Cordia
dichotoma BORAGINACEAE fylksM+k
106 Coriandrum sativum (Linn) UMBELLIFERAE /kfu;k 107 Costus speciosus (Koen) smith ZINGIBERACEAE dsoqd dUn

164
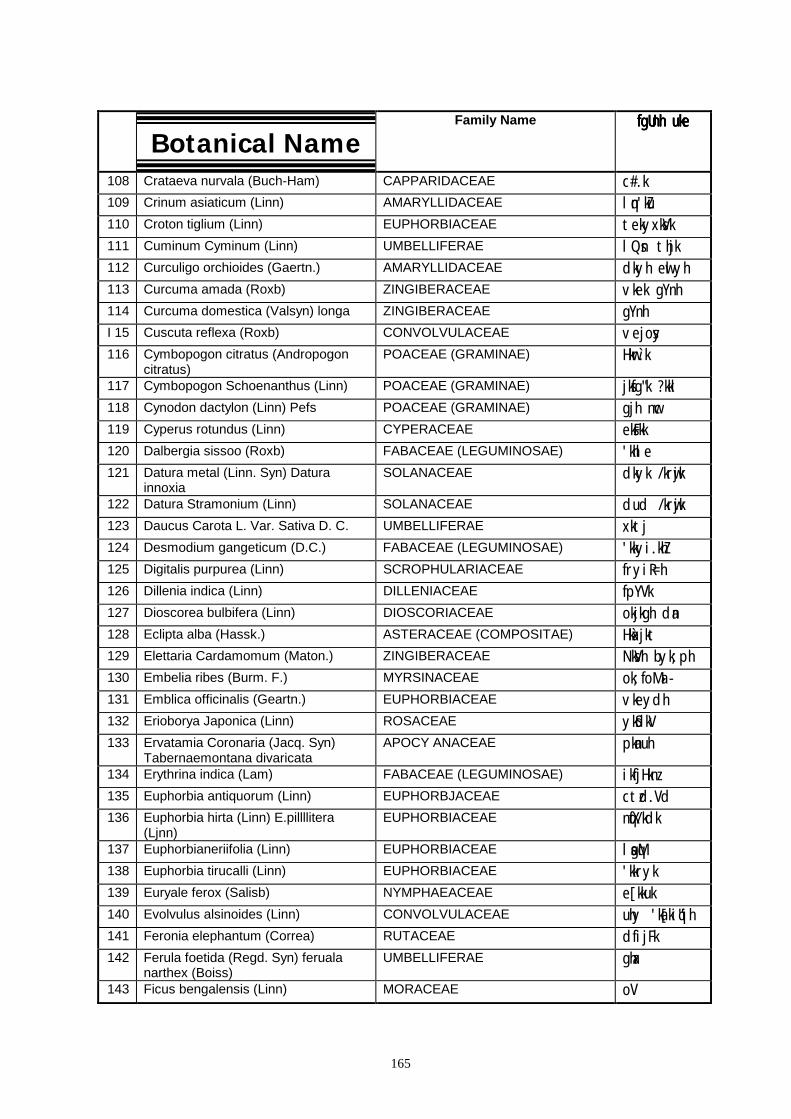
165
Botanical NameFamily Name fgUnh ukefgUnh ukefgUnh ukefgUnh uke
108 Crataeva nurvala (Buch-Ham) CAPPARIDACEAE c#.k 109 Crinum asiaticum (Linn) AMARYLLIDACEAE lqn'kZu 110 Croton tiglium (Linn) EUPHORBIACEAE tekyxksVk 111 Cuminum Cyminum (Linn) UMBELLIFERAE lQsn thjk 112 Curculigo orchioides (Gaertn.) AMARYLLIDACEAE dkyh ewlyh 113 Curcuma amada (Roxb) ZINGIBERACEAE vkek gYnh 114 Curcuma domestica (Valsyn) longa ZINGIBERACEAE gYnh I 15 Cuscuta reflexa (Roxb) CONVOLVULACEAE vejosy 116 Cymbopogon citratus (Andropogon
citratus) POACEAE (GRAMINAE) Hkwr`.k
117 Cymbopogon Schoenanthus (Linn) POACEAE (GRAMINAE) jksfg"k ?kkl 118 Cynodon dactylon (Linn) Pefs POACEAE (GRAMINAE) gjh nwc 119 Cyperus rotundus (Linn) CYPERACEAE eksFkk 120 Dalbergia sissoo (Roxb) FABACEAE (LEGUMINOSAE) 'khle 121 Datura metal (Linn. Syn) Datura
innoxia SOLANACEAE dkyk /krwjk
122 Datura Stramonium (Linn) SOLANACEAE dud /krwjk 123 Daucus Carota L. Var. Sativa D. C. UMBELLIFERAE xktj 124 Desmodium gangeticum (D.C.) FABACEAE (LEGUMINOSAE) 'kkyi.khZ 125 Digitalis purpurea (Linn) SCROPHULARIACEAE fryiR=h 126 Dillenia indica (Linn) DILLENIACEAE fpYVk 127 Dioscorea bulbifera (Linn) DIOSCORIACEAE okjkgh dan 128 Eclipta alba (Hassk.) ASTERACEAE (COMPOSITAE) Hka`xjkt 129 Elettaria Cardamomum (Maton.) ZINGIBERACEAE NksVh byk;ph 130 Embelia ribes (Burm. F.) MYRSINACEAE ok;foMa›- 131 Emblica officinalis (Geartn.) EUPHORBIACEAE vkeydh 132 Erioborya Japonica (Linn) ROSACEAE ykSdkV 133 Ervatamia Coronaria (Jacq. Syn)
Tabernaemontana divaricata APOCY ANACEAE pkanuh
134 Erythrina indica (Lam) FABACEAE (LEGUMINOSAE) ikfjHknz 135 Euphorbia antiquorum (Linn) EUPHORBJACEAE ctzd.Vd 136 Euphorbia hirta (Linn) E.pillllitera
(Ljnn) EUPHORBIACEAE nqfX/kdk
137 Euphorbianeriifolia (Linn) EUPHORBIACEAE lsagqM 138 Euphorbia tirucalli (Linn) EUPHORBIACEAE 'kkryk 139 Euryale ferox (Salisb) NYMPHAEACEAE e[kkuk 140 Evolvulus alsinoides (Linn) CONVOLVULACEAE uhy 'ka[kiq"ih 141 Feronia elephantum (Correa) RUTACEAE dfijFk 142 Ferula foetida (Regd. Syn) feruala
narthex (Boiss) UMBELLIFERAE ghax
143 Ficus bengalensis (Linn) MORACEAE oV
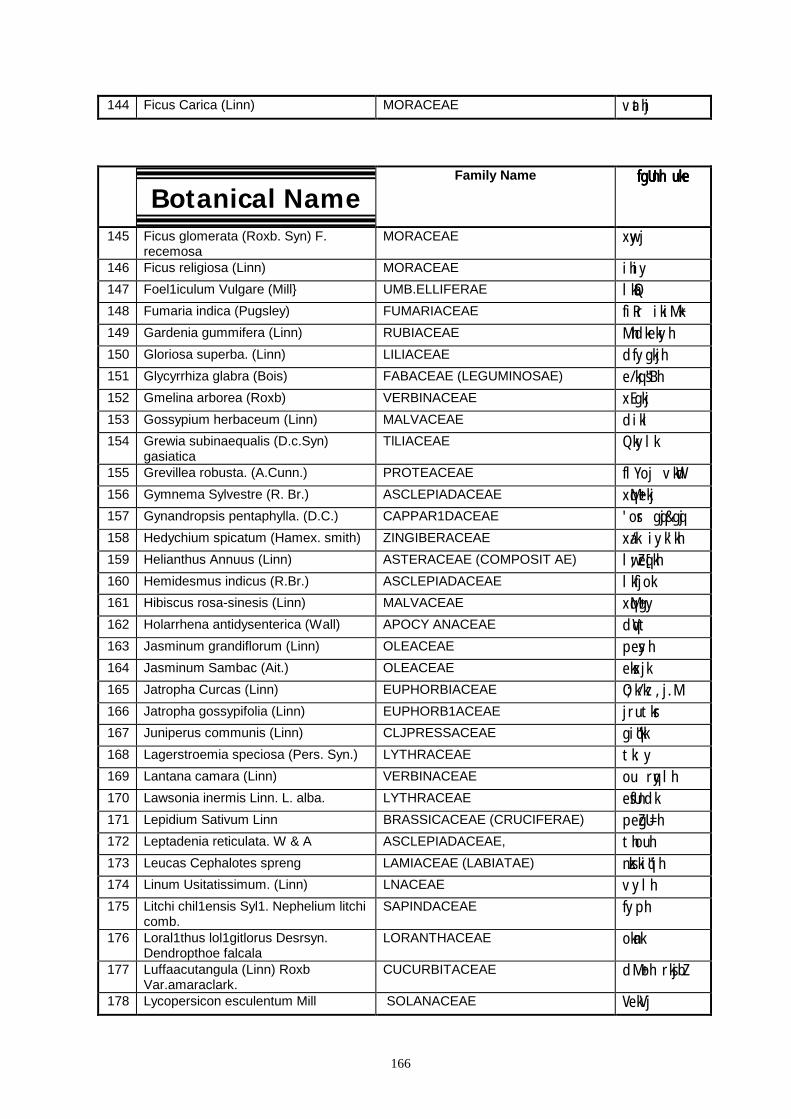
166
144 Ficus Carica (Linn) MORACEAE vathj
Botanical NameFamily Name fgUnh ukefgUnh ukefgUnh ukefgUnh uke
145 Ficus glomerata (Roxb. Syn) F. recemosa
MORACEAE xwyj
146 Ficus religiosa (Linn) MORACEAE ihiy 147 Foel1iculum Vulgare (Mill} UMB.ELLIFERAE lkSaQ 148 Fumaria indica (Pugsley) FUMARIACEAE fiRr ikiM+k 149 Gardenia gummifera (Linn) RUBIACEAE Mhdkekyh 150 Gloriosa superba. (Linn) LILIACEAE dfygkjh 151 Glycyrrhiza glabra (Bois) FABACEAE (LEGUMINOSAE) e/kq;s"Bh 152 Gmelina arborea (Roxb) VERBINACEAE xEgkj 153 Gossypium herbaceum (Linn) MALVACEAE dikl 154 Grewia subinaequalis (D.c.Syn)
gasiatica TlLIACEAE Qkylk
155 Grevillea robusta. (A.Cunn.) PROTEACEAE flYoj vkWd 156 Gymnema Sylvestre (R. Br.) ASCLEPIADACEAE xqM+ekj 157 Gynandropsis pentaphylla. (D.C.) CAPPAR1DACEAE 'osr gqj&gqj 158 Hedychium spicatum (Hamex. smith) ZINGIBERACEAE xa/k iyk'kh 159 Helianthus Annuus (Linn) ASTERACEAE (COMPOSIT AE) lw;Zeq[kh 160 Hemidesmus indicus (R.Br.) ASCLEPIADACEAE lkfjok 161 Hibiscus rosa-sinesis (Linn) MALVACEAE xqM+gy 162 Holarrhena antidysenterica (Wall) APOCY ANACEAE dqVt 163 Jasminum grandiflorum (Linn) OLEACEAE pesyh 164 Jasminum Sambac (Ait.) OLEACEAE eksxjk 165 Jatropha Curcas (Linn) EUPHORBIACEAE O;k/kz ,j.M 166 Jatropha gossypifolia (Linn) EUPHORB1ACEAE jrutksr 167 Juniperus communis (Linn) CLJPRESSACEAE giq"kk 168 Lagerstroemia speciosa (Pers. Syn.) LYTHRACEAE tk:y 169 Lantana camara (Linn) VERBINACEAE ou rqylh 170 Lawsonia inermis Linn. L. alba. LYTHRACEAE esfUndk 171 Lepidium Sativum Linn BRASSICACEAE (CRUCIFERAE) peZgU=h 172 Leptadenia reticulata. W & A ASCLEPIADACEAE, thouh 173 Leucas Cephalotes spreng LAMIACEAE (LABIATAE) nzks.kiq"ih 174 Linum Usitatissimum. (Linn) LNACEAE vylh 175 Litchi chil1ensis Syl1. Nephelium litchi
comb. SAPINDACEAE fyph
176 Loral1thus lol1gitlorus Desrsyn. Dendropthoe falcala
LORANTHACEAE okank
177 Luffaacutangula (Linn) Roxb Var.amaraclark.
CUCURBITACEAE dM+oh rksjbZ
178 Lycopersicon esculentum Mill SOLANACEAE VekVj
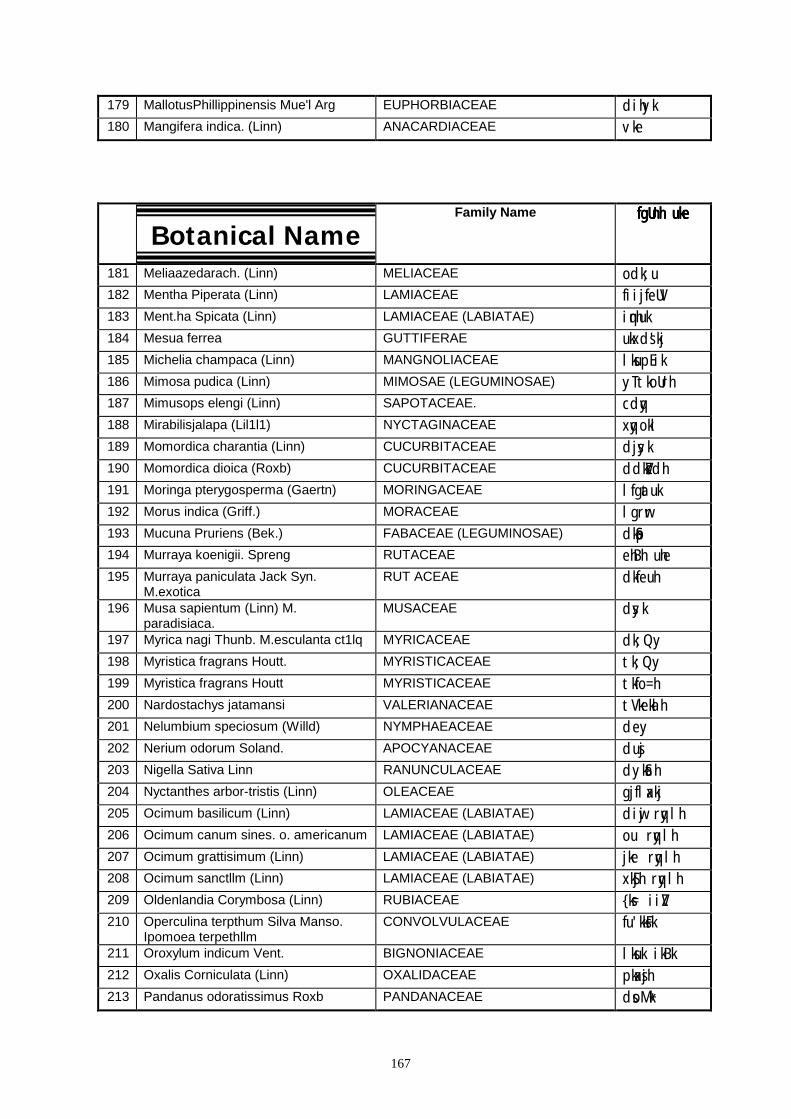
167
179 MallotusPhillippinensis Mue'l Arg EUPHORBIACEAE dihyk 180 Mangifera indica. (Linn) ANACARDIACEAE vke
Botanical NameFamily Name fgUnh ukefgUnh ukefgUnh ukefgUnh uke
181 Meliaazedarach. (Linn) MELIACEAE odk;u 182 Mentha Piperata (Linn) LAMIACEAE fiijfeUV 183 Ment.ha Spicata (Linn) LAMIACEAE (LABIATAE) iqnhuk 184 Mesua ferrea GUTTIFERAE ukxds'kj 185 Michelia champaca (Linn) MANGNOLIACEAE lksupEik 186 Mimosa pudica (Linn) MIMOSAE (LEGUMINOSAE) yTtkoUrh 187 Mimusops elengi (Linn) SAPOTACEAE. cdqy 188 Mirabilisjalapa (Lil1l1) NYCTAGINACEAE xqyokl 189 Momordica charantia (Linn) CUCURBITACEAE djsyk 190 Momordica dioica (Roxb) CUCURBITACEAE ddkZsVdh 191 Moringa pterygosperma (Gaertn) MORINGACEAE lfgatuk 192 Morus indica (Griff.) MORACEAE lgrwr 193 Mucuna Pruriens (Bek.) FABACEAE (LEGUMINOSAE) dkSap 194 Murraya koenigii. Spreng RUTACEAE ehBh uhe 195 Murraya paniculata Jack Syn.
M.exotica RUT ACEAE dkfeuh
196 Musa sapientum (Linn) M. paradisiaca.
MUSACEAE dsyk
197 Myrica nagi Thunb. M.esculanta ct1lq MYRICACEAE dk;Qy 198 Myristica fragrans Houtt. MYRISTICACEAE tk;Qy 199 Myristica fragrans Houtt MYRISTICACEAE tkfo=h 200 Nardostachys jatamansi VALERIANACEAE tVkekalh 201 Nelumbium speciosum (Willd) NYMPHAEACEAE dey 202 Nerium odorum Soland. APOCYANACEAE dusj 203 Nigella Sativa Linn RANUNCULACEAE dykSath 204 Nyctanthes arbor-tristis (Linn) OLEACEAE gjflaxkj 205 Ocimum basilicum (Linn) LAMIACEAE (LABIATAE) diwj rqylh 206 Ocimum canum sines. o. americanum LAMIACEAE (LABIATAE) ou rqylh 207 Ocimum grattisimum (Linn) LAMIACEAE (LABIATAE) jke rqylh 208 Ocimum sanctllm (Linn) LAMIACEAE (LABIATAE) xkSjh rqylh 209 Oldenlandia Corymbosa (Linn) RUBIACEAE {ks= iiZV 210 Operculina terpthum Silva Manso.
Ipomoea terpethllm CONVOLVULACEAE fu'kksFk
211 Oroxylum indicum Vent. BIGNONIACEAE lksuk ikBk 212 Oxalis Corniculata (Linn) OXALIDACEAE pkaxsjh 213 Pandanus odoratissimus Roxb PANDANACEAE dsoM+k
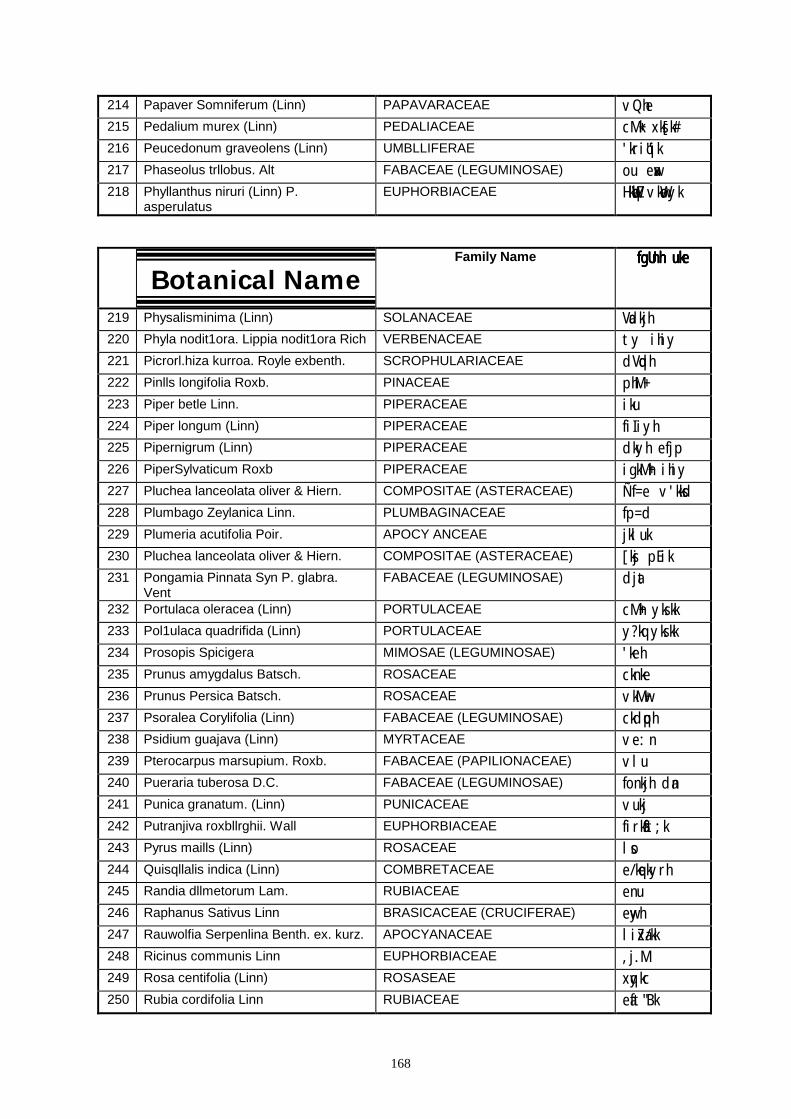
168
214 Papaver Somniferum (Linn) PAPAVARACEAE vQhe 215 Pedalium murex (Linn) PEDALIACEAE cM+k xks[k# 216 Peucedonum graveolens (Linn) UMBLLIFERAE 'kriq"ik 217 Phaseolus trllobus. Alt FABACEAE (LEGUMINOSAE) ou ewax 218 Phyllanthus niruri (Linn) P.
asperulatus EUPHORBIACEAE HkWaqbZ vkWaoyk
Botanical NameFamily Name fgUnh ukefgUnh ukefgUnh ukefgUnh uke
219 Physalisminima (Linn) SOLANACEAE Vadkjh 220 Phyla nodit1ora. Lippia nodit1ora Rich VERBENACEAE ty ihiy 221 Picrorl.hiza kurroa. Royle exbenth. SCROPHULARIACEAE dVqdh 222 Pinlls longifolia Roxb. PINACEAE phM+ 223 Piper betle Linn. PIPERACEAE iku 224 Piper longum (Linn) PIPERACEAE fiIiyh 225 Pipernigrum (Linn) PIPERACEAE dkyh efjp 226 PiperSylvaticum Roxb PIPERACEAE igkM+h ihiy 227 Pluchea lanceolata oliver & Hiern. COMPOSITAE (ASTERACEAE) Ñf=e v'kksd 228 Plumbago Zeylanica Linn. PLUMBAGINACEAE fp=d 229 Plumeria acutifolia Poir. APOCY ANCEAE jkluk 230 Pluchea lanceolata oliver & Hiern. COMPOSITAE (ASTERACEAE) [ksj pEik 231 Pongamia Pinnata Syn P. glabra.
Vent FABACEAE (LEGUMINOSAE) djat
232 Portulaca oleracea (Linn) PORTULACEAE cM+h yks.kk 233 Pol1ulaca quadrifida (Linn) PORTULACEAE y?kq yks.kk 234 Prosopis Spicigera MIMOSAE (LEGUMINOSAE) 'keh 235 Prunus amygdalus Batsch. ROSACEAE cknke 236 Prunus Persica Batsch. ROSACEAE vkM+w 237 Psoralea Corylifolia (Linn) FABACEAE (LEGUMINOSAE) ckdqph 238 Psidium guajava (Linn) MYRTACEAE ve:n 239 Pterocarpus marsupium. Roxb. FABACEAE (PAPILIONACEAE) vlu 240 Pueraria tuberosa D.C. FABACEAE (LEGUMINOSAE) fonkjh dan 241 Punica granatum. (Linn) PUNICACEAE vukj 242 Putranjiva roxbllrghii. Wall EUPHORBIACEAE firkSaft;k 243 Pyrus maills (Linn) ROSACEAE lso 244 Quisqllalis indica (Linn) COMBRETACEAE e/kqekyrh 245 Randia dllmetorum Lam. RUBIACEAE enu 246 Raphanus Sativus Linn BRASICACEAE (CRUCIFERAE) ewyh 247 Rauwolfia Serpenlina Benth. ex. kurz. APOCYANACEAE liZxa/kk 248 Ricinus communis Linn EUPHORBIACEAE ,j.M 249 Rosa centifolia (Linn) ROSASEAE xqykc 250 Rubia cordifolia Linn RUBIACEAE eaft"Bk
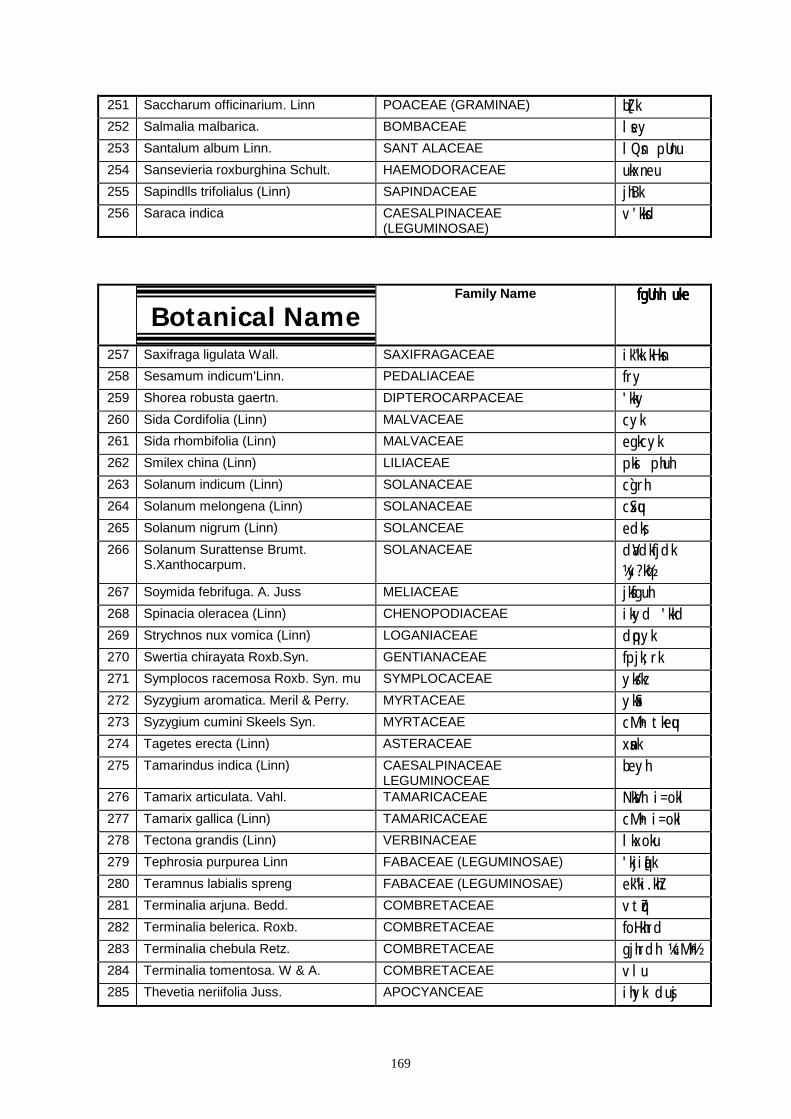
169
251 Saccharum officinarium. Linn POACEAE (GRAMINAE) bZ[k 252 Salmalia malbarica. BOMBACEAE lsey 253 Santalum album Linn. SANT ALACEAE lQsn pUnu 254 Sansevieria roxburghina Schult. HAEMODORACEAE ukxneu 255 Sapindlls trifolialus (Linn) SAPINDACEAE jhBk 256 Saraca indica CAESALPINACEAE
(LEGUMINOSAE) v'kksd
Botanical NameFamily Name fgUnh ukefgUnh ukefgUnh ukefgUnh uke
257 Saxifraga ligulata Wall. SAXIFRAGACEAE ik"kk.kHksn 258 Sesamum indicum'Linn. PEDALIACEAE fry 259 Shorea robusta gaertn. DIPTEROCARPACEAE 'kky 260 Sida Cordifolia (Linn) MALVACEAE cyk 261 Sida rhombifolia (Linn) MALVACEAE egkcyk 262 Smilex china (Linn) LILIACEAE pksi phuh 263 Solanum indicum (Linn) SOLANACEAE c`grh 264 Solanum melongena (Linn) SOLANACEAE cSxqu 265 Solanum nigrum (Linn) SOLANCEAE edks; 266 Solanum Surattense Brumt.
S.Xanthocarpum. SOLANACEAE daVdkfjdk
¼y?kq½ 267 Soymida febrifuga. A. Juss MELIACEAE jksfguh 268 Spinacia oleracea (Linn) CHENOPODIACEAE ikyd 'kkd 269 Strychnos nux vomica (Linn) LOGANIACEAE dqpyk 270 Swertia chirayata Roxb.Syn. GENTIANACEAE fpjk;rk 271 Symplocos racemosa Roxb. Syn. mu SYMPLOCACEAE yks/kz 272 Syzygium aromatica. Meril & Perry. MYRTACEAE ykSax 273 Syzygium cumini Skeels Syn. MYRTACEAE cM+h tkequ 274 Tagetes erecta (Linn) ASTERACEAE xsank 275 Tamarindus indica (Linn) CAESALPINACEAE
LEGUMINOCEAE beyh
276 Tamarix articulata. Vahl. TAMARICACEAE NksVh i=okl 277 Tamarix gallica (Linn) TAMARICACEAE cM+h i=okl 278 Tectona grandis (Linn) VERBINACEAE lkxoku 279 Tephrosia purpurea Linn FABACEAE (LEGUMINOSAE) 'kjiqa[k 280 Teramnus labialis spreng FABACEAE (LEGUMINOSAE) ek"ki.khZ 281 Terminalia arjuna. Bedd. COMBRETACEAE vtqZu 282 Terminalia belerica. Roxb. COMBRETACEAE foHkhrd 283 Terminalia chebula Retz. COMBRETACEAE gjhrdh ¼cM+h½ 284 Terminalia tomentosa. W & A. COMBRETACEAE vlu 285 Thevetia neriifolia Juss. APOCYANCEAE ihyk dusj
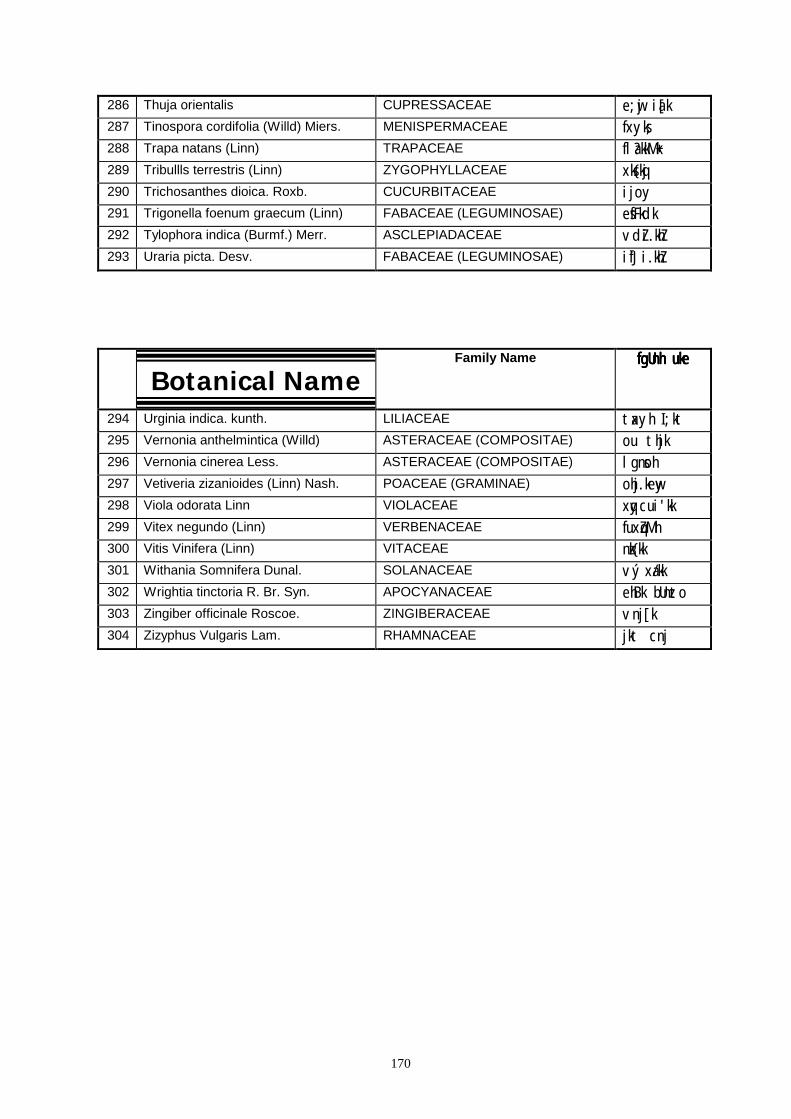
170
286 Thuja orientalis CUPRESSACEAE e;wj ia[k 287 Tinospora cordifolia (Willd) Miers. MENISPERMACEAE fxyks; 288 Trapa natans (Linn) TRAPACEAE fla?kkM+k 289 Tribullls terrestris (Linn) ZYGOPHYLLACEAE xks{kqj 290 Trichosanthes dioica. Roxb. CUCURBITACEAE ijoy 291 Trigonella foenum graecum (Linn) FABACEAE (LEGUMINOSAE) esfFkdk 292 Tylophora indica (Burmf.) Merr. ASCLEPIADACEAE vdZi.khZ 293 Uraria picta. Desv. FABACEAE (LEGUMINOSAE) i`fJi.khZ
Botanical NameFamily Name fgUnh ukefgUnh ukefgUnh ukefgUnh uke
294 Urginia indica. kunth. LILIACEAE taxyh I;kt 295 Vernonia anthelmintica (Willd) ASTERACEAE (COMPOSITAE) ou thjk 296 Vernonia cinerea Less. ASTERACEAE (COMPOSITAE) lgnsoh 297 Vetiveria zizanioides (Linn) Nash. POACEAE (GRAMINAE) ohj.kewy 298 Viola odorata Linn VIOLACEAE xqycui'kk 299 Vitex negundo (Linn) VERBENACEAE fuxZq.Mh 300 Vitis Vinifera (Linn) VITACEAE nzk{kk 301 Withania Somnifera Dunal. SOLANACEAE výxa/kk 302 Wrightia tinctoria R. Br. Syn. APOCYANACEAE ehBk bUnzto 303 Zingiber officinale Roscoe. ZINGIBERACEAE vnj[k 304 Zizyphus Vulgaris Lam. RHAMNACEAE jkt cnj
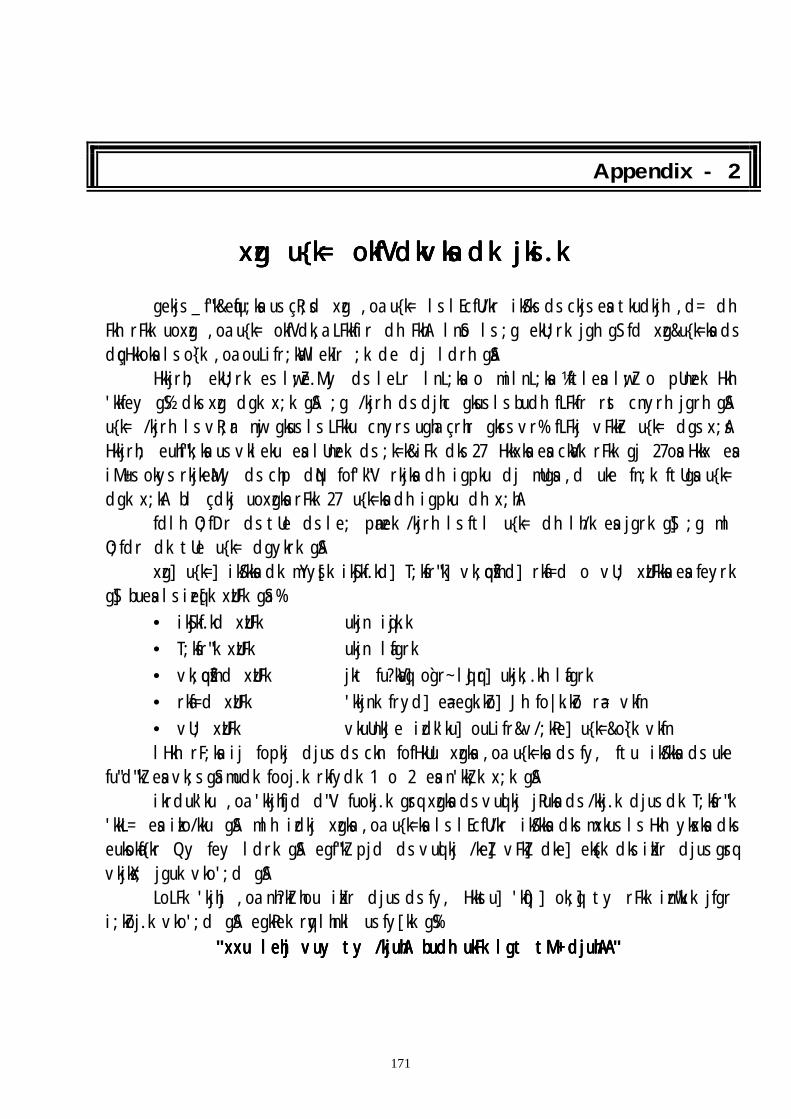
171
Appendix - 2
xzg u{k= okfVdkvksa dk jksi.kxzg u{k= okfVdkvksa dk jksi.kxzg u{k= okfVdkvksa dk jksi.kxzg u{k= okfVdkvksa dk jksi.k gekjs _f"k&eqfu;ksa us çR;sd xzg ,oa u{k= ls lEcfU/kr ikS/ks ds ckjs esa tkudkjh ,d= dh Fkh rFkk uoxzg ,oa u{k= okfVdk,a LFkkfir dh FkhA lnSo ls ;g ekU;rk jgh gS fd xzg&u{k=ksa ds dqçHkkoksa ls o`{k ,oa ouLifr;kWa lekIr ;k de dj ldrh gSaA Hkkjrh; ekU;rk es lw;Ze.My ds leLr lnL;ksa o milnL;ksa ¼ftlesa lw;Z o pUnzek Hkh 'kkfey gS½ dks xzg dgk x;k gSA ;g /kjrh ds djhc gksus ls budh fLFkfr rst cnyrh jgrh gSA u{k= /kjrh ls vR;ar nwj gksus ls LFkku cnyrs ugha çrhr gksrs vr% fLFkj vFkkZr u{k= dgs x;sA Hkkjrh; euhf"k;ksa us vkleku esa lUnzek ds ;k=k&iFk dks 27 Hkkxksa esa ckaVk rFkk gj 27osa Hkkx esa iM+us okys rkjkeaMy ds chp dqN fof'k"V rkjksa dh igpku dj mUgsa ,d uke fn;k ftUgsa u{k= dgk x;kA bl çdkj uoxzgksa rFkk 27 u{k=ksa dh igpku dh x;hA fdlh O;fDr ds tUe ds le; panzek /kjrh ls ftl u{k= dh lh/k esa jgrk gS] ;g ml O;fdr dk tUe u{k= dgykrk gSA xzg] u{k=] ikS/kksa dk mYys[k ikSjkf.kd] T;ksfr"k] vk;qosZfnd] rkaf=d o vU; xzUFkksa esa feyrk gS] buesa ls izeq[k xzUFk gSa %
• ikSjkf.kd xzUFk ukjn iqjk.k • T;ksfr"k xzUFk ukjn lafgrk • vk;qosZfnd xzUFk jkt fu?kaVq] o`gr~ lqJqr] ukjk;.kh lafgrk • rkaf=d xzUFk 'kkjnk fryd] ea=egk.kZo] Jh fo|k.kZo ra= vkfn • vU; xzUFk vkuUnkJe izdk'ku] ouLifr&v/;kRe] u{k=&o{̀k vkfn lHkh rF;ksa ij fopkj djus ds ckn fofHkUu xzgksa ,oa u{k=ksa ds fy, ftu ikS/kksa ds uke
fu"d"kZ esa vk;s gSa mudk fooj.k rkfydk 1 o 2 esa n'kkZ;k x;k gSA ikrduk'ku ,oa 'kkjhfjd d"V fuokj.k gsrq xzgksa ds vuqlkj jRuksa ds /kkj.k djus dk T;ksfr"k 'kkL= esa izko/kku gSA mlh izdkj xzgksa ,oa u{k=ksa ls lEcfU/kr ikS/kksa dks mxkus ls Hkh yksxksa dks euksokaf{kr Qy fey ldrk gSA egf"kZ pjd ds vuqlkj /keZ] vFkZ] dke] eks{k dks izkIr djus gsrq vkjksX; jguk vko';d gSA LoLFk 'kjhj ,oa nh?kZthou izkIr djus ds fy, Hkkstu] 'kqf)] ok;q] ty rFkk iznw"k.k jfgr i;kZoj.k vko';d gSA egkRek rqylhnkl us fy[kk gS%
"xxu lehj vuy ty /kjuhA budh ukFk lgt tM+ djuhAAxxu lehj vuy ty /kjuhA budh ukFk lgt tM+ djuhAAxxu lehj vuy ty /kjuhA budh ukFk lgt tM+ djuhAAxxu lehj vuy ty /kjuhA budh ukFk lgt tM+ djuhAA"
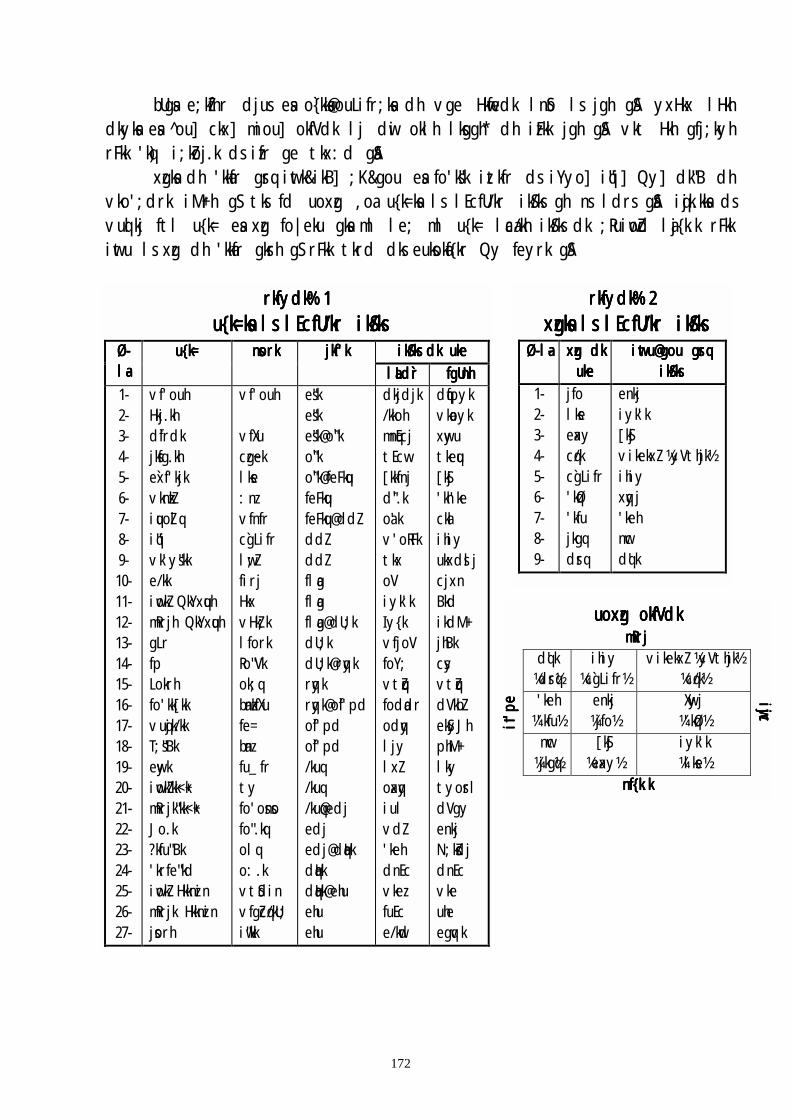
bUgsa e;kZfnr djus esa o`{kksa@ouLifr;ksa dh vge Hkwfedk lnSo ls jgh gSA yxHkx lHkh dkyksa esa ^ou] ckx] miou] okfVdk lj dwi oklh lksggh* dh izFkk jgh gSA vkt Hkh gfj;kyh rFkk 'kq) i;kZoj.k ds izfr ge tkx:d gSaA xzgksa dh 'kkafr gsrq iwtk&ikB] ;K&gou esa fo'ks"k iztkfr ds iYyo] iq"i] Qy] dk"B dh vko';drk iM+rh gS tks fd uoxzg ,oa u{k=ksa ls lEcfU/kr ikS/ks gh ns ldrs gSaA iqjk.kksa ds vuqlkj ftl u{k= esa xzg fo|eku gksa ml le; ml u{k= laca/kh ikS/ks dk ;RuiwoZd laj{k.k rFkk iwtu ls xzg dh 'kkafr gksrh gS rFkk tkrd dks euksokaf{kr Qy feyrk gSA
u{k=ksa u{k=ksa u{k=ksa u{k=ksa ØØØØ----lalalala----
u{k=u{k=u{k=u{k= nnnn
1- 2- 3- 4- 5- 6- 7- 8- 9- 10- 11- 12- 13- 14- 15- 16- 17- 18- 19- 20- 21- 22- 23- 24- 25- 26- 27-
vf'ouh Hkj.kh d̀frdk jksfg.kh e`xf'kjk vknzkZ iquoZlq iq"i vk'ys"kk e/kk iwokZ QkYxquh mRrjh QkYxquh gLr fp Lokrh fo'kk[kk vuqjk/kk T;s"Bk ewyk iwokZ"kk<+k mRrjk"kk<+k Jo.k ?kfu"Bk 'krfe"kd iwokZ Hkknzin mRrjk Hkknzin jsorh
vf' vfXczg~elkse:nvfnc`gLlw;firHkxvHlfoRo"ok;banzkfe=banz fu_tyfo'fo"olo:vtvfgiw"kk
xzgksa xzgksa xzgksa xzgksa ØØØØ----lalalala---- xzgxzgxzgxzg
uuuu1- jfo
rkfydk% 1rkfydk% 1rkfydk% 1rkfydk% 1 ls lEcfU/kr ikS/ksls lEcfU/kr ikS/ksls lEcfU/kr ikS/ksls lEcfU/kr ikS/ks
ikS/ks dk ukeikS/ks dk ukeikS/ks dk ukeikS/ks dk uke sorksorksorksork jkf'kjkf'kjkf'kjkf'k laLdr̀laLdr̀laLdr̀laLdr̀ fgUnhfgUnhfgUnhfgUnh
ouh es"k dkjdjk dqfpyk
172
u k z fr ifr Z j kZ;k rk Vk q fXu
fr osnso .kq q .k Sdin Zcq/kU;
es"k es"k@o`"k o"̀k o"̀k@feFkqu feFkqu feFkqu@ddZ ddZ ddZ flag flag flag@dU;k dU;k dU;k@rqyk rqyk rqyk@of̀'pd o`f'pd o`f'pd /kuq /kuq /kuq@edj edj edj@dqaHk dqaHk dqaHk@ehu ehu ehu
/kkoh mnqEcj tEcw [kkfnj d̀".k oa'k v'oRFk tkx oV iyk'k Iy{k vfjoV foY; vtqZu fodadr odqy ljy lxZ oaxqy iul vdZ 'keh dnEc vkez fuEc e/kwd
vkaoyk xwyu tkequ [kSj 'kh'ke ckal ihiy ukxdslj cjxn Bkd ikdM+ jhBk csy vtqZu dVkbZ ekSyJh phM+ lky tyosrl dVgy enkj N;ksZdj dnEc vke uhe egqvk
2- 3- 4- 5- 6- 7- 8- 9-
lkseeaxcq/kc`g'kqØ'kfujkgdsr
dq'k ¼dsrq½ 'keh ¼'kfu½ if
'pe
if'pe
if'pe
if'pe
nwc ¼jkgq½
rkfydk% 2rkfydk% 2rkfydk% 2rkfydk% 2 ls lEcfU/kr ikS/ksls lEcfU/kr ikS/ksls lEcfU/kr ikS/ksls lEcfU/kr ikS/ks dk dk dk dk kkkkeeee
iwtu@gou gsrq iwtu@gou gsrq iwtu@gou gsrq iwtu@gou gsrq ikS/ksikS/ksikS/ksikS/ks
enkj
y Lifr q qiyk'k [kSj vikekxZ ¼yVthjk½ ihiy xqyj 'keh nwc dq'k
¼c
uoxzg okfVdkuoxzg okfVdkuoxzg okfVdkuoxzg okfVdk mRrjmRrjmRrjmRrj
ihiy g̀Lifr½
vikekxZ ¼yVthjk½ ¼cq/k½
enkj ¼jfo½
Xwyj ¼'kqؽ
[kSj ¼eaxy½
iyk'k ¼lkse½
iwjciwjciwjciwjc
nf{k.knf{k.knf{k.knf{k.k
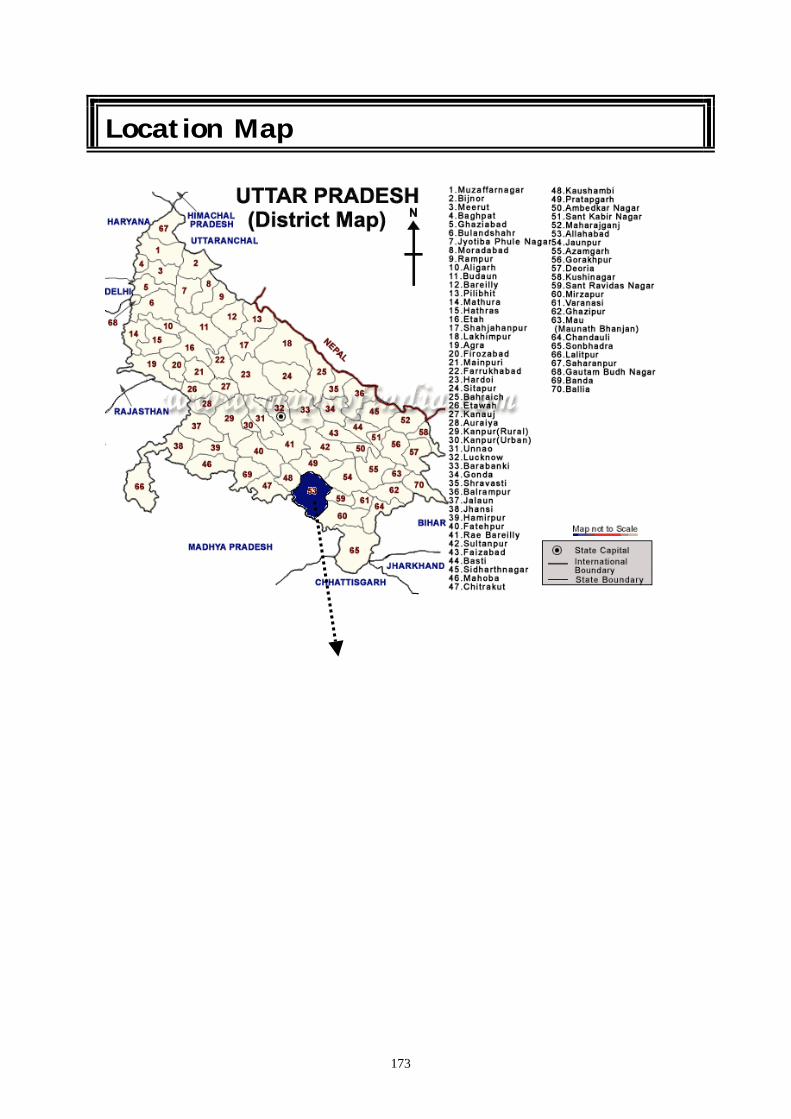
173
Location Map
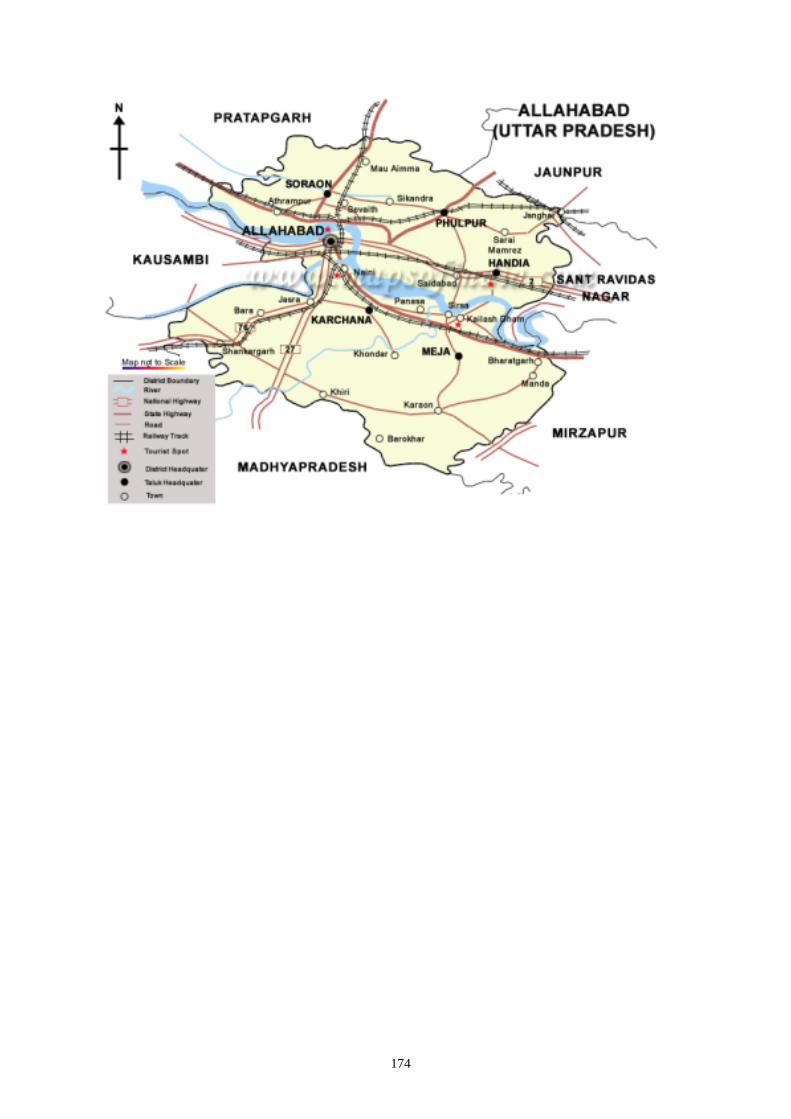
174