model land use plan - planning department(uttar …planning.up.nic.in/landuseboard/supplementary...
TRANSCRIPT
1
Supplementary Report
To be included in
District Model Land Use Plans
By
Bimal Kumar
Sponsored By State Land Use Board, Uttar Pradesh
Department of Planning, Government of U. P. Yojana Bhawan, Lucknow – 226 001
G. B. Pant Social Science Institute Jhusi, Allahabad – 211 019
Phone: (0532) 667214, 667206, Fax: (0532) 667206, E-mail: [email protected]

2
Inclusion of Master Plan of Big Cities in District Model Land Use Plans
In our study we had already discussed about the trend of increase in area
under urban limits. Findings regarding selected districts are as follows:
Though Allahabad had been divided, the area under urban limits increased
from 89 sq.km. in 1961 to 146.8 sq.km. in 1981. i.e. an increase of 64.94 per cent
during two decades. The share of urban population has increased from 18.12 per
cent in 1961 to 24.72 per cent in 2001.
Similarly Varanasi which had been divided twice, the area under urban limits
increased from 116.6 sq.km. in 1961 to 157.7 sq.km. in 1981. i.e. an increase of
35.25 per cent during two decades.
The urban area of undivided Gorakhpur was 82.8 sq.km. in 1981, while the
urban area under divided Gorakhpur is 195.1 sq.km. That is area under urban limits
had increased by more than 135 per cent during the decade 1981-91.
Azamgarh had also been divided therefore true picture could only be inferred
from increase in urban area during 1971-81. The area under urban limits increased
from 21.8 sq.km. in 1971 to 68.5 sq.km. in 1981. i.e. an increase of 214.22 per cent
during two decade. The share of urban population has increased from 5.21 per cent
in 1971 to 7.16 per cent in 1991 and to 7.64 per cent in 2001.
The area under urban limits have also been increasing in Faizabad district.
The area under urban limits increased from 66.8 sq.km. in 1971 to 100.01 sq.km. in
1991. i.e. an increase of 49.72 per cent during two decades.
Jhansi had also been divided, the area under urban limits increased from 91.5
sq.km. in 1961 to 131.4 sq.km. in 1991. i.e. an increase of 43.61 per cent during
three decades.
While preparing land use plan for selected districts, we have taken these
factors into consideration also.
As regards Master Plans for big cities, it may be mentioned that we received
master plans for only two cities viz. Allahabad and Azamgarh.
According to master plan of Allahabad Land Use area during 1987 was
18,511.00 hectares, which was projected to increase to 21689.53 hectares in 2001.
3
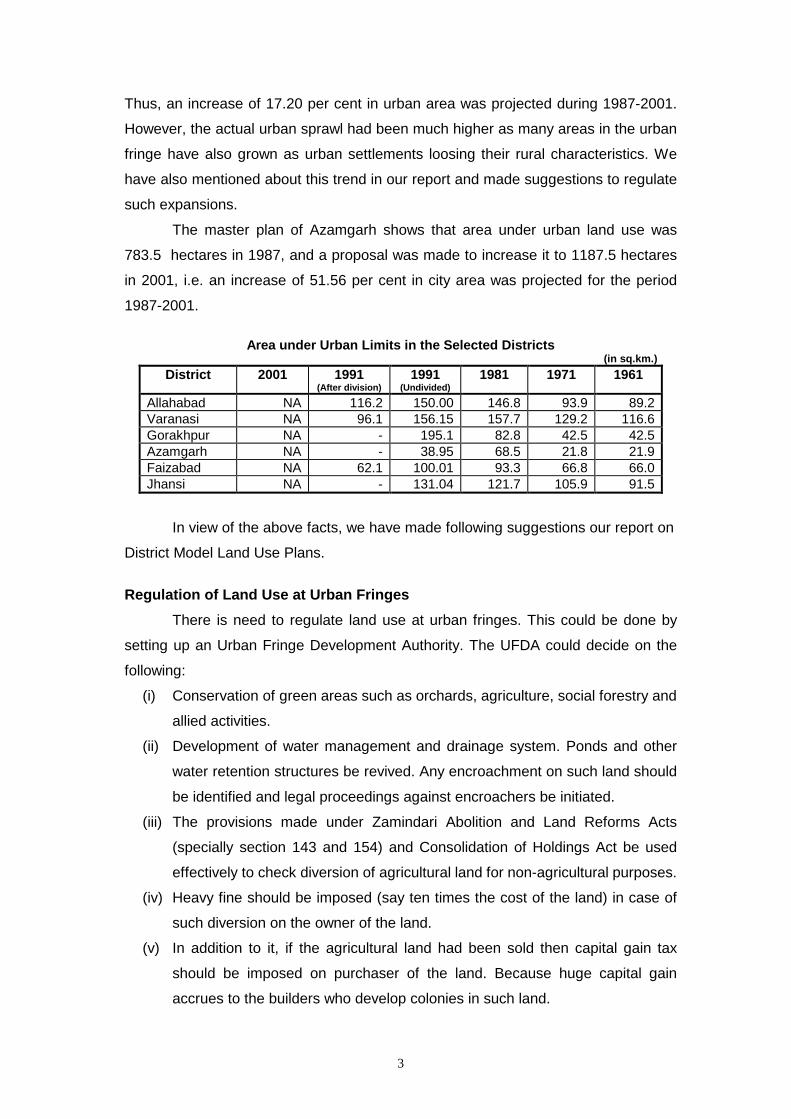
Thus, an increase of 17.20 per cent in urban area was projected during 1987-2001.
However, the actual urban sprawl had been much higher as many areas in the urban
fringe have also grown as urban settlements loosing their rural characteristics. We
have also mentioned about this trend in our report and made suggestions to regulate
such expansions.
The master plan of Azamgarh shows that area under urban land use was
783.5 hectares in 1987, and a proposal was made to increase it to 1187.5 hectares
in 2001, i.e. an increase of 51.56 per cent in city area was projected for the period
1987-2001.
Area under Urban Limits in the Selected Districts (in sq.km.)
District 2001 1991 (After division)
1991 (Undivided)
1981 1971 1961
Allahabad NA 116.2 150.00 146.8 93.9 89.2Varanasi NA 96.1 156.15 157.7 129.2 116.6Gorakhpur NA - 195.1 82.8 42.5 42.5Azamgarh NA - 38.95 68.5 21.8 21.9Faizabad NA 62.1 100.01 93.3 66.8 66.0Jhansi NA - 131.04 121.7 105.9 91.5
In view of the above facts, we have made following suggestions our report on
District Model Land Use Plans.
Regulation of Land Use at Urban Fringes There is need to regulate land use at urban fringes. This could be done by
setting up an Urban Fringe Development Authority. The UFDA could decide on the
following:
(i) Conservation of green areas such as orchards, agriculture, social forestry and
allied activities.
(ii) Development of water management and drainage system. Ponds and other
water retention structures be revived. Any encroachment on such land should
be identified and legal proceedings against encroachers be initiated.
(iii) The provisions made under Zamindari Abolition and Land Reforms Acts
(specially section 143 and 154) and Consolidation of Holdings Act be used
effectively to check diversion of agricultural land for non-agricultural purposes.
(iv) Heavy fine should be imposed (say ten times the cost of the land) in case of
such diversion on the owner of the land.
(v) In addition to it, if the agricultural land had been sold then capital gain tax
should be imposed on purchaser of the land. Because huge capital gain
accrues to the builders who develop colonies in such land.
4
(vi) The first priority be given to development of social services in the fringe area
which will include hospitals, educational centres, training centres for farmers
and agro-based industries.
(vii) Barren and uncultivable land should be identified for development of micro-
industrial estates and then for developing multistoried residential complexes
which are land saving as well.
Besides urban fringes, there is need to restrict the rate of increase of area
under land put to non-agricultural uses, in rural areas in general.
This could be made possible by adopting following steps.
(a) Discourage migration of people of nearby villages. This could be done by
increasing transport facility and by improving road networks.
(b) Strengthen household industries of rural areas by providing them
institutional support and market facilities.
(c) Develop green belt around city and any construction in the green belt area
be strictly prohibited.
(d) Encourage multistory buildings and economic flats to weaker sections.
One important aspect of land put to non-agricultural uses is increasing
number of residential houses. However, since population growth rate is faster, per
person living area is decreasing. Even more disturbing factor is that per person open
area in house premises is also declining. This is the trend in even rural areas. Hence
space for community uses and common recreation places must be developed even
in rural areas. In city planning we leave space for parks, playgrounds and recreation
spots. Such planning should also be done for rural areas. Watershed management
could then be linked with development of parks and recreation places. Some area
could also be reserved for floriculture and horticulture.
Regulation of Land Use along Road Side There has been a tendency to change land use along road side – specially
national highways and state highways. Houses and shops are constructed or such
land is put to even other non-agricultural uses. As a result of this contiguous effect
leads to further expansion of settlements near highways and such places become
accident prone. Therefore, there is need to regulate land use along roadside.
Following measures could be adopted in this respect:
(i) A green strip be developed on both sides of road. Such green strip on each
side should not be less than 10 meter wide.
(ii) Wherever, highways are connected with other roads, construction along side
even such connecting roads be prohibited for a length of at least one
kilometer.
5
(iii) Those who construct houses or buildings on agricultural lands along side road
should be fined heavily (say ten times the cost of the land).
The rate of increase of area under the category of land put to non-agricultural
uses could then be restricted to around 13.5 per cent of total reporting area by the
year 2010. We would also like to reproduce our suggestions made in chapter six of our report on
Land Reforms and Effective Land Use Planning. This chapter discusses urbanisation and
Conversions of Agricultural Land for Non-Agricultural Purposes.
Suggestions
(i) Land requirement norms should be evolved for expanding townships, and a
detailed scheme for utilization of land to be acquired should also be prepared.
(ii) If the livelihood of the families whose land has been acquired is affected, then
assistance for employment should also be provided by the acquiring agency.
This assistance should be over and above the award of due compensation.
Employment Guarantee Card should be provided to each affected family.
(iii) If the value of land appreciates after acquisition and the land acquiring
agency reaps profit by allotting it to new users; then a part of profit should
also be paid to the affected farmer.
(iv) Necessary support and credit should be provided to them so that they could
take advantage of schemes which are specifically identified for them.
Framework for Urban Rural Balance
1. Fix critical limits for density of population as well as area of urban settlements
for each city.
2. Once an urban settlement reaches a stage where density of population or the
area crosses the critical limit, following steps be immediately taken up:
(a) select markets/small townships which are 50 kilometers away from
city limits and develop those townships with the facilities for i) higher
education ; ii) big hospitals with facilities for specialised treatments; iii)
sports and recreation centres; and iv)setting up of business and
industrial complexes.
(b) Provide all infrastructural (such as power, roads, communications etc.)
facilities along with civic amenities.

6
(c) Develop a very efficient transport system from villages to these town
ships on the one hand and from these small town ships to big cities on
the other.
(d) If an agricultural land of prime quality is being acquired with the
approval of the state legislature and gaon sabha for urban
development, i) a levy must be imposed on such transfers and ii) 50
percent of the final sale proceed be transferred for “agricultural
development fund” of that area.
(3) Three level planning cum administrative setup comprising state, region and
block be developed for future planned development. Districts could remain
nodal units for maintaining law and order and administration of justice.
Decentralise most of the politic administration to the block level. Block level
plans be formulated instead of district level plans in the area of health,
education, manpower planning, irrigation, rural industrialisation, information
and communication technology and for the energy sector. This could directly
be linked with regional level planning cum administrative units.
(4) Plan dispersal of industries. Serious efforts should be made to develop
industrial zones in least fertile and marginal lands.
(5) Housing schemes should be promoted at , as far as possible on barren and
infertile land.
(6) Fast transportation system and efficient communication network should be
developed to link each and every village.
7
1.1 District - Allahabad
The total area of Allahabad district reduced from 7261.00 sq.km. to 5437.20 sq.km.
due to carving out of new districts.
The number of residential houses have been increasing at the rate of around 24 per
cent or more per decade.
Though Allahabad had been divided, the area under urban limits increased from 89
sq.km. in 1961 to 146.8 sq.km. in 1981. i.e. an increase of 64.94 per cent during two decades.
The share of urban population has increased from 18.12 per cent in 1961 to 24.72 per cent in
2001.
The decennial growth rate of population had been very high during the last three
decades. This has resulted in the pressure of population on land.
The pressure on land in Allahabad continues to increase because a sizable work-
force was found to be engaged in agricultural activities.
It was also found that whereas the proportion of agricultural labourers has increased
during 1981-91, the proportion of workers in household industry and in other services have
declined during the same period.
1.1.1 Land Use Plan Related to Agricultural Land In Allahabad district the average size of landholding was 0.75 hectare as per the
1995-96 agricultural census and 91.43 per cent holdings belonged to the small and marginal
farmers, while they accounted for only 57.25 per cent of total area under all landholdings.
The net sown area as percentage of total reporting area increased from around 64
per cent to above 67 per cent after 1994-95.
But the analysis of block-wise net sown area shows that in most of the blocks the
proportion of net sown area had been above 70.0 per cent during 2000-01 or during some
past years. There were only 4 out of 20 blocks where net sown area had been low. These are
Chaka, Karchana, Uroowa and Meja. Net sown area in Chaka was low because it is on the
urban fringe. There is need to regulate land use on urban fringes. In other blocks net sown
area could be increased through micro water shed management programmes.
The cropping intensity of the Allahabad district had almost consistently increased
since 1960-61, and has increased to 157.3 during the period 2000-01.
The most important factor which has effected cropping intensity is irrigation.
The irrigation intensity i.e. net irrigated area as percentage of net sown area has
increased from 23.16 per cent in 1960-61 to 71.31 per cent in 2000-01. This trend was
discernible in all the blocks of the district as well.
8
Furthermore, gross irrigated area as percentage of net irrigated area has also
increased during the last twenty five years from around 118.46 in 1980-81 to around 162.8 in
2000-01 with fluctuating trends during intervening periods.
Canals and Tubewells are now the major sources of irrigation in Allahabad district,
and account for more than 97 per cent of net irrigated area.
There is another aspect of analysis of sources of irrigation. The role of public sources
continues to be very important. Because canals and government tubewells together account
for more than 60 per cent of net irrigated area in the district. That means, public investment in
irrigation will continue to play an important role in increasing gross irrigated area, which in turn
would help in increasing the cropping intensity in many blocks of the district.
The cropping pattern in the district has vastly changed during the last 30 years.
The main crops viz. paddy, wheat and potato have witnessed large increases in their
productivity also during the period 1960-61 to 1998-99.
Thus farmers have shifted to crops, which are highly irrigated, fertilizer use is higher
on them and whose productivity is also comparatively very high.
1.1.2 Forest The forest land was around 2.7 per cent of total reporting area during the period
1970-71 to 1997-98. Thereafter it increased to around 3.6 per cent. There are four blocks in
the district where area under forest has some sizable proportion. These are: Shankargarh
(10.23 per cent), Meja (9.16 per cent), Koraon (8.24 per cent) and Manda (13.75 per cent).
The area under culturable waste was above 5.0 per cent of total reporting area in the
following blocks: Kaurihar, Baharia, Phulpur, Bahadurpur, Chaka and Meja, while area under
other fallow was above 5.0 per cent of total reporting area in Kaurihar, Shankargarh, Meja
and Manda blocks.
The area under forest could be brought to around 5 per cent of total reporting area, if
some part of the land under other fallow and some part of land under culturable waste is
brought under forest. This could be done by forming Joint Forest Management Committees
consisting of plant growers from poor peasantry class and representatives of forest
department and land use committee. A cell should be formed to provide them the financial
support and infra-structural support so that they could get suitable plants, methods to protect
them and finally marketing of forest produce.
Secondly, development of such forests should be linked with watershed management
in the area. For this purpose an area of 500 hectares to 1000 hectares should be choosen as
unit for micro-watershed management.
This would include (i) construction of water retention structures (ii) clearing and
desilting of natural courses of drainage systems and (iii) restoration/reconstruction of ponds/
tanks in totally barren lands or low lying lands.
Thirdly programmes like Pradhan Mantri Rojgar Yojana etc. should be now utilised for
construction of bundhis, management of wild resources including fisheries, drainage
maintenance and enhancement etc.
9
Fourthly, more emphasis will have to be laid on energy plantation which would
provide fuel wood besides growing of fruit trees rather than timber linked growth of forests.
1.1.3 Land Put to Non-agricultural Uses Area under land put to non-agricultural uses has been continuously increasing over
the past 40 years. It was around 9.5 per cent during 1960-61 and has risen to around 12 per
cent by the end of year 2000.
Land in this category has been steadily increasing. However, this increase is faster in
blocks located at the urban fringe. Chaka is one such block where land put to non-agricultural
uses is 21.22 per cent of the total reporting areas.
Besides Allahabad, there are nine townships in Allahabad district. These have also
affected growth of land put to non-agricultural uses.
Besides these, there are some non-notified local markets. Land put to non-
agricultural uses is also high in them. These include Kaurihar (16.91 per cent), Soraon (14.15
per cent) and Saidabad (14.02 per cent).
Uroowa is one block where proportion of land under category of land put to non-
agricultural uses is very high because the area of the block is small and a large part of it is
covered by rail and road network.
1.1.4 Barren and Unculturable Land We hope that through these measures, area under barren and unculturable land
could be reduced from 3.5 per cent to 1.0 per cent of reporting area in district Allahabad.
1.1.5 Culturable Waste Currently area under culturable waste is 2.46 per cent of total reporting area. A part of
it (say around 1.5 per cent) could be converted into social forestry and the rest i.e. around 0.9
per cent could be developed as pasture and other grazing land. At some places, such land
could also be used for fodder cultivation – specially those areas, which are owned by private
individuals.
Support should be provided for developing pasture land and growing fodder.
1.1.6 Land under Miscellaneous Trees, Crops, and Groves not included in Net Sown Area
Land use under this category had been the first victim of population growth and
conversion for other uses.
Land under this category could be increased by 1.0 per cent of total reporting area by
converting 1.0 per cent of total reporting area under other fallow land for growing
miscellaneous trees and groves. We propose this because we feel that it would be difficult to
bring back all the other fallow land under cultivation.
1.2 District - Varanasi
The total area of Varanasi district reduced from 5092.00 sq.km. In 1991 to 1550.30
sq.km. in 2001 due to carving out of new districts.

10
The number of residential houses have been increasing at the rate of around 25 per cent or more per decade. There were only two blocks in the district namely Pindara and Cholapur where the
proportion of workers depending on agriculture was above 60 per cent. And these are the two
blocks where workers engaged in secondary sector was less than 15 per cent.
The average size of landholding was 0.56 hectare as per the 1995-96 agricultural
census, 95.1 per cent holdings belonged to the small and marginal farmers, while they
accounted for only 69.4 per cent of total area under all landholdings.
1.2.1 Land Use Plan Related to Agricultural Land After division of the district, the net sown area as percentage of total reporting area
increased to around 75 per cent. This is so, because the blocks which have remained with
Varanasi district had higher proportion of net sown area.
The analysis of block-wise net sown area shows that in most of the blocks the
proportion of net sown area had almost remained same and fluctuated within the range of two
to three per cent during the last twenty years, i.e. Since 1980-81, barring the year 1995-96,
which seems to be an exceptional year.
The cropping intensity of the Varanasi district had almost consistently increased since
1960-61 and has hovered around 150 during the period 1985-86 to 2000-01. The most
important factor which has affected cropping intensity is irrigation. The irrigation intensity i.e.
net irrigated area as percentage of net sown area has increased from 51.91 per cent in 1975-
76 to 78 per cent in 2000-01. This trend was discernible in all the blocks of the district as well.
Furthermore, gross irrigated area as percentage of net irrigated area has also
increased during the last twenty five years from around 125 in 1975-76 to around 150 in
2000-01 with fluctuating trends during intervening periods.
Tubewell is now the dominant source of irrigation in Varanasi district, and accounts
for more than 80 per cent of net irrigated area.
There is another aspect of analysis of sources of irrigation. Though tubewells have
become dominant source of irrigation, the role of public sources continues to be very
important. Because canals and government tubewells together account for more than 50 per
cent of net irrigated area in most of the blocks. That means, public investment in irrigation will
continue to play an important role in increasing gross irrigated area, which in turn would help
in increasing the cropping intensity in these blocks.
The cropping pattern in the district has vastly changed during the last 30 years. The
main crops viz. paddy, wheat, potato and sugarcane have witnessed very large increases in
their productivity also during the period 1960-61 to 1998-99.
Thus farmers have shifted to crops, which are highly irrigated, fertilizer use is higher
on them and whose productivity is also comparatively very high.
1.2.2 Forest The forestland increased from around 14.5 per cent of total reporting area in 1960-61
to around 14.78 per cent by 1970-71. Thereafter in the next decade i.e. during 1971-1980, it

11
registered a further increase to around 15 per cent. The area under forest further increased to
around 15.2 per cent by the end of eighties. This trend continued till around 1996.
The area under forest dropped to nill after that and is presently only 0.47 per cent of
total reporting area. The area under forest could be brought to around 2 per cent of total
reporting area, if some part of the land under other fallow and some part of land under
culturable waste is brought under forest. This could be done by forming Joint Forest
Management Committees consisting of plant growers from poor peasantry class and
representatives of forest department and land use committee. A cell should be formed to
provide them the financial support and infra-structural support so that they could get suitable
plants, methods to protect them and finally marketing of forest produce.
Secondly, development of such forests should be linked with watershed management
in the area. For this purpose an area of 500 hectares to 1000 hectares should be choosen as
unit for micro-watershed management.
This would include (i) construction of water retention structures (ii) clearing and
desilting of natural courses of drainage systems and (iii) restoration/reconstruction of ponds/
tanks in totally barren lands or low lying lands.
Thirdly programmes like Pradhan Mantri Rojgar Yojana etc. should be now utilised for
construction of bundhis, management of wild resources including fisheries, drainage
maintenance and enhancement etc.
Fourthly, more emphasis will have to be laid on energy plantation which would
provide fuel wood besides growing of fruit trees rather than timber linked growth of forests.
1.2.3 Land Put to Non-agricultural Uses Area under land put to non-agricultural uses has been continuously increasing over
the past 40 years. It was around 8 per cent during 1960-61 and has risen to around 13.25 per
cent by the end of year 2000.
The proportion of land put to non-agricultural uses is already very high in present
Varanasi district. During the last two decades, it had increased by 2 per cent of reporting area
per decade. With the forest area having virtually become nil, increase of land put to non-
agricultural uses needs to be restricted severely. Failing which, it would not be possible to
convert land available under other uses to bring under plantation.
1.2.4 Barren and Unculturable Land Barren and unculturable land be used for further expansion of residential places,
playgrounds and construction of building for common uses such as school or panchayat
bhawan. It could also be used as Khalihan if it is nearby fields. And it could be used for
cremation ground or graveyard if it is far away from habitation.
Thus, barren and unculturable land could be shifted for use as land put to non-
agricultural purposes. Some part of it could also be used for developing as pasture and
grazing land.
We hope that through these measures, area under barren and unculturable land
could be reduced from 2.11 per cent to 1.0 per cent of reporting area in district Varanasi.
12
1.2.4 Culturable Waste This is a category showing non-enterprise. To our mind, there should be no such
category. If cultivation is not possible then it could be converted into area for social forestry or
developed as pasture and other grazing land.
Currently area under culturable waste is 1.65 per cent of total reporting area. A part of
it (say around 0.65 per cent) could be converted into social forestry and the rest i.e. around
1.0 per cent could be developed as pasture and other grazing land. At some places, such
land could also be used for fodder cultivation – specially those areas, which are owned by
private individuals.
Support should be provided for developing pasture land and growing fodder.
1.2.6 Land under Miscellaneous Trees, Crops, and Groves not included in Net Sown Area
Land use under this category had been the first victim of population growth and
conversion for other uses.
Land under this category could be increased by 1.0 per cent of total reporting area by
converting 1.0 per cent of total reporting area under other fallow land for growing
miscellaneous trees and groves. We propose this because we feel that it would be difficult to
bring back all the other fallow land under cultivation.
1. 3 District - Gorakhpur
The total area of Gorakhpur district reduced from 6314.00 sq. km. In 1971 to 3397.00
sq. km. in 1981 due to carving out of new districts.
There had also been obvious changes in the number of residential houses and
number of households during the last 40 years.
The number of residential houses have been increasing at the rate of more than 10 per cent per decade.
The urban area of undivided Gorakhpur was 82.8 sq.km. in 1981, while the urban
area under divided Gorakhpur is 195.1 sq.km. That is area under urban limits had increased
by more than 135 per cent during the decade 1981-91.
The decennial growth rate had been very high during the last three decades. This has
resulted in the pressure of population on land.
The density of population of the district was as high as 750 persons per squire
kilometre in 1991, which increase to 1140 persons per square kilometre in 2001.
The literacy rate increased from 19.8 per cent in 1971 to 43.3 per cent in 1991.
The pressure on land in Gorakhpur has remained very high because the work-force
on agriculture remains high.
The high proportion of agricultural labourers shows that wage-workers were not able
to get employment in secondary and tertiary sector.
Another feature of dependency on land is that while the share of cultivators among
total workers has declined from 54.54 per cent in 1981 to 41.08 per cent in 1991, the

13
proportion of agricultural labourers has increased from 26.48 per cent in 1981 to 30.01 per
cent in 1991.
1.3.1 Land Use Plan Related to Agricultural Land In Gorakhpur district the average size of landholding was 0.58 hectare as per the
1995-96 agricultural census, 93.04 per cent holdings belonged to the small and marginal
farmers, while they accounted for only 64.54 per cent of total area under all landholdings.
The net sown area of the district as percentage of total reporting area hovered around
77 per cent after 1996-97.
But the analysis of block-wise net sown area shows that in most of the blocks the
proportion of net sown area had almost remained same and fluctuated within the range of two
to three per cent during the last twenty years, i.e. Since 1980-81, barring some exceptional
years.
The cropping intensity of the Gorakhpur district had almost remained constant around
150 since 1980-81.
The most important factor which has effected cropping intensity is irrigation.
The irrigation intensity i.e. net irrigated area as percentage of net sown area has
increased from 62.78 per cent in 1980-81 to 74.89 per cent in 1999-2K. This trend was
discernible in all the blocks of the district as well.
Furthermore, gross irrigated area as percentage of net irrigated area has increased
very slowly during the last twenty years from around 105 in 1980-81 to around 110 in 1999-2K
with fluctuating trends during intervening periods.
Tubewell is now the dominant source of irrigation in Gorakhpur district, and accounts
for more than 90 per cent of net irrigated area.
There is another aspect of analysis of sources of irrigation. Though tubewells have
become dominant source of irrigation, the role of public sources continues to be very
important. Because canals and government tubewells together account for more than 50 per
cent net irrigated area in most of the blocks. That means, public investment in irrigation will
continue to play an important role in increasing gross irrigated area, which in turn would help
in increasing the cropping intensity in these blocks.
The cropping pattern in the district has vastly changed during the last 30 years.
The main crops viz. paddy, wheat, potato and sugarcane have witnessed very large
increases in their productivity also during the period 1960-61 to 1998-99.
Thus farmers have shifted to crops, which are highly irrigated, fertilizer use is higher
on them and whose productivity is also comparatively very high.
1.3.2 Forest The forestland fluctuated around 8.75 to 8.5 per cent of total reporting area during the
period 1960-61 to 1989-90. Thereafter in the next four years i.e. during 1989-90 to 1993-94,
declined and fluctuated around 6.3 per cent. The area under forest further decreased to
around 1.72 per cent by 2000-01.

14
The area under forest dropped to nill after that and is presently only 1.72 per cent of
total reporting area. The area under forest could be brought to around 3 per cent of total
reporting area, if some part of the land under other fallow and some part of land under
culturable waste is brought under forest. This could be done by forming Joint Forest
Management Committees consisting of plant growers from poor peasantry class and
representatives of forest department and land use committee. A cell should be formed to
provide them the financial support and infra-structural support so that they could get suitable
plants, methods to protect them and finally marketing of forest produce.
Secondly, development of such forests should be linked with watershed management
in the area. For this purpose an area of 500 hectares to 1000 hectares should be choosen as
unit for micro-watershed management.
This would include (i) construction of water retention structures (ii) clearing and
desilting of natural courses of drainage systems and (iii) restoration/reconstruction of ponds/
tanks in totally barren lands or low lying lands.
Thirdly programmes like Pradhan Mantri Rojgar Yojana etc. should be now utilised for
construction of bundhis, management of wild resources including fisheries, drainage
maintenance and enhancement etc.
Fourthly, more emphasis will have to be laid on energy plantation which would
provide fuel wood besides growing of fruit trees rather than timber linked growth of forests.
1.3.3 Land Put to Non-agricultural Uses Area under land put to non-agricultural uses has been continuously increasing over
the past 40 years. It was around 7.7 per cent during 1960-61 and has risen to around 12.25
per cent by the year 2000-01.
The proportion of land put to non-agricultural uses is already very high in present
Gorakhpur district. During the last two decades, it had increased by 1.5 per cent of reporting
area per decade. With the forest area having become very small, increase of land put to non-
agricultural uses needs to be restricted severely. Failing which, it would not be possible to
convert land available under other uses to bring under plantation.
1.3.4 Barren and Unculturable Land Barren and uncultivable land in the district has increased from 0.52 per cent in 1960-
61 to 1.21 per cent of total reporting area in 2000-01. This trend needs to be reversed.
Barren and unculturable land can be used for further expansion of residential places,
playgrounds and construction of building for common uses such as school or panchayat
bhawan. It could also be used as Khalihan if it is nearby fields. And it could be used for
cremation ground or graveyard if it is far away from habitation.
Thus, barren and unculturable land could be shifted for use as land put to non-
agricultural purposes. Some part of it could also be used for developing as pasture and
grazing land.
We hope that through these measures, area under barren and unculturable land
could be reduced from 1.21 per cent to 0.5 per cent of reporting area in district Gorakhpur.
15
1.3.5 Culturable Waste This is a category showing non-enterprise. To our mind, there should be no such
category. If cultivation is not possible then it could be converted into area for social forestry or
developed as pasture and other grazing land.
Currently area under culturable waste is 1.03 per cent of total reporting area. A part of
it (say around 0.50 per cent) could be converted into social forestry and the rest i.e. around
0.53 per cent could be developed as pasture and other grazing land. At some places, such
land could also be used for fodder cultivation – specially those areas, which are owned by
private individuals.
Support should be provided for developing pasture land and growing fodder.
1.3.6 Land under Miscellaneous Trees, Crops, and Groves not included in Net Sown Area
Land use under this category had been the first victim of population growth and
conversion for other uses. Area under this category declined from 3.11 per cent of total
reporting area in 1960-61 to 0.45 per cent in 2000-01.
Land under this category could be increased by 1.0 per cent of total reporting area by
converting 1.0 per cent of total reporting area under other fallow for growing miscellaneous
trees and groves.
1.4 District - Azamgarh
The total area of Azamgarh district reduced from 5740.00 sq.km. in 1981 to 4234.00
sq.km. in 1991 due to carving out of new districts.
There had also been obvious changes in the number of residential houses and
number of households during the last 40 years.
The number of residential houses increased from 367128 in 1961 to 393898 in 1971,
which shows an increase of 7.29 per cent during the decade. The trend in the increase of
residential houses increased to 23.41 per cent during decades 1971-81 and 1981-91.
Thus the number of residential houses have been increasing at the rate of around 24 per cent or more per decade.
Azamgarh had been divided therefore true picture could only be inferred from
increase in urban area during 1971-81. The area under urban limits increased from 21.8
sq.km. in 1971 to 68.5 sq.km. in 1981. i.e. an increase of 214.22 per cent during two decade.
The share of urban population has increased from 5.21 per cent in 1971 to 7.16 per cent in
1991 and to 7.64 per cent in 2001.
The population pressure started to increase on agriculture since 1931. The decennial
growth rate of population had been very high during the last three decades.
It could also that whereas the proportion of agricultural labourers has marginally
increased during 1981-91, the proportion of workers in household industry and in other
services have declined during the same period.
1.4.1 Land Use Plan Related to Agricultural Land
16
In Azamgarh district the average size of landholding was 0.56 hectares as per the
1995-96 agricultural census and 95.18 per cent holdings belonged to the small and marginal
farmers, while they accounted for only 72.28 per cent of total area under all landholdings.
The net sown area as percentage of total reporting area varied around 75.0 per cent
till 1989-90, and thereafter declined to around 72.0 per cent during the decade 1990-91 to
1999-2K.
But the analysis of block-wise net sown area shows that in most of the blocks the
proportion of net sown area had been around or above 70.0 per cent during 2000-01 or during
some past years.
The cropping intensity of the Azamgarh district had almost consistently increased
since 1960-61, and has increased to 163.26 during the period 2000-01.
The most important factor which has affected cropping intensity is irrigation.
The irrigation intensity i.e. net irrigated area as percentage of net sown area has
increased from 50.38 per cent in 1960-61 to 88.33 per cent in 2000-01. This trend was
discernible in all the blocks of the district as well.
However, gross irrigated area as percentage of net irrigated area has increased
slowly during the last twenty five years from around 108.82 in 1980-81 to around 127.45 in
1999-2K which shows, it is still low.
Tubewells are now the major sources of irrigation in Azamgarh district, and account
for 80.0 per cent of net irrigated area.
The cropping pattern in the district has vastly changed during the last 30 years.
The main crops viz. paddy, wheat and sugarcane have witnessed large increases in
their productivity also during the period 1960-61 to 1998-99.
Thus farmers have shifted to crops, which are highly irrigated, fertilizer use is higher
on them and whose productivity is also comparatively very high.
1.4.2 Forest The forestland had been almost non-existent in the district. It has varied between
0.02 per cent to 0.04 per cent of total reporting area. There are scattered trees and bushes in
some areas. The source of hope is that there are a number of commonest trees in the district
which are all to be found singly or in clumps around the village sites or in the fields. Hence
micro forests could be developed in or around villages.
The area under micro forests could be increased, if some part of the land under other
fallow and some part of land under culturable waste is brought under forest. This could be
done by forming Joint Forest Management Committees consisting of plant growers from poor
peasantry class and representatives of forest department and land use committee. A cell
should be formed to provide them the financial support and infra-structural support so that
they could get suitable plants, methods to protect them and finally marketing of forest
produce.
17
Secondly, development of such forests should be linked with watershed management
in the area. For this purpose an area of 500 hectares to 1000 hectares should be choosen as
unit for micro-watershed management.
This would include (i) construction of water retention structures (ii) clearing and
desilting of natural courses of drainage systems and (iii) restoration/reconstruction of ponds/
tanks in totally barren lands or low lying lands.
Thirdly programmes like Pradhan Mantri Rojgar Yojana etc. should be now utilised for
construction of bundhis, management of wild resources including fisheries, drainage
maintenance and enhancement etc.
Fourthly, more emphasis will have to be laid on energy plantation which would
provide fuel wood besides growing of fruit trees rather than timber linked growth of forests.
1.4.3 Land Put to Non-agricultural Uses Area under land put to non-agricultural uses has been continuously increasing over
the past 40 years. It was around 9.0 per cent during 1960-61 and has risen to around 12.6 per
cent by the end of year 2000.
Land in this category has been steadily increasing. However, this increase is faster in
blocks where small markets have also grown over time. There were three blocks in the
district, where land under this category was found to be high. These are: Maharajganj (17.91
per cent) Harraiya (16.03 per cent) and Palhani (15.54 per cent).
1.4.4 Barren and Unculturable Land Area under barren and unculturable land has declined from 4.4 per cent in 1960-61 to
1.69 per cent in 2000-01. Barren and unculturable land could be used for further expansion of
residential places, playgrounds and construction of building for common uses such as school
or panchayat bhawan. It could also be used as Khalihan if it is nearby fields. And it could be
used for cremation ground or graveyard if it is far away from habitation.
Thus, barren and unculturable land could be shifted for use as land put to non-
agricultural purposes. Some part of it could also be used for developing as pasture and
grazing land.
We hope that through these measures, area under barren and unculturable land
could be reduced by 1.0 per cent of reporting area in district Azamgarh.
1.4.5 Culturable Waste Land This is a category showing non-enterprise. To our mind, there should be no such
category. If cultivation is not possible then it could be converted into area for social forestry or
developed as pasture and other grazing land.
Currently area under culturable waste is 1.45 per cent of total reporting area. A part of
it could be converted into social forestry and the rest could be developed as pasture and other
grazing land. At some places, such land could also be used for fodder cultivation – specially
those areas, which are owned by private individuals.
Support should be provided for developing pastureland and growing fodder.
18
1.4.6 Land under Miscellaneous Trees, Crops, and Groves not included in Net Sown Area
Land use under this category had changed little in the district.
Land under this category could be increased by 1.0 per cent of total reporting area by
converting 1.0 per cent of total reporting area under other fallow land for growing
miscellaneous trees and groves. We propose this because we feel that it would be difficult to
bring back all the other fallow land under cultivation.
1.5 District - Faizabad
The total area of Faizabad district reduced from 4511.00 sq.km., in 1981 to 2643.20
sq.km., in 1991 due to carving out of new district.
There had also been obvious changes in the number of residential houses and
number of households during the last 40 years.
The number of residential houses have been increasing at the rate of around 18 per cent or more per decade.
The area under urban limits have also been increasing. The area under urban limits
increased from 66.8 sq.km. in 1971 to 100.01 sq.km. in 1991. i.e. an increase of 49.72 per
cent during two decades.
The decennial growth rate had been very high during the last three decades. This has
resulted in the pressure of population on land.
The pressure on land in Faizabad has remained high because a sizable work-force
was found to be engaged in agriculture.
The large proportion of agricultural labourers shows that even wage employment in
secondary and tertiary sector was limited in the district. This is evident from the fact that
number of workers engaged in households industry was 1.96 per cent while those engaged in
other than households industry was 3.44 per cent. The number of workers engaged in trade
and commerce and other services was 3.44 per cent and 10.18 per cent.
1.5.1 Land Use Plan Related to Agricultural Land In Faizabad district the average size of landholding was 0.6 hectare as per the 1995-
96 agricultural census, 95.7 per cent holdings belonged to the small and marginal farmers,
while they accounted for only 76.0 per cent of total area under all landholdings.
The net sown area as percentage of total reporting area varied to around 67 to 71 per
cent during 1960-61 to 1998-99.
But the analysis of block-wise net sown area shows that in most of the blocks the
proportion of net sown area had almost remained same and fluctuated within the range of two
to three per cent during the last twenty years, i.e. since 1980-81.
The cropping intensity of the Faizabad district had almost consistently increased
since 1960-61 till around 1990-91, and has hovered around 160 after the period 1990-91.
The most important factor which has effected cropping intensity is irrigation.

19
The irrigation intensity i.e. net irrigated area as percentage of net sown area has
increased from 49.32 per cent in 1960-61 to 83.8 per cent in 1999-2K. This trend was
discernible in all the blocks of the district as well.
Furthermore, gross irrigated area as percentage of net irrigated area has also
increased during the last twenty five years from around 118.2 in 1980-81 to around 163 in
1998-99.
Tubewell is now the dominant source of irrigation in Faizabad district, and accounts
for more than 88 per cent of net irrigated area.
The cropping pattern in the district has vastly changed during the last 30 years.
The main crops viz. paddy, wheat, potato and sugarcane have witnessed very large
increases in their productivity also during the period 1960-61 to 1998-99.
Thus farmers have shifted to crops, which are highly irrigated, fertilizer use is higher
on them and whose productivity is also comparatively very high.
1.5.2 Forest The forest area in the district has been very small. It has been less than 1.0 per cent
during most of the years, barring the period 1988-89 to 1991-92.
The area under forest dropped to 0.28 per cent after that and started increasing after
1997-98. It was 1.43 per cent of total reporting area in 2000-01. The area under forest could
be brought to around 2.0 per cent to 2.5 per cent of total reporting area, if some part of the
land under culturable waste is brought under forest. This could be done by forming Joint
Forest Management Committees consisting of plant growers from poor peasantry class and
representatives of forest department and land use committee. A cell should be formed to
provide them the financial support and infra-structural support so that they could get suitable
plants, methods to protect them and finally marketing of forest produce.
Secondly, development of such forests should be linked with watershed management
in the area. For this purpose an area of 500 hectares to 1000 hectares should be choosen as
unit for micro-watershed management.
This would include (i) construction of water retention structures (ii) clearing and
desilting of natural courses of drainage systems and (iii) restoration/reconstruction of ponds/
tanks in totally barren lands or low lying lands.
Thirdly programmes like Pradhan Mantri Rojgar Yojana etc. should be now utilised for
construction of bundhis, management of wild resources including fisheries, drainage
maintenance and enhancement etc.
Fourthly, more emphasis will have to be laid on energy plantation which would
provide fuel wood besides growing of fruit trees rather than timber linked growth of forests.
1.5.3 Land Put to Non-agricultural Uses Area under land put to non-agricultural uses has been continuously but slowly
increasing over the past 40 years. It was around 11.5 per cent during 1960-61 and has risen
to around 13.25 per cent by the end of year 2000.

20
The proportion of land put to non-agricultural uses is already high in present
Faizabad district. Increase of land put to non-agricultural uses needs to be restricted severely.
Failing which, it would not be possible to convert land available under other uses to bring
under plantation.
1.5.4 Barren and Unculturable Land The area under barren and unculturable land was 2.54 per cent during 1960-61 and
declined to 1.98 per cent in 2000-01. Barren and unculturable land could be used for further
expansion of residential places, playgrounds and construction of building for common uses
such as school or panchayat bhawan. It could also be used as Khalihan if it is nearby fields.
And it could be used for cremation ground or graveyard if it is far away from habitation.
Thus, barren and unculturable land could be shifted for use as land put to non-
agricultural purposes. Some part of it could also be used for developing as pasture and
grazing land.
We hope that through these measures, area under barren and unculturable land
could be reduced from 1.98 per cent to 1.0 per cent of reporting area in district Faizabad.
1.5.5 Culturable Waste Area under this category of land had slowly and haltingly declined from 4.82 per cent
in 1960-61 to 1.64 per cent of total reporting area in 2000-01. This is a category showing non-
enterprise. To our mind, there should be no such category. If cultivation is not possible then it
could be converted into area for social forestry or developed as pasture and other grazing
land.
Currently area under culturable waste is 1.64 per cent of total reporting area. A part of
it (say around 1.0 per cent) could be converted into social forestry and the area which cannot
be converted into forest should be developed as pasture and other grazing land. At some
places, such land could also be used for fodder cultivation – specially those areas, which are
owned by private individuals.
Support should be provided for developing pasture land and growing fodder.
1.5.6 Land under Miscellaneous Trees, Crops, and Groves not included in Net Sown Area
Land use under this category had been the first victim of population growth and
conversion for other uses. It has reduced from 7.06 per cent of total reporting area in 1960-61
to 3.16 per cent in 2000-01.
Land under this category could be increased by 1.0 per cent to 2.0 per cent of total
reporting area by converting 1.0 per cent to 2.0 per cent of total reporting area under other
fallow for growing miscellaneous trees and groves.
1.6 District - Jhansi
The total area of Jhansi district reduced from 10069.00 sq.km. in 1971 to 5024.00
sq.km. in 1981 due to carving out of new district.
21
There had also been obvious changes in the number of residential houses and
number of households during the last 40 years.
The number of residential houses have been increasing at the rate of around 25 per
cent or more per decade. Though this is an obvious off shoot of increase in population, it will
have serious implication for land use planning during the coming decades. These implications
would have two aspects. One, more and more land would be brought under the category 'land
put to non-agricultural purposes'. Secondly, planning for housing in both urban and rural
areas will have to be given serious thought such as:
(i) how land saving devices could be adopted;
(ii) how civic amenities could be provided;
(iii) what kind of infra-structural facilities will be needed to be developed; and
(iv) what kind of common use facilities will be required to be developed.
The area under urban limits have also been increasing. Though Jhansi had been
divided, the area under urban limits increased from 91.5 sq.km. in 1961 to 131.4 sq.km. in
1991. i.e. an increase of 43.61 per cent during three decades.
The decennial growth rate of population had been very high during the last four
decades. This has resulted in the pressure of population on land.
The density of population of the district was only 285 persons per squire kilometre in
1991.
The pressure on land in Jhansi has not mitigated because a sizable work-force
continued to be engaged in agricultural sector.
The low proportion of agricultural labourers shows that wage-workers could get
employment either in secondary or in tertiary sector.
However in rural areas workers were predominantly engaged in agricultural activities
as cultivators and agricultural labourers constituted 65.29 per cent and 20.72 per cent
respectively. This trend was discernible in all the blocks of the district.
1.6.1 Land Use Plan Related to Agricultural Land In Jhansi district the average size of landholding was 1.74 hectares as per the 1995-
96 agricultural census, 73.9 per cent holdings belonged to the small and marginal farmers,
while they accounted for only 37.2 per cent of total area under all landholdings.
The net sown area as percentage of total reporting area has hovered around 62.0 per
cent since 1975-76.
But the analysis of block-wise net sown area shows that in most of the blocks the
proportion of net sown area had almost remained same and fluctuated within the range of two
to three per cent during the last twenty years, i.e. Since 1980-81, except few blocks.
The cropping intensity of the Jhansi district had increased little since 1960-61, and
has increased from 114 in 1980-81 to 119 in 2000-01.
The most important factor which has effected cropping intensity is irrigation. Cropping
intensity had been low because of low irrigation.
22
The irrigation intensity i.e. net irrigated area as percentage of net sown area has
increased from 24.68 per cent in 1975-76 to 56.1 per cent in 1999-2K. This trend was
discernible in all the blocks of the district as well.
But the gross irrigated area as percentage of net irrigated area has not increased
during the last twenty five years. It has been around or less than 103 during most of the
periods.
Canals and other wells have been the major source of irrigation in Jhansi district.
There is another aspect of analysis of sources of irrigation. The role of public sources
continues to be very important in increasing irrigation. Because canals and government
efforts for harvesting surface water are crucial. That means, public investment in irrigation will
continue to play an important role in increasing gross irrigated area, which in turn would help
in increasing the cropping intensity in these blocks.
The cropping pattern in the district has vastly changed during the last 30 years.
The main crops are now wheat, gram, peas, urd, masur and groundnut.
We need to make efforts to increase production of more pluses, oilseeds and spices.
Cropping rotation also needs to be changed. Following steps are imperative to achieve it.
(a) More thrust be given for developing high yielding varieties for these crops.
(b) Rain fed areas should be encouraged to cultivate these crops.
(c) Orchards, fallow land and land under social forestry could be used for growing such
crops.
(d) Processing industries of oilseeds and spices be promoted at local level with support
for technology up gradation, packaging and market access facilities.
Use of fertilizer had been increasing in all the blocks. But their balanced and
proportionate application has not been reported.
There is need to adopt following strategy to combat this menace:
(a) Circulate guidelines for each gram-panchayat-on the basis of soil-testing – the
proportion of fertilizer which is required to be applied.
(b) Farmers meeting be organised at village level before every cropping season to make
them aware about such guidelines.
(c) Farmers be also informed about hazardous impact of non-proportionate application of
urea.
(d) Government functionaries, specially at the gram-panchayat level be sensitised
regarding these aspects.
The extent of mechanisation has increased in the district. The number of tractors,
sowing machine, sprayers, threshing machine etc. have increased, while the number of Wood
Plough have decreased during the last 20 years.
The trend of increasing mechanisation despite the fact that average size of
landholdings has been decreasing indicates a new type of resource sharing in rural area.
Those who cannot afford to purchase the machine, hire its services. Be it irrigation water,
tractor, thresher or any other machine, their services are being hired by those who cannot

23
afford to purchase or maintain them. Very poor farmers do not keep draught animals and hire
services of new machines because they cannot afford to feed draught animals throughout the
year.
Tenancy and share cropping was found in our survey in selected villages of the
district. Thus sharing of land resource as well as services of machines indicates emergence
of a new type of land-labour-capital relations.
Livestock plays two types of roles in rural economy. One it provides draught animals
or for pulling carts. Secondly it generates income through animals products, which has
serious implications for diversification of rural economy.
But the size of livestock has also a serious bearing on land use. The increase in
livestock would mean that more land under pasture will be required, as well as more fodder
will be required.
Another fall-out of growing urbanisation and increase in extent of mechanisation has
been drastic decline in the number of livestock in Jhansi district. That number of all animals in
the district have declined excepting those of pig and poultry.
Agricultural Production System and Framework for Land Use Plan It was found that the majority of land owners who leased out their land belonged to
medium, small or marginal farmers. The fact that even small and marginal farmers were
leasing out their land, revealed two trends - one, in case of uneconomic holdings farmers
want to search other opportunities and will be content to get the market rent for their land yet
they would prefer to retain the land instead of selling it out right. Moreover, the new
generation, if educated seeks jobs in cities, and prefers to lease out the land. The other
aspect was in regard to changing relationship. The exploitative relationship between
tenant/share cropper and the land lord is fast changing. It is now purely an economic
arrangement of mutual interests. Small and marginal farmers also lease-out land to other
small and marginal farmers. Thus enterprising farmers are continuing agricultural activities by
pooling resources from fellow farmers, while some other farmers are trying to make efforts in
non-agricultural activities also.
Thus the new form of economic arrangement under tenancy was giving way to
emergence of new enterprising farmers who were seeking ways to pool resources for higher
productivity and application of new technology.
Dependency relationship based tenancy was declining because not many cultivators
wanted to be tied up for the whole of year with some small parcel of land which they did not
own, and further depend on the landlord for resources and credit. Landless or near landless
people also now want to keep options open for seeking job elsewhere as well. So they
preferred to work as casual agricultural labour during peak periods rather than working as an
attached labour or as a tenant.
On the other hand leasing-out by small farmers was on the increase because many
small farmers wanted to get job outside agriculture and at the same time wanted some
income from their land also. This was possible only by leasing-out land to fellow farmers at
24
mutually agreed terms. This kind of tenancy was free from both the dependency and
exploitative relationship.
Sharing of machines and equipments was also found to be widely prevalent among
farmers of this district. It was found that almost all farmers owning agricultural machines and
equipments hired out or shared their services with other farmers. Many agricultural tools were
also found to be shared among farmers on the exchange basis.
Factors Inhibiting Growth The immediate factors which inhibited growth among small and marginal farmers
were: lack of resources, capital deficiency and lack of facility to sell at remunerative prices.
The other factors included the problems of water logging, floods, drying of canals during
summer, etc.
Framework for Agricultural Growth Among small and marginal farmers, agricultural productivity is hampered by poor
logistical support and weak infrastructure. If food production is to be increased in a
sustainable way, these deficiencies must be corrected and favourable economic framework
for agriculture should be evolved. Such actions need to be backed up by practices aimed at
maintaining or enhancing fertility and productivity.
The first step is to protect the best land for agriculture. In view of the scarcity of high
quality arable land and the rising demand for food and other agricultural products, the land
that is most suitable for crops should be reserved for agriculture. Government should map
and monitor the more productive areas of farm land and adopt planning and zoning policies to
prevent the loss of prime land to urban settlements. Village Land Management Committee
and local authorities should be entrusted with responsibility to ensure that these policies are
implemented in their areas.
It was also found that the immediate factors which inhibited growth among small and
marginal farmers were lack of resources, capital deficiency and lack of facility to sell at
remunerative prices. The most important factor which could become basis for future
restructuring of agricultural production system related to tenancy. It was found the majority of
land owners who leased out their land (without entering into any written or formal contract)
belonged to the category of medium, small or marginal farmers. This was for two reasons –
one in case of uneconomic holdings, farmers wanted to search other opportunities and would
be content to get the market rent for their land. Yet they would prefer to retain the land instead
of selling it outright. The other aspect was in regard to non-exploitative nature of relationship
between the lessor and the lessess. It is now purely an economic arrangement in which small
and marginal farmers are also leasing out land to other small and marginal farmers. Thus
enterprising farmers are continuing agricultural activities by pooling resources from fellow
farmers, while some other farmers are seeking opportunities in non-agricultural activities also.
Thus the new form of economic arrangement was giving way to pooling of resources by
enterprising farmers, while other farmers who were leasing out their land were treating their
land as a share capital for which they will receive the rent as well as the share in profit. The
25
process of pooling of resources was further strengthened by a simultaneous process of
sharing of machines and equipments. it was found that almost all farmers owning agricultural
machines and equipments hired out or shared their services with other farmers.
It seems to us that a limited restructuring of the production process in agriculture can
be such that it serves the interests of small and marginal farmers and at the same time
protects wider interests of the farming community.
One major step in this direction would be to allow formation of Collective Farming
Society and Confederation of Farming Societies. In the collective farming society framework,
tenancy to such farming societies could be permitted under specified conditions. In particular
such societies may be formed of small and marginal farmers for a complete package of
inputs, and it may then be permissible for any member of such a society to lease out land to
the society or to any other member of the society.
At the next level, a confederation of such Collective Farming Societies could be
formed which will work as service societies. These confederations would provide high cost
machinery and equipments to Collective Farming Societies on rent. The idea essentially is
that it should be possible to increase number of viable farms by permitting some of the non-
viable farmers to go out of agricultural business and seek other jobs and economic
opportunities. This should on the one hand, improve productivity of labour on the expanded
farms and on the other aid in much needed shift of labour away from agriculture.
Collective Farming Society 1. Collective farming units be allowed to be registered under a separate Collective
Farming Society Registration Act.
2. Only small and marginal farmers be allowed to become members of such a society.
3. The number of members of a society should not be above twenty and below five.
4. Those who become members of such a collective farming society will be allowed to
lease out their land to the society for a minimum of ten years on a fixed annual rent.
5. A collective farming society will not bring under its purview more than ten hectares of
irrigated land.
6. A collective farming society will be allowed to pool its resources on hire or through
raising capital from its members. 7. The produce will be shared among members in proportion to the share amount of each member.
8. The share amount of each member will be the weighted sum of (a) money invested under capital raising scheme plus, (b) the amount fixed as annual rent for the land leased out to the society, (c) operational holdings of actual cultivators.
Confederation of Collective Farming Societies For storage facilities, providing transportation facilities and to work as marketing
syndicates of farming societies, a confederation of ten to twenty corporate farming societies
be allowed to be formed.
These confederations will work in the following areas:
1. Marketing of agricultural goods at national and international level.
26
2. Provide transportation and storage facilities to Collective Farming Societies against
such stored goods.
3. Function as cushions against speculative prices.
4. The confederation will also act as counselling centre for farmers projecting the
production and demands of each agricultural commodity for the next two years.
5. Provide high costing tools and machines to Collective Farming Societies for land
levelling, soil testing, land reclamation and other activities related to land and water
management on rental basis.
6. Help in technological innovations and in increasing productive efficiency.
District Level Analysis of Land Use Pattern and Land Use Plan (Other than Agricultural Land)
Our focus in preparing land use plan has been four fold –
(i) Agricultural land should not be transferred for use to other purposes.
(ii) Maximum area should not be brought under vegetative cover i.e.
(a) Increase forest
(b) Increase area under miscellaneous trees and groves.
(c) Increase area under pasture and grazing land.
(iii) Use culturable waste and other fallow land for such purposes. Therefore,
efforts should be made to convert land under these categories into forest,
orchards or grazing land.
(iv) Barren and unculturable land be used for constructing buildings or infra-
structural facilities.
1.6.2 Forest The forest land only marginally increased from around 6.43 per cent of total reporting
area in 1973-74 to around 6.74 per cent by 2000-01. Earlier the area under forest was around
10.0 per cent till 1972-73.
The area under forest could be brought to around 2 per cent of total reporting area, if
some part of the land under culturable waste is brought under forest. This could be done by
forming Joint Forest Management Committees consisting of plant growers from poor
peasantry class and representatives of forest department and land use committee. A cell
should be formed to provide them the financial support and infra-structural support so that
they could get suitable plants, methods to protect them and finally marketing of forest
produce.
Secondly, development of such forests should be linked with watershed management
in the area. For this purpose an area of 500 hectares to 1000 hectares should be choosen as
unit for micro-watershed management.
This would include (i) construction of water retention structures (ii) clearing and
desilting of natural courses of drainage systems and (iii) restoration/reconstruction of ponds/
tanks in totally barren lands or low lying lands.

27
Thirdly programmes like Pradhan Mantri Rojgar Yojana etc. should be now utilised for
construction of bundhis, management of wild resources including fisheries, drainage
maintenance and enhancement etc.
Fourthly, more emphasis will have to be laid on energy plantation which would
provide fuel wood besides growing of trees fruit trees rather than timber linked growth of
forests.
Private Micro Forests Private micro forest is different from orchards, as orchards generally comprise fruit
bearing plants. The concept of private micro forest envisages that private individuals could
also grow various varieties of plants. We have in the past found that eucalyptus had been
grown in private land because it was expected to fetch good amount. The private waste land
could also be used for growing timber, energy plants, etc. This could also be linked with
purification of surroundings. For this purpose plants related to different planets (Navgrah) and
different Nakshatra which are 27 in numbers could be planted as per specified arrangement.
Even plants with medicinal value could be grown in such land if people could be
informed about their medicinal and commercial value.
1.6.3 Land Put to Non-agricultural Uses Area under land put to non-agricultural uses has been slowly but continuously
increasing over the past 40 years. It was around 5.0 per cent during 1960-61 and has risen to
around 8.2 per cent by the end of year 2000.
The proportion of land put to non-agricultural uses is not very high in present Jhansi
district. But since barren and uncultivable land is also quite sizable need for further land for
non-agricultural uses could be met from this category of land. However, measures to keep
such land under limits must be taken in advance.
This could be made possible by adopting following steps.
(a) Discourage migration of people of villages nearby towns. This could be done by
increasing transport facility and by improving road networks.
(b) Strengthen household industries of rural areas by providing them institutional
support and market facilities.
(c) Develop green belt around city and any construction in the green belt area be
strictly prohibited.
One important aspect of land put to non-agricultural uses is increasing number of
residential houses. However, since population growth rate is faster, per person living area is
decreasing. Even more disturbing factor is that per person open area in houses premises is
also declining. This is the trend in even rural areas. Hence space for community uses and
common recreation places must be developed even in rural areas. In city planning we leave
space for parks, playgrounds and recreation spots. Such planning should also be done for
rural areas. Watershed management could then be linked with development of parks and
recreation places. Some area could also be reserved for floriculture and horticulture.
28
The rate of increase of area under the category of land put to non-agricultural uses
could then be restricted to around 10.0 per cent of total reporting area by the year 2010.
Regulation of Land Use at Urban Fringes There is need to regulate land use at urban fringes. This could be done by setting up
an Jhansi Urban Fringe Development Authority. The UFDA could decide on the following:
(i) Conservation of green areas such as orchards, agriculture, social forestry and allied
activities.
(ii) Development of water management and drainage system. Ponds and other water
retention structures be revived. Any encroachment on such land should be identified
and legal proceedings against encroachers be initiated.
(iii) The provisions made under Zamindari Abolition and Land Reforms Acts (specially
section 143 and 154) and Consolidation of Holdings Act be used effectively to check
diversion of agricultural land for non-agricultural purposes.
(iv) Heavy fine should be imposed (say ten times the cost of the land) in case of such
diversion on the owner of the land.
(v) In addition to it, if the agricultural land had been sold then capital gain tax should be
imposed on purchaser of the land. Because huge capital gain accrues to the builders
who develop colonies in such land.
(vi) The first priority be given to development of social services in the fringe area which
will include hospitals, educational centres, training centres for farmers and agro-
based industries.
(vii) Barren and uncultivable land should be identified for development of micro-industrial
estates and then for developing multistoried residential complexes which are land
saving as well.
Besides urban fringes, there is need to restrict the rate of increase of area under land
put to non-agricultural uses, in rural areas in general.
This could be made possible by adopting following steps.
(a) Discourage migration of people of nearby villages. This could be done by
increasing transport facility and by improving road networks.
(b) Strengthen household industries of rural areas by providing them institutional
support and market facilities.
(c) Develop green belt around city and any construction in the green belt area be
strictly prohibited.
(d) Encourage multi-storey buildings and economic flats to weaker sections.
One important aspect of land put to non-agricultural uses is increasing number of
residential houses. However, since population growth rate is faster, per person living area is
decreasing. Even more disturbing factor is that per person open area in house premises is
also declining. This is the trend in even rural areas. Hence space for community uses and
common recreation places must be developed even in rural areas. In city planning we leave
space for parks, playgrounds and recreation spots. Such planning should also be done for
29
rural areas. Watershed management could then be linked with development of parks and
recreation places. Some area could also be reserved for floriculture and horticulture.
Regulation of Land Use along Road Side There has been a tendency to change land use along road side – specially national
highways and state highways. Houses and shops are constructed or such land is put to even
other non-agricultural uses. As a result of this contiguous effect leads to further expansion of
settlements near highways and such places become accident prone. Therefore, there is need
to regulate land use along roadside. Following measures could be adopted in this respect:
(i) A green strip be developed on both sides of road. Such green strip on each side
should not be less than 10 meter wide.
(ii) Wherever, highways are connected with other roads, construction along side even
such connecting roads be prohibited for a length of at least one kilometer.
(iii) Those who construct houses or buildings on agricultural lands along side road should
be fined heavily (say ten times the cost of the land).
The rate of increase of area under the category of land put to non-agricultural uses
could then be restricted to around 13.5 per cent of total reporting area by the year 2010.
1.6.4 Barren and Unculturable Land Barren and unculturable land be used for further expansion of residential places,
playgrounds and construction of building for common uses such as school or panchayat
bhawan. It could also be used as Khalihan if it is nearby fields. And it could be used for
cremation ground or graveyard if it is far away from habitation.
Thus, barren and unculturable land could be shifted for use as land put to non-
agricultural purposes. Some part of it could also be used for developing as pasture and
grazing land.
We hope that through these measures, area under barren and unculturable land
could be reduced from 2.11 per cent to 1.0 per cent of reporting area in district Jhansi.
1.6.5 Culturable Waste This is a category showing non-enterprise. To our mind, there should be no such
category. If cultivation is not possible then it could be converted into area for social forestry or
developed as pasture and other grazing land.
Currently area under culturable waste is 1.65 per cent of total reporting area. A part of
it (say around 0.65 per cent) could be converted into social forestry and the rest i.e. around
1.0 per cent could be developed as pasture and other grazing land. At some places, such
land could also be used for fodder cultivation – specially those areas, which are owned by
private individuals.
Support should be provided for developing pasture land and growing fodder.
Culturable Waste along River Side Jhansi had two major rivers and many tributories flowing through it. The patches of
land along side these rivers are undulating and at some places with high mounds. These

30
areas could be developed as reserved forest strips with one to two kilometers' width. Plant
varieties which suit the local soils could be grown in these reserved forest strips.
Development of these reserved forest strips should also be linked with river water
pollution control systems. It means that water which goes through drainage courses and
which meets these rivers should be treated before it reaches the river. The management of
reserved strip forest should be entrusted with the responsibility to operate the treatment
plants.
Besides reserved forest strips, parks and picnic spots could be developed at various
points along the river route. Such parks/picnic spots could become centres of sight seeing
and attraction for tourists as well.
1.6.5 Land under Miscellaneous Trees, Crops, and Groves not included in Net Sown Area
Land use under this category had been the first victim of population growth and
conversion for other uses.
Land under this category could be increased by 1.0 per cent of total reporting area by
converting 1.0 per cent of total reporting area under other fallow for growing miscellaneous
trees and groves.
Reduction of such area increases run off of rain water. Such areas are best suited for
agro-forestry. The main types of agro-forestry system are:
(a) alley cropping – where annual crops are grown between lines of trees that
produce valuable mulching material.
(b) orchard systems – where the trees provide edible fruits, medicines and fuel wood,
while the ground layer is cropped or grazed.
(c) growth of scattered trees with pasture at the ground or grazing land.
(d) Conserve genetic resources
♦ Support grassroots associations of farmers and gardeners for the maintenance of traditional and local cultivars and breeds. Involve women's groups, Record farmers knowledge of traditional and local cultivars and breeds,
♦ Develop a common information service for exchange in information and germplasm among grassroots, state and national agencies.
31
Some General Suggestions District Level (i) District Land Use Committee should be strengthened. The Committee must meet at
least once in a year and take stock of changes which have occurred during past one
year. It should also be informed about up-dating of records and changes which have
taken place during the year.
(ii) As regards its constitution, it should also include District Panchayat Adyaksha, BDOs
and some more representatives of farmers.
(iii) Each line department and BDO should be asked to furnish informations in a pre-
structured proforma.
(iv) The annual proceedings be documented and action plans drawn in the meeting be
circulated to all concerned departments and functionaries.
Block Level (i) Need for Block Level Land Use Committee (BLUC)
There is Land Use Committee at district level. There are Land Management
Committees at the village level. But there are no land use committees at the block
level.
Land records were maintained with a view to fix land revenue by the revenue
department. There had been no systematic effort to maintain land records to identify
land use categories on the basis of their potential development and quality.
The development perspective requires that unit for land use planning be made at
block level. Because at district level it remains too generalised, while at village level, it
would create operational problems in coordinating various line departments who have
bearing on the land use. Therefore, there is need to create a planning cum
implementing agency at the block level.
The Block level Land Use Committee may be formed with following as their members:
Block Pramukh - President
B.D.O. - Convenor
A.D.O. (Stat.) - Secretary
Other Members will include representatives from concerned line departments and
some specialists, and
Three B.D.C. Members (to be selected by Kshetra Panchayat Members)
Block level Land Use Committee may take up the following issues for planning and
implementation in the block:
(ii) Salinity and Alkalinity
The problem of alkalinity arises when infiltration rate of water in soil is low. This
results in higher run off of surface water and creates problems of water logging in
adjoining areas. As the water gets muddy, it also creates pollution of water streams.
Reclamation of such land will have multiple effect. Such as increase in the infiltration

32
rate, increase in recharge of ground water, reduction in water logging and control on
water polluation.
Following steps should be encouraged for reclamation of such land:
(a) Construction of field bunds – through boundary mounds,
(b) Levelling of fields,
(c) Use of gypsum/pyrites, depending upon the degree of alkalinity,
(d) Rotation of crops.
Group of farmers be formed for their collective action. Then such groups could be
provided financial, technical and infra-structural support for reclamation of alkaline
land.
(iii) Water Managment Reforms are needed to facilitate water management systems for various reasons:
(a) rain and surface water needs to be preserved instead of being allowed to go
waste via drain courses;
(b) natural drain courses should not be allowed to be obstructed otherwise it leads to
avoidable water-logging
Increase in the number of private tubewells results in the lowering of level of ground
water, therefore water management should include recharging by using rain/surface
water.
By reducing run off we can check removal of top fertile soil on the one hand and
maintain infiltration on the other. the catchment area of each water route should be
mapped out and the programme to manage rain water should start from the highest
land and end at the drainage basin.
Water harvesting will involve shaping farm land and sometimes also the catchment
area of water course to slow the flow of water and thereby increase infiltration into
soil. There are several cheap ways to make contours, if this is taken up collectively.
The sloppy areas and those along the drainage or field boundary which otherwise are
not suitable for agriculture needs conservation efforts with optimum plant productivity.
The strip plantations of multipurpose trees or shelter belts for crop lands will provide
wood/leaf fodder and also ameliorate environment.
Water reservoir tanks/ponds/bundhis be constructed at places where main drain
routes meet. Such land should be mapped and brought under community/panchayat
ownership. No other construction be allowed to take place on such land through
suitable modification in laws.
Drain network-allowing disposal of waste household water as well as community
water using posts should be linked with natural drainage (by gravity flow) courses.
Thus there should be micro drains (for disposal of household waste water), which will
have to be connected to a community drain and finally the entire waste water has to
be drained to other reservoir sites after proper treatment.

33
Area along the drainage route should be allowed for fodder cultivation and if possible
for farm forestry. Fodder cultivation and farm forestry needs to be developed in
chronically water-logged areas. To facilitate this, land along drain routes and water-
logged land be kept outside the purview of tenancy provisions. Secondly, land owners
of such land be permitted to form fodder or farm forest production units and lease out
their land to such collective production units.
(iv) Protection of Communal Land Common resource property has been one of the most important source of
sustenance of livelihood of less privileged communities in many backward and
remote areas.
A support system for maintenance and quality improvement in land use is needed to
protect grazing land, land under trees, bushes etc. as well as protection of land for
chak road and drainage system is also necessary. Through detailed mapping of each
village, community management and these (water recharging, drainage, trees) etc.
should be brought under communal ownership which should become non
transferable and any activity that leads to their destruction should become unlawful.
The role of common resource property and its allocation systems becomes crucial in
management of these natural resources. It must be emphasized that management of
such resources be vested with the local communities who will take a longer view.
Outside commercial interest will come and go with narrow economic interest only.
Effective communal property rights and resource management systems could be
developed by empowering panchayats to develop modes of their use in their
respective panchayats and by providing them technical and managerial skill as well
as the needed capital resources.
(v) Culturable Waste Lands and Fallow Land Culturable waste land could be brought under vegetative cover by providing
necessary institutional and infra-structural support.
We suggest following measures to facilitate their proper use.
(a) Identification of Records: Presently such lands are identified and delineated
through revenue records. Block Level Land Use Committee (BLUC) be entrusted
with the responsibility to identify and delineate such land in each block. Land
Management Committees of each Gram Panchayat should be involved in the
process.
(b) Preparation of Land Use Maps: Land use maps for all the villages be prepared
by the proposed BLUC.
(c) Put Such Land outside the Purview of Tenancy Clause: These types of land
require huge investment and long waitings for their reclamation. If they remain
within the purview of Tenancy Clause, it would be difficult for farmers to pool such
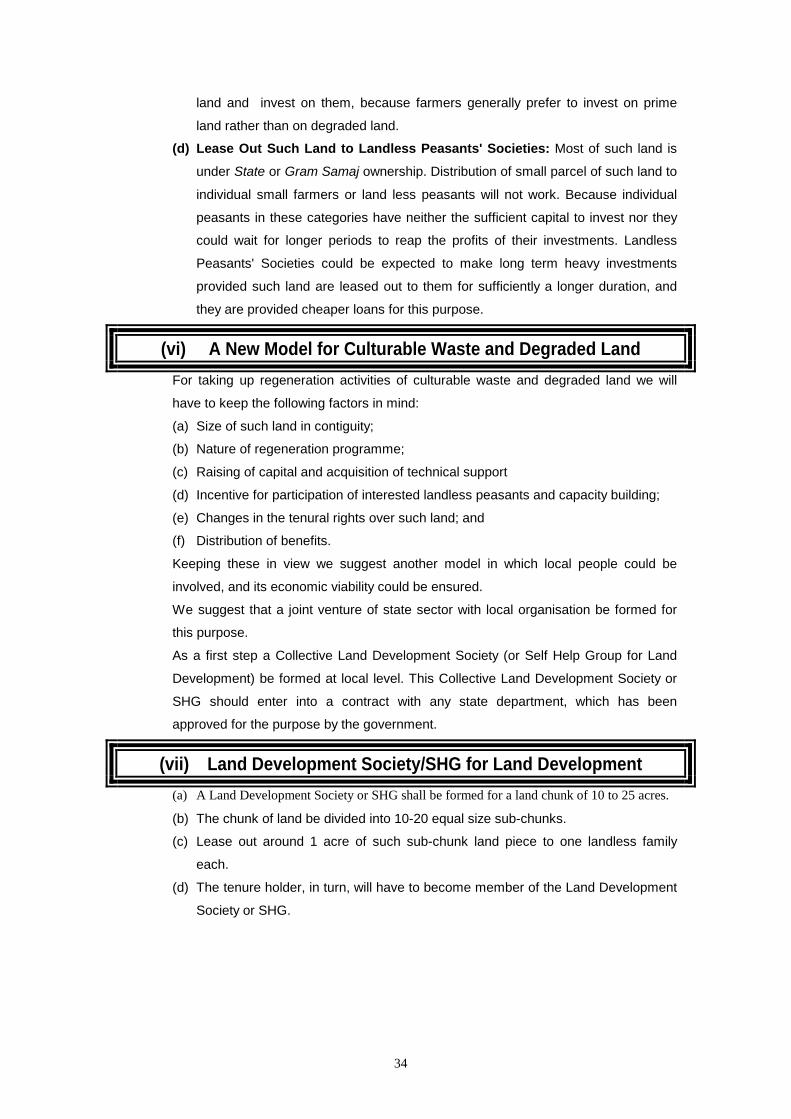
34
land and invest on them, because farmers generally prefer to invest on prime
land rather than on degraded land.
(d) Lease Out Such Land to Landless Peasants' Societies: Most of such land is
under State or Gram Samaj ownership. Distribution of small parcel of such land to
individual small farmers or land less peasants will not work. Because individual
peasants in these categories have neither the sufficient capital to invest nor they
could wait for longer periods to reap the profits of their investments. Landless
Peasants' Societies could be expected to make long term heavy investments
provided such land are leased out to them for sufficiently a longer duration, and
they are provided cheaper loans for this purpose.
(vi) A New Model for Culturable Waste and Degraded Land For taking up regeneration activities of culturable waste and degraded land we will
have to keep the following factors in mind:
(a) Size of such land in contiguity;
(b) Nature of regeneration programme;
(c) Raising of capital and acquisition of technical support
(d) Incentive for participation of interested landless peasants and capacity building;
(e) Changes in the tenural rights over such land; and
(f) Distribution of benefits.
Keeping these in view we suggest another model in which local people could be
involved, and its economic viability could be ensured.
We suggest that a joint venture of state sector with local organisation be formed for
this purpose.
As a first step a Collective Land Development Society (or Self Help Group for Land
Development) be formed at local level. This Collective Land Development Society or
SHG should enter into a contract with any state department, which has been
approved for the purpose by the government.
(vii) Land Development Society/SHG for Land Development (a) A Land Development Society or SHG shall be formed for a land chunk of 10 to 25 acres.
(b) The chunk of land be divided into 10-20 equal size sub-chunks.
(c) Lease out around 1 acre of such sub-chunk land piece to one landless family
each.
(d) The tenure holder, in turn, will have to become member of the Land Development
Society or SHG.

35
(viii) Joint Venture A Public Corporate Organisation (approved by the government for the purpose) will
then enter into an agreement with Land Development Society or SHG for a minimum
of ten years for jointly developing the land and for its utilization.
(a) Members of Land Development Society or SHG would provide land and labour;
(b) Public Corporate Organisation will provide capital, technology and technical
know-how;
(c) A joint management system will be evolved;
(d) One-third of the profit shall be ploughed back for further raising the capital stock
of the joint venture.
(e) The rest of the profit shall be shared on 50:50 basis between the state unit and
Land Development Society.
Village Level (i) The land use plan is almost finalized after consolidation of holdings is implemented in
a village. It provides land for various purposes in the village besides consolidating
holdings. These include -
(a) provision of roads and public irrigation channels,
(b) provision of land for house sites for scheduled castes and other weaker sections,
(c) provision of sector roads, inter village roads and link roads,
(d) provision of land for community purposes namely – schools, playgrounds,
panchayat ghar, hospital, cremation ground, graveyards, threshing floor, manure
pits, pasture land, plantation trees, flaying sites etc.
(e) solving of common disputes in the village regarding roads/naalis for irrigation for
each field through chak roads and chak naalis.
The problem is that powerful persons in the village influence functionaries of the
consolidation work and get some of government and community land located near
their farms. And once consolidation work is over, they easily encroach upon such
community land.
Therefore effort should be made that Bachat and Gram Sabha land is not left
scattered at many places. The consolidation process should also consolidate
government and gram sabha land in one or two large consolidated chaks.
The land which had been carved out as orchard, grazing land or pond/tank in the
past, should not be allowed to be transferred for other purposes by new rounds of
consolidation –neither through chak carvation nor through readjustment of gram
sabha land.
(ii) Whenever chakbandi is declared, illegal felling of trees takes place, land under
orchards or pasture or such other uses is sought to be shown as land under
cultivation. This happens on a large scale specially on Gaon Sabha and government
land. In order to check such changes in land use on the eve of consolidation, revenue

36
officials and consolidation officials should jointly prepare reports and send report to
concerned courts for quick action. The power to decide such cases should be
assigned to concerned SDM.
Similarly provisions of Consolidation of Holdings Act and Manual regarding provision
of inter-village link road, bachat land, Gaon Sabha and Government land and other
common property resources should be widely made known to people so that its strict
implementation is done with peoples participation.
(iii) After consolidation is over land use for each plot of the villages is well defined.
It should be the responsibility of LMC to see that land use is not alterned. There
should be training of LMC members to make them aware of their roles and
responsibilities.
(iv) Land Management Committee should be treated as Chakbandi Committee during the
period of consolidation. Formation of separate committee does not prove helpful as it
is at the mercy of consolidation department and Pradhan only and ceases to exist
after consolidation work is over.
(v) All members of Chakbandi Committee should sign the final land use map prepared
after consolidation work is over.
(vi) The map of the village should be made available to all the members of Land
Management Committee, free of cost.
(vii) Encroachers of government and/or gram sabha land should be severely penalised
and eviction proceedings against them should be made more stringent.
(viii) Land capability maps be prepared for each village. The land use of each type of land
could then be planned for effective, efficient, sustainable and profitable use.
The land capability map will indicate about the texture and quality of soil. It will also
give information about limitations of the land such as erosion, water logging, degree
of alkalinity or salinity etc.
Thus land capability maps would provide necessary inputs for land use planning i.e.
suitability of land for agriculture, horticulture, forestry etc. It will also indicate as to
what measures would be needed for improving land for its optimum utilisation.
(ix) The Land Management Committee at the village level be revamped. And there should
be fair representation of weaker sections, beneficiaries of land allottees, self help
groups and all the hamlets/communities of the village.
The committee should meet once every six months, develop plans for water
conservation, drainage channels, regeneration of degraded land, effective use of
lands in the category of (a) barren and uncultivable land, (b) pastures, (c) orchards
groves and land under trees and (d) fallow land.
(x) There are already legal provisions under consolidation of Holdings Act and Supreme
Court Judgements in regard to protection of land uses. These should be widely
circulated among members of Land Management Committee. Proceedings for
eviction of encroachers should be launched in right earnest. The provision should be
37
made in law for eviction of unauthorised occupation of Gram Sabha land by summary
proceedings.
(xi) The gaon sabha land or pond or forest land should be given on lease to self help
groups or tree growers society or such other collective groups rather than to
individuals.
Proposal for New Format to Collect Land Use Data
Land Use data is collected by the revenue department on Form P-4 (Hkwys[k çi= la[;k
i&4) as laid down under clause 108 of Land Records Manual. The data on land use is collected by
Lekhpal and is known as Milan Khasara. Revenue village wise land use data is collected under 87
heads in Milan Khasara for each Fasli Year (Annexure-A).
The land use data should be collected in such a format, which could help in planning. There
are three major stakeholders in development of land. These are (i) government/government department;
(ii) Gram Sabha; and (iii) Private owners.
We propose format of land categories, which will help only planning in respect of categories,
but also it will enable us to identify stakeholders through whom such planning could be operationalsed.
The categories are as follows:
Proposed Classification of Land Use Categories 1. Uncultivable Land
This category can be divided into three sub-categories:
1.1 Water Bodies (Column 3)
1.2 Land Put to other uses (Column 4 & 5)
1.3 Waste Land (Column 6 & 7)
2. Area Under Forest
Area under forest can also be divided into following sub-categories.
2.1 All land under forest department (Column 10)
2.2 Timber forest under Gram Sabha (Column 11)
2.3 Timber forest under Private Land (Column 12)

38
3. Area under Miscellaneous Trees/Bushes etc.
Such Area can also be divided into following two sub-categories:
3.1 Under Gram Sabha (Column 13)
3.2 Under Private Ownership (Column 14).
4. Pastures and Other Grazing Land (Column 15)
5. Culturable Waste (Column 17)
6. Old Fallow (Column 19)
7. New Fallow (Column 20, 21, 22, & 23)
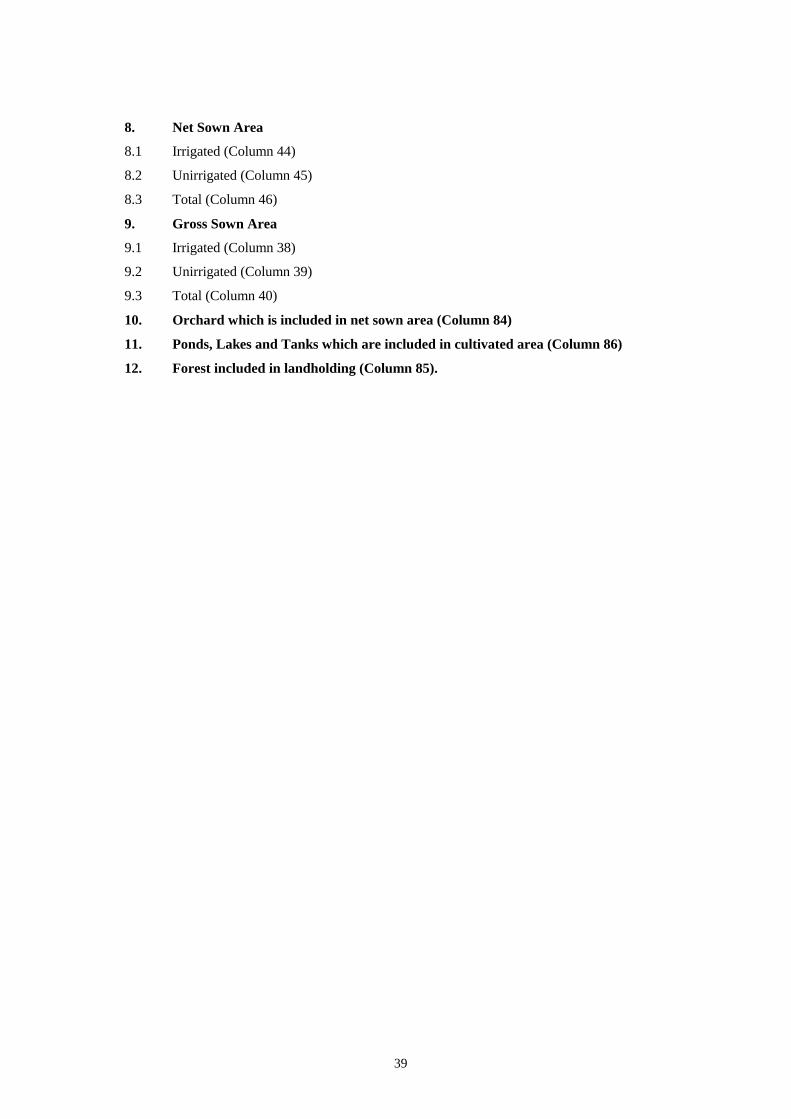
39
8. Net Sown Area
8.1 Irrigated (Column 44)
8.2 Unirrigated (Column 45)
8.3 Total (Column 46)
9. Gross Sown Area
9.1 Irrigated (Column 38)
9.2 Unirrigated (Column 39)
9.3 Total (Column 40)
10. Orchard which is included in net sown area (Column 84)
11. Ponds, Lakes and Tanks which are included in cultivated area (Column 86)
12. Forest included in landholding (Column 85).
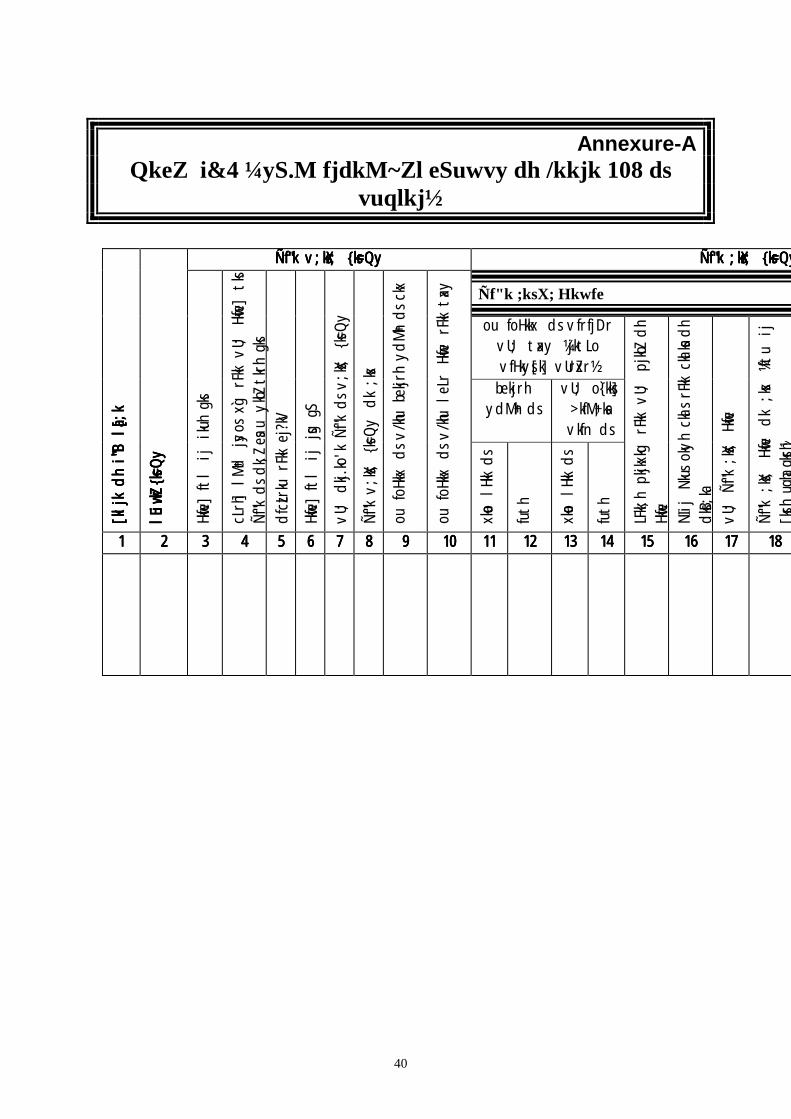
40
Annexure-A QkeZ i&4 ¼yS.M fjdkM~Zl eSuwvy dh /kkjk 108 ds
vuqlkj½
Ñf"k v;ksX; {ks=QyÑf"k v;ksX; {ks=QyÑf"k v;ksX; {ks=QyÑf"k v;ksX; {ks=Qy Ñf"k ;ksX; {ks=QyÑf"k ;ksX; {ks=QyÑf"k ;ksX; {ks=QyÑf"k ;ksX; {ks=Qy
Ñf"k ;ksX; Hkwfe
ou foHkkx ds vfrfjDr vU; taxy ¼jktLo vfHkys[k] vUrZxr½ bekjrh
ydM+h ds vU; o`{kks] >kfM+;ksa vkfn ds
[kljk dh i"̀B l
[kljk dh i"̀B l
[kljk dh i"̀B l
[kljk dh i"̀B la[;k
a[;k
a[;k
a[;k
lEiw.kZ {ks=Qy
lEiw.kZ {ks=Qy
lEiw.kZ {ks=Qy
lEiw.kZ {ks=Qy
Hkwfe] ftl ij ikuh gks
cLrh] lM+d
jsyos
x`g rFkk vU; Hkwfe] tks
Ñf"k ds
dk;Z esa u ykbZ tkrh gks
dfczLrku rFkk ej?kV
Hkwfe] ftl ij jsg gS
vU; dkj.ko'k
Ñf"k ds
v;ksX; {ks=Qy
Ñf"k v;ksX; {ks=Qy
dk ;ksx
ou foHkkx d
s v/khu bekjrh yd
M+h d
s ckx
ou foHkkx d
s v/khu leLr Hkwfe rFkk taxy
xkao lHkk ds
futh
xkao lHkk ds
futh
LFkk;h pkjkxkg
rFkk vU;
pjkbZ
dh
Hkwfe
NIij Nkus
okyh ckals rFkk ckalksa dh
dksB;ka
vU; Ñf"k ;ksX; Hkwfe
Ñf"k
;ksX; Hkwfe
dk ;ksx
¼ftu ij
[ksrh
ughagksrh½
1111 2222 3333 4444 5555 6666 7777 8888 9999 10101010 11111111 12121212 13131313 14141414 15151515 16161616 17171717 18181818
41
Ñf"k fd;k x;k {ks=Qy
flapk gqvk {ks=
nks Qlyh {ks=Qnks Qlyh {ks=Qnks Qlyh {ks=Qnks Qlyh {ks=Q
ugjks ls vU; dwiksa ls ljdkjh futh
V~;wccsy ls ljdkjh futh
rksM+
Mky
rksM+
Mky
ljdkjh
futh
iDdk
dPpk
iDdk
dPpk
lkxjksa ls
rkyksa] >hyksa] iks[kjksa ls
vU; lk/kuksa ls
flaps gq;s {ks=Qy
dk ;ksx
vuflapk {ks=Qy
Ñf"k fd;s gq;s {ks=Qy
dk ;ksx
flafpr
vflafpr
;ksx
25252525 26262626 27272727 28282828 29292929 30303030 31313131 32323232 33333333 34343434 35353535 36363636 37373737 38383838 39393939 40404040 41414141 42424242 4444
42
uydwiksa dh la[;kuydwiksa dh la[;kuydwiksa dh la[;kuydwiksa dh la[;k mu uydwmu uydwmu uydwmu uydwiksa dh la[;k tks o"kZ ds Hkhrj flapkbZ ds dke esa yk;s x;siksa dh la[;k tks o"kZ ds Hkhrj flapkbZ ds dke esa yk;s x;siksa dh la[;k tks o"kZ ds Hkhrj flapkbZ ds dke esa yk;s x;siksa dh la[;k tks o"kZ ds Hkhrj flapkbZ ds dke esa yk;s x;s
ljdkjh futh ;ksx ugj ugj dh flapkbZ ds {ks=
dks lg;ksx u nsus okys
ugj ugj dh flapkbZ ds {ks= dks lg;ksx nsus
okys futh
ugj ugj dh flapkbZ ds {ks= dks lg;ksx u nsus okys
ugj ugj dh flapkbZ ds {ks= dks lg;ksx nsus okys
ugj ugj dh flapkbZ ds {ks= dks lg;ksx u nsus okys
ugj ugj dh flapkbZ ds {ks= dks lg;ksx nsus okys
ugj ugj dh flapkbZ ds {ks= dks lg;ksx u nsus okys
ugj ugj dh flapkbZ ds {ks= dks lg;ksx nsus okys
jktdh;
fo|qr pfyr
Mh
typf
yrjktdh;
fo|qr pfyr
Mh
typf
yriDds
dPps
iDds
dPps
iDds
dPps
iDds
dPps
iDds
dPps
iDds
dPps
47474747 48484848 49494949 50505050 51515151 52525252 53535353 54545454 55555555 56565656 57575757 58585858 59595959 60606060 61616161 62626262 63636363 64646464

43
rkyksa] >hyksa o rkyksa] >hyksa o rkyksa] >hyksa o rkyksa] >hyksa o iks[kjksa dh la[;kiks[kjksa dh la[;kiks[kjksa dh la[;kiks[kjksa dh la[;k
mu uydwiksa rFkk iDds mu uydwiksa rFkk iDds mu uydwiksa rFkk iDds mu uydwiksa rFkk iDds dqvksa dh la[;k ftuldqvksa dh la[;k ftuldqvksa dh la[;k ftuldqvksa dh la[;k ftuls s s s o"kZ ds Hkhrj flapkbZ o"kZ ds Hkhrj flapkbZ o"kZ ds Hkhrj flapkbZ o"kZ ds Hkhrj flapkbZ
ugha gqbZugha gqbZugha gqbZugha gqbZ
mu uydwiksa rFkk iDds mu uydwiksa rFkk iDds mu uydwiksa rFkk iDds mu uydwiksa rFkk iDds dqvksa dh la[;k tks o"kZ dqvksa dh la[;k tks o"kZ dqvksa dh la[;k tks o"kZ dqvksa dh la[;k tks o"kZ ds Hkhrj dsoy ikuh ds Hkhrj dsoy ikuh ds Hkhrj dsoy ikuh ds Hkhrj dsoy ikuh ihus ds dke esa yk;s ihus ds dke esa yk;s ihus ds dke esa yk;s ihus ds dke esa yk;s
x;sx;sx;sx;s
o"kZ esa u"V ;k csdkj o"kZ esa u"V ;k csdkj o"kZ esa u"V ;k csdkj o"kZ esa u"V ;k csdkj gks tkus okys uydwiksa gks tkus okys uydwiksa gks tkus okys uydwiksa gks tkus okys uydwiksa rFkk iDds dqvksa dh rFkk iDds dqvksa dh rFkk iDds dqvksa dh rFkk iDds dqvksa dh
la[;kla[;kla[;kla[;k
o"kZ eo"kZ eo"kZ eo"kZ esa fufeZr uysa fufeZr uysa fufeZr uysa fufeZr uyrFkk iDds dqvksarFkk iDds dqvksa rFkk iDds dqvksarFkk iDds dqvksa
la[;kla[;kla[;kla[;k
uydwi iDds dq;sa uydwi iDds dq;sa uydwi iDds dq;sa uydwi iDds
ljdkjh
futh
ljdkjh
futh
ljdkjh
futh
ljdkjh
futh
lkxj
ksa
dh la
[;k
tks 100 ,dM
+ ;k vf/kd Hkwfe lhap
ldrs gSa
tks 100
,dM+
ls de Hkwfe
lhap
ldrs gSa
ljdkjh
futh
ljdkjh
futh
ljdkjh
futh
ljdkjh
65656565 66666666 67676767 68686868 69696969 70707070 71717171 72727272 73737373 74747474 75757575 76767676 77777777 78787878 79797979 80808080 81818181 82828282