model predictive control of electromagnetic torque in ... predictive control of electromagnetic...
TRANSCRIPT

MODEL PREDICTIVE CONTROL OF ELECTROMAGNETIC TORQUE IN
PERMANENT MAGNET SYNCHRONOUS MACHINES
by
Tianshi WANG, B.Eng. (Elec.)
Submitted for the Degree of Master of Engineering
at
University of Technology, Sydney
2013

i
CERTIFICATE OF AUTHORSHIP/ORIGINALITY
I certify that the work in this thesis has not previously been submitted for a degree nor
has it been submitted as part of requirements for a degree except as fully acknowledged
within the text.
I also certify that the thesis has been written by me. Any help that I have received in my
research work and the preparation of the thesis itself has been acknowledged. In
addition, I certify that all information sources and literature used are indicated in the
thesis.
Signature of Student

ii
ACKNOWLEDGEMENTS
This work was carried out at the Centre for Electrical Machines and Power Electronics
(CEMPE), School of Electrical, Mechanical & Mechatronic Systems, Faculty of
Engineering and Information Technology, University of Technology, Sydney.
I wish to express my sincerest appreciation to my supervisor, Prof. Jianguo Zhu,
Director of CEMPE and Head of School, for his invaluable expert technical guidance
and advice throughout my study and research. Great gratitude goes to my previous
supervisor Prof. Dianguo Xu for his guidance and recommendation.
I also wish to express my deep appreciation to Dr. Yongchang Zhang for his expert
advice. Great gratitude also goes to Dr. Youguang Guo for his suggestion and kind help.
Special gratitude goes to Dr. Greg Hunter and Mr. Jiang Chen for their technical
support.
Acknowledgments go to Dr. Jack Lin and A/Prof. Hong Guang for his kind support
when I met difficulties in my personal life and Dr. Yi Wang, Dr. Wei Xu and Dr. Gang
Lei for their suggestions and comments. I would like to thank all my colleagues and
friends, including, Prof. Qingfang Teng, Dr. Helen Lu, Dr. Yongjian Li, Dr. Jianbin
Zeng, Mr. Jiefeng Hu, Mr. Md Rabiul Islam, Mr. Dung Pham, Mr. Yiying Wei, Mr.
Yanqing Qu and Mr. Sonki Prasetya.
Finally, I would like to express my deepest gratitude to my wife Shuyang Liu, my father
Yanqing Wang and my mother Xiaoyun Jiang for their love and financial support
during my study.

iii
TABLE OF CONTENTS
CERTIFICATION i
ACKNOWLEDGEMENTS ii
TABLE OF CONTENTS iii
LIST OF SYMBOLS vi
LIST OF FIGURES vii
LIST OF TABLES xiii
ABSTRACT 1
CHAPTER 1. INTRODUCTION 2
1.1 Background and Significance 2
1.2 Thesis Outline 3
REFERENCES 4
CHAPTER 2. A LITERATURE SURVEY ON PERMANENT MAGNET
SYNCHRONOUS MACHINES AND CONTROL STRATEGIES
6
2.1 Introduction 6
2.2 The State of the Art of PMSMs 7
2.2.1 Permanent magnets on rotor 7
2.2.2 Permanent magnets on stator 8
2.3 History of Control Methods 13
2.3.1 Six-step control 13
2.3.2 Vector control 17
2.3.3 Direct torque control 19
2.3.4 Model predictive control 23
2.3.5 Qualitative comparison of control methods 26
2.4 Vector Control of PMSM 28
2.5 Direct Torque Control of PMSM 30
2.6 Conclusion 32
REFERENCES 32
CHAPTER 3. MODEL PREDICTIVE CONTROL OF PERMANENT
MAGNET SYNCHRONOUS MACHINES
40

iv
3.1 Introduction 40
3.2 Model of PMSMs 41
3.3 Model Predictive Control of PMSM 47
3.3.1 One-step delay compensation 51
3.3.2 Linear multiple horizon prediction 53
3.4 Numerical Simulation of DTC and MPC 54
3.4.1 Combined load test at 500 rpm 54
3.4.2 Combined load test at 1000 rpm 59
3.4.3 Combined load test at 1500 rpm 63
3.4.4 Combined load test at 2000 rpm 67
3.4.5 Deceleration test (from 1500rpm to 500 rpm) 71
3.5 Experimental Testing of DTC and MPC 74
3.5.1 Steady state responses at 500 rpm 76
3.5.2 Steady state responses at 1000 rpm 78
3.5.3 Steady state responses at 1500 rpm 80
3.5.4 Steady state responses at 2000 rpm 82
3.5.5 Start-up test 84
3.5.6 Deceleration test (from 1500rpm to 500 rpm) 87
3.5.7 2Nm load test 90
3.6 Quantitative Analysis and Comparison of Control Methods 93
3.7 Conclusion 98
REFERENCES 99
CHAPTER 4. MODEL PREDICTIVE CONTROL WITH DUTY RATIO
OPTIMIZATION
102
4.1 Introduction 102
4.2 Model Predictive Control with Duty Ratio Optimization 104
4.3 Numerical Simulation of DTC and MPC with Duty Ratio Optimization 107
4.3.1 Combined simulation test of MPC with duty ratio optimization 108
4.3.2 Reversing test (from 1000rpm to -500 rpm) 111
4.4 Experimental Testing of DTC and MPC with Duty Ratio Optimization 112
4.4.1 Steady state responses 112
4.4.2 Dynamic response 114

v
4.5 Comparison of DTC, MPC, and MPC with Duty Ratio Optimization 117
4.6 The Influence of Variable Sampling Frequency on Drive Performance 120
4.6.1 Simulation test 120
4.6.2 Experimental tests 123
4.7 Conclusion 127
REFERENCES 128
CHAPTER 5. CONCLUSIONS AND FUTURE WORK 131
5.1 Conclusion 131
5.2 Future Work 132
APPENDIX A. LIST OF PUBLICATIONS FROM THIS WORK 133

vi
LIST OF SYMBOLS
* Reference value
Stationary stator reference frame axes
dq Rotary rotor reference frame axes
f Frequency (Hz)
Average switching frequency (Hz)
Sampling frequency
J Inertia
, Three-phase flux linkages (Wb)
- and - axis stator flux linkages (Wb)
d- and q-axis stator flux linkages (Wb)
r Angle between two stator reference frame and rotor reference
frame
d- and q-axis inductance (H)
Flux linkage generated by the rotor permanent magnet (Wb)
Flux ripple
Number of the machine pole pairs
Stator voltages (V)
- and - axis stator voltages (V)
Stator currents (A)
- and - axis stator currents (A)
d- and q-axis stator currents (A)
Per-phase stator winding resistance ( )
Electromagnetic torque (Nm)
Load torque applied on the rotor shaft
Torque ripple

vii
Space voltage vectors produced by the two level inverter (V)
Total input power of a motor (W)
Electromagnetic power obtained by subtracting the mechanical
loss from the input power (W)
Rotor mechanical speed
Electrical speed
Torque constant gain
Flux constant gain
viii
LIST OF FIGURES
Fig. 2.1 Structure of PM machines 7
Fig. 2.2 Cross sectional view of (a) PM hysteresis hybrid machine, (b) 4-layer
hybrid winding machine, and (c) double rotor synchronous PM machine
8
Fig. 2.3 Cross sectional view of (a) the first proposed DSPM and (b) stator
doubly fed DSPM
9
Fig. 2.4 Structure of SHEDS-PM 10
Fig. 2.5 Structure of (a) 4/2 pole flux-switch alternator, (b) 4/6 pole flux-switch
alternator, and (c) FSPM proposed by E. Hoang in 1997
10
Fig. 2.6 Topologies of modern FSPM, (a) conventional FSPM, (b) fault-tolerant
FSPM, (c) E-core FSPM, (d) C-core FSPM, (e) multi-tooth FSPM, (f)
segmental rotor FSPM, (g) hybrid excited FSPM, and (h) axial laminated
structure FSPM
12
Fig. 2.7 Back emf waveform of BLDC and PMSM 14
Fig. 2.8 Disassembled view of a BLDC motor: PM rotor, winding and Hall
elements
14
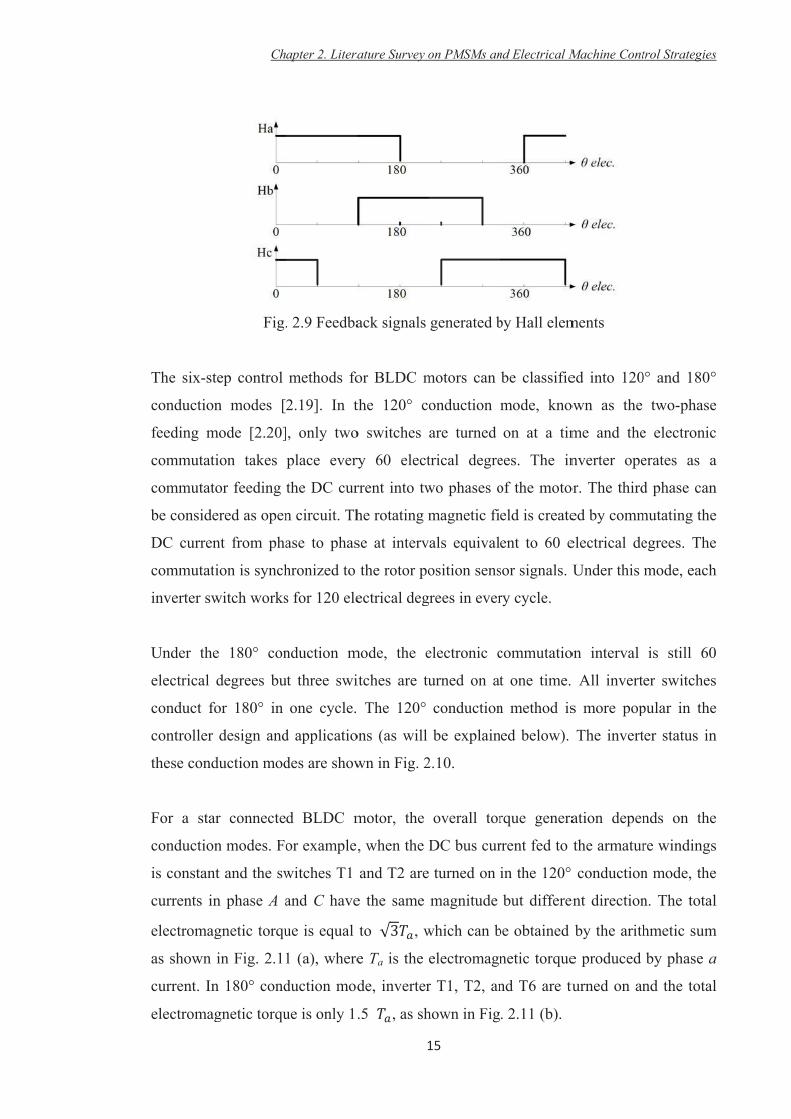
Fig. 2.9 Feedback signals generated by Hall elements 15
Fig. 2.10 Inverter diagram and conduction modes for six-step control 16
Fig. 2.11 Torque generation under different conduction modes 17
Fig. 2.12 Diagram of vector control drive system 18
Fig. 2.13 Diagram of direct torque control drive system 21
Fig. 2.14 Development of DTC scheme 22
Fig. 2.15 Finite control set MPC scheme 25
Fig. 2.16 Voltage and current vectors 28
Fig. 2.17 Block diagram of PMSM VC drive system 30
Fig. 2.18 Block diagram of PMSM DTC drive system 31
Fig. 2.19 Voltage vector and spatial sector definition 31

ix
Fig. 3.1 Per phase equivalent circuit diagram for SM 41
Fig. 3.2 Relationship between different reference frames 43
Fig. 3.3 PMSM equivalent circuits in (a) d-, and (b) q-axes 45
Fig. 3.4 Block diagram of MPC drive system 50
Fig. 3.5 One-step delay in digital control systems 52
Fig. 3.6 Combined load test for DTC at 500 rpm 55
Fig. 3.7 Combined load test for MPC at 500 rpm 56
Fig. 3.8 Combined load test for MPC with one-step delay compensation at 500
rpm
56
Fig. 3.9 Combined load test for MPC with linear multiple horizon prediction at
500 rpm
57
Fig. 3.10 Combined load test for MPC with both linear multiple horizon
prediction and one-step delay compensation at 500 rpm
57
Fig. 3.11 Combined load test for DTC at 1000 rpm 59
Fig. 3.12 Combined load test for MPC at 1000 rpm 60
Fig. 3.13 Combined load test for MPC with one-step delay compensation at
1000 rpm
60
Fig. 3.14 Combined load test for MPC with linear multiple horizon prediction
at 1000 rpm
61
Fig. 3.15 Combined load test for MPC with both linear multiple horizon
prediction and one-step delay compensation at 1000 rpm
61
Fig. 3.16 Combined load test for DTC at 1500 rpm 63
Fig. 3.17 Combined load test for MPC at 1500 rpm 64
Fig. 3.18 Combined load test for MPC with one-step delay compensation at
1500 rpm
64
Fig. 3.19 Combined load test for MPC with linear multiple horizon prediction
at 1500 rpm
65
Fig. 3.20 Combined load test for MPC with both linear multiple horizon
prediction and one-step delay compensation at 1500 rpm
65

x
Fig. 3.21 Combined load test for DTC at 2000 rpm 67
Fig. 3.22 Combined load test for MPC at 2000 rpm 68
Fig. 3.23 Combined load test for MPC with one-step delay compensation at
2000 rpm
68
Fig. 3.24 Combined load test for MPC with linear multiple horizon prediction
at 2000 rpm
69
Fig. 3.25 Combined load test for MPC with both linear multiple horizon
prediction and one-step delay compensation at 2000 rpm
69
Fig. 3.26 Deceleration test for DTC 71
Fig. 3.27 Deceleration test for MPC 72
Fig. 3.28 Deceleration test for MPC one-step delay compensation 72
Fig. 3.29 Deceleration test for MPC with linear multiple horizon prediction 73
Fig. 3.30 Deceleration test for MPC with both linear multiple horizon
prediction and one-step delay compensation
73
Fig. 3.31 Experimental setup of testing system 75
Fig. 3.32 Dynamo-meter controller DSP6000 75
Fig. 3.33 Steady-state response at 500 rpm 76
Fig. 3.34 Steady-state response at 500 rpm 76
Fig. 3.35 Steady-state response at 1000 rpm 78
Fig. 3.36 Steady-state response at 1000 rpm 78
Fig. 3.37 Steady-state response at 1500 rpm 80
Fig. 3.38 Steady-state response at 1500 rpm 80
Fig. 3.39 Steady-state response at 2000 rpm 82
Fig. 3.40 Steady-state response at 2000 rpm 82
Fig. 3.41 Start-up response from standstill to 2000 rpm for DTC 84
Fig. 3.42 Start-up response from standstill to 2000 rpm for MPC 85
Fig. 3.43 Start-up response from standstill to 2000 rpm for MPC with one-step
delay compensation
85
Fig. 3.44 Start-up response from standstill to 2000 rpm for MPC with linear 86

xi
multiple horizon prediction
Fig. 3.45 Start-up response from standstill to 2000 rpm for MPC with both
linear multiple horizon prediction and one-step delay compensation
86
Fig. 3.46 Deceleration test for DTC 87
Fig. 3.47 Deceleration test for MPC 88
Fig. 3.48 Deceleration test for MPC with one-step delay compensation 88
Fig. 3.49 Deceleration test for MPC with both linear multiple horizon
prediction
89
Fig. 3.50 Deceleration test for MPC with both linear multiple horizon
prediction and one-step delay compensation
89
Fig. 3.51 Response to external load for DTC 90
Fig. 3.52 Response to external load for MPC 91
Fig. 3.53 Response to external load for MPC with one-step delay compensation 91
Fig. 3.54 Response to external load for MPC with linear multiple horizon
prediction
92
Fig. 3.55 Response to external load for MPC with both linear multiple horizon
prediction and one-step delay compensation
92
Fig. 4.1 Diagram of a MPC drive system with duty ratio optimization 107
Fig. 4.2 Combined load test for MPC with duty ratio optimization at 500 rpm 108
Fig. 4.3 Combined load test for MPC with duty ratio optimization at 1000 rpm 109
Fig. 4.4 Combined load test for MPC with duty ratio optimization at 1500 rpm 109
Fig. 4.5 Combined load test for MPC with duty ratio optimization at 2000 rpm 110
Fig. 4.6 Reversing test for MPC with duty ratio optimization 111
Fig. 4.7 Steady-state response at 500 rpm 112
Fig. 4.8 Steady-state response at 1000 rpm 113
Fig. 4.9 Steady-state response at 1500 rpm 113
Fig. 4.10 Steady-state response at 2000 rpm 114
Fig. 4.11 Start-up response from standstill to 2000 rpm for MPC with duty ratio
optimization
115
xii
Fig. 4.12 Reversing test for MPC with duty ratio optimization 115
Fig. 4.13 Response to 2 Nm external load at 500 rpm for MPC with duty ratio
optimization
116
Fig. 4.14 Response to 1 Nm external load at 1000 rpm for MPC with duty ratio
optimization
116
Fig. 4.15 Torque ripple vs. sampling frequency (simulation) 121
Fig. 4.16 Flux ripple vs. sampling frequency (simulation) 122
Fig. 4.17 Torque ripple vs. switching frequency (simulation) 122
Fig. 4.18 Flux ripple vs. switching frequency (simulation) 123
Fig. 4.19 Torque ripple vs. sampling frequency (exprimental) 124
Fig. 4.20 Flux ripple vs. sampling frequency (exprimental) 125
Fig. 4.21 Torque ripple vs. switching frequency (exprimental) 125
Fig. 4.22 Flux ripple vs. switching frequency (exprimental) 126

xiii
LIST OF TABLES
Table 2-1 Qualitative comparison of control methods 27
Table 2-2 Switching table of classic DTC scheme for PMSM drive 31
Table 3-1 Motor parameters 54
Table 3-2a Steady-state response at 500 rpm (simulation) 93
Table 3-2b Steady-state response at 500 rpm (experimental) 93
Table 3-3a Steady-state response at 1000 rpm (simulation) 93
Table 3-3b Steady-state response at 1000 rpm (experimental) 93
Table 3-4a Steady-state response at 1500 rpm (simulation) 94
Table 3-4b Steady-state response at 1500 rpm (experimental) 94
Table 3-5a Steady-state response at 2000 rpm (simulation) 94
Table 3-5b Steady-state response at 2000 rpm (experimental) 94
Table 4-1 Motor and control system parameters 107
Table 4-2a Steady-state response at 500 rpm (simulation) 117
Table 4-2b Steady-state response at 500 rpm (experimental) 117
Table 4-3a Steady-state response at 1000 rpm (simulation) 117
Table 4-3b Steady-state response at 1000 rpm (experimental) 117
Table 4-4a Steady-state response at 1500 rpm (simulation) 118
Table 4-4b Steady-state response at 1500 rpm (experimental) 118
Table 4-5a Steady-state response at 2000 rpm (simulation) 118
Table 4-5b Steady-state response at 2000 rpm (experimental) 118

Abstract
1
ABSTRACT
This study focuses on the development of novel model predictive control method for
PMSM drive system. The aims of the proposed control method are flux and torque
ripples reduction. The performances of the proposed model predictive control method
and conventional direct torque control (DTC) are comparatively studied in both
simulation and experimental tests.
In recent years, various variable speed drive strategies and structures for PMSMs have
been widely investigated and reported. Among these control strategies, the six-step
control, field oriented control (FOC) and DTC are the most popular ones. Among them,
the conventional DTC, which selects the desired voltage vector based on hysteresis
comparators and switching table, features a fast dynamic response and very simple
structure. The major demerits of DTC are large torque and flux ripples, variable
switching frequency, and acoustic noises. Recently, the model based predictive control
(MPC) was introduced to overcome these problems. However, the improvement was
limited for the purposes of torque and flux ripple reduction and the MPC still suffered
from variable switching frequency.
The conventional DTC and MPC are similar in that they both select only one voltage
vector per sampling period. This may result in overregulation, which is the key issue for
torque and flux ripples and excessive acoustic noise. In this thesis, an improved MPC
method with duty ratio optimization was proposed for PMSMs. The proposed method
features low torque and flux ripples and relatively stable switching frequency. It is of
most benefit when the drive system is working at a low sampling frequency because in
the low frequency range, the proposed MPC drive system can achieve much lower
torque and flux ripples than the original MPC and DTC, which is a very desirable
feature for high power applications (e.g. electric vehicles). Finally, the numerical
simulation and experimental test results of the conventional DTC, MPC, and improved
MPC were presented to verify its effectiveness.

Chapter 1. Introduction
2
CHAPTER 1
INTRODUCTION
1.1 Background and Significance
Modern permanent magnet synchronous machines (PMSMs) are attracting increasing
interest for a wide range of applications including industry, household and
transportation usage. With the worldwide trend towards energy conservation, there is an
increasing need for energy efficient, high performance and reliable electrical drives.
PMSMs are the ideal candidates due to their high efficiency, high output power per
mass and volume and excellent dynamic performance.
In recent years, various variable speed drive strategies and structures for PMSMs have
been widely investigated and reported. Among these control strategies, the field
oriented control (FOC) and direct torque control (DTC) are the most popular ones
[1.1]-[1.3]. Compared to FOC, the merits of DTC are simple structure, quick dynamic
response and strong robustness against motor parameter variation [1.4]-[1.6]. However,
the conventional DTC also presents some disadvantages, such as large torque and flux
ripples, variable switching frequency and excessive acoustic noises.
To overcome these problems, many methods have been proposed in the literature. Some
of them apply space vector modulation (SVM) to DTC, known as SVM-DTC. In the
conventional DTC, the switching table only includes a limited number of voltage
vectors with fixed amplitudes and positions. The implementation of SVM enables the
generation of an arbitrary voltage vector with any amplitude and position [1.7]-[1.9]. In
this way, SVM-DTC can generate the torque and flux more accurately. Another merit of
using SVM is that the sampling frequency required is not as high as that in the
conventional DTC.
Recently, the model predictive control (MPC) has attracted increasing attention in
industry and academic communities [1.10]-[1.15]. In SVM-DTC, the power converter
with modulation can be considered as a gain in controller design. In the predictive
control methods, the discrete nature of power converters is taken into account by
considering the converter and the motor from a systemic view. There are various

Chapter 1. Introduction
3
versions of predictive control, differing in the principle of vector selection, number of
applied vectors and predictive horizon.
The conventional DTC and MPC are similar in that they both select only one voltage
vector in each sampling period. This can result in overregulation, leading to large torque
and flux ripples and acoustic noise.
The major objectives of this thesis project are:
To conduct a comprehensive comparative study of the existing PMSM drive
strategies,
To propose a novel MPC control scheme for the purposes of torque and flux ripple
reduction, and
To carry out both simulation and experimental tests of the proposed MPC control
and compare these to other conventional control schemes.
1.2 Thesis Outline
This thesis is organised in five chapters, including this one as an introduction to the
background and structure of the whole thesis.
Chapter 2 presents the state of the art of permanent magnet synchronous machines.
Various topologies of PMSMs and classifications are introduced. A literature review of
all the major machine control methods is presented. The fundamentals and principles of
these drive methods are also investigated.
Chapter 3 discusses the model predictive control in details. The PMSM model for MPC
is firstly derived. Then the principle of MPC is introduced as well as some
improvements, such as one-step delay compensation and linear multiple horizon
prediction. The simulation and experimental tests of DTC, MPC and improved MPC are
presented and a comprehensive analysis of the test results is carried out.
In Chapter 4, a novel MPC scheme is proposed, namely MPC with duty ratio
optimization. The idea of duty ratio optimization and the duty ratio calculation

Chapter 1. Introduction
4
algorithm are presented. Both simulation and experimental tests of the original MPC
and the new MPC are carried out, in order to demonstrate the effectiveness of the
proposed method.
Chapter 5 draws conclusions from this thesis and presents possible future work.
Lists of related references are attached at the end of each chapter.
REFERENCES
[1.1] S. Y. Kim, W. Lee, M.S. Rho, and S. Y. Park, “Effective dead-time
compensation using a simple vectorial disturbance estimator in PMSM drives,”
IEEE Trans. Ind. Electron., vol.57, no.5, 2010, pp.1609–1614
[1.2] J. Lee, J. Hong, K. Nam, R. Ortega, L. Praly, and A. Astolfi, “Sensorless
control of surface-mount permanent-magnet synchronous motors based on a
nonlinear observer,” IEEE Trans. Power Electron., vol.25, no.2, 2010,
pp.290–297
[1.3] F. Genduso, R. Miceli, C. Rando, and G. R. Galluzzo, “Back EMF
sensorless-control algorithm for high-dynamic performance PMSM,” IEEE
Trans. Ind. Electron., vol.57, no.6, 2010, pp.2092–2100
[1.4] I. Takahashi and T. Noguchi, “A new quick-response and high-efficiency
control strategy of an induction motor,” IEEE Trans. Ind. Appl., vol.22, no.5,
1986, pp.820–827
[1.5] M. Depenbrock, “Direct self-control (DSC) of inverter-fed induction machine,”
IEEE Trans. Power Electron., vol.3, no.4, 1988, pp.420–429
[1.6] G. S. Buja and M. P. Kazmierkowski, “Direct torque control of PWM
inverter-fed AC motors—A survey,” IEEE Trans. Ind. Electron., vol.51, no.4,
2004, pp.744–757
[1.7] Y. S. Lai and J. H. Chen, “A new approach to direct torque control of
induction motor drives for constant inverter switching frequency and torque
ripple reduction,” IEEE Trans. Energy Convers., vol.16, no.3, 2001, pp.220–

Chapter 1. Introduction
5
227
[1.8] C. Lascu and A. Trzynadlowski, “A sensorless hybrid DTC drive for
high-volume low-cost applications,” IEEE Trans. Ind. Electron., vol.51, no.5,
2004, pp.1048- 1055
[1.9] Y. Zhang, J. Zhu, W. Xu, J. Hu, D. G. Dorrell, and Z. Zhao, “Speed sensorless
stator flux oriented control of three-level inverter-fed induction motor drive
based on fuzzy logic and sliding mode control,” in Proc. 36th IEEE IECON,
2010, pp.2926–2931.
[1.10] T. S. Wang, J. G. Zhu, and Y. C. Zhang, "Model predictive torque control for
PMSM with duty ratio optimization," International Conference on Electrical
Machines and Systems (ICEMS), 20-23 Aug. 2011
[1.11] H. Miranda, P. Cortes, J. Yuz, and J. Rodriguez, “Predictive torque control of
induction machines based on state-space models,” IEEE Trans. Ind. Electron.,
vol.56, no.6, 2009, pp.1916–1924
[1.12] T. Geyer, G. Papafotiou, and M. Morari, “Model predictive direct torque
control—Part I: Concept, algorithm, and analysis,” IEEE Trans. Ind. Electron.,
vol.56, no.6, 2009, pp.1894–1905
[1.13] S. Kouro, P. Cortes, R. Vargas, U. Ammann, and J. Rodriguez, “Model
predictive control—a simple and powerful method to control power
converters,” IEEE Trans. Ind. Electron., vol.56, no.6, 2009, pp.1826–1838
[1.14] F. Morel, J.-M. Retif, X. Lin-Shi, and C. Valentin, “Permanent magnet
synchronous machine hybrid torque control,” IEEE Trans. Ind. Electron.,
vol.55, no.2, 2008, pp.501–511
[1.15] K. Drobnic, M. Nemec, D. Nedeljkovic, and V. Ambrozic, “Predictive direct
control applied to AC drives and active power filter,” IEEE Trans. Ind.
Electron., vol.56, no.6, 2009, pp.1884–1893

Chapter 2. Literature Survey on PMSMs and Electrical Machine Control Strategies
6
CHAPTER 2
LITERATURE SURVEY ON PERMANENT MAGNET SYNCHRONOUS
MACHINES AND ELECTRICAL MACHINE CONTROL STRATEGIES
2.1 Introduction
Permanent magnet synchronous machines (PMSMs) have been widely applied in both
industrial and domestic markets because of their high power density, high torque to
current ratio, and high power factor. However, the major drawbacks of PMSMs are high
cost, narrow speed range, less robustness when compared to induction motors (IMs) and
the need for a complex control scheme. Recently, various topologies have been
proposed for PMSMs to overcome these problems.
During the 1990s, the vector control (VC) or field oriented control (FOC) scheme was
thoroughly investigated resulting in a significant improvement in the performance of
AC drives. However, these schemes have several main limitations, such as the high
sensitivity to machine parameters and large computing cost. To overcome the
drawbacks of the conventional VC schemes, the direct torque control (DTC) scheme
was proposed with attractive advantages, such as insensitivity to machine parameters,
fast torque response and simple algorithms. Much effort has been made to improve the
performance of both VC and DTC schemes.
In this chapter, the state of the art of PMSMs is firstly introduced in section 2.2,
including various topologies of PMSMs and classification. Section 2.3 presents a
literature review of all the major machine control methods. The fundamentals and
principles of these drive methods are introduced in sections 2.4 and 2.5.

Chapter 2. Literature Survey on PMSMs and Electrical Machine Control Strategies
7
2.2 State of the Art of PMSMs
Permanent magnet (PM) machines are the most efficient of all types of electrical
machines due to the use of permanent magnets for the excitation, which consumes no
power. Other merits of PM machines include simple control technique, high power
density and ease of cooling. However, PM machines also suffer from some
disadvantages, such as narrow constant power speed range, possible demagnetization,
and high cost.
The topologies of PM machines are various. According to the location of PMs, they can
be divided into two categories: PMs on rotor and PMs on stator.
2.2.1 Permanent magnets on rotor
This is a classical topology of PM machines, including the surface mounted permanent
magnet machine (SPM) and interior permanent magnet machine (IPM), as shown in Fig.
2.1.
Fig. 2.1 Structure of PM machines
(a) IPM and (b) SPM
Numerous novel designs of IPMs have been proposed. In 1995, M. Azizur Rahman and
Ruifeng Qin designed a PM hysteresis hybrid synchronous motor which is the
combination of conventional stator and hybrid rotor [2.1], as shown in Fig.2.2(a). On
the rotor, PMs are inserted in the slots at the inner surface of the hysteresis material ring.
The merit of this design is the high starting torque due to the magnet brake torque of a
conventional PM motor compensated by the high eddy current and hysteresis torques.
Chapter 2. Literature Survey on PMSMs and Electrical Machine Control Strategies
8
At the synchronous speed, the motor behaves as a permanent magnet motor due to the
absence of eddy current torque [2.1].
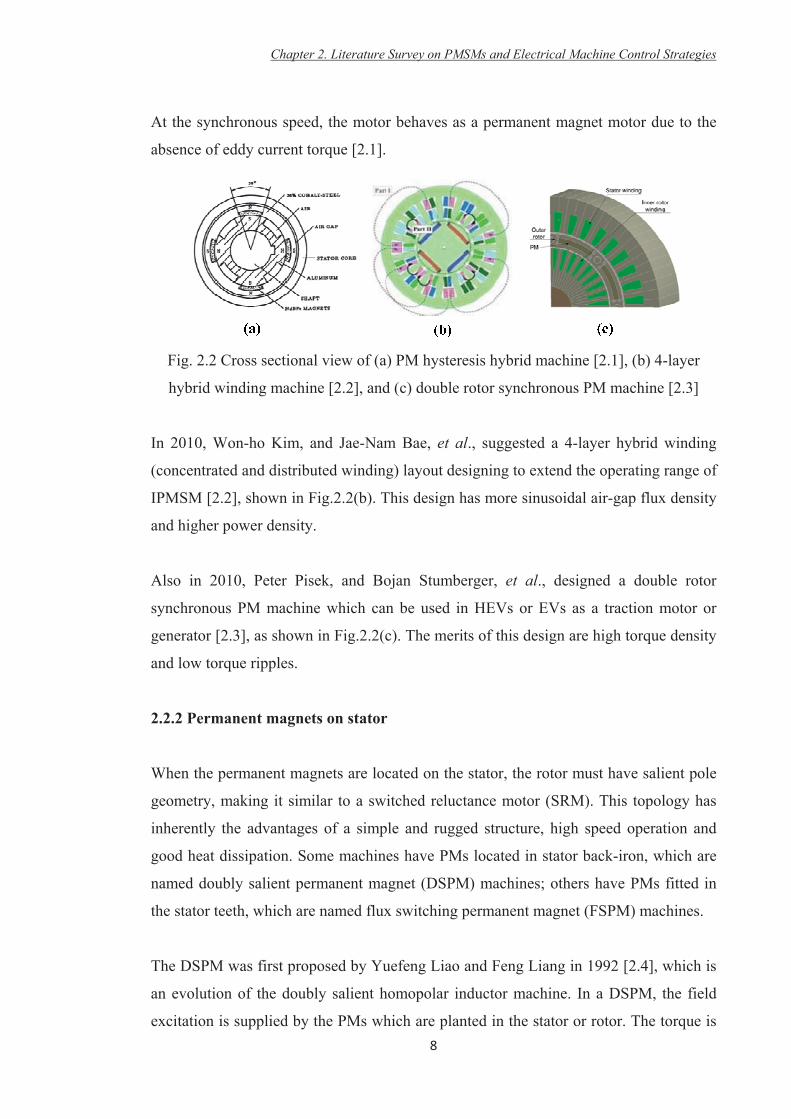
Fig. 2.2 Cross sectional view of (a) PM hysteresis hybrid machine [2.1], (b) 4-layer
hybrid winding machine [2.2], and (c) double rotor synchronous PM machine [2.3]
In 2010, Won-ho Kim, and Jae-Nam Bae, et al., suggested a 4-layer hybrid winding
(concentrated and distributed winding) layout designing to extend the operating range of
IPMSM [2.2], shown in Fig.2.2(b). This design has more sinusoidal air-gap flux density
and higher power density.
Also in 2010, Peter Pisek, and Bojan Stumberger, et al., designed a double rotor
synchronous PM machine which can be used in HEVs or EVs as a traction motor or
generator [2.3], as shown in Fig.2.2(c). The merits of this design are high torque density
and low torque ripples.
2.2.2 Permanent magnets on stator
When the permanent magnets are located on the stator, the rotor must have salient pole
geometry, making it similar to a switched reluctance motor (SRM). This topology has
inherently the advantages of a simple and rugged structure, high speed operation and
good heat dissipation. Some machines have PMs located in stator back-iron, which are
named doubly salient permanent magnet (DSPM) machines; others have PMs fitted in
the stator teeth, which are named flux switching permanent magnet (FSPM) machines.
The DSPM was first proposed by Yuefeng Liao and Feng Liang in 1992 [2.4], which is
an evolution of the doubly salient homopolar inductor machine. In a DSPM, the field
excitation is supplied by the PMs which are planted in the stator or rotor. The torque is

Chapter 2. Literature Survey on PMSMs and Electrical Machine Control Strategies
9
produced by both PMs’ flux and current excitation flux in the windings. The basic
structure of DSPM is similar to that of SRM as shown in Fig. 2.3(a) [2.4]. The major
advantages of the DSPM are high torque density, high efficiency, simple and rugged
structure, high speed capability, small VA rating of the power converter and fast
response times. The drawbacks of DSPM are poor torque quality and limited speed
range which is critical for EVs.
(a) (b) Fig. 2.3 Cross sectional view of (a) the first proposed DSPM [2.4],
and (b) stator doubly fed DSPM [2.5]
In recent years, to extend the speed range and improve the efficiency of DSPM for EV
applications, numerous novel designs have been proposed. In 2003, K.T. Chau
suggested a stator doubly fed DSPM [2.5], which consists of two types of stator
windings, a three-phase armature winding and a DC field winding as shown in Fig.
2.3(b). The three-phase armature winding operates like that in the conventional DSPM,
whereas the DC field winding works as a tool for flux weakening or flux strengthening.
Moreover, an extra flux path is added in this topology to reinforce the effect of flux
weakening and flux strengthening. With the help of these artful designs, the constant
power operation range can be extended to four times that of the base speed which is
suitable for EV applications. The efficiency on the flux weakening operation is also
improved [2.5].

In 2005, X
permanent
Fig. 2.4 [2
magnetic b
the effect
The conce
was used
missiles as
Fig. 2.5
In 1997, E
teeth and
Ch
Xiaoyong Zh
t magnet (S
2.6], which
bridge coul
of DC excit
ept of FSPM
in 4/2 po
s shown in F
(a)
Structure o
alternator
E. Hoang pr
full pitch co
apter 2. Litera
Fig. 2.4
hu and Min
SHEDS-PM
is a similar
ld maintain
tation flux o
M was firstly
le and 4/6
Figs. 2.5(a)
f (a) 4/2 po
[2.7], and (c
resented a n
oncentrated
ature Survey o
1
4 Structure o
ng Cheng pr
M) brushless
r approach t
the entirety
on PM flux.
y proposed
6 pole flux-
) and (b) [2.
(b)
le flux-swit
c) FSPM pr
new structu
d stator win
on PMSMs an
10
of SHEDS-P
roposed a st
machine w
to that sugg
y of the sta
.
by S.E. Ra
-switch alte
7].
tch alternato
roposed by E
ure of FSPM
ding which
nd Electrical M
PM [2.6]
tator hybrid
ith a magne
gested by K
ator laminati
uch and L.J
ernators wh
(c
or [2.7], (b)
E. Hoang in
M with PMs
can be con
Machine Cont
d excited dou
etic bridge a
K.T. Chau in
tion as well
J. Johnson i
hich are de
c)
4/6 pole flu
n 1997 [2.8]
s inserted i
nsidered as
trol Strategies
ubly salient
as shown in
n 2003. The
as amplify
in 1955 and
esigned for
ux-switch
]
n the stator
the modern
s
t
n
e
y
d
r
r
n

Chapter 2. Literature Survey on PMSMs and Electrical Machine Control Strategies
11
conventional FSPM [2.8]. As shown in Fig. 2.5(c), due to the air gap flux being a
compound of the PM flux and the winding excitation flux, in theory, the capability of
flux weakening is infinite. Besides the inherent merits of the SRM and PM machine, the
most prominent advantage of the proposed design is its wide operating speed range.
Although the structure of FSPM is similar to that of SRM, the acoustic noise of FSPM
is lower than that of SRM by the help of a different flux control method.
In the last five years, numerous novel FSPM topologies have been developed for
various applications as shown in Fig. 2.6. The fault-tolerant design proposed by R.L.
Owen and Z.Q. Zhu in 2008, is achieved by employing an alternate pole and wound
windings topology, as shown in Fig. 2.6(b) [2.9]. However, the conventional FSPM
machine has the demerit of high magnet volume, which can be improved by replacing
the stator pole without armature winding with a simple stator tooth, as shown in Fig.
2.6(c) E-core FSPM [2.10]. Moreover, the simple stator tooth can be removed to enlarge
the slot area, and consequently the C-core FSPM is produced as presented in Fig. 2.6(d).
As shown, the rotor pole number is twice of the stator pole number in the E- and C-core
FSPM design, whilst they are equal in the conventional FSPM. In order to improve the
torque density, in 2008, Z.Q. Zhu, and J.T. Chen, et al., presented a multi-tooth FSPM
topology as shown in Fig. 2.6(e) [2.10]. However, as the magnetic circuit becomes
saturated more quickly as the current is increased, its torque capability becomes inferior
to that of a conventional FSPM machine, due to the higher armature reaction.
In 2009, A. Zulu suggested a novel FSPM design with segmental rotor, as shown in Fig.
2.6(f) [2.11]. The idea of this design is to provide a defined magnetic path for conveying
the field flux to adjacent stator armature coils as the rotor rotates, in order to shorten the
end-winding and improve the overall efficiency. However, further study should be
carried out, due to the normal experimental performance compared with the
conventional FSPM. Also, the hybrid excited FSPM evolved from the conventional
FSPM was proposed in 2007 by E. Hoang and M. Lecrivain as shown in Fig. 2.6(g)
[2.8]. A DC excitation winding was added in the back of the PMs, in order to modulate
the excitation of the permanent magnets. In this way, both the flux weakening and flux
strengthening effect can be achieved for a wide speed range in a constant power region
and high torque at starting period. In 2011, W. Xu and J. Zhu, et al. proposed an axially

Chapter 2. Literature Survey on PMSMs and Electrical Machine Control Strategies
12
laminated FSPM (ALFSPM) machine, as shown in Fig. 2.6(h) [2.12]. The windings and
magnets of this machine are located in the stator, while the rotor is passive with great
mechanical robustness. For inheriting the merits of both switched reluctance machine
and traditional rotor-PM machine, it has good attributes of high torque/power density,
high efficiency, excellent flux-weakening capability, strong robustness, and
convenience of cooling
Most PM machines have excellent features like high power density, high efficiency,
high controllability and fast dynamic response. The major weaknesses are the delicate
rotor structure due to the low mechanical strength of PMs and the narrow operating
speed range due to the difficulty of weakening the field of PMs.
Fig. 2.6 Topologies of modern FSPM, (a) conventional FSPM,
(b) fault-tolerant FSPM [2.9], (c) E-core FSPM [2.10], (d) C-core FSPM [2.10],
(e) multi-tooth FSPM [2.10], (f) segmental rotor FSPM [2.11], (g) hybrid excited FSPM
[2.8], and (h) axial laminated structure FSPM [2.12]
Chapter 2. Literature Survey on PMSMs and Electrical Machine Control Strategies
13
2.3 History of Motor Control Methods
2.3.1 Six-step control
The conventional DC machines feature high performance and high efficiency. However,
the major drawback is that they need a commutator and brushes which are subject to
wear and require maintenance. The development of solid-state switches enabled the
realization of maintenance-free machines which are known as electronically
commutated motors (ECMs) [2.13] or brushless DC (BLDC) motors [2.14-15]. The
BLDC motor was first developed in 1964 by the National Aeronautics and Space
Administration (NASA) [2.16].
The basic principle of BLDC motors and conventional DC motors are almost the same.
The primary difference is the inverse relationship of rotating and stationary components.
The conventional DC motors have a stationary magnetic field and rotating armature,
while the BLDC motors have a rotating PM rotor and stationary armature windings. In
the six-step control method, the solid-state switches function as the commutators and
brushes, in order to commutate the stator current. [2.17].
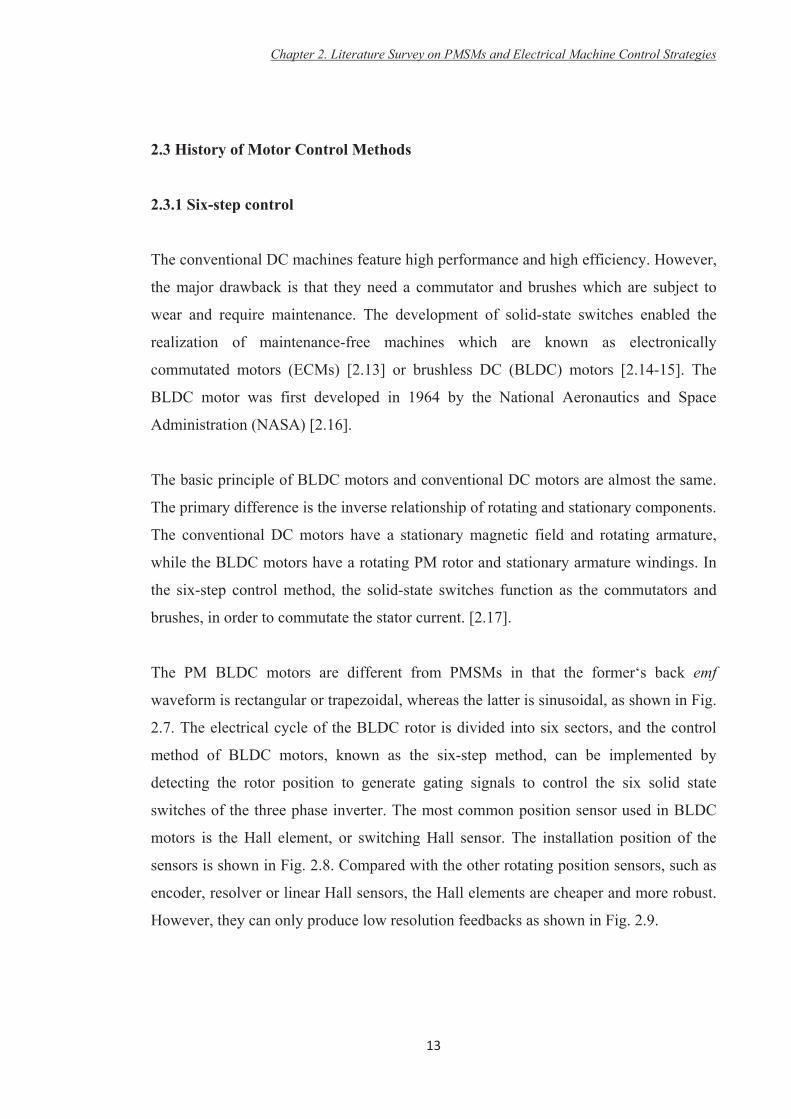
The PM BLDC motors are different from PMSMs in that the former‘s back emf
waveform is rectangular or trapezoidal, whereas the latter is sinusoidal, as shown in Fig.
2.7. The electrical cycle of the BLDC rotor is divided into six sectors, and the control
method of BLDC motors, known as the six-step method, can be implemented by
detecting the rotor position to generate gating signals to control the six solid state
switches of the three phase inverter. The most common position sensor used in BLDC
motors is the Hall element, or switching Hall sensor. The installation position of the
sensors is shown in Fig. 2.8. Compared with the other rotating position sensors, such as
encoder, resolver or linear Hall sensors, the Hall elements are cheaper and more robust.
However, they can only produce low resolution feedbacks as shown in Fig. 2.9.

Fig. 2.7 B
Fig. 2.8
Ch
Back emf wa
m
Disassemb
apter 2. Litera
aveform of
motor, and
led view of
ature Survey o
1
(
(
f BLDC and
(b) Sinusoi
f a BLDC m
[2
on PMSMs an
14
(a)
(b)
d PMSM: (a
idal back em
motor: PM ro
.18]
nd Electrical M
) Trapezoid
mf of PMSM
otor, windin
Machine Cont
dal back emf
M.
ng and Hall
trol Strategies
f of BLDC
elements
s
The six-st
conduction
feeding m
commutat
commutat
be conside
DC curren
commutat
inverter sw
Under the
electrical
conduct fo
controller
these cond
For a sta
conduction
is constan
currents in
electromag
as shown
current. In
electromag
Ch
Fig.
tep control
n modes [
mode [2.20]
tion takes
tor feeding
ered as open
nt from pha
tion is synch
witch works
e 180° con
degrees bu
for 180° in
design and
duction mod
ar connecte
n modes. Fo
nt and the sw
n phase A a
gnetic torqu
in Fig. 2.1
n 180° cond
gnetic torqu
apter 2. Litera
. 2.9 Feedba
methods fo
2.19]. In t
, only two
place every
the DC cur
n circuit. Th
ase to phas
hronized to
s for 120 ele
nduction m
ut three swi
one cycle.
d applicatio
des are show
d BLDC m
or example,
witches T1
and C have
ue is equal
1 (a), where
duction mod
ue is only 1.
ature Survey o
1
ack signals
or BLDC m
the 120° co
o switches
ry 60 elect
rrent into tw
he rotating m
se at interv
the rotor po
ectrical deg
mode, the e
itches are tu
The 120°
ons (as will
wn in Fig. 2
motor, the
, when the D
and T2 are
e the same
to , w
e Ta is the
de, inverter
.5 , as sh
on PMSMs an
15
generated b
motors can
onduction
are turned
trical degre
wo phases o
magnetic fi
als equival
osition sens
grees in ever
electronic c
urned on at
conduction
be explain
2.10.
overall tor
DC bus cur
turned on
magnitude
which can b
electromagn
r T1, T2, an
hown in Fig
nd Electrical M
by Hall elem
be classifie
mode, kno
on at a tim
ees. The in
of the moto
eld is create
ent to 60 e
sor signals. U
ry cycle.
commutatio
t one time.
n method is
ed below).
rque genera
rrent fed to
in the 120°
but differen
be obtained
netic torque
nd T6 are tu
. 2.11 (b).
Machine Cont
ments
ed into 120
own as the
me and the
nverter ope
or. The third
ed by comm
electrical de
Under this
on interval
All invert
s more pop
The invert
ation depen
the armatur
conduction
ent direction
by the arith
e produced
turned on an
trol Strategies
0° and 180°
two-phase
e electronic
erates as a
d phase can
mutating the
egrees. The
mode, each
is still 60
er switches
pular in the
ter status in
nds on the
re windings
n mode, the
n. The total
hmetic sum
by phase a
nd the total
s
°
e
c
a
n
e
e
h
0
s
e
n
e
s
e
l
m
a
l
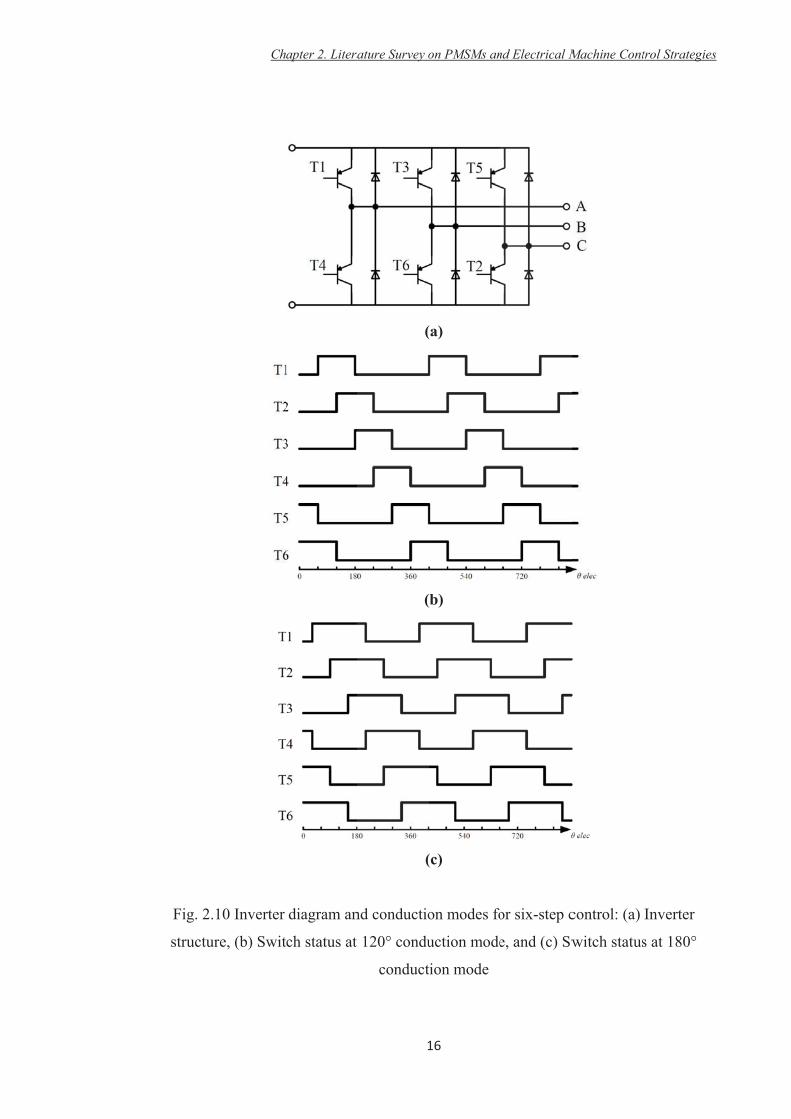
Fig. 2.
structur
Ch
10 Inverter
re, (b) Swit
apter 2. Litera
diagram an
ch status at
ature Survey o
1
(
(
(
nd conductio
120° condu
conduct
on PMSMs an
16
(a)
(b)
(c)
on modes fo
uction mode
tion mode
nd Electrical M
or six-step c
e, and (c) Sw
Machine Cont
control: (a)
witch status
trol Strategies
Inverter
s at 180°
s

Fig. 2.11
in 120
2.3.2 Vect
In the 199
switching
However,
make the
important
than those
The vecto
1970s by
essentially
method w
model the
current is
respective
machine b
adapts to
operate.
The VC c
transferrin
Striving f
Ch
Torque gen
0° conductio
tor control
90s, with th
power elec
the nonlin
torque cont
role in pro
e of DC mot
or control (V
Blaschke [2
y transform
was develop
e synchrono
s, into its
ely. This m
by manipu
any load d
controller f
ng the elect
for a sinuso
apter 2. Litera
neration und
on mode, an
he availabili
ctronic devic
near charact
trol difficul
oviding goo
tors.
VC) or fiel
2.21]. It is
ming their d
ped based o
us machine
flux produ
ethod enab
ulating the
disturbances
for PMSMs
trical excita
oidal emf of
ature Survey o
1
der different
nd (b) Torqu
ity of high
ces, much p
teristics and
lt. Fortunate
od performa
ld oriented
a fundamen
dynamic str
on the Park
es [2.23]. Th
ucing and
bles indepen
correspond
s and/or set
s was prop
ation field
f the motor
on PMSMs an
17
t conduction
ue composit
energy perm
progress has
d inherent
ely, vector-
ance charac
control (FO
ntal method
ructure into
k transform
he control o
torque pro
ndent contro
ding field-o
t-point vari
posed based
to a perma
r, the powe
nd Electrical M
n modes: (a
tion in 180°
manent mag
s been achie
coupling pr
-controlled
teristics sim
OC) scheme
d for contro
o that of D
m [2.22], wh
objective is
oducing co
ol of the fi
oriented qu
ation as fas
d on the or
anent magn
er and the t
Machine Cont
a) Torque co
° conduction
gnet materia
eved for PM
roblem of
PMSM driv
milar to or
e was prop
olling AC m
DC machine
hich was p
to decoupl
omponents,
ield and tor
uantities. T
st as a DC
riginal FOC
net based f
torque tran
trol Strategies
omposition
n mode
als and fast
MSM drives
the PMSM
ves play an
even better
osed in the
machines by
es. The VC
proposed to
le the stator
id and iq,
rque of the
This system
motor can
C concepts,
field [2.24].
nsmitted are
s
t
s.
M
n
r
e
y
C
o
r
,
e
m
n
,
.
e

Chapter 2. Literature Survey on PMSMs and Electrical Machine Control Strategies
18
independent of time and rotor angle. The stator current can be subdivided into its d-axis
and q-axis components, id and iq, respectively. Only the component iq develops the
torque for non-salient pole rotor machines, whereas id influences the magnitude of the
air-gap field. In order to develop the required torque at minimum current, the phase
angle of the current is chosen in a way such that no id component exists. The desired
locus of stator current spatial vector is that of a round circle. Fig. 2.12 shows the
diagram of the classical VC scheme for PMSMs.
Fig. 2.12 Diagram of vector control drive system
Based on the VC scheme, the motor currents and voltages are manipulated in the dq
reference frame. This means that the measured motor currents must be mathematically
transformed from the three phase static reference frame of the stator windings to the
stator dq reference frame, prior to being processed by the PI controller. Later, the
voltages have to be transformed from the dq frame to the abc reference frame for the
PWM output. For these transformations, the fast and intensive calculation capability of
a high performance microprocessor or digital signal processor (DSP) is necessary. The
powerful microprocessors or DSP have presented an effective solution to the high
performance digital PMSM controllers. Additionally, the availability of the unexpected
computation of microprocessors or DSPs has also made the current controller possible.
In 1986, a digital-based speed loop was reported with an analogue internal current
controller [2.25]. In 1988, a DSP vector controller was reported, but the detailed
implementation was not proposed [2.26]. The theoretical background to the digital

Chapter 2. Literature Survey on PMSMs and Electrical Machine Control Strategies
19
implementation of vector and current control was proposed in [2.27], which makes a
fully operational digital implementation of the vector/current controllers available and
reliable. Based on the previous research, in [2.28], Allen applied a dual digital signal
processor board for the control of PMSMs. As system reliability and cost reduction can
be achieved by the full digital solution, a digital VC scheme has been developed with a
space voltage modulation algorithm by Boldea and Nasar [2.29].
In 1992, Cecati presented the fully digital implementation of a classical rotor flux
orientation (RFO) VC scheme for a PMSM drive [2.30]. Based on the cascade control,
the whole system is composed of two loops. The well-known principle of rotor flux
oriented control is applied in the current control loop as the inner control loop, and the
outer loop is for speed control, which is realised by PI controllers.
With the application of fast digital signal processors, the space vector modulation
technique has been digitally implemented together with the VC scheme. In 1993, a new
VC drive scheme was presented with an application specific integrated circuit for pulse
width modulation (PWM) [2.31].
In 2002, Bolognani and Zigliotto designed a novel vector control scheme [2.32]
whereby the current space vector in the synchronous d-q reference frame is controlled.
The best voltage vector is applied in order to reduce the mean prediction based on motor
equations, which somewhat recalls the DTC methodology. The proposed algorithm is a
hysteresis control on both current vector amplitude and torque angle. Simulation and
experiment have confirmed the validity and simplicity of the method, which is
particularly suited for low-cost and full-digital DSP based applications. In addition, the
switching count is impressively reduced.
2.3.3 Direct torque control
In a VC based PMSM drive system, the output torque is controlled indirectly by
regulating the stator current, meaning the efforts to improve the system’s performance
are mainly focused on estimating accurate machine feedback and developing an

Chapter 2. Literature Survey on PMSMs and Electrical Machine Control Strategies
20
effective current controller, which will unfortunately increase the computation load, and
slow down the system’s dynamic response.
Another drive method for PMSMs was then proposed as direct torque control (DTC),
which regulates the generated torque and air-gap flux directly. The DTC scheme was
developed firstly for induction machines, by Takahashi as the DTC [2.33] and by
Depenbrock as the direct self-control (DSC) [2.34]. The basic idea of DTC for the
induction motor is to control the torque and flux linkage by selecting the voltage space
vectors properly, which is based on the relationship between the slip frequency and
torque [2.35]. It has been proven that DTC could be used for PMSM drives although
there is little difference from that of induction motors. Fig. 2.13 shows a typical
structure of the DTC system. The current controller followed by a PWM comparator is
not used in DTC systems, and the parameters of the motor are also not used, except the
stator resistance. Therefore, the DTC possesses advantages such as less parameter
dependence and faster torque response when compared with the torque control via VC
based current control. The switching state of the inverter is updated once only in every
sampling interval and it does not change until the output of the hysteresis controller
change states [2.36]. Therefore, the ripples in torque and flux are relatively high when
compared with those of the vector control drive system. Although a smaller hysteresis
bandwidth may result in less torque ripples, the switching loss of the inverter will
dramatically increase. Furthermore, the switching frequency of the inverter is not
constant. The switching action only depends on the observed torque and flux linkage
values. Therefore, the inverter switching frequency varies against the rotor speed, load
torque and the bandwidth of the two hysteresis controllers [2.37] [2.38].

Chapter 2. Literature Survey on PMSMs and Electrical Machine Control Strategies
21
PMSM
Inverter
Hysteresis Controllers
Direct Torque Control
Torque and Flux Estimator
Switching Table
Fig. 2.13 Diagram of direct torque control drive system
Many schemes have been proposed to improve the DTC scheme to achieve better
performance and they are summarised in Fig. 2.14. In [2.39]-[2.41], the hysteresis
controllers are replaced by a fuzzy logic controller, which considers not only the sign of
the error, but also the amplitude. In [2.42], neural network is used to select the vector. In
[2.43]-[2.45], Output space regulation (OSR) is used to select the vector. The proposed
strategies focus on a direct regulation of two outputs, namely torque and flux amplitude.
These strategies are based on the minimization of a weighted function of quadratic or
absolute value functions of the output errors. The classic DTC is considered as a special
case of OSR and it belongs to the class of strategies based on a quadratic criterion. In
[2.46], a 3-level inverter fed DTC scheme with modified switching table is proposed to
improve performance at low speed. However, it failed to consider other problems, such
as neutral point balance and voltage jump. In [2.47], the duration time, i.e. duty ratio of
the selected vector is obtained by solving the optimal value which will lead to minimum
torque ripple RMS during one period. In [2.48], the duty of the active vector in one
period can also be obtained from a fuzzy logic controller. However, the performance
improvement is quite limited. In [2.49], a band-constrained technique is proposed,
which aims at limiting the torque ripple to the hysteresis band, not the minimal RMS of
torque ripple. A completely different approach to achieve better performance has been
proposed in [2.50] and [2.51], which consists of replacing the hysteresis torque and flux
controllers with proportional–integral (PI) regulators and voltage modulators. However,
it reduces the simplicity of the classic DTC scheme.

Chapter 2. Literature Survey on PMSMs and Electrical Machine Control Strategies
22
Fig. 2.14 Development of DTC scheme
ClassicDTC
Variable switchingfrequency DTC
(Switch table basedDTC)
OptimalVector
Selection
Fuzzy Logic DTC
Neural Network DTC
Output Space RegulationDTC
Multilevel inverter
OptimalVectorDurationTime
Analytical calculation(torque ripple
minimization, meantorque control)
Fuzzy Logic Duty
Band constrained
Fixed SwitchingFrequency DTC
SpaceVector
ModulationDTC

Chapter 2. Literature Survey on PMSMs and Electrical Machine Control Strategies
23
2.3.4 Model predictive control
The linear PID-controllers used in electrical drive system were widely built with
analogue operational amplifiers and used the control deviation to generate the
commanding signal [2.52]. This type of controller does not include any knowledge of
the plant and this knowledge is only required for designing the controller. With the
availability of inexpensive microcomputers and digital control techniques in drive
system, the idea to precalculate the plant’s behaviour via a mathematic model and to
determine optimum values for the actuating variables from these pre- calculated values
was born, i.e. predictive control.
Considering the functional principles of the different predictive control algorithms, it
can be found that they can be classified into three main groups: hysteresis-based,
trajectory-based and model-based strategies.
The basic principle of hysteresis-based control strategies is to keep the value of the
controlled variable within a tolerance band or a tolerance area, the so-called hysteresis.
The simple form of such a controller is the well-known hysteresis or bang-bang
controller. Hysteresis-based strategies have the advantage that precise knowledge of the
drive system is not required. Even with possible model divergences the control error can
be kept within the specified limit band by the hysteresis controller. To achieve this, it
must always be ensured that the hysteresis controller reacts very quickly if the actual
value has gone outside of the hysteresis band. This is a major problem if the
hysteresis-based predictive controller is implemented in a digital processor, as the
detection of the reference signal crossing the hysteresis band will be done only during
the next sampling instant. At this time, it may happen that the error has grown to a large
value. Hence, hysteresis-based predictive control is more suitable when the realization
is done using analogue operational amplifier rather than microprocessor controllers.
The trajectory-based control methods are based on the principle to force the system onto
precalculated system trajectories. Once the system has been pushed onto one of these
trajectories, it remains there because of its own properties until a change is enforced
form outside. The trajectory-based control is based on a very precise prediction of the
Chapter 2. Literature Survey on PMSMs and Electrical Machine Control Strategies
24
future control system behaviour. Hence, in contrast to hysteresis controllers, controllers
of this type require an exact model of the system to be controlled. Because of the quite
complex pre-calculation of the system trajectories, these methods are better suited for
implementations in the form of digital controllers on microprocessors.
Both hysteresis and trajectory-based predictive controllers use the current system state
to precalculate the value of the controlled variable for the next sampling cycle. The past
is not explicitly taken into consideration as it is hidden in the actual system state.
Although there is a relationship between hysteresis and trajectory-based predictive
control algorithms, model-based strategies are based on completely different ideas.
Model-based predictive control methods are able to consider the past and to optimize
future values of the actuating variables, not only for the next sampling cycle, but also up
to a specified future cost or control horizon.
The model predictive control (MPC) is derived from a rather old approach whose rst
ideas were published more than 20 years ago [2.53] [2.54]. Its strategies are based on an
explicit and identi able model of the controlled system, which is used to precalculate
the behavior of the plant and to choose an optimal value of the control variables.
Because of the great computational power required by MPC, its implementation has
been formerly limited to slowly varying systems, such as chemical processes, in which
the time interval is long enough to process the complete control algorithm. As the
performance of the available computing hardware has rapidly increased and new faster
algorithms have been developed, it is now possible to implement MPC for fast systems
using shorter time steps.
MPC makes explicit use of the system mathematical model to predict the future
behaviour of the system. An optimal aim is defined and solved in MPC to obtain the
most appropriate control input. Similar to the nature of FOC and DTC, MPC can also be
classified into two categories: continuous MPC [2.55], [2.56] and finite control set MPC
(FCSMPC) [2.57], [2.58]. Like FOC, the continuous MPC also requires the use of
PWM or the concept of duty cycle, which fails to consider the discrete nature of the
converter. In contrast, FCSMPC evaluates the effects of each possible voltage vector
and the one that minimizes the error between the reference value and the feedback value

Chapter 2. Literature Survey on PMSMs and Electrical Machine Control Strategies
25
is selected. FCSMPC is similar to DTC in that they both directly select one and only
one voltage vector during one control period. Due to its intuitive concept and simple
principle, FCSMPC has been widely studied and applied to the control of power
converters and motor drives. FCSMPC can be categorized into two groups according to
the predictive horizon N [2.58], [2.59]. With a short predictive horizon of N = 1, the
calculation burden is relatively small and can be easily implemented in modern DSPs.
With a longer predictive horizon of N > 1, it is possible to obtain a better control
performance [2.59]. In [2.59], for a three-level inverter-fed DTC motor drive, a
predictive horizon greater than one is employed to obtain reduced switching frequency
whilst keeping the torque, flux, and neutral point potential within their respective
hysteresis bands.
Fig. 2.15 Finite control set MPC scheme
Delay compensation is an important issue in the implementation of FCSMPC [2.60],
[2.61]. It is widely recognized that there is a one-step delay between the commanding
voltage and the applied voltage, which means that the commanding voltage obtained at
any current instant will not be applied until the next instant. This delay is usually caused
by the update mechanism in DSP. The influence of one-step delay is especially serious
when the sampling frequency is low. As MPC uses the internal model to predict the
future behaviour of the system, it is natural to further use the predictive results to
eliminate the one-step delay, which is called a two-step prediction in [2.62].
For power converters and inverter-fed drives, it is desirable to reduce the switching
frequency to obtain reduced switching loss and higher efficiency [2.59], [2.60], [2.63].
However, so far the incorporation of switching frequency reduction in MPC for motor
drives is very rare. In [2.62], the application of MPC for the torque and flux control of
an induction motor drive is investigated, but the switching frequency reduction is not
addressed. Reference [2.61] considered the switching frequency reduction in a

Chapter 2. Literature Survey on PMSMs and Electrical Machine Control Strategies
26
three-level inverter fed induction motor drive by using hysteresis controllers. The
implementation is complex and requires the use of ASIC to accomplish the fast
computation requirement [2.64].
A cost function suitable for electrical machine drive systems was proposed by Kouro
and Cortes [2.65]. The cost function evaluates all predictions and the one with the
minimum cost is chosen. Then future control actions are implemented. In addition to
torque and stator flux, other control variables, such as switching frequency, efficiency
and spectrum shaping can also be included in the cost function. The priority of each
control variable is adjusted by weighting factors. This paper presents great ideas on
implementation of MPC. However, it lacks experimental results to verify the
effectiveness of the proposed method.
In [2.66], a guideline of the weighting factor design is presented, but it does not mention
any analytical or numerical solution. The weighting factors are still determined by
empirical methods.
In [2.67], Zhang and Zhu proposed a model-based predictive torque control (MPTC)
method for permanent magnet synchronous machine (PMSM) drive system. A linear
PMSM model is used in this paper, in order to reduce the computational cost as well as
maintain the accuracy. The one step delay compensation is considered and two
additional components are added to the cost function in order to improve the stability of
the system and reduce the switching frequency. The simulation test demonstrates the
effectiveness of the proposed method. However, it still needs further verification of the
experimental test.
2.3.5 Qualitative comparison of control methods
In general, the classic VC method can bring good performance to PMSM drive systems.
However, in order to control the drive system in real time, a high computational power
microprocessor is needed to perform complicated coordinate transformations. The
classic DTC method works with hysteresis controllers and a switching table to achieve
rapid response times and it is insensitive to machine parameter variations, whereas its

Chapter 2. Literature Survey on PMSMs and Electrical Machine Control Strategies
27
steady state performance is poor. In contrast, the MPC features both good dynamic and
steady state performance. The most attractive feature of the MPC is the great flexibility
of the cost function, i.e. the controllable variables such as torque ripple, switching
frequency and power loss can be included in the cost function.
The details of each control method are compared in Table 2-1.
Table 2-1 Qualitative comparison of control methods
Classic FOC Classic DTC MPC
Speed Estimation Encoder output Encoder output Encoder output
Speed Controller PI controller PI controller Cost function
definition
Flux-linkage
Estimation
N/A abc-to-
transformation
with Integration
abc-to-dq
transformation
Flux-linkage
Controller
N/A Hysteresis
controller
Cost function
definition
Current/Torque
Estimation
abc-to-dq
transformation
Calculation from
flux linkage and
currents
abc-to-dq
transformation
Current/Torque
Controller
PI controller Hysteresis
controller
Cost function
definition
Inverter Control PWM Look-up table Cost function
definition

Chapter 2. Literature Survey on PMSMs and Electrical Machine Control Strategies
28
2.4 Vector Control of PMSM
The vector control (VC) technique proposed by Blaschke [2.68] in 1971 was initially
developed for induction motor drives with the aim of optimising efficiency and dynamic
performance. Since its first proposal, the VC scheme has provided an interesting and
challenging innovation field to researchers and engineers. In the VC for PMSMs, the
stator current and voltage vectors are directly controlled in the dq reference frame.
These motor voltage and currents are processed by a series of reference frame
transformations to produce voltage control signals for control of the PWM output
modulator.
The main feature of vector-controlled PMSM drives is that the direction of the stator
flux vector is oriented with respect to the rotor d-axis by instantaneous control of the
amplitude and instantaneous direction of the stator current vector. In the VC scheme,
id=0, is=iq and =90° are the optimal choice for maximum torque per stator current
control of PMSM drives, where is the load angle between the rotor d-axis and stator
current vector is. Under these conditions, the voltage and current vectors are illustrated
in Fig. 2.15.
Fig. 2.16 Voltage and current vectors
For a PMSM under sinusoidal excitations, the original voltage equations can be
expressed in the stationary reference frame as the following
(2.1)
where , and are three-phase flux linkages, respectively.
Chapter 2. Literature Survey on PMSMs and Electrical Machine Control Strategies
29
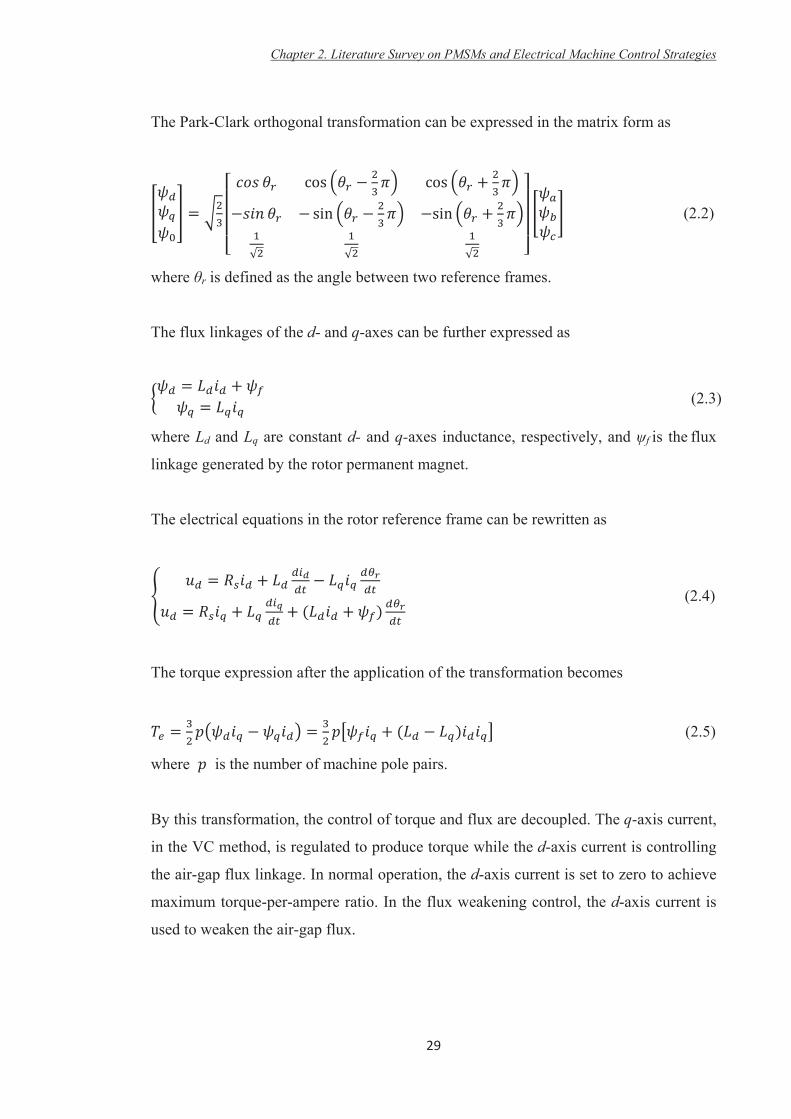
The Park-Clark orthogonal transformation can be expressed in the matrix form as
(2.2)
where r is defined as the angle between two reference frames.
The flux linkages of the d- and q-axes can be further expressed as
(2.3)
where Ld and Lq are constant d- and q-axes inductance, respectively, and f is the flux
linkage generated by the rotor permanent magnet.
The electrical equations in the rotor reference frame can be rewritten as
(2.4)
The torque expression after the application of the transformation becomes
(2.5)
where is the number of machine pole pairs.
By this transformation, the control of torque and flux are decoupled. The q-axis current,
in the VC method, is regulated to produce torque while the d-axis current is controlling
the air-gap flux linkage. In normal operation, the d-axis current is set to zero to achieve
maximum torque-per-ampere ratio. In the flux weakening control, the d-axis current is
used to weaken the air-gap flux.

Chapter 2. Literature Survey on PMSMs and Electrical Machine Control Strategies
30
Fig. 2.17 Block diagram of PMSM VC drive system
Fig. 2.16 shows the block diagram of the PMSM FOC drive system. The d-axis current
is set to zero while the q-axis current is controlled by a PI controller with the reference
speed. Then the reference voltage vector is sent to a PWM generator to control the
inverter.
2.5 Direct Torque Control of PMSM
In the DTC strategy, the flux linkage and torque are calculated in the two-phase stator
reference frame, i.e. the - frame, which is transferred from the three-phase a-b-c
reference frame by using the Clark transformation. The flux linkage components in -
frame can be calculated as
(2.6)
The torque observer can then be designed as
(2.7)
Fig. 2.17 shows the implementation diagram of the classic DTC scheme for the PMSM
drive. Two hysteresis controllers are applied to the flux linkage and torque control loops.
The calculated flux linkage is also sent to the switching table to identify the current flux
vector position. The switching table for controlling both the amplitude and rotating

direction
definitions
Ch
is shown i
s are illustra
*
*s
PI
Fig.
Table 2-2
Fig
apter 2. Litera
in Table 2-
ated in Fig.
*eT
2.18 Block
Switching t
g. 2.19 Volta
ature Survey o
3
-2, and the
2.18.
s
Switta
eT
T
s
k diagram o
table of clas
age vector a
on PMSMs an
31
e inverter v
Torque & fluestimation
tching able
*su
f PMSM D
ssic DTC sc
and spatial s
nd Electrical M
voltage vec
x
VSI(Z-1)
su
susi
TC drive sy
cheme for P
sector defin
Machine Cont
ctor and sp
PMSM
ystem
PMSM drive
nition
trol Strategies
atial sector
M
e
s
r

Chapter 2. Literature Survey on PMSMs and Electrical Machine Control Strategies
32
2.6 Conclusion
In this chapter, a thorough literature survey on PM machines and machine drive control
methods has been conducted. Firstly, the PM machines definition and classification
were introduced. The control strategies were then studied, including the six-step method,
vector control and direct torque control. The fundamentals and the state of the art of
each strategy were reviewed and reported improvements for each method were then
summarized.
REFERENCES
[2.1] M. A. Rahman and Q. Ruifeng, "A permanent magnet hysteresis hybrid
synchronous motor for electric vehicles," Industrial Electronics, IEEE
Transactions on, vol. 44, pp. 46-53, 1997.
[2.2] W. H. Kim, J. N. Bae, et al., "A study on 4-layer hybrid winding layout of the
IPMSM and location of the permanent magnets," in Electromagnetic Field
Computation (CEFC), 2010 14th Biennial IEEE Conference on, 2010, pp.
1-1.
[2.3] P. Pisek, B. Stumberger, et al., "Design and FE analysis of a double rotor
synchronous PM machine," in Electromagnetic Field Computation (CEFC),
2010 14th Biennial IEEE Conference on, 2010, pp. 1-1.
[2.4] Y. Liao, F. Liang, et al., "A novel permanent magnet motor with doubly
salient structure," in Industry Applications Society Annual Meeting, 1992.,
Conference Record of the 1992 IEEE, 1992, pp. 308-314 vol.1.
[2.5] K. T. Chau, J. Z. Jiang, et al., "A novel stator doubly fed doubly salient
permanent magnet brushless machine," Magnetics, IEEE Transactions on, vol.
39, pp. 3001-3003, 2003.
[2.6] X. Zhu and M. Cheng, "A novel stator hybrid excited doubly salient
permanent magnet brushless machine for electric vehicles," in Electrical
Machines and Systems, 2005. ICEMS 2005. Proceedings of the Eighth
International Conference on, 2005, pp. 412-415 Vol. 1.

Chapter 2. Literature Survey on PMSMs and Electrical Machine Control Strategies
33
[2.7] S. E. Rauch and L. J. Johnson, "Design Principles of Flux-Switch
Alternators," Power Apparatus and Systems, Part III. Transactions of the
American Institute of Electrical Engineers, vol. 74, pp. 1261-1268, 1955.
[2.8] E. Hoang, M. Lecrivain, et al., "A new structure of a switching flux
synchronous polyphased machine with hybrid excitation," in Power
Electronics and Applications, 2007 European Conference on, 2007, pp. 1-8.
[2.9] R. L. Owen, Z. Q. Zhu, et al., "Fault-Tolerant Flux-Switching Permanent
Magnet Brushless AC Machines," in Industry Applications Society Annual
Meeting, 2008. IAS '08. IEEE, 2008, pp. 1-8.
[2.10] Z. Q. Zhu, J. T. Chen, et al., "Analysis of a Novel Multi-Tooth
Flux-Switching PM Brushless AC Machine for High Torque Direct-Drive
Applications," Magnetics, IEEE Transactions on, vol. 44, pp. 4313-4316,
2008.
[2.11] A. Zulu, B. Mecrow, et al., "A wound-field three-phase flux-switching
synchronous motor with all excitation sources on the stator," in Energy
Conversion Congress and Exposition, 2009. ECCE 2009. IEEE, 2009, pp.
1502-1509.
[2.12] W. Xu; J. Zhu; Y. Zhang; Y. Guo and G. Lei; , "New Axial
Laminated-Structure Flux-Switching Permanent Magnet Machine With 6/7
Poles," Magnetics, IEEE Transactions on , vol.47, no.10, pp.2823-2826, Oct.
2011
[2.13] P. C. Krause, R. R. Nucera, R. J. Krefta, and O. Wasynczuk, "Analysis of a
Permanent Magnet Synchronous Machine Supplied from a 180° Inverter with
Phase Control," Energy Conversion, IEEE Transactions on, vol. EC-2, no. 3,
pp. 423-431, 1987.
[2.14] N. Sato, "A Study of Commutatorless Motor," Elec. Eng. Jap., vol. 84, pp.
42-51, 1964.
[2.15] A. H. Hoffmann, "Brushless Synchronous Motors for Large Industrial
Drives," Industry and General Applications, IEEE Transactions on, vol.
IGA-5, no. 2, pp. 158-162, 1969.
Chapter 2. Literature Survey on PMSMs and Electrical Machine Control Strategies
34
[2.16] P. A. Studer, "Development of Brushless DC Motors for Space Applications,"
NASA TN-D-2108, Feb. 1964.
[2.17] S. Murugesan, "An Overview of Electric Motors for Space Applications,"
Industrial Electronics and Control Instrumentation, IEEE Transactions on, vol.
IECI-28, no. 4, pp. 260-265, 1981.
[2.18] T. Kenjo and S. Nagamori, Permanent-Magnet and Brushless DC Motors.
New York: Oxford University Press, 1985.
[2.19] S. D. Sudhoff and P. C. Krause, "Average-value Model of the Brushless DC
120° inverter system," Energy Conversion, IEEE Transactions on, vol. 5, no.
3, pp. 553-557, 1990.
[2.20] H. Le-Huy, R. Perret, and R. Feuillet, "Minimization of Torque Ripple in
Brushless DC Motor Drives," Industry Applications, IEEE Transactions on,
vol. IA-22, no. 4, pp. 748-755, 1986.
[2.21] F. Blaschke, "Das Prizip der Feldorientierung, die Grundlage far die
TRANSVEKTOR-Regerung von Drehfeldmaschinen," Siemens-Zeitschrift,
vol. 45, pp. 757-760, Oct, 1971.
[2.22] R. H. Park, "Definition of an Ideal Synchronous Machine and Formula for the
Armature Flux Linkages," General Electric Review, vol. 31, p. 332, 1928.
[2.23] R. H. Park, "Two-Reaction Theory of Synchronous Machines Generalized
Method of Analysis: Part I," American Institute of Electrical Engineers,
Transactions of the, vol. 48, pp. 716-727, 1929.
[2.24] G. Pfaff, A. Weschta, et al., "Design and Experimental Results of a Brushless
AC Servo Drive," Industry Applications, IEEE Transactions on, vol. IA-20,
pp. 814-821, 1984.
[2.25] M.F Rahman, T.S. Low and L.B. Wee, “Development of a digitally controlled
permanent magnet brushless DC drive system”, Proceedings of the IEEE
Conference on Applied Control, 1986, pp. 283-288.
[2.26] B.K. Bose, and P.M. Szczesny, “A microcomputer-based control and
simulation of an advanced IPM synchronous machine dreive system for
Chapter 2. Literature Survey on PMSMs and Electrical Machine Control Strategies
35
electric vehicle propulsion”, IEEE Transactions on Industrial Electronics, Vol.
35, No. 4, Nov. 1988, pp. 547-559.
[2.27] N. Matsui and H. Ohashi, “ DSP-based adaptive control of a brushless motor”,
Conference Record of the 1988 IEEE IAS Annual Meeting, Vol. 1, Oct. 2-7,
1988, pp. 375-380.
[2.28] C. Allen and P. Pillay, “TMS320 design for vector and current control of AC
motor drives”, Electronics Letters, Vol. 28, No. 23, Nov. 5, 1992, pp.
2188-2190.
[2.29] J. Boldea and A. Nasar, “Vector control of AC machines’, CRC Press,
ISBN/ISSN 0849344085, 1992.
[2.30] C. Cecati, F. Parasiliti, and M. Tursini, “Multicomputer-based speed control
of permanent magnet synchronous motor drives’, Proceedings of the 1992
International Conference on Iddustrial Electronics, Control, Instrumentation,
and Automation (Power Electronics and Motion Control), Vol. 1, Nov. 9-13,
1992. Pp. 101-106.
[2.31] N. Bennett, J. Wang, D.W. Shimmin, and K.J. Binns, “A new vector control
scheme for an adjustable sped AC drive system utlising a high field
permanent magnet synchronous machine”, Proceedings of the Sixth
International Conference on Electrical Machines and Drives, (Conf. Publ. No.
376), Sep. 8-10, 1993, pp. 121-126.
[2.32] Bolognani, S. and Zigliotto, M., "A space-vector approach to the analysis and
design of three-phase current controllers," Industrial Electronics, 2002. ISIE
2002. Proceedings of the 2002 IEEE International Symposium on , vol.2, no.,
pp. 645- 650 vol.2, 2002
[2.33] Takahashi and T. Noguchi, "A New Quick-Response and High-Efficiency
Control Strategy of an Induction Motor," Industry Applications, IEEE
Transactions on, vol. IA-22, pp. 820-827, 1986.
[2.34] U. Baader, M. Depenbrock, et al., "Direct self control (DSC) of inverter-fed
induction machine: a basis for speed control without speed measurement,"
Industry Applications, IEEE Transactions on, vol. 28, pp. 581-588, 1992.

Chapter 2. Literature Survey on PMSMs and Electrical Machine Control Strategies
36
[2.35] C. French and P. Acarnley, "Direct torque control of permanent magnet
drives," Industry Applications, IEEE Transactions on, vol. 32, pp. 1080-1088,
1996.
[2.36] M. F. Rahman and L. Zhong, "Comparison of torque responses of the interior
permanent magnet motor under PWM current and direct torque controls," in
Industrial Electronics Society, 1999. IECON '99 Proceedings. The 25th
Annual Conference of the IEEE, 1999, pp. 1464-1470 vol.3.
[2.37] P. Vas, "Sensorless Vector and Direct Torque Control," Oxford, UK: Oxford
University Press, 1998.
[2.38] M. P. K. a. H. Tunia, "Automatic Control of Converter-fed Drives,"
Amsterdam, the Netherlands: Elsevier, 1994.
[2.39] A. Bouafia, F. Krim, et al., "Fuzzy-Logic-Based Switching State Selection for
Direct Power Control of Three-Phase PWM Rectifier," Industrial Electronics,
IEEE Transactions on, vol. 56, pp. 1984-1992, 2009.
[2.40] X. Yang and W. Oghanna, "Fuzzy direct torque control of induction motor
with stator flux estimation compensation," in Industrial Electronics, Control
and Instrumentation, 1997. IECON 97. 23rd International Conference on,
1997, pp. 505-510 vol.2.
[2.41] S. A. Mir, M. E. Elbuluk, et al., "Fuzzy implementation of direct self-control
of induction machines," Industry Applications, IEEE Transactions on, vol. 30,
pp. 729-735, 1994.
[2.42] L. A. Cabrera, M. E. Elbuluk, et al., "Learning techniques to train neural
networks as a state selector for inverter-fed induction machines using direct
torque control," Power Electronics, IEEE Transactions on, vol. 12, pp.
788-799, 1997.
[2.43] G. Escobar, A. M. Stankovic, et al., "A family of switching control strategies
for the reduction of torque ripple in DTC," Control Systems Technology, IEEE
Transactions on, vol. 11, pp. 933-939, 2003.
[2.44] R. Ortega, N. Barabanov, et al., "Direct torque control of induction motors:

Chapter 2. Literature Survey on PMSMs and Electrical Machine Control Strategies
37
stability analysis and performance improvement," Automatic Control, IEEE
Transactions on, vol. 46, pp. 1209-1222, 2001.
[2.45] M. A. M. Prats, G. Escobar, et al., "A switching control strategy based on
output regulation subspaces for the control of induction motors using a
three-level inverter," Power Electronics Letters, IEEE, vol. 1, pp. 29-32,
2003.
[2.46] K. B. Lee, J. H. Song, et al., "Improvement of low-speed operation
performance of DTC for three-level inverter-fed induction motors," Industrial
Electronics, IEEE Transactions on, vol. 48, pp. 1006-1014, 2001.
[2.47] Jun-Koo and S. Seung-Ki, "New direct torque control of induction motor for
minimum torque ripple and constant switching frequency," Industry
Applications, IEEE Transactions on, vol. 35, pp. 1076-1082, 1999.
[2.48] L. Romeral, A. Arias, et al., "Novel direct torque control (DTC) scheme with
fuzzy adaptive torque-ripple reduction," Industrial Electronics, IEEE
Transactions on, vol. 50, pp. 487-492, 2003.
[2.49] V. Ambrozic, G. S. Buja, et al., "Band-constrained technique for direct torque
control of induction motor," Industrial Electronics, IEEE Transactions on, vol.
51, pp. 776-784, 2004.
[2.50] C. Lascu and A. M. Trzynadlowski, "Combining the principles of sliding
mode, direct torque control, and space vector modulation in a
high-performance sensorless AC drive," in Industry Applications Conference,
2002. 37th IAS Annual Meeting. Conference Record of the, 2002, pp.
2073-2079 vol.3.
[2.51] Yen-Shin and C. Jian-Ho, "A new approach to direct torque control of
induction motor drives for constant inverter switching frequency and torque
ripple reduction," Energy Conversion, IEEE Transaction on, vol. 16, pp.
220-227, 2001.
[2.52] R. K. A. Linder, R. Kennel, and P. Stolze, "Model-Based Predictive Control of
Electric Drives," Germany: Cuvillier Verlag, 2010.

Chapter 2. Literature Survey on PMSMs and Electrical Machine Control Strategies
38
[2.53] D. W. Clarke, C. Mohtadi, and P. S. Tuffs, “Generalized predictive control –
part I. the basic algorithm,” Automatica, vol. 23, pp.137–148, 1987.
[2.54] C. E. Garcia, D. M. Prett, and M. Morari, “Model Predictive Control: Theory
and practice – a survey,” Automatica, vol. 25, pp. 335–348, 1989
[2.55] P. Cortes, M. Kazmierkowski, R. Kennel, D. Quevedo, and J. Rodriguez,
“Predictive control in power electronics and drives,” IEEE Trans. Ind.
Electron., vol. 55, no. 12, pp. 4312 –4324, Dec. 2008.
[2.56] A. Beccuti, S. Mariethoz, S. Cliquennois, S. Wang, and M. Morari, “Explicit
model predictive control of dc-dc switched-mode power supplies with
extended kalman filtering,” IEEE Trans. Ind. Electron., vol. 56, no. 6, pp. 1864
–1874, June 2009.
[2.57] S. Kouro, P. Cortes, R. Vargas, U. Ammann, and J. Rodriguez, “Model
predictive control—a simple and powerful method to control power converters,”
IEEE Trans. Ind. Electron., vol. 56, no. 6, pp. 1826 –1838, June 2009.
[2.58] J. Rodriguez, R. M. Kennel, J. R. Espinoza, M. Trincado, C. A. Silva, and C. A.
Rojas, “High-performance control strategies for electrical drives: An
experimental assessment,” IEEE Trans. Ind. Electron., vol. 59, no. 2, pp. 812–
820, 2012.
[2.59] T. Geyer, G. Papafotiou, and M. Morari, “Model predictive direct torque
control -part I: Concept, algorithm, and analysis,” IEEE Trans. Ind. Electron.,
vol. 56, no. 6, pp. 1894 –1905, june 2009.
[2.60] Y. Zhang, J. Zhu, and W. Xu, “Predictive torque control of permanent magnet
synchronous motor drive with reduced switching frequency,” in Proc. Int
Electrical Machines and Systems (ICEMS) Conf, 2010, pp. 798–803.
[2.61] P. Cortes, J. Rodriguez, C. Silva, and A. Flores, “Delay compensation in model
predictive current control of a three-phase inverter,” IEEE Trans. Ind. Electron.,
vol. 59, no. 2, pp. 1323–1325, 2012.
[2.62] H. Miranda, P. Cortes, J. Yuz, and J. Rodriguez, “Predictive torque control of
induction machines based on state-space models,” IEEE Trans. Ind. Electron.,
Chapter 2. Literature Survey on PMSMs and Electrical Machine Control Strategies
39
vol. 56, no. 6, pp. 1916 –1924, June 2009.
[2.63] R. Vargas, P. Cortes, U. Ammann, J. Rodriguez, and J. Pontt, “Predictive
control of a three-phase neutral-point-clamped inverter,” IEEE Trans. Ind.
Electron., vol. 54, no. 5, pp. 2697 –2705, Oct. 2007.
[2.64] G. Papafotiou, J. Kley, K. Papadopoulos, P. Bohren, and M. Morari, “Model
predictive direct torque control-part II: Implementation and experimental
evaluation,” IEEE Trans. Ind. Electron., vol. 56, no. 6, pp. 1906 –1915, June
2009.
[2.65] S. Kouro, P. Cortes, et al., "Model Predictive Control: A Simple and Powerful
Method to Control Power Converters," Industrial Electronics, IEEE
Transactions on, vol. 56, pp. 1826-1838, 2009.
[2.66] P. Cortes, S. Kouro, et al., "Guidelines for weighting factors design in Model
Predictive Control of power converters and drives," in Industrial Technology,
2009. ICIT 2009. IEEE International Conference on, 2009, pp. 1-7.
[2.67] Y. Zhang, J. Zhu, et al., "Predictive torque control of permanent magnet
synchronous motor drive with reduced switching frequency," in Electrical
Machines and Systems (ICEMS), 2010 International Conference on, 2010, pp.
798-803.
[2.68] F. Blaschke, "Das Prizip der Feldorientierung, die Grundlage far die
TRANSVEKTOR-Regerung von Drehfeldmaschinen," Siemens-Zeitschrift, vol.
45, pp. 757-760, Oct. 1971.
Chapter 3. Model Predictive Control of Permanent Magnet Synchronous Machines
40
CHAPTER 3
MODEL PREDICTIVE CONTROL OF PERMANENT MAGNET
SYNCHRONOUS MACHINES
3.1 Introduction
The field oriented control (FOC) and direct torque control (DTC) are the two most
popular control approaches for the control of permanent magnet synchronous machines
(PMSMs) [3.1]-[3.5]. In FOC, the inverter plus pulse width modulation (PWM) is
considered as a gain with delay in the controller design [3.6]. Although good
performance can be achieved by FOC, it requires synchronous rotary transformation and
the dynamic response is limited by the bandwidth of the inner current loop. Furthermore,
the cascaded structure of FOC requires a lot of tuning to achieve good a performance
over the whole operating range. DTC eliminates the use of PWM and takes the discrete
nature of the inverter into account. By directly manipulating the final output voltage
vector without the need for inner current loops, the inherent delay caused by current
loops is removed and a quick dynamic response is achieved [3.7]-[3.9]. Since all
calculations are implemented in stationary coordinate, the structure of DTC is simple.
Despite the above merits, the conventional switching-table-based DTC (ST-DTC) also
presents some notable drawbacks, such as high torque and flux ripples, variable
switching frequency and excessive acoustic noise.
Recently, the model predictive control (MPC) has emerged as an alternative high
performance control strategy and is drawing wide attention in both academic and
industry communities [3.10]-[3.20]. In fact, MPC has been known for several decades
and the first paper regarding the application of MPC in power converters appeared in
the 1980s [3.10]. Due to the high computational burden, MPC was mainly applied in the
chemical process industry. The development of powerful digital signal processors (DSPs)
and micro-controllers has it become possible to use MPC in the area of power

electronic
3.2 Model
The mathe
analysis, i
machine in
the machin
and the me
The conve
sinusoidal
strategies.
a rotating
simplify t
neglected.
For a PM
each phas
of electric
using the
input volta
Fig. 3-1 sh
Ch
s and drives
l of PMSM
ematical mo
is usually o
nput and ou
ne paramet
echanical p
entional PM
l back emf
It was first
reference
the magneti
.
MSM, it is a
e has the sa
cally excite
per phase
age signal a
hows the pe
Fig
hapter 3. Mod
s.
Ms
odel of a m
one or sev
utput variab
ers. This re
rocesses in
MSM model
f, which is
tly derived
frame to ac
ic propertie
assumed tha
ame parame
ed synchron
voltage equ
and the mac
er phase equ
g. 3.1 Per ph
del Predictive
4
machine, in
eral equatio
bles is analy
elationship c
the device
l described
widely us
in a station
chieve field
es in the m
at the three
eter. The ele
nous machi
uation, in w
chine electri
uivalent circ
hase equival
Control of Pe
41
terms of co
ons, in wh
ytically expr
could be ge
[3.21].
in this sect
sed for dev
nary referen
d control. L
model and t
-phase stato
ectrical mod
ines (SM)
which the p
ical paramet
cuit of tradit
lent circuit d
rmanent Mag
ontroller de
ich the rela
ressed, mos
nerally clas
tor was orie
velopment o
nce frame an
Linear assum
the nonline
or windings
del of the d
and it is n
phase curren
ters, i.e. resi
tional SMs.
diagram for
gnet Synchron
esign and p
ationship b
st of the tim
ssified as th
ented for PM
of the mac
nd then tran
mptions we
ear saturatio
s are symm
device is sim
normally ex
nt is a func
istance and
.
r SM
ous Machines
performance
between the
me, by using
he electrical
MSMs with
chine drive
nsformed to
ere made to
on effect is
metrical and
milar to that
xpressed by
ction of the
d inductance
s
e
e
g
l
h
e
o
o
s
d
t
y
e
e.

Chapter 3. Model Predictive Control of Permanent Magnet Synchronous Machines
42
It is different from the electrically excited SM in that the emf in PMSM is induced by
the permanent magnets fixed on the rotor and it is related to the magnet rotating speed.
Therefore, the per phase flux linkage is always utilized to express the machine electrical
equation. The voltage equation for the stator phase can be expressed as
(3.1)
where is the stator phase voltage, the stator phase current, the stator
resistance, and the phase flux linkage.
By assuming the flux linkage is contributed by both the three-phase stator currents and
the rotating magnet, the PMSM model in stationary reference frame can be derived as
(3.2)
where , and are the three-phase voltage, , and the three-phase
current, , and the three-phase flux linkage, and is the
inductance matrix, including both the self- and mutual-inductances.
The last part in (3.2) is usually defined as the back emf of the machine and it can be
found that the emf values are proportional to the rotating speed.
In order to decouple the control of flux and torque, the two-phase orthogonal reference
frame in stationary and rotation are developed ( - and d-q reference frames). Fig. 3.2
shows the spatial vector relationship between these reference-frames, where is defined
as the angle between the stationary and rotating frames.

The transf
which are
Therefore
using d-q
could be e
By substit
Ch
Fig. 3
formations
Park and C
, the machi
reference f
expressed as
tuting (3.5)
hapter 3. Mod
3.2 Relation
applied to
Clark transfo
ine electric
frame varia
s
into (3.1), a
del Predictive
4
nship betwe
convert the
orms [3.22],
cal variables
ables. The v
a simplified
Control of Pe
43
een different
e variables
, are defined
s in station
voltage, cur
d expression
rmanent Mag
t reference f
between th
d as
nary form c
rrent and flu
n can be obta
gnet Synchron
frames
hese referen
could be ex
lux linkage
ained.
ous Machines
nce-frames,
(3.3
(3.4
xpressed by
of phase a
(3.5)
(3.6
s
,
3)
4)
y
a
6)

Chapter 3. Model Predictive Control of Permanent Magnet Synchronous Machines
44
This equation should be satisfied for any value of . Therefore, the following d-q axes
voltage equations are always valid.
(3.7)
In the conventional machine model, the d- and q-axes flux linkages are usually defined
as
(3.8)
where and are the inductance of d- and q-axes, respectively, and is the flux
linkage generated by the permanent magnet.
It can be found that the q-axis flux linkage is produced by the q-axis stator current only.
Along the d-axis, the flux linkage is produced by both the d-axis stator current and the
permanent magnet on the rotor. The electrical model in (3.7) can be rewritten as (3.9)
and the equivalent circuit in d-q reference frame is shown in Fig. 3.3.
(3.9)
When the machine operates as a motor, the total input power of the device can be
expressed by using three-phase terminal voltages and currents, which can also be
transferred to the d-q rotating reference frame.
(3.10)
(3.11)

By substit
composite
By elimin
electromec
where
and is t
Ch
Fig. 3.
tuting (3.9)
e function o
nating the te
chanical po
is the roto
the number
hapter 3. Mod
3 PMSM eq
) in (3.11),
f the d-q ax
erms of the
ower becom
or mechanic
of poles
del Predictive
4
(
(
quivalent ci
the input t
xis currents.
copper loss
mes
cal speed co
Control of Pe
45
(a)
(b)
ircuits in (a)
total power
ses and the
nverted from
rmanent Mag
) d-, and (b)
r expression
variation o
m the electr
gnet Synchron
) q-axes
n can be d
of magnetic
rical speed
ous Machines
erived as a
(3.12
energy, the
(3.13
(3.14
s
a
2)
e
3)
4)

Chapter 3. Model Predictive Control of Permanent Magnet Synchronous Machines
46
For the mechanical equation of the model, we have
(3.15)
where is the load torque applied on the rotor shaft, the inertia of the motor, and
the shaft friction coefficient.
By dividing the electromagnetic power by the rotor mechanical speed, the
electromagnetic torque expression can be obtained. In this model, the damping effects
are ignored because there are no damping windings in the PMSMs. The electromagnetic
torque is expressed as
(3.16)
By substituting (3.8) into (3.16)
(3.17)
where is the electrical angle between stator- and rotor-flux vectors.
As shown, the electromagnetic torque is composed of two parts: the permanent-magnet
torque and the reluctance torque caused by the rotor saliency.
For a surface-mounted PMSM without saliency, the d- and q-axis inductances are equal
to the synchronous inductance, i.e. Ld = Lq = Ls. The torque does not include the
reluctance torque and can be simplified as

Chapter 3. Model Predictive Control of Permanent Magnet Synchronous Machines
47
(3.18)
The voltage and stator-flux equations can also be simplified similarly.
In the stationary frame (the components indicated by ), they can be expressed using a
complex vector as
(3.19)
(3.20)
where and the torque in the stationary frame is expressed as
(3.21)
3.3 Model Predictive Control of PMSM
The principle of model predictive control (MPC) was introduced for industrial control
applications in the 1970s after the publication of this strategy in the 1960s. The MPC
requires great computational effort and it has been formerly limited to slowly varying
systems, as chemical processes. With the availability of inexpensive high computing
power microcomputers and modern digital control techniques, MPC is able to be
applied to the electrical drive system.
Different from the employment of hysteresis comparators and the switching table in
conventional DTC, the principle of vector selection in MPC is based on evaluating a
defined cost function. The selected voltage vector from the conventional switching table
in DTC may not necessarily be the best one for the purposes of torque and flux ripple
reduction. Since there are limited discrete voltage vectors in the two-level inverter-fed
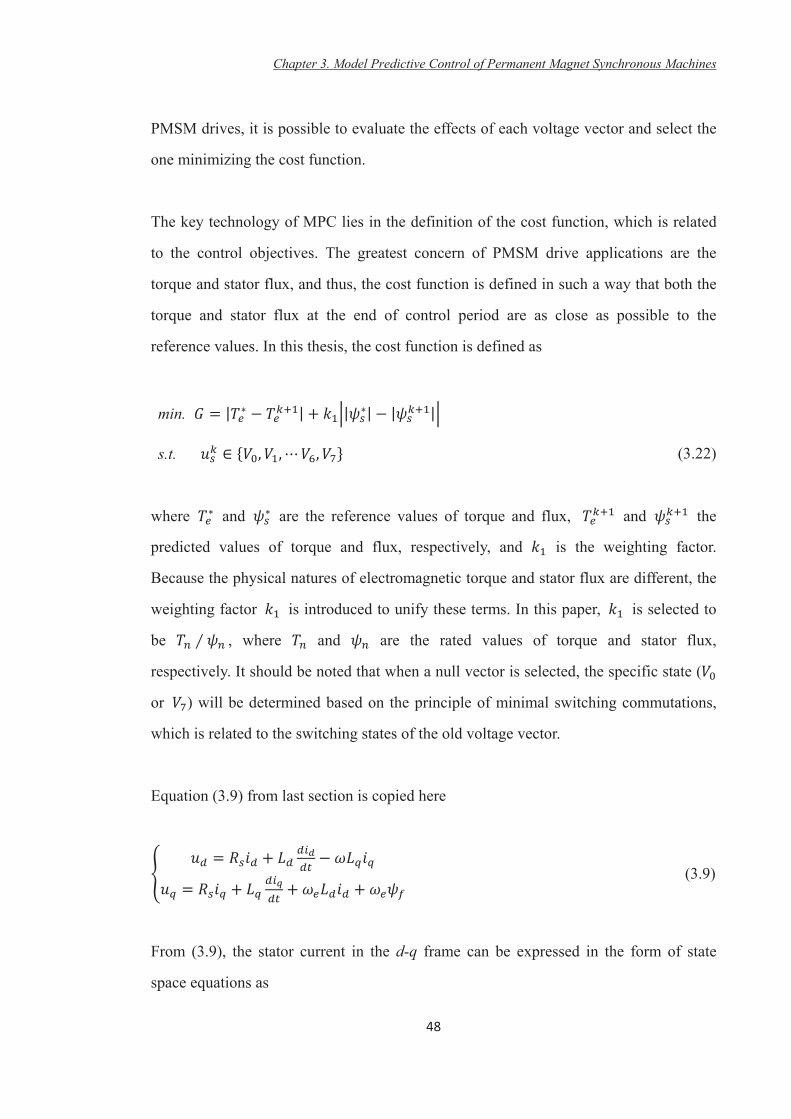
Chapter 3. Model Predictive Control of Permanent Magnet Synchronous Machines
48
PMSM drives, it is possible to evaluate the effects of each voltage vector and select the
one minimizing the cost function.
The key technology of MPC lies in the definition of the cost function, which is related
to the control objectives. The greatest concern of PMSM drive applications are the
torque and stator flux, and thus, the cost function is defined in such a way that both the
torque and stator flux at the end of control period are as close as possible to the
reference values. In this thesis, the cost function is defined as
min.
s.t. (3.22)
where and are the reference values of torque and flux, and the
predicted values of torque and flux, respectively, and is the weighting factor.
Because the physical natures of electromagnetic torque and stator flux are different, the
weighting factor is introduced to unify these terms. In this paper, is selected to
be , where and are the rated values of torque and stator flux,
respectively. It should be noted that when a null vector is selected, the specific state (
or ) will be determined based on the principle of minimal switching commutations,
which is related to the switching states of the old voltage vector.
Equation (3.9) from last section is copied here
(3.9)
From (3.9), the stator current in the d-q frame can be expressed in the form of state
space equations as
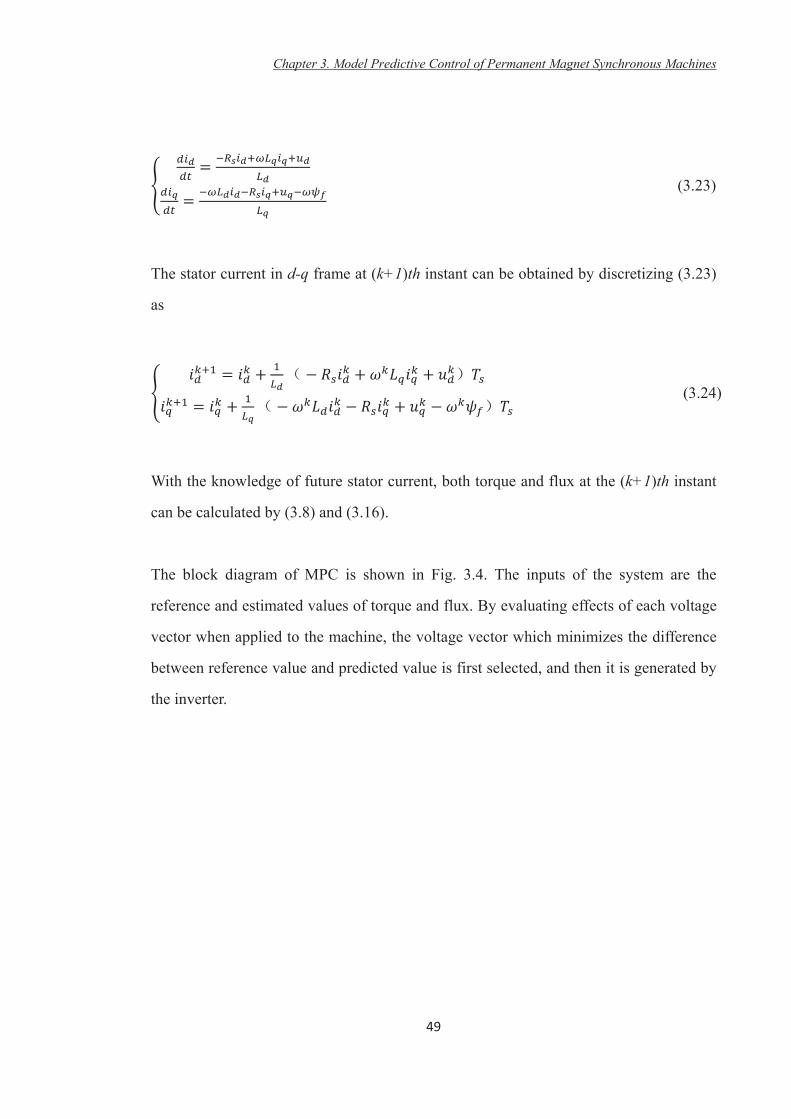
Chapter 3. Model Predictive Control of Permanent Magnet Synchronous Machines
49
(3.23)
The stator current in d-q frame at (k+1)th instant can be obtained by discretizing (3.23)
as
(3.24)
With the knowledge of future stator current, both torque and flux at the (k+1)th instant
can be calculated by (3.8) and (3.16).
The block diagram of MPC is shown in Fig. 3.4. The inputs of the system are the
reference and estimated values of torque and flux. By evaluating effects of each voltage
vector when applied to the machine, the voltage vector which minimizes the difference
between reference value and predicted value is first selected, and then it is generated by
the inverter.

Chapter 3. Model Predictive Control of Permanent Magnet Synchronous Machines
50
Fig. 3.4 Block diagram of MPC drive system

Chapter 3. Model Predictive Control of Permanent Magnet Synchronous Machines
51
3.3.1 One-step delay compensation
The cost function in (3.22) assumes that all calculations and judgments are implemented
at the kth instant and the selected vector will be applied immediately. However, in
practical digital implementation, this assumption is not true and the applied voltage
vector is not applied until the (k+1)th instant.
In other words, for the duration between the kth and (k+1)th instants, the applied rotor
voltage vector has been decided by the value in the (k 1)th instant and the
evolutions of and for this duration are uncontrollable. What is left to be
decided is actually the stator voltage vector , which is applied at the beginning of
the (k+1)th instant. To eliminate this one step delay, the variables of and
should be used rather than and for the evaluation of the cost function in
(3.22). This fact is clearly illustrated in Fig. 3-5, where x indicates the state variables of
a dynamic system and u is the input to be decided. For PMSM, x represents torque or
stator flux value.
To eliminate the one-step delay in digital implementation, the cost function in (3.22)
should be changed to (3.25) as shown below
min.
s.t. (3.25)

Chapter 3. Model Predictive Control of Permanent Magnet Synchronous Machines
52
Fig. 3.5 One-step delay in digital control systems
Obtaining and in (3.25) requires a two-step prediction. The variables at the
(k+1)th instant have been obtained using (3.24), (3.8) and (3.16), where is a known
variable. To obtain the best voltage vector minimizing the cost function in (3.25), each
possible configuration for will be evaluated to obtain the value at the (k+2)th
instant. The predictive model is the same as in (3.24), (3.8) and (3.16), except that the
variables in the right side are replaced by the value at the (k+1)th instant.
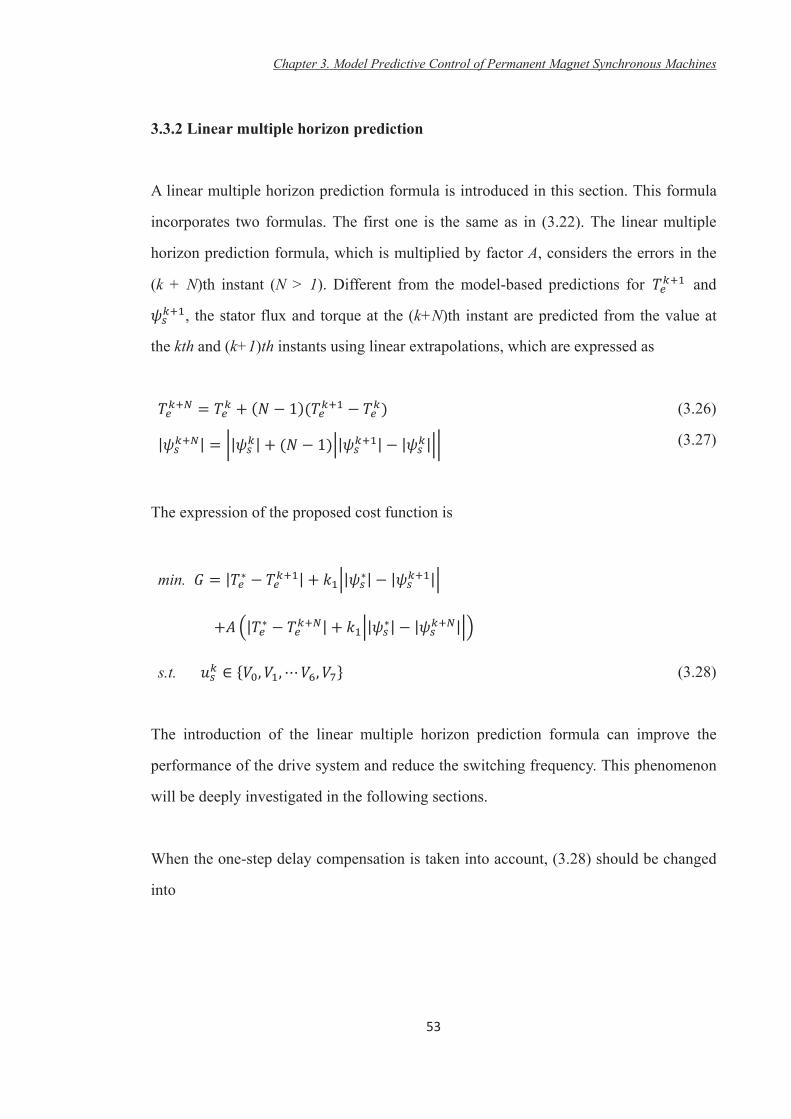
Chapter 3. Model Predictive Control of Permanent Magnet Synchronous Machines
53
3.3.2 Linear multiple horizon prediction
A linear multiple horizon prediction formula is introduced in this section. This formula
incorporates two formulas. The first one is the same as in (3.22). The linear multiple
horizon prediction formula, which is multiplied by factor A, considers the errors in the
(k + N)th instant (N > 1). Different from the model-based predictions for and
, the stator flux and torque at the (k+N)th instant are predicted from the value at
the kth and (k+1)th instants using linear extrapolations, which are expressed as
(3.26)
(3.27)
The expression of the proposed cost function is
min.
s.t. (3.28)
The introduction of the linear multiple horizon prediction formula can improve the
performance of the drive system and reduce the switching frequency. This phenomenon
will be deeply investigated in the following sections.
When the one-step delay compensation is taken into account, (3.28) should be changed
into
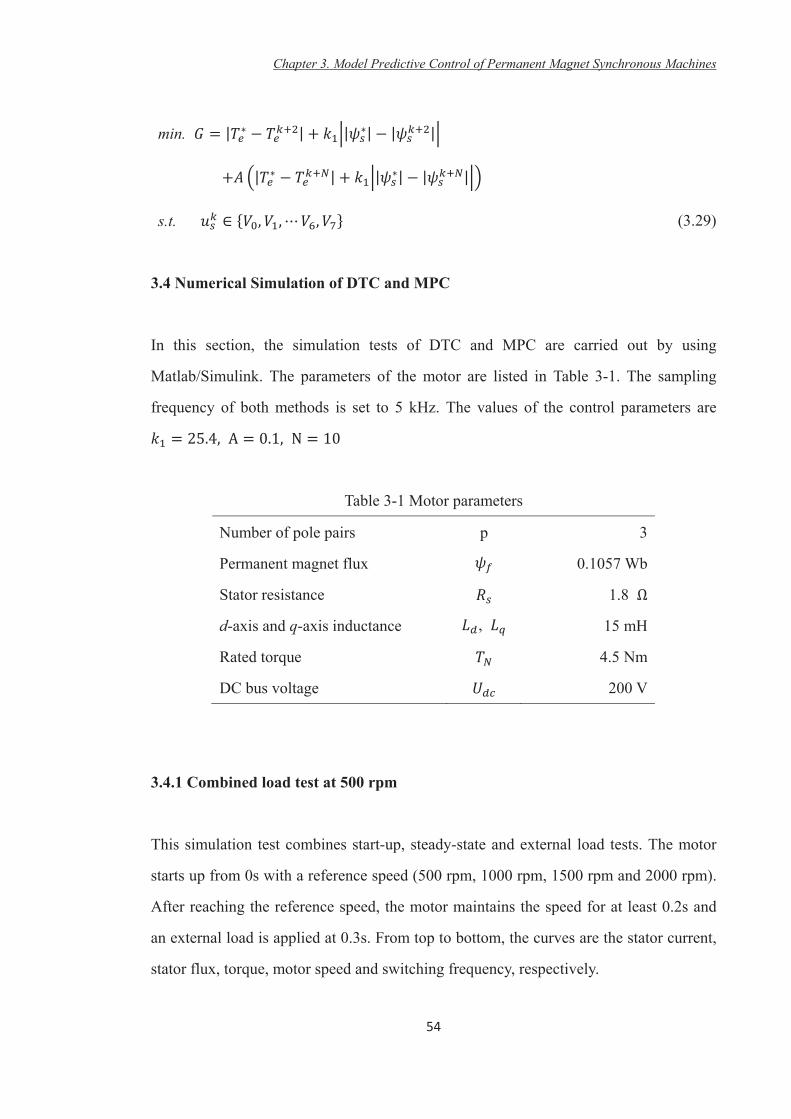
Chapter 3. Model Predictive Control of Permanent Magnet Synchronous Machines
54
min.
s.t. (3.29)
3.4 Numerical Simulation of DTC and MPC
In this section, the simulation tests of DTC and MPC are carried out by using
Matlab/Simulink. The parameters of the motor are listed in Table 3-1. The sampling
frequency of both methods is set to 5 kHz. The values of the control parameters are
Table 3-1 Motor parameters
Number of pole pairs p 3
Permanent magnet flux 0.1057 Wb
Stator resistance 1.8
d-axis and q-axis inductance , 15 mH
Rated torque 4.5 Nm
DC bus voltage 200 V
3.4.1 Combined load test at 500 rpm
This simulation test combines start-up, steady-state and external load tests. The motor
starts up from 0s with a reference speed (500 rpm, 1000 rpm, 1500 rpm and 2000 rpm).
After reaching the reference speed, the motor maintains the speed for at least 0.2s and
an external load is applied at 0.3s. From top to bottom, the curves are the stator current,
stator flux, torque, motor speed and switching frequency, respectively.

Chapter 3. Model Predictive Control of Permanent Magnet Synchronous Machines
55
The recorded data from 0.1s to 0.3s is picked to calculate the torque and flux ripples
(obtained by standard deviations). The torque and flux ripples of these control methods
will be summarized in tables in Section 3.6. A segment (three periods) of the stator
current of phase A is used to calculate the total harmonic distortion (THD) and current
harmonic spectrum.
Fig. 3.6 Combined load test for DTC at 500 rpm: (a) start-up, steady-state and external
load test, and (b) stator current harmonic spectrum
0246
Te/N
m
0.10.15
0.2
0.05
Phi/W
b
0 0.1 0.2 0.3 0.4 0.50
2000
4000
t/s
fs/H
z
-10
0
10
ia/A
Classic DTC
0 1000 2000 3000 4000 5000 60000
1
2
3
4
5
Frequency (Hz)
Fundamental (25Hz) = 4.237 , THD= 26.22%M
ag (%
of F
unda
men
tal)
0.4 0.42 0.44 0.46 0.48 0.5 0.52
-5
-10
0
5
10
ia/A
t/s
0500
100015002000
Spee
d/rp
m
(a) (b)

Chapter 3. Model Predictive Control of Permanent Magnet Synchronous Machines
56
Fig. 3.7 Combined load test for MPC at 500 rpm: (a) start-up, steady-state and external
load test, and (b) stator current harmonic spectrum
Fig. 3.8 Combined load test for MPC with one-step delay compensation at 500 rpm: (a)
start-up, steady-state and external load test, and (b) stator current harmonic spectrum
0246
Te/N
m
0.10.15
0.2
0.05
Phi/W
b
0 0.1 0.2 0.3 0.4 0.50
2000
4000
t/s
fs/H
z-10
0
10
ia/A
MPC
0 1000 2000 3000 4000 5000 60000
1
2
3
4
5
Frequency (Hz)
Fundamental (25Hz) = 4.554 , THD= 17.83%
Mag
(% o
f Fun
dam
enta
l)
0.4 0.42 0.44 0.46 0.48 0.5 0.52
-5
-10
0
5
10
ia/A
t/s
0500
100015002000
Spee
d/rp
m
(a) (b)
0246
Te/N
m
0.10.15
0.2
0.05
Phi/W
b
0 0.1 0.2 0.3 0.4 0.50
2000
4000
t/s
fs/H
z
-10
0
10
ia/A
MPC + comp
0 1000 2000 3000 4000 5000 60000
1
2
3
4
5
Frequency (Hz)
Fundamental (25Hz) = 4.573 , THD= 6.94%
Mag
(% o
f Fun
dam
enta
l)
0.4 0.42 0.44 0.46 0.48 0.5 0.52
-5
-10
0
5
10
ia/A
t/s
0500
100015002000
Spee
d/rp
m
(b)(a)
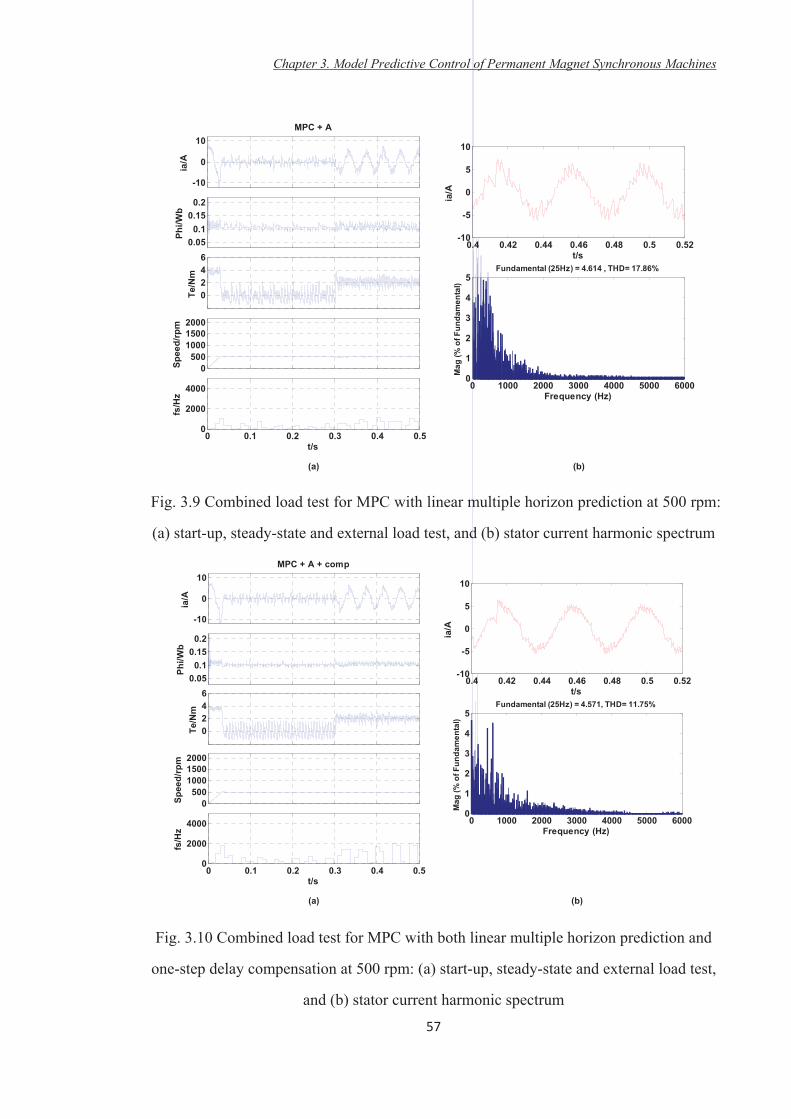
Chapter 3. Model Predictive Control of Permanent Magnet Synchronous Machines
57
Fig. 3.9 Combined load test for MPC with linear multiple horizon prediction at 500 rpm:
(a) start-up, steady-state and external load test, and (b) stator current harmonic spectrum
Fig. 3.10 Combined load test for MPC with both linear multiple horizon prediction and
one-step delay compensation at 500 rpm: (a) start-up, steady-state and external load test,
and (b) stator current harmonic spectrum
0246
Te/N
m
0.10.15
0.2
0.05
Phi/W
b
0 0.1 0.2 0.3 0.4 0.50
2000
4000
t/s
fs/H
z-10
0
10
ia/A
MPC + A
0 1000 2000 3000 4000 5000 60000
1
2
3
4
5
Frequency (Hz)
Fundamental (25Hz) = 4.614 , THD= 17.86%
Mag
(% o
f Fun
dam
enta
l)
0.4 0.42 0.44 0.46 0.48 0.5 0.52
-5
-10
0
5
10
ia/A
t/s
0500
100015002000
Spee
d/rp
m
(a) (b)
0246
Te/N
m
0.10.15
0.2
0.05
Phi/W
b
0 0.1 0.2 0.3 0.4 0.50
2000
4000
t/s
fs/H
z
-10
0
10
ia/A
MPC + A + comp
0 1000 2000 3000 4000 5000 60000
1
2
3
4
5
Frequency (Hz)
Fundamental (25Hz) = 4.571, THD= 11.75%
Mag
(% o
f Fun
dam
enta
l)
0.4 0.42 0.44 0.46 0.48 0.5 0.52
-5
-10
0
5
10
ia/A
t/s
0500
100015002000
Spee
d/rp
m
(a) (b)

Chapter 3. Model Predictive Control of Permanent Magnet Synchronous Machines
58
From Fig. 3.6 and Fig. 3.7, it is shown that the implementation of MPC can reduce the
torque and flux ripples effectively. In Fig. 3.8, the one-step delay compensation
algorithm is added to MPC and the torque and flux ripples are further reduced. By
comparing Fig. 3.9 with Fig. 3.7, it can be found that the introduction of linear multiple
horizon prediction does not affect the torque and flux ripples too much. However, a
dramatic reduction in switching frequency can be observed in Fig. 3.9. In the last figure,
both one-step delay compensation and linear multiple horizon prediction are introduced
to MPC. It is shown that the torque and flux ripples are lower than that of Fig. 3.9 and
the switching frequency is slightly increased. From these figures, it can be seen that the
dynamic responses of all five methods are similar, but the steady state performance of
MPC and improved MPCs is better than that of DTC. The stator current THDs of MPC
and improved MPCs are lower than that of DTC and they also present a narrower
harmonic spectrum than DTC.

Chapter 3. Model Predictive Control of Permanent Magnet Synchronous Machines
59
3.4.2 Combined load test at 1000 rpm
The combined load tests at 1000 rpm for DTC, MPC and improved MPCs are presented
in this section.
Fig. 3.11 Combined load test for DTC at 1000 rpm: (a) start-up, steady-state and
external load test, and (b) stator current harmonic spectrum
0246
Te/N
m
0.10.15
0.2
0.05
Phi/W
b
0 0.1 0.2 0.3 0.4 0.50
2000
4000
t/s
fs/H
z
-10
0
10
ia/A
Classic DTC
0 1000 2000 3000 4000 5000 60000
1
2
3
4
5
Frequency (Hz)
Fundamental (50Hz) = 4.436 , THD= 28.83%
Mag
(% o
f Fun
dam
enta
l)
0.4 0.42 0.44 0.46
-5
-10
0
5
10
ia/A
t/s
0500
100015002000
Spee
d/rp
m
(a) (b)

Chapter 3. Model Predictive Control of Permanent Magnet Synchronous Machines
60
Fig. 3.12 Combined load test for MPC at 1000 rpm: (a) start-up, steady-state and
external load test, and (b) stator current harmonic spectrum
Fig. 3.13 Combined load test for MPC with one-step delay compensation at 1000 rpm:
(a) start-up, steady-state and external load test, and (b) stator current harmonic spectrum
0246
Te/N
m
0.10.15
0.2
0.05
Phi/W
b
0 0.1 0.2 0.3 0.4 0.50
2000
4000
t/s
fs/H
z
-10
0
10
ia/A
MPC
0 1000 2000 3000 4000 5000 60000
1
2
3
4
5
Frequency (Hz)
Fundamental (50Hz) = 4.581 , THD= 18.55%
Mag
(% o
f Fun
dam
enta
l)
0.4 0.42 0.44 0.46
-5
-10
0
5
10
ia/A
t/s
0500
100015002000
Spee
d/rp
m
(a) (b)
0246
Te/N
m
0.10.15
0.2
0.05
Phi/W
b
0 0.1 0.2 0.3 0.4 0.50
2000
4000
t/s
fs/H
z
-10
0
10
ia/A
MPC + comp
0 1000 2000 3000 4000 5000 60000
1
2
3
4
5
Frequency (Hz)
Fundamental (50Hz) = 4.591 , THD= 8.17%
Mag
(% o
f Fun
dam
enta
l)
0.4 0.42 0.44 0.46
-5
-10
0
5
10
ia/A
t/s
0500
100015002000
Spee
d/rp
m
(a) (b)

Chapter 3. Model Predictive Control of Permanent Magnet Synchronous Machines
61
Fig. 3.14 Combined load test for MPC with linear multiple horizon prediction at 1000
rpm: (a) start-up, steady-state and external load test, and (b) stator current harmonic
spectrum
Fig. 3.15 Combined load test for MPC with both linear multiple horizon prediction and
one-step delay compensation at 1000 rpm: (a) start-up, steady-state and external load
test, and (b) stator current harmonic spectrum
0246
Te/N
m
0.10.15
0.2
0.05
Phi/W
b
0 0.1 0.2 0.3 0.4 0.50
2000
4000
t/s
fs/H
z
-10
0
10
ia/A
MPC + A
0 1000 2000 3000 4000 5000 60000
1
2
3
4
5
Frequency (Hz)
Fundamental (50Hz) = 4.677 , THD= 15.52%
Mag
(% o
f Fun
dam
enta
l)
0.4 0.42 0.44 0.46
-5
-10
0
5
10
ia/A
t/s
0500
100015002000
Spee
d/rp
m
(a) (b)
0246
Te/N
m
0.10.150.2
0.05
Phi/W
b
0 0.1 0.2 0.3 0.4 0.50
2000
4000
t/s
fs/H
z
-10
0
10
ia/A
MPC + A + comp
0 1000 2000 3000 4000 5000 60000
1
2
3
4
5
Frequency (Hz)
Fundamental (50Hz) = 4.629 , THD= 11.67%
Mag
(% o
f Fun
dam
enta
l)
0.4 0.42 0.44 0.46
-5
-10
0
5
10
ia/A
t/s
0500
100015002000
Spee
d/rp
m
(a) (b)
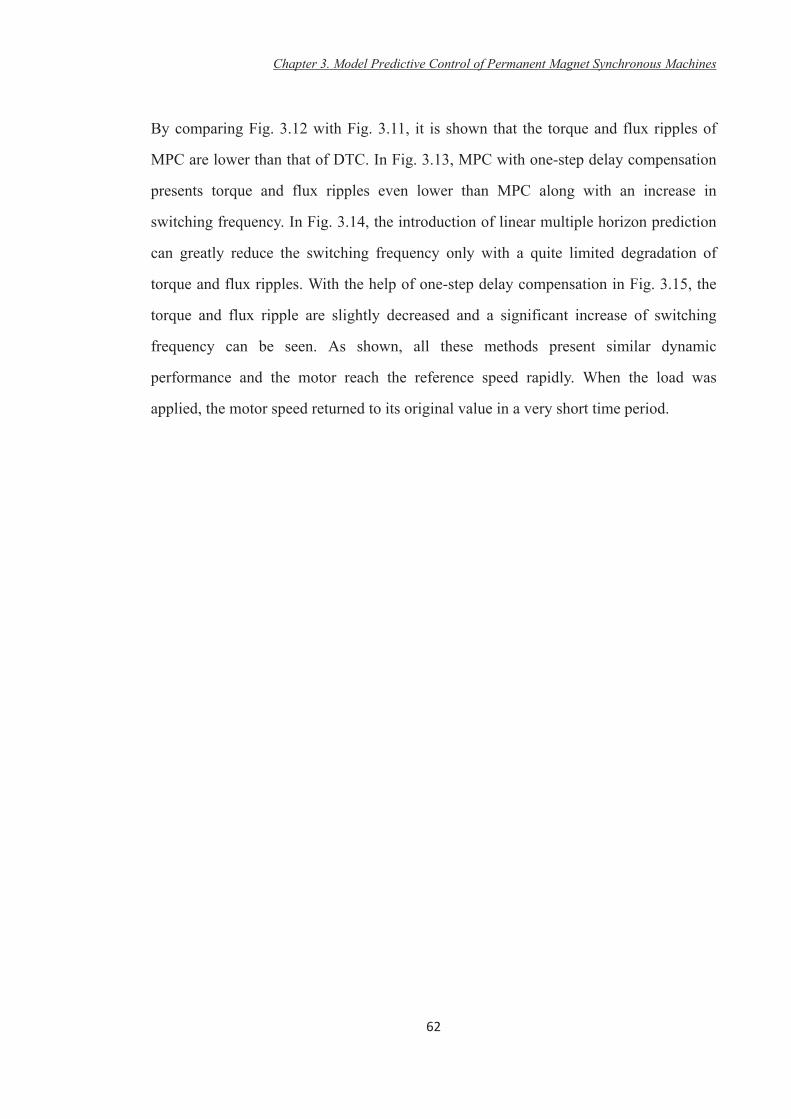
Chapter 3. Model Predictive Control of Permanent Magnet Synchronous Machines
62
By comparing Fig. 3.12 with Fig. 3.11, it is shown that the torque and flux ripples of
MPC are lower than that of DTC. In Fig. 3.13, MPC with one-step delay compensation
presents torque and flux ripples even lower than MPC along with an increase in
switching frequency. In Fig. 3.14, the introduction of linear multiple horizon prediction
can greatly reduce the switching frequency only with a quite limited degradation of
torque and flux ripples. With the help of one-step delay compensation in Fig. 3.15, the
torque and flux ripple are slightly decreased and a significant increase of switching
frequency can be seen. As shown, all these methods present similar dynamic
performance and the motor reach the reference speed rapidly. When the load was
applied, the motor speed returned to its original value in a very short time period.
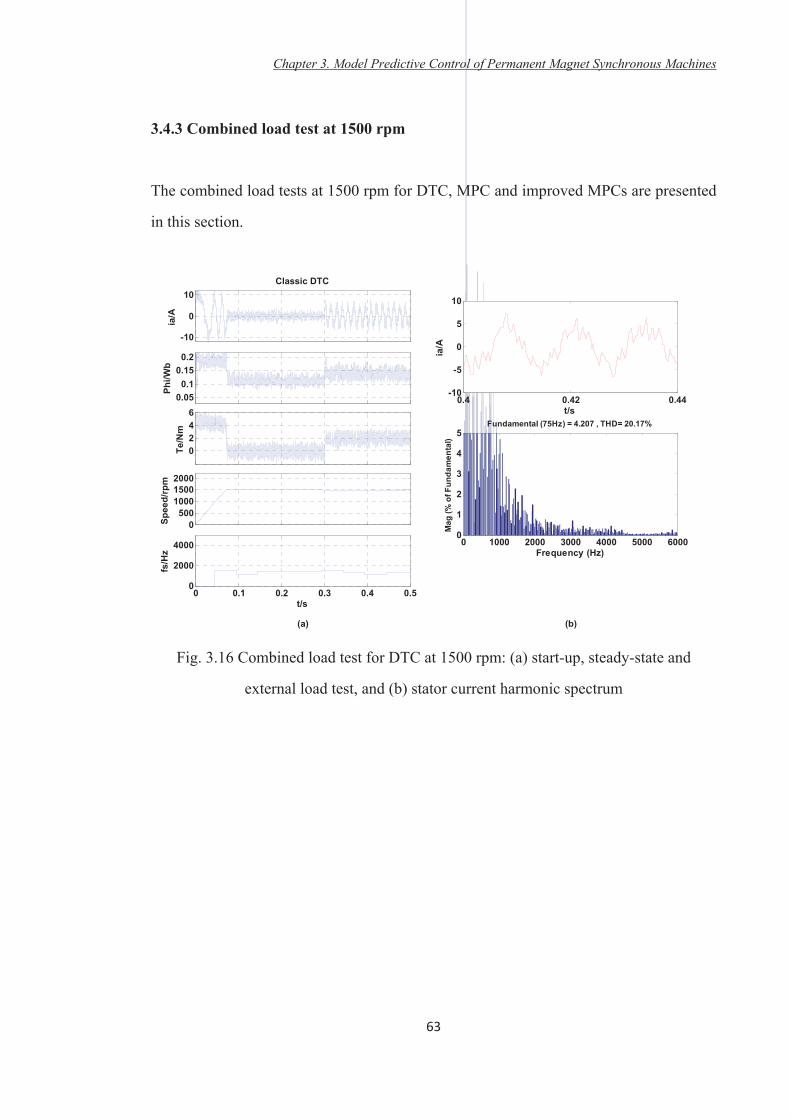
Chapter 3. Model Predictive Control of Permanent Magnet Synchronous Machines
63
3.4.3 Combined load test at 1500 rpm
The combined load tests at 1500 rpm for DTC, MPC and improved MPCs are presented
in this section.
Fig. 3.16 Combined load test for DTC at 1500 rpm: (a) start-up, steady-state and
external load test, and (b) stator current harmonic spectrum
0246
Te/N
m
0.10.15
0.2
0.05
Phi/W
b
0 0.1 0.2 0.3 0.4 0.50
2000
4000
t/s
fs/H
z
-10
0
10
ia/A
Classic DTC
0 1000 2000 3000 4000 5000 60000
1
2
3
4
5
Frequency (Hz)
Fundamental (75Hz) = 4.207 , THD= 20.17%
Mag
(% o
f Fun
dam
enta
l)
0.4 0.42 0.44
-5
-10
0
5
10
ia/A
t/s
0500
100015002000
Spee
d/rp
m
(a) (b)

Chapter 3. Model Predictive Control of Permanent Magnet Synchronous Machines
64
Fig. 3.17 Combined load test for MPC at 1500 rpm: (a) start-up, steady-state and
external load test, and (b) stator current harmonic spectrum
Fig. 3.18 Combined load test for MPC with one-step delay compensation at 1500 rpm:
(a) start-up, steady-state and external load test, and (b) stator current harmonic spectrum
0246
Te/N
m
0.10.15
0.2
0.05
Phi/W
b
0 0.1 0.2 0.3 0.4 0.50
2000
4000
t/s
fs/H
z
-10
0
10
ia/A
MPC
0 1000 2000 3000 4000 5000 60000
1
2
3
4
5
Frequency (Hz)
Fundamental (75Hz) = 4.606 , THD= 17.75%
Mag
(% o
f Fun
dam
enta
l)
0.4 0.42 0.44
-5
-10
0
5
10
ia/A
t/s
0500
100015002000
Spee
d/rp
m
(a) (b)
0246
Te/N
m
0.10.15
0.2
0.05
Phi/W
b
0 0.1 0.2 0.3 0.4 0.50
2000
4000
t/s
fs/H
z
-10
0
10
ia/A
MPC + comp
0 1000 2000 3000 4000 5000 60000
1
2
3
4
5
Frequency (Hz)
Fundamental (75Hz) = 4.491 , THD= 10.15%
Mag
(% o
f Fun
dam
enta
l)
0.4 0.42 0.44
-5
-10
0
5
10
ia/A
t/s
0500
100015002000
Spee
d/rp
m
(a) (b)

Chapter 3. Model Predictive Control of Permanent Magnet Synchronous Machines
65
Fig. 3.19 Combined load test for MPC with linear multiple horizon prediction at 1500
rpm: (a) start-up, steady-state and external load test, and (b) stator current harmonic
spectrum
Fig. 3.20 Combined load test for MPC with both linear multiple horizon prediction and
one-step delay compensation at 1500 rpm: (a) start-up, steady-state and external load
test, and (b) stator current harmonic spectrum
0246
Te/N
m
0.10.150.2
0.05
Phi/W
b
0 0.1 0.2 0.3 0.4 0.50
2000
4000
t/s
fs/H
z-10
0
10
ia/A
MPC + A
0 1000 2000 3000 4000 5000 60000
1
2
3
4
5
Frequency (Hz)
Fundamental (75Hz) = 4.565 , THD= 10.78%
Mag
(% o
f Fun
dam
enta
l)
0.4 0.42 0.44
-5
-10
0
5
10
ia/A
t/s
0500
100015002000
Spee
d/rp
m
(a) (b)
0246
Te/N
m
0.10.15
0.2
0.05
Phi/W
b
0 0.1 0.2 0.3 0.4 0.50
2000
4000
t/s
fs/H
z
-10
0
10
ia/A
MPC + A + comp
0 1000 2000 3000 4000 5000 60000
1
2
3
4
5
Frequency (Hz)
Fundamental (75Hz) = 4.750 , THD= 10.45%
Mag
(% o
f Fun
dam
enta
l)
0.4 0.42 0.44
-5
-10
0
5
10
ia/A
t/s
0500
100015002000
Spee
d/rp
m
(a) (b)

Chapter 3. Model Predictive Control of Permanent Magnet Synchronous Machines
66
From Fig. 3.16 and Fig. 3.17, it can be seen that MPC present much lower torque and
flux ripples than that of DTC whilst maintaining the similar switching frequency. In Fig.
3.18, the torque and flux ripples decrease further due to the introduction of one-step
delay compensation. By comparing Fig. 3.19 with Fig. 3.17, it can be found that the
switching frequency of ‘MPC + A’ is almost half of the original MPC and the torque and
flux ripples remain the same level. In Fig. 3.20, the additional linear multiple horizon
prediction algorithm fails to reduce the switching frequency and also causes a slight
increase of torque and flux ripples compared with Fig. 3.18.

Chapter 3. Model Predictive Control of Permanent Magnet Synchronous Machines
67
3.4.4 Combined load test at 2000 rpm
The combined load tests at 2000 rpm for DTC, MPC and improved MPCs are presented
in this section.
Fig. 3.21 Combined load test for DTC at 2000 rpm: (a) start-up, steady-state and
external load test, and (b) stator current harmonic spectrum
0246
Te/N
m
0.10.15
0.2
0.05
Phi/W
b
0 0.1 0.2 0.3 0.4 0.50
2000
4000
t/s
fs/H
z
-10
0
10
ia/A
Classic DTC
0 1000 2000 3000 4000 5000 60000
1
2
3
4
5
Frequency (Hz)
Fundamental (100Hz) = 4.562 , THD= 26.80%
Mag
(% o
f Fun
dam
enta
l)
0.4 0.41 0.42 0.43
-5
-10
0
5
10
ia/A
t/s
0500
100015002000
Spee
d/rp
m
(a) (b)

Chapter 3. Model Predictive Control of Permanent Magnet Synchronous Machines
68
Fig. 3.22 Combined load test for MPC at 2000 rpm: (a) start-up, steady-state and
external load test, and (b) stator current harmonic spectrum
Fig. 3.23 Combined load test for MPC with one-step delay compensation at 2000 rpm:
(a) start-up, steady-state and external load test, and (b) stator current harmonic spectrum
0246
Te/N
m
0.10.15
0.2
0.05
Phi/W
b
0 0.1 0.2 0.3 0.4 0.50
2000
4000
t/s
fs/H
z-10
0
10
ia/A
MPC
0 1000 2000 3000 4000 5000 60000
1
2
3
4
5
Frequency (Hz)
Fundamental (100Hz) = 4.421 , THD= 13.13%
Mag
(% o
f Fun
dam
enta
l)
0.4 0.41 0.42 0.43
-5
-10
0
5
10
ia/A
t/s
0500
100015002000
Spee
d/rp
m
(a) (b)
0246
Te/N
m
0.10.15
0.2
0.05
Phi/W
b
0 0.1 0.2 0.3 0.4 0.50
2000
4000
t/s
fs/H
z
-10
0
10
ia/A
MPC + comp
0 1000 2000 3000 4000 5000 60000
1
2
3
4
5
Frequency (Hz)
Fundamental (100Hz) = 4.559 , THD= 7.70%
Mag
(% o
f Fun
dam
enta
l)
0.4 0.41 0.42 0.43
-5
-10
0
5
10
ia/A
t/s
0500
100015002000
Spee
d/rp
m
(a) (b)

Chapter 3. Model Predictive Control of Permanent Magnet Synchronous Machines
69
Fig. 3.24 Combined load test for MPC with linear multiple horizon prediction at 2000
rpm: (a) start-up, steady-state and external load test, and (b) stator current harmonic
spectrum
Fig. 3.25 Combined load test for MPC with both linear multiple horizon prediction and
one-step delay compensation at 2000 rpm: (a) start-up, steady-state and external load
test, and (b) stator current harmonic spectrum
0246
Te/N
m
0.10.15
0.2
0.05
Phi/W
b
0 0.1 0.2 0.3 0.4 0.50
2000
4000
t/s
fs/H
z-10
0
10
ia/A
MPC + A
0 1000 2000 3000 4000 5000 60000
1
2
3
4
5
Frequency (Hz)
Fundamental (100Hz) = 4.575 , THD= 13.18%
Mag
(% o
f Fun
dam
enta
l)
0.4 0.41 0.42 0.43
-5
-10
0
5
10
ia/A
t/s
0500
100015002000
Spee
d/rp
m
(a) (b)
0246
Te/N
m
0.10.15
0.2
0.05
Phi/W
b
0 0.1 0.2 0.3 0.4 0.50
2000
4000
t/s
fs/H
z
-10
0
10
ia/A
MPC + A + comp
0 1000 2000 3000 4000 5000 60000
1
2
3
4
5
Frequency (Hz)
Fundamental (100Hz) = 4.485 , THD= 10.63%
Mag
(% o
f Fun
dam
enta
l)
0.4 0.41 0.42 0.43
-5
-10
0
5
10
ia/A
t/s
0500
100015002000
Spee
d/rp
m
(a) (b)

Chapter 3. Model Predictive Control of Permanent Magnet Synchronous Machines
70
The superiority of MPC can be best presented in Fig. 3.22, the torque and flux ripples
and stator current THD of DTC are almost halved by introducing MPC whilst
maintaining the similar switching frequency. In Fig. 3.23, the implementation of
one-step delay compensation halves the stator current THD of original MPC and almost
doubles the switching frequency. In Fig. 3.24, the appearance of linear multiple horizon
prediction can significantly reduce the switching frequency and only does quite limited
influence to steady-state and dynamic performance. However, the linear multiple
horizon prediction seems to fail to reduce the switching frequency when work together
with one-step delay compensation algorithm as shown in Fig. 3.25.

Chapter 3. Model Predictive Control of Permanent Magnet Synchronous Machines
71
3.4.5 Deceleration test (from 1500rpm to 500 rpm)
In this section, the motor maintains the speed of 1500 rpm from 0s and the reference
speed is set to 500 rpm from 0.05s. From top to bottom, the curves are the stator current,
stator flux, torque and motor speed respectively.
Fig. 3.26 Deceleration test for DTC
-20
0
20
Ia/A
Classic DTC
0
0.1
0.2
Phis
/Wb
-10
-5
0
5
Te/N
m
0 0.05 0.1 0.15 0
500
1000
1500
t/s
Spee
d/rp
m

Chapter 3. Model Predictive Control of Permanent Magnet Synchronous Machines
72
Fig. 3.27 Deceleration test for MPC
Fig. 3.28 Deceleration test for MPC one-step delay compensation
-20
0
20
Ia/A
MPC
0
0.1
0.2
Phis
/Wb
-10
-5
0
5
Te/N
m
0 0.05 0.1 0.15 0 500
1000
1500
t/s
Spee
d/rp
m
-20
0
20
Ia/A
MPC + comp
0
0.1
0.2
Phis
/Wb
-10
-5
0
5
Te/N
m
0 0.05 0.1 0.15 0
500
1000
1500
t/s
Spee
d/rp
m

Chapter 3. Model Predictive Control of Permanent Magnet Synchronous Machines
73
Fig. 3.29 Deceleration test for MPC with linear multiple horizon prediction
Fig. 3.30 Deceleration test for MPC with both linear multiple horizon prediction and
one-step delay compensation
-20
0
20
Ia/A
MPC + A
0
0.1
0.2
Phis
/Wb
-10
-5
0
5Te
/Nm
0 0.05 0.1 0.15 0
500
1000
1500
t/s
Spee
d/rp
m
-20
0
20
Ia/A
MPC + A + comp
0
0.1
0.2
Phis
/Wb
-5
0
5
Te/N
m
0 0.05 0.1 0.15 0 500
1000
1500
t/s
Spee
d/rp
m

Chapter 3. Model Predictive Control of Permanent Magnet Synchronous Machines
74
As shown, all these methods performed well. Within a short time period, the motor
speed decreased from 1500 rpm to 500 rpm. However, the drive system spent a bit more
time to complete the speed deceleration when linear multiple horizon prediction was
implemented as shown in Fig. 3.29 and 3.30.
3.5 Experimental Testing of DTC and MPC
In addition to the simulation study, the control methods mentioned above are further
experimentally tested on a two-level inverter-fed PMSM motor drive. The control and
motor parameters are the same as those introduced in Table I. A dSPACE DS1104
PPC/DSP control board is employed to implement the real-time algorithm coding using
C language. A three-phase intelligent power module equipped with an insulated-gate
bipolar transistor (IGBT) is used as an inverter. The gating pulses are generated in the
DS1104 board and then sent to the inverter. The load is applied using a programmable
dynamo-meter controller DSP6000 (Fig. 3.32). A 2500-pulse incremental encoder is
equipped to obtain the rotor speed of PMSM. All experimental results are recorded by
the ControlDesk interfaced with DS1104 and PC at 5 kHz sampling frequency. The
experimental setup is illustrated in Fig. 3.31.

Fig. 3.31
Ch
Experiment
(b) f
hapter 3. Mod
tal setup of
front view o
Fig. 3.32 D
del Predictive
7
(
(
f testing syst
of the PMSM
Dynamo-me
Control of Pe
75
(a)
(b)
tem: (a) ove
M and inver
eter controll
rmanent Mag
erview of th
rter control b
er DSP6000
gnet Synchron
he testing pl
board
0
ous Machines
latform and
s

Chapter 3. Model Predictive Control of Permanent Magnet Synchronous Machines
76
3.5.1 Steady state responses at 500 rpm
The steady-state responses at 500 rpm, 1000 rpm, 1500 rpm and 2000 rpm respectively
are presented in this section. From top to bottom, the curves shown are torque, stator
flux and switching frequency.
Fig. 3.33 Steady-state response at 500 rpm for: (a) DTC, (b) MPC and (c) MPC with
one-step delay compensation
Fig. 3.34 Steady-state response at 500 rpm for: (a) MPC with linear multiple horizon
prediction, and (b) MPC with both linear multiple horizon prediction and one-step delay
compensation
-2
-1
0
1
2
Te/N
m
Classic DTC
0.04
0.10
0.16
s/W
b
0 1 20
2000
4000
t/s
fs/H
z
-2
-1
0
1
2
Te/N
m
MPC
0.04
0.10
0.16s/
Wb
0 1 20
2000
4000
t/s
fs/H
z-2
-1
0
1
2
Te/N
m
MPC + comp
0.04
0.10
0.16
s/W
b0 1 2
0
2000
4000
t/sfs
/Hz
(a) (b) (c)
-2
-1
0
1
2
Te/N
m
MPC + A
0.04
0.10
0.16
s/W
b
0 1 20
2000
4000
t/s
fs/H
z
-2
-1
0
1
2
Te/N
m
MPC + A + comp
0.04
0.10
0.16
s/W
b
0 1 20
2000
4000
t/s
fs/H
z
(a) (b)

Chapter 3. Model Predictive Control of Permanent Magnet Synchronous Machines
77
Fig. 3.33 and 3.34 plot the measured steady-state performance at 500 rpm. It can be
found that the torque ripple of MPC is lower than that of DTC. However the flux ripple
is higher than DTC. The implementation of one-step delay compensation can greatly
reduce the torque and flux ripples and also a significant increase of switching frequency
can be observed. By adding linear multiple horizon prediction to MPC, the reduction of
the torque and flux ripples can be found as well as the dramatic drop of switching
frequency. When the linear multiple horizon prediction is applied to MPC with one-step
delay compensation, a significant decrease of switching frequency can be observed and
the torque ripple is also increased.
The quantitative index of average switching frequency, stator flux ripple and torque
ripple for these tests will be summarized in Section 3.6.

Chapter 3. Model Predictive Control of Permanent Magnet Synchronous Machines
78
3.5.2 Steady state responses at 1000 rpm
The steady-state responses at 1000 rpm are presented in this section. From top to bottom,
the curves shown are torque, stator flux and switching frequency.
Fig. 3.35 Steady-state response at 1000 rpm for: (a) DTC, (b) MPC and (c) MPC with
one-step delay compensation
Fig. 3.36 Steady-state response at 1000 rpm for: (a) MPC with linear multiple horizon
prediction, and (b) MPC with both linear multiple horizon prediction and one-step delay
compensation
-2
-1
0
1
2
Te/N
m
Classic DTC
0.04
0.10
0.16
s/W
b
0 1 20
2000
4000
t/s
fs/H
z
-2
-1
0
1
2
Te/N
m
MPC
0.04
0.10
0.16s/
Wb
0 1 20
2000
4000
t/s
fs/H
z-2
-1
0
1
2
Te/N
m
MPC + comp
0.04
0.10
0.16
s/W
b
0 1 20
2000
4000
t/sfs
/Hz
(a) (b) (c)
-2
-1
0
1
2
Te/N
m
MPC + A
0.04
0.10
0.16
s/W
b
0 1 20
2000
4000
t/s
fs/H
z
-2
-1
0
1
2
Te/N
m
MPC + A + comp
0.04
0.10
0.16
s/W
b
0 1 20
2000
4000
t/s
fs/H
z
(a) (b)

Chapter 3. Model Predictive Control of Permanent Magnet Synchronous Machines
79
Fig. 3.35 and 3.36 plot the measured steady-state performance at 1000 rpm. It is seen
that the implementation of MPC can reduce the torque ripple, but does not reduce the
flux ripple. When the one-step delay is compensated, a significant decrease of torque
and flux ripples can be found as well as an obvious increase of switching frequency.
When the linear multiple horizon prediction is added to MPC, it can be seen that the
torque and flux ripples are slightly decreased along with a limited reduction of the
switching frequency. When the linear multiple horizon prediction is applied to MPC in
addition to one-step delay compensation, a remarkable drop of the switching frequency
can be seen whilst maintaining the similar steady-state performance.

Chapter 3. Model Predictive Control of Permanent Magnet Synchronous Machines
80
3.5.3 Steady state responses at 1500 rpm
The steady-state responses at 1500 rpm are presented in this section. From top to bottom,
the curves shown are torque, stator flux and switching frequency.
Fig. 3.37 Steady-state response at 1500 rpm for: (a) DTC, (b) MPC and (c) MPC with
one-step delay compensation
Fig. 3.38 Steady-state response at 1500 rpm for: (a) MPC with linear multiple horizon
prediction, and (b) MPC with both linear multiple horizon prediction and one-step delay
compensation
-2
-1
0
1
2
Te/N
m
Classic DTC
0.04
0.10
0.16
s/W
b
0 1 20
2000
4000
t/s
fs/H
z
-2
-1
0
1
2
Te/N
m
MPC
0.04
0.10
0.16
s/W
b
0 1 20
2000
4000
t/s
fs/H
z-2
-1
0
1
2
Te/N
m
MPC + comp
0.04
0.10
0.16
s/W
b0 1 2
0
2000
4000
t/sfs
/Hz
(a) (b) (c)
-2
-1
0
1
2
Te/N
m
MPC + A
0.04
0.10
0.16
s/W
b
0 1 20
2000
4000
t/s
fs/H
z
-2
-1
0
1
2
Te/N
m
MPC + A + comp
0.04
0.10
0.16
s/W
b
0 1 20
2000
4000
t/s
fs/H
z
(a) (b)

Chapter 3. Model Predictive Control of Permanent Magnet Synchronous Machines
81
Fig. 3.37 and 3.38 plot the measured steady-state performance at 1500 rpm. As shown in
Fig. 3.37 (b), the introduction of MPC can reduce the torque ripple, but fails to decrease
the flux ripple. In Fig. 3.37 (c), the torque and flux ripples are significantly reduced
when one-step delay is compensated. By introducing linear multiple horizon prediction
to MPC, an obvious reduction of torque and flux ripples as well as a slight decrease of
switching frequency can be observed as shown in Fig. 3.38 (a). In Fig. 3.38 (b), both
linear multiple horizon prediction and one-step delay compensation are used in MPC
and the switching frequency is slightly reduced whilst maintaining the similar torque
and flux ripples as shown in Fig. 3.37 (c).

Chapter 3. Model Predictive Control of Permanent Magnet Synchronous Machines
82
3.5.4 Steady state responses at 2000 rpm
The steady-state responses at 2000 rpm are presented in this section. From top to bottom,
the curves shown are torque, stator flux and switching frequency.
Fig. 3.39 Steady-state response at 2000 rpm for: (a) DTC, (b) MPC and (c) MPC with
one-step delay compensation
Fig. 3.40 Steady-state response at 2000 rpm for: (a) MPC with linear multiple horizon
prediction, and (b) MPC with both linear multiple horizon prediction and one-step delay
compensation
-2
-1
0
1
2
Te/N
m
Classic DTC
0.04
0.10
0.16
s/W
b
0 1 20
2000
4000
t/s
fs/H
z
-2
-1
0
1
2
Te/N
m
MPC
0.04
0.10
0.16s/
Wb
0 1 20
2000
4000
t/s
fs/H
z-2
-1
0
1
2
Te/N
m
MPC + comp
0.04
0.10
0.16
s/W
b
0 1 20
2000
4000
t/sfs
/Hz
(a) (b) (c)
-2
-1
0
1
2
Te/N
m
MPC + A
0.04
0.10
0.16
s/W
b
0 1 20
2000
4000
t/s
fs/H
z
-2
-1
0
1
2
Te/N
m
MPC + A + comp
0.04
0.10
0.16
s/W
b
0 1 20
2000
4000
t/s
fs/H
z
(a) (b)

Chapter 3. Model Predictive Control of Permanent Magnet Synchronous Machines
83
Fig. 3.39 and 3.40 plot the measured steady-state performance at 2000 rpm. In Fig. 3.39
(b), an obvious decrease of torque ripple can be seen, but no improvement of flux ripple
can be found. When the one-step delay is compensated as shown in Fig. 3.39 (c), the
torque and flux ripples are significantly decreased along with a remarkable increase of
switching frequency. As shown in Fig. 3.40 (a), the introduction of linear multiple
horizon prediction seems to fail with switching frequency reduction, but a slight
decrease of both torque and flux ripples can be seen. In Fig. 3.40 (b), with the help of
linear multiple horizon prediction, the switching frequency is reduced whilst
maintaining the similar torque and flux ripples as shown in Fig. 3.39 (c).

Chapter 3. Model Predictive Control of Permanent Magnet Synchronous Machines
84
3.5.5 Start-up test
In this section, the start-up response is presented. By introducing a ramp-up function in
the PI controller, the motor speed accelerates from 0 to 2000 rpm steadily with a small
overshoot. In Figs. 3-41 to 3-45, from top to bottom, the curves shown are the stator
current, stator flux, torque and rotor speed. One right hand side of the figure, there is a
zoomed view of stator current. It is observed that whilst the dynamic response for these
methods are similar, the steady state performance of the MPC with linear multiple
horizon prediction is much better.
Fig. 3.41 Start-up response from standstill to 2000 rpm for DTC
-5
0
5
Ia/A
Classic DTC
-2
0
2
Te/N
m
0 1 2 30
1000
2000
t/s
r/rpm
0
0.1
0.2
s/W
b
0.8 0.9 1-4
-2
0
2
4
Ia/A

Chapter 3. Model Predictive Control of Permanent Magnet Synchronous Machines
85
Fig. 3.42 Start-up response from standstill to 2000 rpm for MPC
Fig. 3.43 Start-up response from standstill to 2000 rpm for MPC with one-step delay
compensation
-5
0
5
Ia/A
MPC
-2
0
2
Te/N
m
0 1 2 30
1000
2000
t/s
r/rpm
0
0.1
0.2
s/W
b
-2
0
2
Ia/A
MPC + comp
-2
0
2
Te/N
m
0 1 2 30
1000
2000
t/s
r/rpm
0
0.1
0.2
s/W
b
0.6 0.7 0.8-4
-2
0
2
4
Ia/A
0.6 0.7 0.8-2
-1
0
1
2
Ia/A

Chapter 3. Model Predictive Control of Permanent Magnet Synchronous Machines
86
Fig. 3.44 Start-up response from standstill to 2000 rpm for MPC with linear multiple
horizon prediction
Fig. 3.45 Start-up response from standstill to 2000 rpm for MPC with both linear
multiple horizon prediction and one-step delay compensation
-5
0
5
Ia/A
MPC + A
-2
0
2
Te/N
m
0 1 2 30
1000
2000
t/s
r/rpm
0
0.1
0.2
s/W
b
-5
0
5
Ia/A
MPC + A + comp
-2
0
2
Te/N
m
0 1 2 30
1000
2000
t/s
r/rpm
0
0.1
0.2
s/W
b
0.7 0.8 0.9-4
-2
0
2
4
Ia/A
1.1 1.2 1.3-4
-2
0
2
4
Ia/A
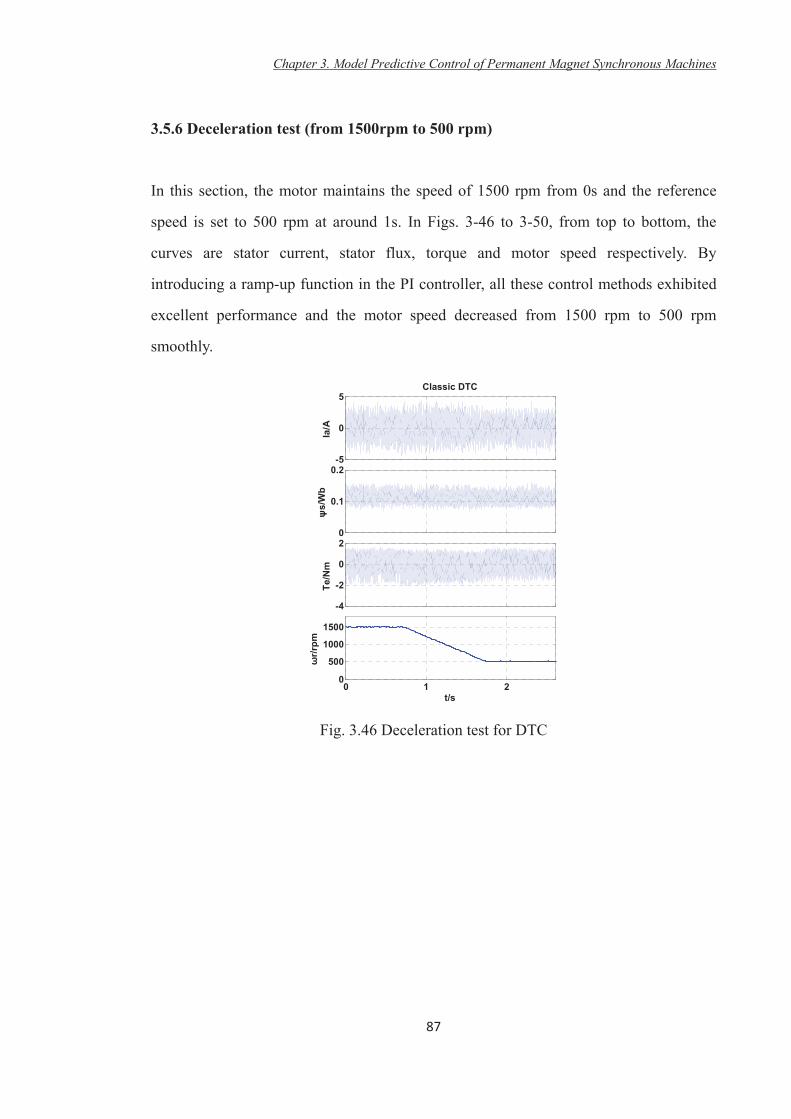
Chapter 3. Model Predictive Control of Permanent Magnet Synchronous Machines
87
3.5.6 Deceleration test (from 1500rpm to 500 rpm)
In this section, the motor maintains the speed of 1500 rpm from 0s and the reference
speed is set to 500 rpm at around 1s. In Figs. 3-46 to 3-50, from top to bottom, the
curves are stator current, stator flux, torque and motor speed respectively. By
introducing a ramp-up function in the PI controller, all these control methods exhibited
excellent performance and the motor speed decreased from 1500 rpm to 500 rpm
smoothly.
Fig. 3.46 Deceleration test for DTC
-5
0
5
Ia/A
Classic DTC
0
0.1
0.2
s/W
b
-4
-2
0
2
Te/N
m
0 1 20
500
1000
1500
t/s
r/rpm

Chapter 3. Model Predictive Control of Permanent Magnet Synchronous Machines
88
Fig. 3.47 Deceleration test for MPC
Fig. 3.48 Deceleration test for MPC with one-step delay compensation
-5
0
5
Ia/A
MPC
0
0.1
0.2
s/W
b
-2
0
2
Te/N
m
0 1 20
500
1000
1500
t/s
r/rpm
-2
0
2
Ia/A
MPC + comp
0
0.1
0.2
s/W
b
-1
0
1
Te/N
m
0 1 20
500
1000
1500
t/s
r/rpm

Chapter 3. Model Predictive Control of Permanent Magnet Synchronous Machines
89
Fig. 3.49 Deceleration test for MPC with both linear multiple horizon prediction
Fig. 3.50 Deceleration test for MPC with both linear multiple horizon prediction and
one-step delay compensation
-5
0
5
Ia/A
MPC + A
0
0.1
0.2
s/W
b
-4
-2
0
2
Te/N
m
0 1 20
500
1000
1500
t/s
r/rpm
-5
0
5
Ia/A
MPC + A + comp
0
0.1
0.2
s/W
b
-4
-2
0
2
Te/N
m
0 1 20
500
1000
1500
t/s
r/rpm

Chapter 3. Model Predictive Control of Permanent Magnet Synchronous Machines
90
3.5.7 2Nm load test
The section presents the response to external load disturbance of these methods. The
motor operates at a steady rate of 1000 rpm and a 2 Nm load is suddenly applied on the
shaft. As shown in Figs. 3-51 to 3-55, all these control methods presented good dynamic
performance and in a very short period, the motor speed returns to its original value due
to the fast torque response. It can be found that the classic DTC spend more than 1s to
recover the original speed. For MPC and improved MPCs, the recovery time is less than
0.5s.
Fig. 3.51 Response to external load for DTC
-10
0
10
Ia/A
Classic DTC
0
0.1
0.2
Phis
/Wb
-2024
Te/N
m
0 1 2 30
500
1000
t/s
Spee
d/rp
m

Chapter 3. Model Predictive Control of Permanent Magnet Synchronous Machines
91
Fig. 3.52 Response to external load for MPC
Fig. 3.53 Response to external load for MPC with one-step delay compensation
-10
0
10
Ia/A
MPC
0
0.1
0.2
Phi/W
b -2024
Te/N
m
0 1 2 30
500
1000
t/s
Spee
d/rp
m
-10
0
10
Ia/A
MPC + comp
0
0.1
0.2
Phis
/Wb
-2024
Te/N
m
0 1 2 30
500
1000
t/s
Spee
d/rp
m

Chapter 3. Model Predictive Control of Permanent Magnet Synchronous Machines
92
Fig. 3.54 Response to external load for MPC with linear multiple horizon prediction
Fig. 3.55 Response to external load for MPC with both linear multiple horizon
prediction and one-step delay compensation
-10
0
10
Ia/A
MPC + A
0
0.1
0.2
Phis
/Wb
-2024
Te/N
m
0 1 2 30
500
1000
t/s
Spee
d/rp
m
-10
0
10
Ia/A
MPC + A + comp
0
0.1
0.2
Phis
/Wb
-2024
Te/N
m
0 1 2 3 0
500
1000
t/s
Spee
d/rp
m

Chapter 3. Model Predictive Control of Permanent Magnet Synchronous Machines
93
3.6 Quantitative Analysis and Comparison of Control Methods
The results of steady-state simulation and experimental tests are summarized in this
section.
Group 1 Table 3-2a Steady-state response at 500 rpm (simulation)
Method THD (%) (Hz) (Wb) (Nm)
DTC 26.22 1.7411k 0.0151 0.7249 MPC 17.83 1.5200k 0.0150 0.5733 MPC + comp 6.94 0.7320k 0.0059 0.2258 MPC + A 17.86 0.1954k 0.0059 0.8052 MPC + A + comp 11.75 0.1699k 0.0034 0.8527
Table 3-2b Steady-state response at 500 rpm (experimental)
Method (Hz) (Wb) (Nm)
DTC 1.3989k 0.0166 0.7840 MPC 1.2769k 0.0188 0.6780 MPC + comp 2.4879k 0.0052 0.1985 MPC + A 0.3691k 0.0093 0.6086 MPC + A + comp 0.5117k 0.0049 0.4151
Group 2
Table 3-3a Steady-state response at 1000 rpm (simulation) Method THD (%) (Hz) (Wb) (Nm)
DTC 28.83 1.5972k 0.0155 0.6869 MPC 18.55 1.5692k 0.0138 0.4952 MPC + comp 8.17 1.5812k 0.0059 0.2253 MPC + A 15.52 0.6640k 0.0090 0.5102 MPC + A + comp 11.67 1.3674k 0.0050 0.2493
Table 3-3b Steady-state response at 1000 rpm (experimental)
Method (Hz) (Wb) (Nm)
DTC 1.2129k 0.0167 0.8446 MPC 1.1393k 0.0173 0.6394 MPC + comp 2.7335k 0.0056 0.2310 MPC + A 0.6045k 0.0136 0.4460 MPC + A + comp 1.2414k 0.0049 0.2644

Chapter 3. Model Predictive Control of Permanent Magnet Synchronous Machines
94
Group 3 Table 3-4a Steady-state response at 1500 rpm (simulation)
Method THD (%) (Hz) (Wb) (Nm)
DTC 20.17 1.2413k 0.0133 0.7191 MPC 17.75 1.4188k 0.0136 0.4432 MPC + comp 10.15 2.0784k 0.0063 0.2103 MPC + A 10.78 0.9834k 0.0095 0.3966 MPC + A + comp 10.45 2.0160k 0.0059 0.2365
Table 3-4b Steady-state response at 1500 rpm (experimental)
Method (Hz) (Wb) (Nm)
DTC 1.0965k 0.0168 0.8020 MPC 0.9126k 0.0162 0.5084 MPC + comp 2.3440k 0.0069 0.1546 MPC + A 0.7518k 0.0130 0.4581 MPC + A + comp 1.6815k 0.0054 0.1406
Group 4
Table 3-5a Steady-state response at 2000 rpm (simulation) Method THD (%) (Hz) (Wb) (Nm)
DTC 26.80 1.2279k 0.0183 0.9046 MPC 13.13 1.2016k 0.0126 0.5031 MPC + comp 7.70 2.4024k 0.0067 0.2541 MPC + A 13.18 0.9131k 0.0093 0.4193 MPC + A + comp 10.63 2.3611k 0.0064 0.2357
Table 3-5b Steady-state response at 2000 rpm (experimental)
Method (Hz) (Wb) (Nm)
DTC 0.8774k 0.0165 0.6952 MPC 0.7033k 0.0154 0.4642 MPC + comp 1.8061k 0.0067 0.2380 MPC + A 0.5967k 0.0140 0.4581 MPC + A + comp 1.2798k 0.0065 0.2269

Chapter 3. Model Predictive Control of Permanent Magnet Synchronous Machines
95
The tests results listed above are discussed in detail:
MPC vs. DTC
From the simulation results, it can be found that the implementation of MPC can reduce
the flux ripple by 0.7% (500 rpm), 11.0% (1000 rpm), -2.3% (1500 rpm) and 31.1%
(2000 rpm) and reduce the torque ripple by 21.0% (500 rpm), 27.9% (1000 rpm), 38.4%
(1500 rpm) and 44.4% (2000 rpm)
From the experimental tests results, it is seen that the implementation of MPC can
reduce the flux ripple by -13.3% (500 rpm), -3.6% (1000 rpm), 3.6% (1500 rpm) and
6.7% (2000 rpm) and reduce the torque ripple by 13.5% (500 rpm), 24.3% (1000 rpm),
36.6% (1500 rpm) and 33.2% (2000 rpm)
In conclusion, MPC can achieve lower torque ripple than that of DTC as proven in both
simulation and experimental tests. However, MPC’s character in flux ripple reduction is
quite unstable.
MPC+comp vs. MPC
From the simulation results, it can be found that the implementation of one-step delay
compensation can reduce the flux ripple by 60.7% (500 rpm), 57.2% (1000 rpm), 53.7%
(1500 rpm) and 46.8% (2000 rpm) and reduce the torque ripple by 60.6% (500 rpm),
54.5% (1000 rpm), 52.5% (1500 rpm) and 49.5% (2000 rpm)
From the experimental tests results, it is seen that the implementation of one-step delay
compensation can reduce the flux ripple by 72.3% (500 rpm), 67.6% (1000 rpm), 57.4%
(1500 rpm) and 56.5% (2000 rpm) and reduce the torque ripple by 70.7% (500 rpm),
63.9% (1000 rpm), 69.6% (1500 rpm) and 48.7% (2000 rpm)

Chapter 3. Model Predictive Control of Permanent Magnet Synchronous Machines
96
With the help of one-step delay compensation, the steady-state performance of MPC is
improved significantly in both simulation and experimental tests. It should be noticed
that the switching frequency almost increase by two times in most tests when one-step
delay is compensated.
MPC+A vs. MPC
From the simulation results, it can be found that the implementation of linear multiple
horizon prediction can reduce the flux ripple by 60.7% (500 rpm), 34.8% (1000 rpm),
30.1% (1500 rpm) and 26.2% (2000 rpm), reduce the torque ripple by -40.5% (500 rpm),
-3.0% (1000 rpm), 10.5 % (1500 rpm) and 16.7% (2000 rpm) and reduce the switching
frequency by 87.1% (500 rpm), 57.7% (1000 rpm), 30.7 % (1500 rpm) and 24.0% (2000
rpm).
From the experimental tests results, it is seen that the implementation of linear multiple
horizon prediction can reduce the flux ripple by 50.5% (500 rpm), 21.4% (1000 rpm),
19.8% (1500 rpm) and 9.1% (2000 rpm), reduce the torque ripple by 9.1%(500 rpm),
30.2% (1000 rpm), 9.9% (1500 rpm) and 1.3% (2000 rpm) and reduce the switching
frequency by 71.1% (500 rpm), 46.9% (1000 rpm), 17.6 % (1500 rpm) and 15.2% (2000
rpm).
As shown in above tests analysis, the introduction of linear multiple horizon prediction
can effectively reduce the switching frequency and flux ripple. However, its ability of
torque ripple reduction is quite insignificant.

Chapter 3. Model Predictive Control of Permanent Magnet Synchronous Machines
97
MPC+A+comp vs. MPC+comp
From the simulation results, it can be found that the implementation of linear multiple
horizon prediction in addition to ‘MPC+comp’ can reduce the flux ripple by 42.4% (500
rpm), 15.3% (1000 rpm), 6.3% (1500 rpm) and 4.5% (2000 rpm), reduce the torque
ripple by -277.6 % (500 rpm), -10.7% (1000 rpm), -12.5% (1500 rpm) and 7.2% (2000
rpm) and reduce the switching frequency by 76.8% (500 rpm), 13.5% (1000 rpm), 3.0 %
(1500 rpm) and 1.7% (2000 rpm).
From the experimental tests results, it is seen that the implementation of linear multiple
horizon prediction in addition to ‘MPC+comp’ can reduce the flux ripple by 5.8% (500
rpm), 12.5% (1000 rpm), 21.7% (1500 rpm) and 3.0% (2000 rpm), reduce the torque
ripple by -109.1% (500 rpm), -14.4% (1000 rpm), 9.1% (1500 rpm) and 4.7% (2000
rpm) and reduce the switching frequency by 79.4% (500 rpm), 54.6% (1000 rpm), 28.3 %
(1500 rpm) and 29.1% (2000 rpm).
By introducing linear multiple horizon prediction to ‘MPC+comp’, an obvious
reduction in switching frequency and a slight decrease in flux ripple can be found.
However, it also comes with heavy penalty of torque ripple increasing, especially at low
motor speed.
Summary
According to the analysis above, it can be concluded that:
MPC can achieve lower torque ripple than that of DTC whilst maintaining/reducing
the switching frequency as proven in both simulation and experimental tests. However,
MPC’s ability in flux ripple reduction is insignificant and even unstable.
When one-step delay is compensated, the steady-state performance of MPC in

Chapter 3. Model Predictive Control of Permanent Magnet Synchronous Machines
98
terms of torque and flux ripples reduction is significantly improved. It should be noticed
that the performance improvement also comes with a remarkable switching frequency
increase (two times or more).
By introducing linear multiple horizon prediction to MPCs, a significant switching
frequency reduction can be found as well as an obvious decrease in flux ripple.
However, it comes with heavy penalty of torque ripple increasing, especially at low
motor speed
3.7 Conclusion
In this chapter, the model-based predictive control is investigated together with the
conventional DTC by both simulation and experiment. The one-step delay issue in
digital control systems is also investigated and a model-based compensation method is
introduced to MPC. It is shown that the MPC provides better steady state performance,
similar dynamic response and lower switching frequency under the condition of the
same sampling frequency. When the one-step delay is compensated, the performance
can be further improved along with the switching frequency increase.
One major merit of MPC is the flexibility of the cost function, i.e. taking other selection
criteria into account. In this chapter, the linear multiple horizon prediction method is
introduced and verified experimentally. The implementation of this method can greatly
reduce the switching frequency whilst maintaining/improving the performance in terms
of the torque and flux ripples.

Chapter 3. Model Predictive Control of Permanent Magnet Synchronous Machines
99
REFERENCES
[3.1] T. M. Jahns, G. B. Kliman, and T. W. Neumann, “Interior permanent-magnet
synchronous motors for adjustable-speed drives,” IEEE Trans. Ind. Appl., vol.
IA-22, no. 4, pp. 738 –747, July 1986.
[3.2] D. Casadei, F. Profumo, G. Serra, and A. Tani, “FOC and DTC: two viable
schemes for induction motors torque control,” IEEE Trans. Power Electron., vol.
17, no. 5, pp. 779–787, Sep. 2002.
[3.3] G. S. Buja and M. P. Kazmierkowski, “Direct torque control of PWM inverter-fed
AC motors – a survey,” IEEE Trans. Ind. Electron., vol. 51, no. 4, pp. 744–757,
Aug. 2004.
[3.4] L. Zhong, M. Rahman, W. Hu, and K. Lim, “Analysis of direct torque control in
permanent magnet synchronous motor drives,” IEEE Trans. Power Electron., vol.
12, no. 3, pp. 528 –536, May 1997.
[3.5] Y. Zhang and J. Zhu, “Direct torque control of permanent magnet synchronous
motor with reduced torque ripple and commutation frequency,” IEEE Trans.
Power Electron., vol. 26, no. 1, pp. 235 –248, 2011.
[3.6] J. Holtz, J. Quan, J. Pontt, J. Rodriguez, P. Newman, and H. Miranda, “Design of
fast and robust current regulators for high-power drives based on complex state
variables,” IEEE Trans. Ind. Appl., vol. 40, no. 5, pp. 1388 – 1397, Sept.-Oct.
2004.
[3.7] Y. Zhang and J. Zhu, “A novel duty cycle control strategy to reduce both torque
and flux ripples for dtc of permanent magnet synchronous motor drives with
switching frequency reduction,” IEEE Trans. Power Electron., vol. 26, no. 10, pp.
3055–3067, 2011.
[3.8] Y. Zhang, J. Zhu, W. Xu, and Y. Guo, “A simple method to reduce torque ripple

Chapter 3. Model Predictive Control of Permanent Magnet Synchronous Machines
100
in direct torque-controlled permanent-magnet synchronous motor by using
vectors with variable amplitude and angle,” IEEE Trans. Ind. Electron., vol. 58,
no. 7, pp. 2848–2859, 2011.
[3.9] Y. Zhang, J. Zhu, and W. Xu, “Analysis of one step delay in direct torque control
of permanent magnet synchronous motor and its remedies,” in Proc. Int Electrical
Machines and Systems (ICEMS) Conf, 2010, pp. 792–797.
[3.10] J. Holtz and S. Stadtfeld, “A predictive controller for the stator current vector of
ac machines fed from a switched voltage source,” in Proc. IPEC, 1983, pp. 1665–
1675.
[3.11] P. Cortes, M. Kazmierkowski, R. Kennel, D. Quevedo, and J. Rodriguez,
“Predictive control in power electronics and drives,” IEEE Trans. Ind. Electron.,
vol. 55, no. 12, pp. 4312 –4324, Dec. 2008.
[3.12] A. Beccuti, S. Mariethoz, S. Cliquennois, S. Wang, and M. Morari, “Explicit
model predictive control of dc-dc switched-mode power supplies with extended
kalman filtering,” IEEE Trans. Ind. Electron., vol. 56, no. 6, pp. 1864 –1874,
June 2009.
[3.13] S. Kouro, P. Cortes, R. Vargas, U. Ammann, and J. Rodriguez, “Model predictive
control—a simple and powerful method to control power converters,” IEEE
Trans. Ind. Electron., vol. 56, no. 6, pp. 1826 –1838, June 2009.
[3.14] J. Rodriguez, R. M. Kennel, J. R. Espinoza, M. Trincado, C. A. Silva, and C. A.
Rojas, “High-performance control strategies for electrical drives: An
experimental assessment,” IEEE Trans. Ind. Electron., vol. 59, no. 2, pp. 812–820,
2012.
[3.15] T. Geyer, G. Papafotiou, and M. Morari, “Model predictive direct torque control
-part I: Concept, algorithm, and analysis,” IEEE Trans. Ind. Electron., vol. 56, no.
6, pp. 1894 –1905, June 2009.

Chapter 3. Model Predictive Control of Permanent Magnet Synchronous Machines
101
[3.16] Y. Zhang, J. Zhu, and W. Xu, “Predictive torque control of permanent magnet
synchronous motor drive with reduced switching frequency,” in Proc. Int
Electrical Machines and Systems (ICEMS) Conf, 2010, pp. 798–803.
[3.17] P. Cortes, J. Rodriguez, C. Silva, and A. Flores, “Delay compensation in model
predictive current control of a three-phase inverter,” IEEE Trans. Ind. Electron.,
vol. 59, no. 2, pp. 1323–1325, 2012.
[3.18] H. Miranda, P. Cortes, J. Yuz, and J. Rodriguez, “Predictive torque control of
induction machines based on state-space models,” IEEE Trans. Ind. Electron., vol.
56, no. 6, pp. 1916 –1924, June 2009.
[3.19] R. Vargas, P. Cortes, U. Ammann, J. Rodriguez, and J. Pontt, “Predictive
control of a three-phase neutral-point-clamped inverter,” IEEE Trans. Ind.
Electron., vol. 54, no. 5, pp. 2697 –2705, Oct. 2007.
[3.20] G. Papafotiou, J. Kley, K. Papadopoulos, P. Bohren, and M. Morari, “Model
predictive direct torque control-part II: Implementation and experimental
evaluation,” IEEE Trans. Ind. Electron., vol. 56, no. 6, pp. 1906 –1915, June
2009.
[3.21] P. Vas, Electrical Machines and Drives: A Space-Vector Theory Approach. New
York: Oxford University Press, 1992.
[3.22] R. H. Park, "Definition of an Ideal Synchronous Machine and Formula for the
Armature Flux Linkages," General Electric Review, vol. 31, p. 332, 1928.
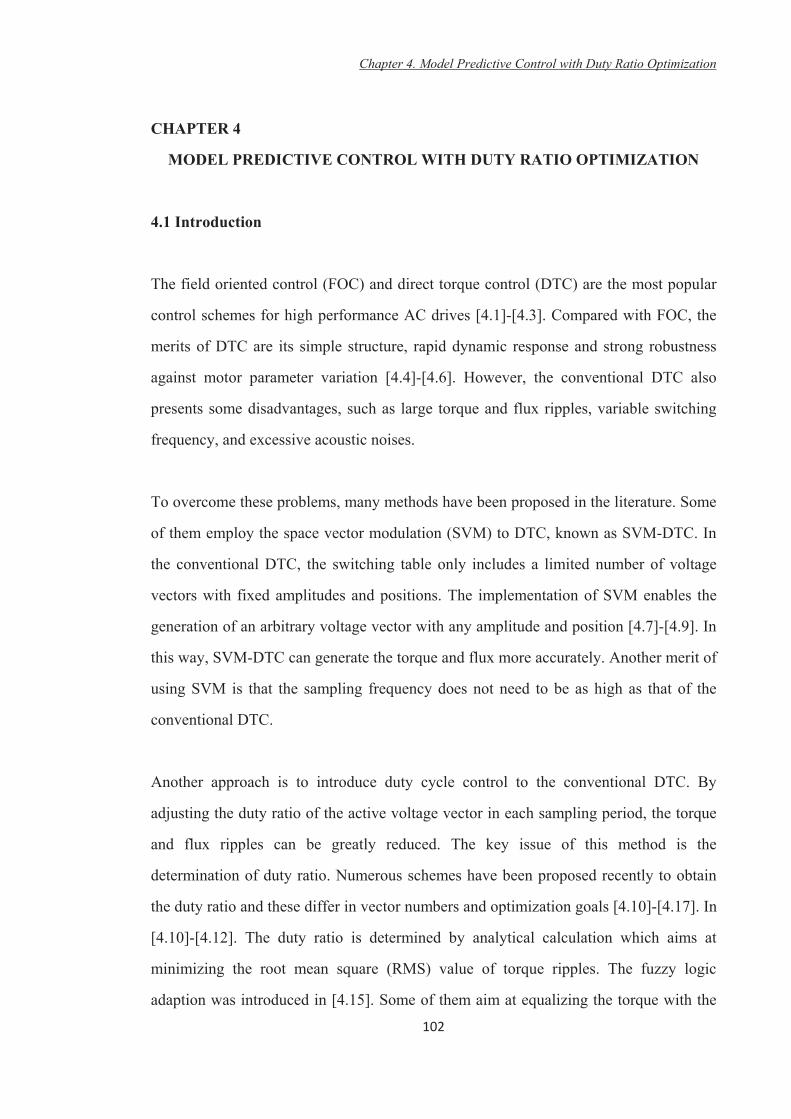
Chapter 4. Model Predictive Control with Duty Ratio Optimization
102
CHAPTER 4
MODEL PREDICTIVE CONTROL WITH DUTY RATIO OPTIMIZATION
4.1 Introduction
The field oriented control (FOC) and direct torque control (DTC) are the most popular
control schemes for high performance AC drives [4.1]-[4.3]. Compared with FOC, the
merits of DTC are its simple structure, rapid dynamic response and strong robustness
against motor parameter variation [4.4]-[4.6]. However, the conventional DTC also
presents some disadvantages, such as large torque and flux ripples, variable switching
frequency, and excessive acoustic noises.
To overcome these problems, many methods have been proposed in the literature. Some
of them employ the space vector modulation (SVM) to DTC, known as SVM-DTC. In
the conventional DTC, the switching table only includes a limited number of voltage
vectors with fixed amplitudes and positions. The implementation of SVM enables the
generation of an arbitrary voltage vector with any amplitude and position [4.7]-[4.9]. In
this way, SVM-DTC can generate the torque and flux more accurately. Another merit of
using SVM is that the sampling frequency does not need to be as high as that of the
conventional DTC.
Another approach is to introduce duty cycle control to the conventional DTC. By
adjusting the duty ratio of the active voltage vector in each sampling period, the torque
and flux ripples can be greatly reduced. The key issue of this method is the
determination of duty ratio. Numerous schemes have been proposed recently to obtain
the duty ratio and these differ in vector numbers and optimization goals [4.10]-[4.17]. In
[4.10]-[4.12]. The duty ratio is determined by analytical calculation which aims at
minimizing the root mean square (RMS) value of torque ripples. The fuzzy logic
adaption was introduced in [4.15]. Some of them aim at equalizing the torque with the

Chapter 4. Model Predictive Control with Duty Ratio Optimization
103
reference value over one sampling period [4.13], [4.14]. For the methods in
[4.10]-[4.15], they only considered the torque ripple reduction and failed to take the flux
ripple reduction into account. Although the effectiveness of these methods has been
validated, they are usually complicated and rely heavily on the knowledge of machine
parameters. To reduce both torque and flux ripples, a novel strategy using two active
vectors and one null vector was proposed in [4.16] for the doubly fed induction
generator (DFIG). This method needs two switching tables (one for dynamic process
and the other for steady state operation). The details of the machine parameters are also
needed to calculate the torque slope. The complexity of the drive system is increased
along with the deterioration of the system’s robustness. Recently a very simple but
effective method was proposed in [4.17]. It reduces both torque and flux ripples and
does not require the knowledge of machine parameters for duty ratio calculation. The
effectiveness of this method is validated on a PMSM DTC drive [4.17].
The conventional DTC and MPC are similar in that they both select only one voltage
vector in each sampling period. However, their selection rules are different and MPC is
more advanced and accurate. In this chapter, a novel control scheme is proposed, which
is a combination of MPC and the duty determination method proposed in [4.17].
The proposed MPC drive system can achieve much lower torque and flux ripples than
the original MPC and DTC, especially at a low system sampling frequency. This is a
very desirable feature for high power applications (e.g. electric vehicles). Both
simulation and experimental results will be presented to confirm its effectiveness.
In addition, all these control methods mentioned above (the conventional DTC, MPC
and MPC with duty ratio optimization) are tested under a wide system sampling
frequency range (from 1.5 kHz to 20 kHz).

Chapter 4. Model Predictive Control with Duty Ratio Optimization
104
4.2 Model Predictive Control with Duty Ratio Optimization
The machine model introduced in Chapter 3 is repeated here.
(3.19)
(3.20)
(3.21)
For voltage source inverter-fed MPC, the voltage vector is the sole controllable input
variable, and it is desirable to analytically derive the relationship between the torque and
voltage vector.
From (3.19) and (3.20), we can get
(4.1)
From (3.21), the torque differentiation with respect to time t is
(4.2)
Substituting (3.19), (3.20), and (4.1) into (4.2) and omitting the tedious derivation
process, the final torque differentiation is
(4.3)

Chapter 4. Model Predictive Control with Duty Ratio Optimization
105
It is seen from (4.3) that the torque differentiation is comprised of three parts, similar to
the case in the induction machine [4.16]. The first part T1 is always negative with
respect to Te, and the second part is also negative and proportional to rotor speed. The
last term is a positive one reflecting the effect of stator voltage on Te. When the zero
voltage vector is selected, the torque differentiation becomes
(4.4)
indicating that the zero voltage vector always decreases the torque.
In the conventional MPC, the selected voltage vector works during the whole sampling
period. In many cases, it is not necessary to work for the entire period to meet the
performance requirement of torque and flux. This is one of the main reasons for the
torque and flux ripples. By introducing a null vector to each sampling period, the effects
of voltage on torque can be adjusted to be more moderate, in order to diminish the
ripples of torque and flux.
From (4.3), it can be observed that the torque can be changed by adjusting the amplitude
and time duration of . The amplitude is decided by the DC bus voltage and is usually
fixed, while the time duration of can be varied from zero to the whole period, which
is equivalent to changing the voltage vector length. The null vector only decreases the
torque, as shown in (4.4), while appropriate non-zero vectors can increase the torque,
and it is possible to employ both null and nonzero vectors during one cycle to reduce the
torque ripple. The appropriate non-zero vectors are also referred as ‘active vector’. The
key issue is how to determine the time duration of the two vectors, or the duty ratio of
the active vector.

Chapter 4. Model Predictive Control with Duty Ratio Optimization
106
The expression of duty ratio for MPC is shown as follows
(4.5)
where d is the duty ratio of the active voltage vector; are predicted
torque and flux values; and and the two positive constants.
The idea of this method is that the larger difference between the reference and predicted
torque values leads to a larger duty ratio value. The lower and value can lead
to quicker dynamic response (e.g. take less time to reach the given speed), but poorer
steady-state response (e.g. higher torque and flux ripples). Higher values of and
lead to a better steady-state response, but a slower dynamic response. Therefore, the
determination of these values is a compromise between the steady-state and dynamic
performances. This phenomenon is deeply investigated in [4.17]. Extensive simulation
and experimental results have proven that the permanent magnet flux value and
half-rated torque value for and can provide a good compromise between the
steady state performance and dynamic response.
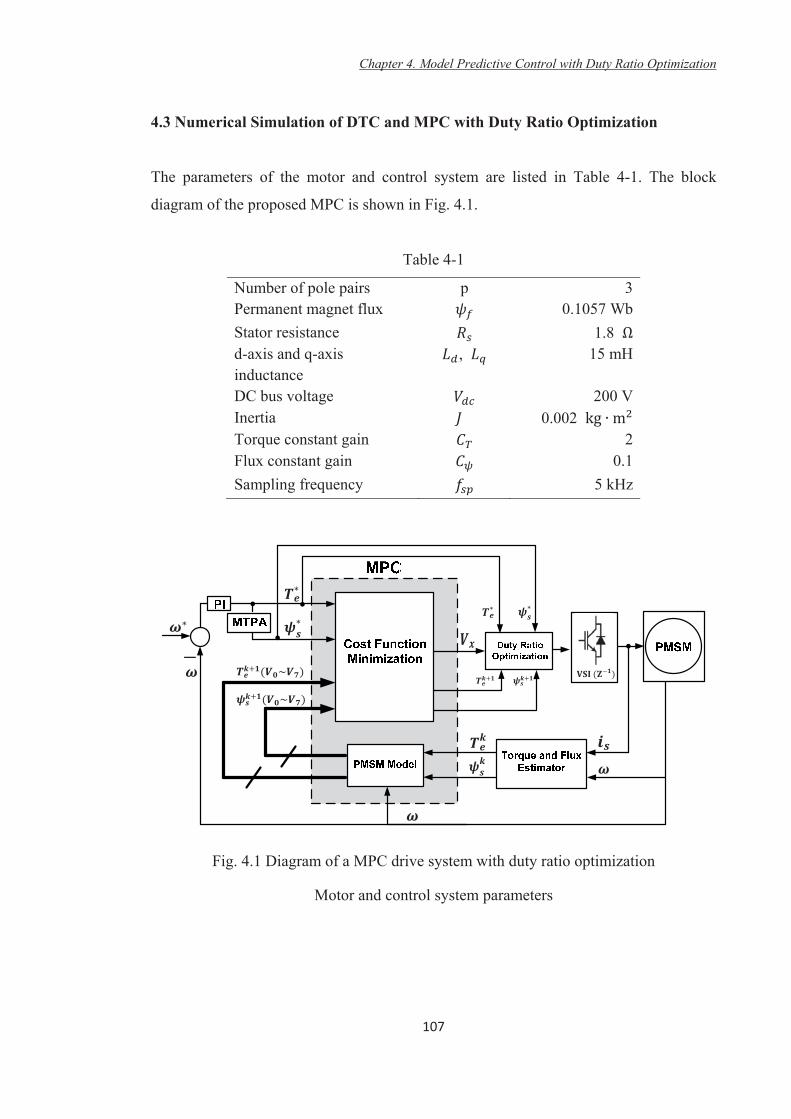
Chapter 4. Model Predictive Control with Duty Ratio Optimization
107
4.3 Numerical Simulation of DTC and MPC with Duty Ratio Optimization
The parameters of the motor and control system are listed in Table 4-1. The block
diagram of the proposed MPC is shown in Fig. 4.1.
Table 4-1
Number of pole pairs p 3 Permanent magnet flux 0.1057 Wb Stator resistance 1.8 d-axis and q-axis inductance
, 15 mH
DC bus voltage 200 V Inertia 0.002 Torque constant gain 2 Flux constant gain 0.1 Sampling frequency 5 kHz
Fig. 4.1 Diagram of a MPC drive system with duty ratio optimization
Motor and control system parameters
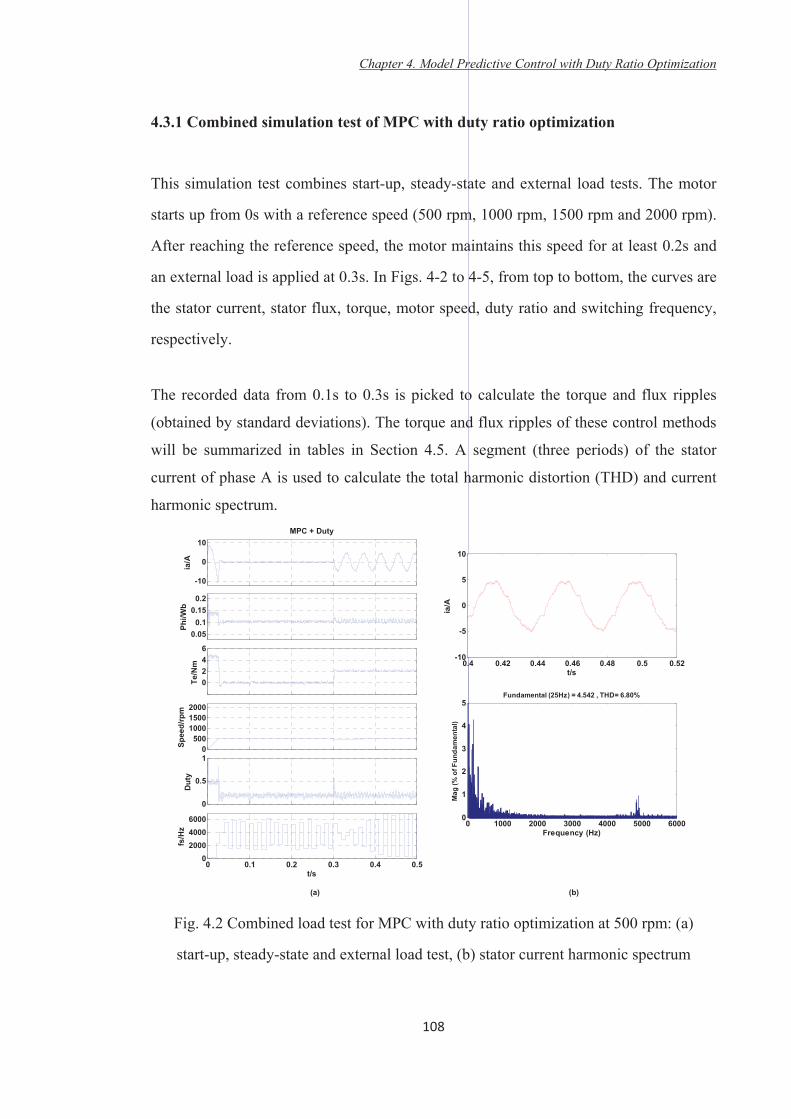
Chapter 4. Model Predictive Control with Duty Ratio Optimization
108
4.3.1 Combined simulation test of MPC with duty ratio optimization
This simulation test combines start-up, steady-state and external load tests. The motor
starts up from 0s with a reference speed (500 rpm, 1000 rpm, 1500 rpm and 2000 rpm).
After reaching the reference speed, the motor maintains this speed for at least 0.2s and
an external load is applied at 0.3s. In Figs. 4-2 to 4-5, from top to bottom, the curves are
the stator current, stator flux, torque, motor speed, duty ratio and switching frequency,
respectively.
The recorded data from 0.1s to 0.3s is picked to calculate the torque and flux ripples
(obtained by standard deviations). The torque and flux ripples of these control methods
will be summarized in tables in Section 4.5. A segment (three periods) of the stator
current of phase A is used to calculate the total harmonic distortion (THD) and current
harmonic spectrum.
Fig. 4.2 Combined load test for MPC with duty ratio optimization at 500 rpm: (a)
start-up, steady-state and external load test, (b) stator current harmonic spectrum
0246
Te/N
m
0.10.15
0.2
0.05
Phi/W
b
0 0.1 0.2 0.3 0.4 0.50
200040006000
t/s
fs/H
z
-10
0
10
ia/A
MPC + Duty
0 1000 2000 3000 4000 5000 60000
1
2
3
4
5
Frequency (Hz)
Fundamental (25Hz) = 4.542 , THD= 6.80%
Mag
(% o
f Fun
dam
enta
l)
0.4 0.42 0.44 0.46 0.48 0.5 0.52
-5
-10
0
5
10
ia/A
t/s
0500
100015002000
Spee
d/rp
m
0
0.5
1
Dut
y
(a) (b)

Chapter 4. Model Predictive Control with Duty Ratio Optimization
109
Fig. 4.3 Combined load test for MPC with duty ratio optimization at 1000 rpm: (a)
start-up, steady-state and external load test, (b) stator current harmonic spectrum
Fig. 4.4 Combined load test for MPC with duty ratio optimization at 1500 rpm: (a)
start-up, steady-state and external load test, (b) stator current harmonic spectrum
0246
Te/N
m0.1
0.150.2
0.05
Phi/W
b
0 0.1 0.2 0.3 0.4 0.50
200040006000
t/s
fs/H
z
-10
0
10
ia/A
MPC + Duty
0 1000 2000 3000 4000 5000 60000
1
2
3
4
5
Frequency (Hz)
Fundamental (25Hz) = 4.467 , THD= 8.61%
Mag
(% o
f Fun
dam
enta
l)
0.4 0.42 0.44 0.46
-5
-10
0
5
10
ia/A
t/s
0500
100015002000
Spee
d/rp
m
0
0.5
1
Dut
y
(a) (b)
0246
Te/N
m
0.10.15
0.2
0.05
Phi/W
b
0 0.1 0.2 0.3 0.4 0.50
200040006000
t/s
fs/H
z
-10
0
10
ia/A
MPC + Duty
0 1000 2000 3000 4000 5000 60000
1
2
3
4
5
Frequency (Hz)
Fundamental (25Hz) = 4.381 , THD= 9.28%
Mag
(% o
f Fun
dam
enta
l)
0.4 0.42 0.44
-5
-10
0
5
10
ia/A
t/s
0500
100015002000
Spee
d/rp
m
0
0.5
1
Dut
y
(a) (b)

Chapter 4. Model Predictive Control with Duty Ratio Optimization
110
Fig. 4.5 Combined load test for MPC with duty ratio optimization at 2000 rpm: (a)
start-up, steady-state and external load test, (b) stator current harmonic spectrum
It can be found that the proposed MPC scheme present very low torque and flux ripples
and excellent dynamic response. The proposed MPC scheme also presents very low
stator current THDs and narrow harmonic spectrums with the dominant harmonics
around 5 kHz.
0246
Te/N
m0.1
0.150.2
0.05
Phi/W
b
0 0.1 0.2 0.3 0.4 0.50
200040006000
t/s
fs/H
z
-10
0
10
ia/A
MPC + Duty
0 1000 2000 3000 4000 5000 60000
1
2
3
4
5
Frequency (Hz)
Fundamental (25Hz) = 4.417 , THD= 9.09%
Mag
(% o
f Fun
dam
enta
l)
0.4 0.42 0.42 0.43
-5
-10
0
5
10
ia/A
t/s
0500
100015002000
Spee
d/rp
m
0
0.5
1
Dut
y
(a) (b)

Chapter 4. Model Predictive Control with Duty Ratio Optimization
111
4.3.2 Reversing test (from 1000rpm to -500 rpm)
In this section, the motor maintain the speed of 1000 rpm from 0s and the reference
speed is set to -500 rpm from 0.05s. In Fig. 4-6, from top to bottom, the curves are the
stator current, stator flux, torque and motor speed respectively.
Fig. 4.6 Reversing test for MPC with duty ratio optimization
Fig. 4.6 shows the simulation result of reversing test from +1000 rpm to –500 rpm. As
shown, the proposed performed well and the motor speed was reversed within a short
time period.
-20
-10
0
10
20Ia
/AMPC
0
0.05
0.1 0.15
0.2
Phis
/Wb
-6
-4
-2
0
2
Te/N
m
0 0.05 0.1 0.15
0
-500
500
1,000
t/s
Spee
d/rp
m

Chapter 4. Model Predictive Control with Duty Ratio Optimization
112
4.4 Experimental Testing of DTC and MPC with Duty Ratio Optimization
The experimental tests are performed on the same testing platform introduced in
Chapter 3.
4.4.1 Steady state responses
The steady-state responses at 500 rpm, 1000 rpm, 1500 rpm and 2000 rpm are presented
in this section, respectively. In Figs. 4-7 to 4-10, from top to bottom, the curves shown
are the torque, stator flux, switching frequency and duty ratio (only for MPC with duty).
It is seen that in MPC with duty ratio optimization, the torque and flux ripples are
reduced significantly compared to other methods. The duty ratio increases along with
the increase in motor speed. The quantitative index of the average switching frequency,
stator flux ripple and torque ripple for these tests will be summarized in Section 4.5.
500 rpm
Fig. 4.7 Steady-state response at 500 rpm for: (a) DTC, (b) MPC and (c) MPC with duty
ratio optimization
-2-1012
Te/N
m
MPC Duty
0.04
0.10
0.16
Phis
/Wb
0
2000
4000
fs/H
z
0 1 20
0.5
1
t/s
duty
0 1 20
2000
4000
t/s
fs/H
z
0.04
0.10
0.16
Phis
/Wb
-2-1012
Te/N
m
MPC
0 1 20
2000
4000
t/s
fs/H
z
0.04
0.10
0.16
Phis
/Wb
-2-1012
Te/N
m
Classic DTC
(c)(b)(a)

Chapter 4. Model Predictive Control with Duty Ratio Optimization
113
1000 rpm
Fig. 4.8 Steady-state response at 1000 rpm for: (a) DTC, (b) MPC and (c) MPC with
duty ratio optimization
1500 rpm
Fig. 4.9 Steady-state response at 1500 rpm for: (a) DTC, (b) MPC and (c) MPC with
duty ratio optimization
-2-1012
Te/N
m
MPC Duty
0.04
0.10
0.16
Phis
/Wb
0
2000
4000
fs/H
z
0 1 20
0.5
1
t/s
duty
0 1 20
2000
4000
t/sfs
/Hz
0.04
0.10
0.16
Phis
/Wb
-2-1012
Te/N
m
MPC
0 1 20
2000
4000
t/s
fs/H
z
0.04
0.10
0.16
Phis
/Wb
-2-1012
Te/N
m
Classic DTC
(c)(b)(a)
-2-1012
Te/N
m
MPC Duty
0.04
0.10
0.16
Phis
/Wb
0
2000
4000
fs/H
z
0 1 20
0.5
1
t/s
duty
0 1 20
2000
4000
t/s
fs/H
z
0.04
0.10
0.16
Phis
/Wb
-2-1012
Te/N
m
MPC
0 1 20
2000
4000
t/s
fs/H
z
0.04
0.10
0.16
Phis
/Wb
-2-1012
Te/N
m
Classic DTC
(c)(b)(a)

Chapter 4. Model Predictive Control with Duty Ratio Optimization
114
2000 rpm
Fig. 4.10 Steady-state response at 2000 rpm for: (a) DTC, (b) MPC and (c) MPC with
duty ratio optimization
4.4.2 Dynamic response
In this section, the experimental start-up response is presented in Fig. 4.11. By
introducing the ramp-up function in the PI controller, the motor speed accelerates from
0 to 2000 rpm steadily with a small overshoot. From top to bottom, the curves shown
are the stator current, stator flux, torque and rotor speed.
The reversing test is presented in Fig. 4.12. The motor maintains the speed of +1000
rpm from 0s and the reference speed is set to –500 rpm at around 0.7s. From top to
bottom, the curves are the stator current, stator flux, torque and motor speed
respectively. As shown, the proposed method performed well. Within 1.5 s, the motor
speed was reversed.
The external load tests are presented in Figs. 4.13 and 4.14. In Fig. 4.13, the motor
operates at a steady state of 500 rpm and a 2 Nm load is suddenly applied on the shaft.
In Fig. 4.14, the motor operates at a steady state of 1000 rpm and a 1 Nm load is applied.
-2-1012
Te/N
m
MPC Duty
0.04
0.10
0.16
Phis
/Wb
0
2000
4000
fs/H
z
0 1 20
0.5
1
t/s
duty
0 1 20
2000
4000
t/s
fs/H
z
0.04
0.10
0.16
Phis
/Wb
-2-1012
Te/N
m
MPC
0 1 20
2000
4000
t/s
fs/H
z
0.04
0.10
0.16
Phis
/Wb
-2-1012
Te/N
m
Classic DTC
(c)(b)(a)
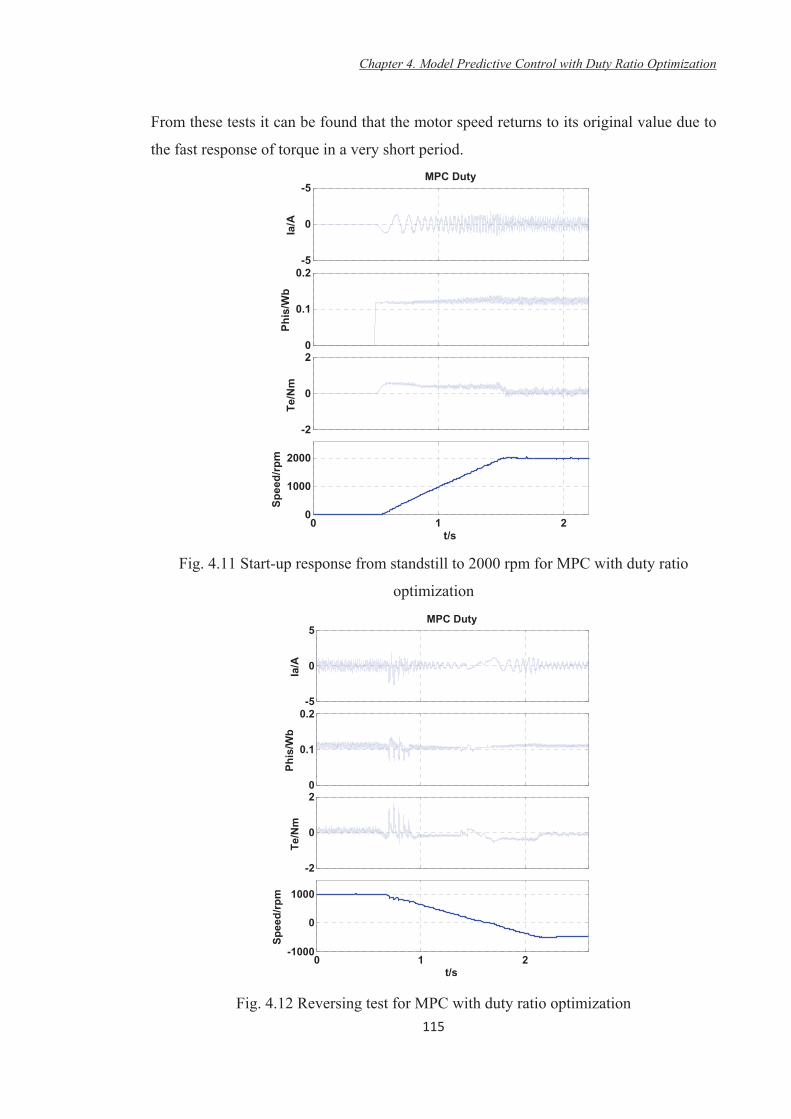
Chapter 4. Model Predictive Control with Duty Ratio Optimization
115
From these tests it can be found that the motor speed returns to its original value due to
the fast response of torque in a very short period.
Fig. 4.11 Start-up response from standstill to 2000 rpm for MPC with duty ratio
optimization
Fig. 4.12 Reversing test for MPC with duty ratio optimization
-5
0
-5
Ia/A
MPC Duty
0
0.1
0.2Ph
is/W
b
-2
0
2
Te/N
m
0 1 20
1000
2000
t/s
Spee
d/rp
m
-5
0
5
Ia/A
MPC Duty
0
0.1
0.2
Phis
/Wb
-2
0
2
Te/N
m
0 1 2-1000
0
1000
t/s
Spee
d/rp
m

Chapter 4. Model Predictive Control with Duty Ratio Optimization
116
Fig. 4.13 Response to 2 Nm external load at 500 rpm for MPC with duty ratio
optimization
Fig. 4.14 Response to 1 Nm external load at 1000 rpm for MPC with duty ratio
optimization
-5
0
5
Ia/A
MPC Duty
0
0.1
0.2
Phis
/Wb
0
2
2
4Te
/Nm
0 1 20
250
500
t/s
Spee
d/rp
m
-5
0
5
Ia/A
MPC Duty
0
0.1
0.2
Phis
/Wb
-1
0
1
2
Te/N
m
0 1 20
500
1000
t/s
Spee
d/rp
m
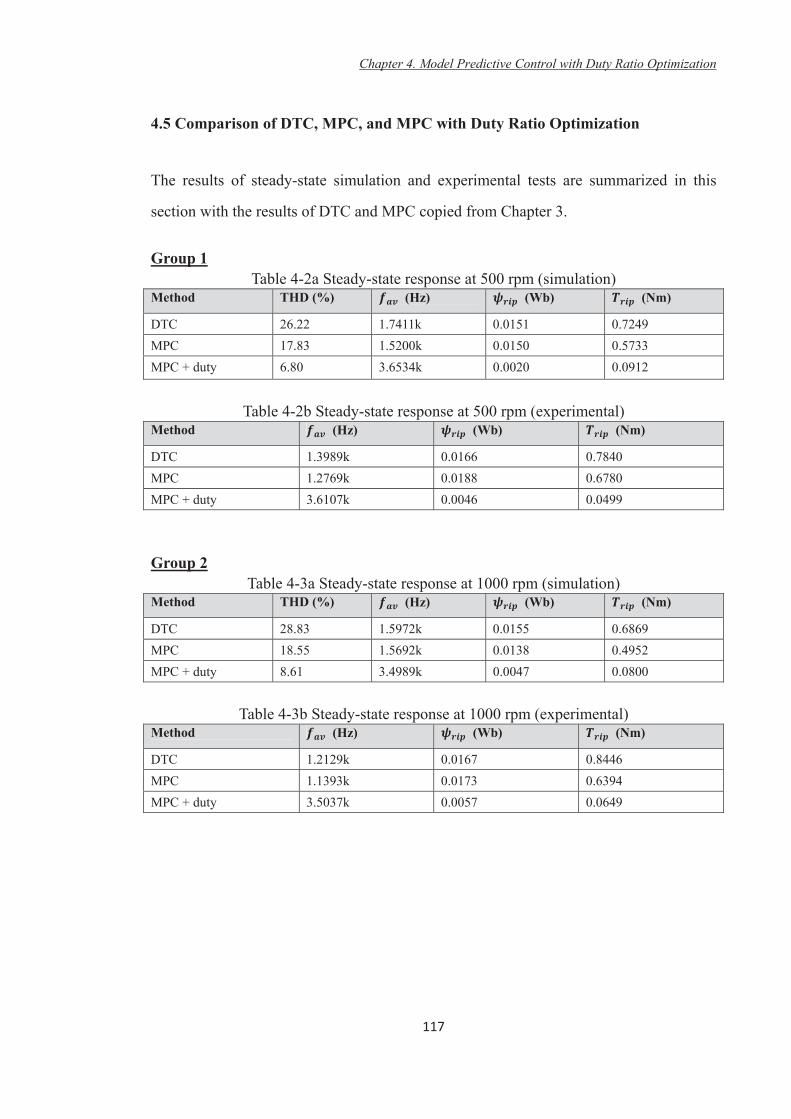
Chapter 4. Model Predictive Control with Duty Ratio Optimization
117
4.5 Comparison of DTC, MPC, and MPC with Duty Ratio Optimization
The results of steady-state simulation and experimental tests are summarized in this
section with the results of DTC and MPC copied from Chapter 3. Group 1
Table 4-2a Steady-state response at 500 rpm (simulation) Method THD (%) (Hz) (Wb) (Nm)
DTC 26.22 1.7411k 0.0151 0.7249 MPC 17.83 1.5200k 0.0150 0.5733 MPC + duty 6.80 3.6534k 0.0020 0.0912
Table 4-2b Steady-state response at 500 rpm (experimental)
Method (Hz) (Wb) (Nm)
DTC 1.3989k 0.0166 0.7840 MPC 1.2769k 0.0188 0.6780 MPC + duty 3.6107k 0.0046 0.0499
Group 2
Table 4-3a Steady-state response at 1000 rpm (simulation) Method THD (%) (Hz) (Wb) (Nm)
DTC 28.83 1.5972k 0.0155 0.6869 MPC 18.55 1.5692k 0.0138 0.4952 MPC + duty 8.61 3.4989k 0.0047 0.0800
Table 4-3b Steady-state response at 1000 rpm (experimental)
Method (Hz) (Wb) (Nm)
DTC 1.2129k 0.0167 0.8446 MPC 1.1393k 0.0173 0.6394 MPC + duty 3.5037k 0.0057 0.0649

Chapter 4. Model Predictive Control with Duty Ratio Optimization
118
Group 3 Table 4-4a Steady-state response at 1500 rpm (simulation)
Method THD (%) (Hz) (Wb) (Nm)
DTC 20.17 1.2413k 0.0133 0.7191 MPC 17.75 1.4188k 0.0136 0.4432 MPC + duty 9.28 3.6011k 0.0052 0.0671
Table 4-4b Steady-state response at 1500 rpm (experimental)
Method (Hz) (Wb) (Nm)
DTC 1.0965k 0.0168 0.8020 MPC 0.9126k 0.0162 0.5084 MPC + duty 3.5305k 0.0061 0.0780
Group 4
Table 4-5a Steady-state response at 2000 rpm (simulation) Method THD (%) (Hz) (Wb) (Nm)
DTC 26.80 1.2279k 0.0183 0.9046 MPC 13.13 1.2016k 0.0126 0.5031 MPC + duty 9.09 3.7765k 0.0062 0.0688
Table 4-5b Steady-state response at 2000 rpm (experimental)
Method (Hz) (Wb) (Nm)
DTC 0.8774k 0.0165 0.6952 MPC 0.7033k 0.0154 0.4642 MPC + duty 3.5791k 0.0070 0.1218
The tests results listed above are discussed in detail:
MPC+duty vs. DTC
From the simulation results, by comparing with DTC, the introduction of duty ratio
optimization to MPC can reduce the stator current THD by 74.1% (500 rpm), 70.1%
(1000 rpm), 54.0% (1500 rpm) and 66.1% (2000 rpm), reduce the flux ripple by 86.8%
(500 rpm), 69.7% (1000 rpm), 60.9 % (1500 rpm) and 66.1% (2000 rpm) and reduce the
torque ripple by 87.4% (500 rpm), 88.4% (1000 rpm), 89.4% (1500 rpm) and 92.4%
(2000 rpm).

Chapter 4. Model Predictive Control with Duty Ratio Optimization
119
From the experimental tests results, it is seen that the implementation of duty ratio
optimization can reduce the flux ripple by 72.3% (500 rpm), 65.9% (1000 rpm), 63.7%
(1500 rpm) and 57.6% (2000 rpm) and reduce the torque ripple by 93.6%(500 rpm),
92.3% (1000 rpm), 90.3% (1500 rpm) and 82.5% (2000 rpm).
With the help of duty ratio optimization, a tremendous drop in torque and flux ripples
can be seen in both simulation and experimental tests. It also should be noticed that the
switching frequency almost increase by three times in most tests.
MPC+duty vs. MPC
From the simulation results, by comparing with MPC, the introduction of duty ratio
optimization can reduce the stator current THD by 61.9% (500 rpm), 53.6% (1000 rpm),
47.7% (1500 rpm) and 30.8% (2000 rpm), reduce the flux ripple by 86.7% (500 rpm),
65.9% (1000 rpm), 61.8 % (1500 rpm) and 50.8% (2000 rpm) and reduce the torque
ripple by 84.1% (500 rpm), 83.8% (1000 rpm), 84.9% (1500 rpm) and 86.3% (2000
rpm).
From the experimental tests results, it is seen that the implementation of duty ratio
optimization can reduce the flux ripple by 75.5% (500 rpm), 67.1% (1000 rpm), 62.3%
(1500 rpm) and 54.5% (2000 rpm) and reduce the torque ripple by 92.6%(500 rpm),
89.9% (1000 rpm), 84.7% (1500 rpm) and 73.8% (2000 rpm).
As shown in above tests analysis, a significant decrease in torque and flux ripples can be
found as well as a dramatic increase of switching frequency.

Chapter 4. Model Predictive Control with Duty Ratio Optimization
120
Summary
According to the analysis above, it can be concluded that:
MPC with duty ratio optimization can achieve a better performance than DTC and
original MPC in terms of torque and flux ripples reduction;
Under the same system sampling frequency (5 kHz), the switching frequency of the
proposed method is much higher than other methods;
In DTC and MPC, the switching frequency slightly decreases along with the
increase of motor speed. However, the switching frequency is almost stable in the
proposed method.
4.6 The Influence of Variable Sampling Frequency on Drive Performance
4.6.1 Simulation test
In this section, the steady-state performance under a wide range of sampling frequency
(1.5 kHz – 20 kHz) of the control methods mentioned above is tested numerically in
Matlab/Simulink. These simulations are performed at 1000 rpm with no load and the
sampling frequencies are set to 1.5 kHz, 2 kHz, 2.5 kHz, 3 kHz, 3.5 kHz, 4 kHz, 4.5
kHz, 5 kHz, 6 kHz, 7 kHz, 8 kHz, 9 kHz, 10 kHz, 12.5 kHz, 15 kHz, 18 kHz and 20
kHz, respectively. The torque ripple is obtained by standard deviations.
In Fig. 4.15, the horizontal axis is the sampling frequency and the vertical axis is the
torque ripple. In Fig. 4.16, the horizontal axis is the sampling frequency and the vertical
axis is the flux ripple. In the range from 1.5 kHz to 5 kHz, it can be found that the
torque and flux ripples reduce rapidly along with the increase of sampling frequency. In
the range from 5 kHz to 20 kHz, the trend for the torque and flux ripple reduction is a
gradual one.

In Figs. 4
The horizo
with duty
methods a
.17 and 4.1
ontal axes i
y ratio optim
at the same s
Fig. 4.1
8, the verti
in both figu
mization pr
switching fr
15 Torque r
Chapter 4. M
1
ical axes ar
ures are swi
resents sma
frequency.
ripple vs. sa
Model Predictiv
121
re torque rip
itching freq
aller torque
ampling freq
ve Control wi
pple and flu
quency. It ca
and flux r
quency (sim
ith Duty Ratio
ux ripple, re
an be found
ripples than
mulation)
Optimization
espectively.
d that MPC
n the other
n
.
C
r

Fig. 4
Fig. 4.1
4.16 Flux rip
17 Torque ri
Chapter 4. M
1
pple vs. sam
ipple vs. sw
Model Predictiv
122
mpling frequ
witching freq
ve Control wi
uency (simu
quency (sim
ith Duty Ratio
ulation)
mulation)
Optimization
n
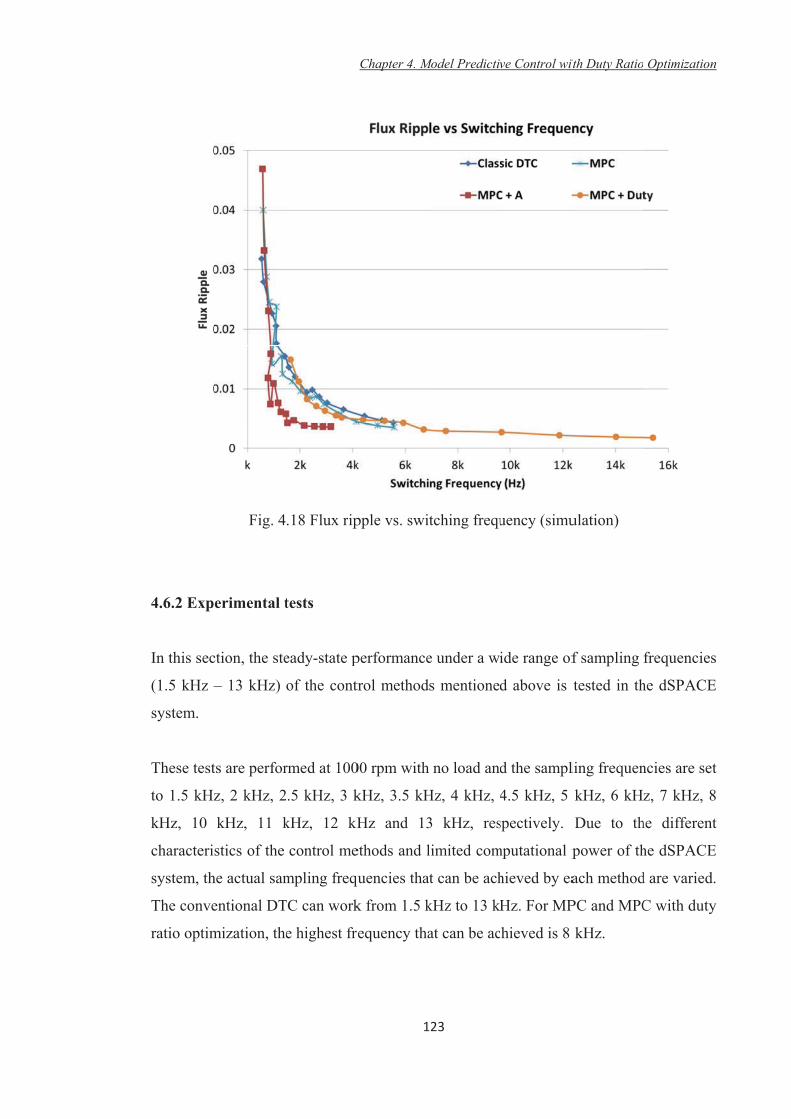
4.6.2 Exp
In this sec
(1.5 kHz –
system.
These test
to 1.5 kHz
kHz, 10
characteri
system, th
The conve
ratio optim
Fig. 4
erimental t
ction, the ste
– 13 kHz)
ts are perfor
z, 2 kHz, 2
kHz, 11 k
stics of the
he actual sam
entional DT
mization, the
.18 Flux rip
tests
eady-state p
of the contr
rmed at 100
2.5 kHz, 3 k
kHz, 12 kH
control me
mpling frequ
TC can work
e highest fre
Chapter 4. M
1
pple vs. swi
performance
trol method
00 rpm with
kHz, 3.5 kH
Hz and 13
ethods and l
quencies tha
k from 1.5 k
equency tha
Model Predictiv
123
tching frequ
e under a wi
s mentioned
no load and
Hz, 4 kHz, 4
3 kHz, res
limited com
at can be ach
kHz to 13 kH
at can be ac
ve Control wi
uency (simu
ide range of
d above is
d the sampl
4.5 kHz, 5
spectively.
mputational p
hieved by ea
Hz. For MP
hieved is 8
ith Duty Ratio
ulation)
f sampling
tested in th
ling frequen
kHz, 6 kH
Due to th
power of th
ach method
PC and MPC
kHz.
Optimization
frequencies
he dSPACE
ncies are set
z, 7 kHz, 8
he different
he dSPACE
d are varied.
C with duty
n
s
E
t
8
t
E
.
y

In Figs. 4
axes are th
from 1.5 k
along with
trend of t
optimizati
In Figs. 4
axes are
informativ
efficiency
MPC decr
the torque
4.19 and 4.2
he torque ri
kHz to 5 kH
h the increa
the torque
ion, the curv
4.21 and 4.2
the torque
ve than Fig
y is used as
rease drama
e ripple redu
Fig. 4.1
20, the hori
pple and flu
Hz, it can b
ase of samp
and flux r
ve is relativ
22, the hori
e ripple an
gs. 4.19 an
the variable
atically alon
uction of the
9 Torque ri
Chapter 4. M
1
izontal axis
ux ripple, re
be found tha
pling frequen
ripple reduc
vely plain an
izontal axis
nd flux rip
nd 4.20 in
e. It can be
ng with the
e proposed m
ipple vs. sam
Model Predictiv
124
s is the sam
espectively.
at the torqu
ncy. In the
ction is gra
nd it lies at t
is the swit
pple, respec
some exte
observed th
increase of
method seem
mpling freq
ve Control wi
mpling frequ
. For DTC a
ue and flux
range from
adual. For
the bottom o
tching frequ
ctively. The
nt because
hat the torqu
f switching f
ms quite lim
uency (expr
ith Duty Ratio
uency and t
and MPC, i
ripples red
m 5 kHz to 1
MPC with
of the figur
uency and
ese figures
e the actual
ue ripples o
frequency.
mited.
rimental)
Optimization
the vertical
in the range
duce rapidly
13 kHz, the
duty ratio
re.
the vertical
s are more
l switching
of DTC and
In contrast,
n
l
e
y
e
o
l
e
g
d
,

Fig. 4.
Fig. 4.2
20 Flux rip
1 Torque rip
Chapter 4. M
1
pple vs. sam
pple vs. sw
Model Predictiv
125
mpling frequ
itching freq
ve Control wi
ency (expri
quency (exp
ith Duty Ratio
imental)
primental)
Optimization
n

Fig. 4.22 Flux ripp
Chapter 4. M
1
ple vs. swit
Model Predictiv
126
ching frequ
ve Control wi
uency (expri
ith Duty Ratio
imental)
Optimization
n

Chapter 4. Model Predictive Control with Duty Ratio Optimization
127
4.7 Conclusion
A model-based predictive control with duty ratio optimization method is proposed in
this chapter, in order to reduce both torque and flux ripples. It is achieved by adjusting
the duty ratio of the active voltage vector and null voltage vector. As a development of
the method introduced in [4.17], the proposed method can achieve a better performance
than its predecessor in terms of stator current THD and torque and flux ripples. The
effectiveness of the proposed method is confirmed by a comparative study with prior
arts using simulation and experimental verification on a PMSM drive.
In addition, the influence of system sampling frequency on the steady-state performance
is investigated. The new method even with low sampling frequencies can achieve much
smaller torque ripple than DTC and MPC. Its steady-state performance is also much less
sensitive to the variation of system sampling frequency.

Chapter 4. Model Predictive Control with Duty Ratio Optimization
128
REFERENCES
[4.1] J. Lee, J. Hong, K. Nam, R. Ortega, L. Praly, and A. Astolfi, “Sensorless
control of surface-mount permanent-magnet synchronous motors based on a
nonlinear observer,” IEEE Trans. Power Electron., vol. 25, no. 2, pp. 290–297,
Feb. 2010.
[4.2] S. Y. Kim, W. Lee, M. S. Rho, and S. Y. Park, “Effective dead-time
compensation using a simple vectorial disturbance estimator in PMSM drives,”
IEEE Trans. Ind. Electron., vol. 57, no. 5, pp. 1609–1614, May 2010.
[4.3] F. Genduso, R. Miceli, C. Rando, and G. R. Galluzzo, “Back EMF
sensorless-control algorithm for high-dynamic performance PMSM,” IEEE
Trans. Ind. Electron., vol. 57, no. 6, pp. 2092–2100, Jun. 2010.
[4.4] I. Takahashi and T. Noguchi, “A new quick-response and high-efficiency
control strategy of an induction motor,” IEEE Trans. Ind. Appl., vol. IA- 22, no.
5, pp. 820–827, Sep. 1986.
[4.5] M. Depenbrock, “Direct self-control (DSC) of inverter-fed induction machine,”
IEEE Trans. Power Electron., vol. 3, no. 4, pp. 420–429, Oct. 1988.
[4.6] G. S. Buja and M. P. Kazmierkowski, “Direct torque control of PWM
inverter-fed AC motors—A survey,” IEEE Trans. Ind. Electron., vol. 51, no. 4,
pp. 744–757, Aug. 2004.
[4.7] Y.-S. Lai and J.-H. Chen, “A new approach to direct torque control of induction
motor drives for constant inverter switching frequency and torque ripple
reduction,” IEEE Trans. Energy Convers., vol. 16, no. 3, pp. 220– 227, Sep.
2001.
[4.8] C. Lascu and A. Trzynadlowski, “Combining the principles of sliding mode,
direct torque control, and space-vector modulation in a high-performance

Chapter 4. Model Predictive Control with Duty Ratio Optimization
129
sensorless ac drive,” IEEE Trans. Ind. Appl. vol. 40, no. 1, pp. 170–177,
Jan./Feb. 2004.
[4.9] Y. Zhang, J. Zhu, W. Xu, J. Hu, D. G. Dorrell, and Z. Zhao, “Speed sensorless
stator flux oriented control of three-level inverter-fed induction motor drive
based on fuzzy logic and sliding mode control,” in Proc. 36th IEEE IECON,
2010, pp. 2926–2931.
[4.10] J. K. Kang and S. K. Sul, “New direct torque control of induction motor for
minimum torque ripple and constant switching frequency,” IEEE Trans. Ind.
Appl., vol. 35, no. 5, pp. 1076–1082, Sep./Oct. 1999.
[4.11] K. B. Lee, J. H. Song, I. Choy, and J. Y. Yoo, “Torque ripple reduction in DTC
of induction motor driven by three-level inverter with low switching frequency,”
IEEE Trans. Power Electron, vol. 17, no. 2, pp. 255–264, Mar. 2002.
[4.12] K.-K. Shyu, J.-K. Lin, V.-T. Pham, M.-J. Yang, and T.-W. Wang, “Global
minimum torque ripple design for direct torque control of induction motor
drives,” IEEE Trans. Ind. Electron., vol. 57, no. 9, pp. 3148–3156, Sep. 2010.
[4.13] M. Pacas and J. Weber, “Predictive direct torque control for the PM
synchronous machine,” IEEE Trans. Ind. Electron., vol. 52, no. 5, pp. 1350–
1356, Oct. 2005.
[4.14] E. Flach, R. Hoffmann, and P. Mutschler, “Direct mean torque control of an
induction motor,” in Proc. EPE, 1997, vol. 3, pp. 672–677.
[4.15] L. Romeral, A. Arias, E. Aldabas, and M. Jayne, “Novel direct torque control
(DTC) scheme with fuzzy adaptive torque-ripple reduction,” IEEE Trans. Ind.
Electron., vol. 50, no. 3, pp. 487–492, Jun. 2003.
[4.16] G. Abad,M. A. Rodriguez, and J. Poza, “Two-level VSC based predictive direct
torque control of the doubly fed induction machine with reduced torque and
flux ripples at low constant switching frequency,” IEEE Trans. Power Electron.,

Chapter 4. Model Predictive Control with Duty Ratio Optimization
130
vol. 23, no. 3, pp. 1050–1061, May 2008.
[4.17] Y. Zhang and J. Zhu, “Direct torque control of permanent magnet synchronous
motor with reduced torque ripple and commutation frequency,” IEEE Trans.
Power Electron., vol. 26, no. 1, pp. 235–248, Jan. 2011.
[4.18] Tianshi Wang; Jianguo Zhu; Yongchang Zhang; , "Model predictive torque
control for PMSM with duty ratio optimization," Electrical Machines and
Systems (ICEMS), 2011 International Conference on , vol., no., pp.1-5, 20-23
Aug. 2011
[4.19] H. Miranda, P. Cortes, J. Yuz, and J. Rodriguez, “Predictive torque control of
induction machines based on state-space models,” IEEE Trans. Ind. Electron.,
vol. 56, no. 6, pp. 1916–1924, Jun. 2009.
[4.20] T. Geyer, G. Papafotiou, and M. Morari, “Model predictive direct torque
control—Part I: Concept, algorithm, and analysis,” IEEE Trans. Ind. Electron.,
vol. 56, no. 6, pp. 1894–1905, Jun. 2009.
[4.21] S. Kouro, P. Cortes, R. Vargas, U. Ammann, and J. Rodriguez, “Model
predictive control—a simple and powerful method to control power converters,”
IEEE Trans. Ind. Electron., vol. 56, no. 6, pp. 1826–1838, Jun. 2009.
[4.22] F. Morel, J.-M. Retif, X. Lin-Shi, and C. Valentin, “Permanent magnet
synchronous machine hybrid torque control,” IEEE Trans. Ind. Electron., vol.
55, no. 2, pp. 501–511, Feb. 2008.
[4.23] K. Drobnic, M. Nemec, D. Nedeljkovic, and V. Ambrozic, “Predictive direct
control applied to AC drives and active power filter,” IEEE Trans. Ind.
Electron., vol. 56, no. 6, pp. 1884–1893, Jun. 2009.
[4.24] Y. Zhang, J. Zhu, and W. Xu, “Predictive torque control of permanent magnet
synchronous motor drive with reduced switching frequency,” in Proc. Int. Conf.
Electr. Mach. Syst., 2010, pp. 798–803.

Chapter 5. Conclusions and Future Work
131
CHAPTER 5
CONCLUSIONS AND FUTURE WORK
5.1 Conclusions
The main achievements of this thesis are summarized below:
A comprehensive literature review was presented for PMSM machine structural
topologies and control strategies. The principles, implementations and
improvements of various control methods, such as the six-step control, field
oriented control (FOC), direct torque control (DTC) and model predictive control
(MPC), were discussed in details.
A comparative study was carried out on PMSM control methods, including
numerical simulations and experimental tests. A detailed data analysis based on the
results of the simulation and experimental results was presented showing the merits
and drawbacks of these control methods.
An improved MPC method with duty ratio optimization was proposed for PMSMs
to minimize the torque and flux ripples. This proposed method is most beneficial
when the system is working at a low sampling frequency because in a low
frequency range, the proposed MPC drive system can achieve much smaller torque
and flux ripples than the original MPC and DTC. Both simulation and experimental
results were presented to verify its effectiveness.
The influence of system sampling frequency on steady-state performance of the
classical DTC, original MPC, and improved MPCs were investigated by performing
a set of numerical simulations and experimental tests. The torque and flux ripples
decrease concurrently with the increase of sampling frequency. However, the trend
of this decrease is non-linear. In the low frequency range, the torque and flux
ripples drop rapidly. In the high frequency range, the trend for the torque and flux
ripple reduction is a gradual decrease.
Chapter 5. Conclusions and Future Work
132
5.2 Future Work
The possible future work following this project is listed below:
For the MPC introduced in this thesis, it needs to calculate the predicted value eight
times in each sampling period. This is unnecessary because some of the voltage
vectors obviously do not meet the requirements, such as torque decrease/increase
and stator flux decrease/increase. A simplified MPC can be developed, which may
include a voltage vector “filter” in its algorithm, in order to rule out some vectors
before they are calculated. In this way, the total calculation time can be greatly
reduced, which would be very beneficial when the level of the inverter increases to
a three or higher level inverter.
The one-step delay compensation scheme can be extended to other control methods
such as DTC and FOC, in order to improve the performance.
A flux weakening scheme can be developed for MPC, which is necessary for wide
speed range applications, such as electric vehicles.

APPENDIX A. LIST OF PUBLICATIONS FROM THIS WORK
133
APPENDIX A. LIST OF PUBLICATIONS FROM THIS WORK
[1] Tianshi Wang, Yongchang Zhang and Jianguo Zhu, “Model Predictive Control of
PMSMs with Duty Ratio Optimization for Torque Ripple Reduction, Ind. Electron.,
IEEE Transactions on, (Under peer review)
[2] Tianshi Wang, Jianguo Zhu and Yongchang Zhang, “Model Predictive Torque
Control for PMSM with Duty Ratio Optimization”, Electrical Machines and
Systems (ICEMS), 2011 International Conference on , vol., no., pp.1-5, 20-23 Aug.
2011. URL: http://ieeexplore.ieee.org/xpls/abs_all.jsp?arnumber=6073501
[3] Tianshi Wang, Jianguo Zhu, Yongchang Zhang, Youguang Guo and Gang Lei,
“Simulation and Experimental Studies of Permanent Magnet Synchronous Motor
Control Methods”, Applied Superconductivity and Electromagnetic Devices
(ASEMD), 2011 International Conference on, (In press). URL:
http://ieeexplore.ieee.org/xpls/abs_all.jsp?arnumber=6145113
[4] Tianshi Wang, Yongchang Zhang, Youguang Guo and Jianguo Zhu, “An
Assessment of The Influence of Sampling Frequency on Steady-State Performance
of PMSM Drive System”, Australasian Universities Power Engineering
Conference (AUPEC) 2012, (Accepted)
[5] Gang Lei, Yonguang Guo, Jianguo Zhu, Tianshi Wang, "System Level Six Sigma
Robust Optimization of a Drive System With PM Transverse Flux
Machine," Magnetics, IEEE Transactions on , vol.48, no.2, pp.923-926, Feb. 2012.
URL: http://ieeexplore.ieee.org/xpls/abs_all.jsp?arnumber=6136727
[6] Yongchang Zhang, Zhengxi Li, Tianshi Wang and Jianguo Zhu, "Predictive direct
torque and flux control of doubly fed induction generator with switching frequency
reduction for wind energy applications", Electrical Machines and Systems
(ICEMS), 2011 International Conference on , vol., no., pp.1-6, 20-23 Aug. 2011.
URL: http://ieeexplore.ieee.org/xpls/abs_all.jsp?arnumber=4153107
[7] Yongchang Zhang, Zhengxi Li, Tianshi Wang and Jianguo Zhu, "Evaluation of a
class of improved DTC method applied in DFIG for wind energy
applications", Electrical Machines and Systems (ICEMS), 2011 International
Conference on , vol., no., pp.1-6, 20-23 Aug. 2011. URL:

APPENDIX A. LIST OF PUBLICATIONS FROM THIS WORK
134
http://ieeexplore.ieee.org/xpls/abs_all.jsp?arnumber=6073720
[8] Wei Xu, Jianguo Zhu, Yongchang Zhang and Tianshi Wang, "Electromagnetic
design and performance evaluation on 75 kW axially laminated flux switching
permanent magnet machine", Electrical Machines and Systems (ICEMS), 2011
International Conference on , vol., no., pp.1-6, 20-23 Aug. 2011. URL:
http://ieeexplore.ieee.org/xpls/abs_all.jsp?arnumber=6073716