model public sector group – illustrative financial statements
TRANSCRIPT

Model Public Sector Group


Model Public Sector Group
Contents Abbreviations, key and definitions ............................................................................................................ 1 Introduction ............................................................................................................................................. 2 Independent auditors’ report to the governing body of Model Public Sector Group ...................................... 5 Consolidated statement of financial performance ...................................................................................... 6 Consolidated statement of financial position ............................................................................................. 8 Consolidated statement of changes in net assets ..................................................................................... 10 Consolidated statement of cash flows ..................................................................................................... 11 Consolidated statement of comparison of budget and actual amounts ...................................................... 12 Notes to the consolidated financial statements …………..………………………………………………………………………………. 14

Foreword A growing number of governments and international organizations around the world are recognizing the need for transparency in their finances and are, as a result, deciding to adopt International Public Sector Accounting Standards (IPSASs). Accurate, comprehensive and reliable financial information is fundamental to accountability and decision-making in the public sector. IPSASs are recognized as the only internationally accepted set of public sector accounting standards that provides such information.
The standards aim to provide clear guidance for a variety of different types of public sector entities in a number of (sometimes complex) accounting situations. However, preparers often struggle to translate the underlying principle of a standard into a practical solution to a specific accounting issue. As advisors on IPSAS conversion projects, EY often provides guidance on acceptable accounting options in the practical application of IPSAS. Against this background, we are delighted to present the first edition of Model Public Sector Group – Illustrative financial statements for the period ended 31 December 2013. This set of model consolidated financial statements for a model public sector entity aims to bridge the gap between the accounting theory, as outlined in the standards, and the presentation of such information in the financial statements.
This first edition of illustrative annual consolidated financial statements of Model Public Sector Group has been prepared by EY to assist you in preparing your own financial statements in accordance with IPSAS in issue at 30 June 2013 and effective for annual periods beginning on 1 January 2013.
We hope that you will find this guide useful. If you have any comments or suggestions, we would be happy to consider them for the next edition of this publication. Please e-mail me at: [email protected].
Yours sincerely,
Thomas Müller-Marqués Berger
Global Leader International Public Sector Accounting
1 Model Public Sector Group
Abbreviations, key and definitions The following styles of abbreviation are used in this set of Model Public Sector Group illustrative financial statements:
IPSAS 16.12 International Public Sector Accounting Standard No. 16, paragraph 12
IPSAS 16.BC1 International Public Sector Accounting Standard No. 16, Basis for Conclusions, paragraph 1
IAS 12 International Accounting Standard No. 12
IFRS 3 International Financial Reporting Standard 3
IFRIC 12.2 IFRS Interpretations Committee (formerly IFRIC) Interpretation No. 12, paragraph 2
IPSAS International Public Sector Accounting Standards
Commentary The commentary explains how the requirements of IPSAS have been implemented in arriving at the illustrative disclosure.
IPSASB International Public Sector Accounting Standards Board
GAAP Generally Accepted Accounting Practice/Principles
Definitions Governing body The term governing body is used in these illustrative financial statements to refer to that
person/body/entity that governs the Group in a manner similar to how a board of directors would govern a private company.
Management The term management is used to refer to the chief executive and senior management group of the Group that is responsible for the activities of the Group, to manage the resources of the Group and overall achievement of the Group’s objectives, as set out by the governing body.
Municipality A political unit, such as a city, town, or village, established for local government. Within the public sector, the following terms may also be used to describe the same type of entity:
City council Local council Town council Local authority Local government area

Model Public Sector Group 2
Introduction This publication contains an illustrative set of consolidated financial statements for Model Public Sector Group and its controlled entities (the Group) that is prepared in accordance with International Public Sector Accounting Standards (IPSAS). The Group is a fictitious municipality established in a fictitious country within Europe. The presentation currency of the Group is the euro.
Objective This set of consolidated financial statements is prepared by EY to assist you in preparing your own financial statements. The illustration reflects some of the transactions, events and circumstances that we consider to be common for a broad range of entities within the public sector. However, it does not address all possible transactions, events and arrangements. Therefore, additional disclosures may be required for the transactions, events or arrangements that are not addressed in these illustrative financial statements. While these illustrative financial statements may serve as a useful reference, users of this publication are encouraged to prepare entity-specific disclosures. Furthermore, certain disclosures are included in these financial statements merely for illustrative purposes even though they may be regarded as items or transactions that are not material to the Group. It should be noted that the illustrative financial statements of the Group are not designed to satisfy any country or jurisdiction-specific regulatory requirements.
Please note that these illustrative financial statements do not typically early adopt IPSAS standards or amendments before their effective date. However, in order to provide users with an illustration of the requirements of IPSAS 32 Service Concession Arrangements: Grantor, this standard has been early adopted in this set of illustrative financial statements.
Notations shown on the right-hand margin of each page are references to IPSAS paragraphs that describe the specific disclosure requirements. Commentaries are provided to explain the basis for the disclosure or to address alternative disclosures not included in the illustrative financial statements. Where there is any uncertainty with regard to the IPSAS requirements, it is essential to refer to the relevant source material and, where necessary, to seek appropriate professional advice.
International Public Sector Accounting Standards Boards (IPSASB) The IPSASB is an independent standard-setting board that develops International Public Sector Accounting Standards (IPSAS), non-mandatory Recommended Practice Guidance (RPG), and resources for use by public sector entities around the world for general purpose financial reporting. The IPSASB is one of four independent standard-setting boards supported by the International Federation of Accountants (IFAC), the worldwide organization for the accountancy profession.
The IPSASB aims to enhance the quality and transparency of public sector financial reporting by:
Establishing high-quality accounting standards for use by public sector entities Promoting the adoption of, and international convergence to, IPSAS Providing comprehensive information for public sector financial management and decision making Providing guidance on issues and experiences in financial reporting in the public sector
Accounting policy choices In some cases, IPSAS permits more than one accounting treatment for a transaction or event. Preparers of financial statements should select the treatment that is most relevant to their activities and the relevant circumstances as their accounting policy.
IPSAS 3 Accounting Policies, Changes in Accounting Estimates and Errors requires an entity to select and apply its accounting policies consistently for similar transactions, events and/or conditions, unless a standard specifically requires or permits categorization of items for which different policies may be appropriate. Where a standard requires or permits such categorization, an appropriate accounting policy is selected and applied consistently to each category. Therefore, once a choice of one of the alternative treatments has been made, it becomes an accounting policy and must be applied consistently. Changes in accounting policy should only be made if required by a standard, or if the change results in the financial statements providing more reliable and relevant information.
In this publication, when a choice is permitted by IPSAS, the Group has adopted one of the treatments as appropriate to the circumstances of the Group. In these cases, the commentary provides details of which policy has been selected, the reasons for this policy selection, and summarizes the difference in the disclosure requirements.
Financial, service performance and long-term sustainability reviews by the entity’s management Many public sector entities present financial, service performance and/or long-term sustainability reviews by executives of the entity that are outside the financial statements. IPSAS does not require the presentation of such information. However, the IPSASB has issued two recommended practice guidelines, RPG 1 Reporting on the Long-Term Sustainability of an Entity’s Finances and RPG 2 Financial Statement Discussion and Analysis, to assist entities in preparing and presenting such

reviews. Compliance with these RPGs is not required for an entity to assert that its financial statements comply with IPSAS. Further, the content of such reviews by management is often determined by local legislative requirements or issues specific to a particular jurisdiction.
No financial, service performance or long-term sustainability reviews have been included for the Group.
IPSAS as at 30 June 2013 The standards applied in these illustrative financial statements are the versions that were in issue as at 30 June 2013 and effective for annual periods beginning on 1 January 2013. Standards issued, but not yet effective as at 1 January 2013 have not been early adopted with the exception of IPSAS 32 which is applicable for annual periods beginning on 1 January 2014, has been early adopted in these illustrative financial statements.
IPSAS illustrated in the Group are as follows, unless otherwise noted:
International Public Sector Accounting Standards Included
IPSAS 1 Presentation of Financial Statements
IPSAS 2 Cash Flow Statements
IPSAS 3 Accounting Policies, Changes in Accounting Estimates and Errors
IPSAS 4 The Effects of Changes in Foreign Exchange Rates
IPSAS 5 Borrowing Costs
IPSAS 6 Consolidated and Separate Financial Statements
IPSAS 7 Investments in Associates
IPSAS 8 Interests in Joint Ventures IPSAS 9 Revenue from Exchange Transactions
IPSAS 10 Financial Reporting in Hyperinflationary Economies 1
IPSAS 11 Construction Contracts 2
IPSAS 12 Inventories
IPSAS 13 Leases
IPSAS 14 Events after the Reporting Date
IPSAS 16 Investment Property
IPSAS 17 Property, Plant, and Equipment
IPSAS 18 Segment Reporting
IPSAS 19 Provisions, Contingent Liabilities and Contingent Assets
IPSAS 20 Related Party Disclosures
IPSAS 21 Impairment of Non-Cash-Generating Assets
IPSAS 22 Disclosure of Financial Information about the General Government Sector 3
IPSAS 23 Revenue from Non-Exchange Transactions (Taxes and Transfers)
IPSAS 24 Presentation of Budget Information in Financial Statements
IPSAS 25 Employee Benefits
IPSAS 26 Impairment of Cash-Generating Assets
IPSAS 27 Agriculture 2
IPSAS 28 Financial Instruments: Presentation
IPSAS 29 Financial Instruments: Recognition and Measurement
IPSAS 30 Financial Instruments: Disclosures
IPSAS 31 Intangible Assets
IPSAS 32 Service Concession Arrangements: Grantor
This standard is incorporated into the accounting policies and / or individual transactions with appropriate note disclosures.

Model Public Sector Group 4
1 An assumption was made that the entity does not operate in a hyperinflationary economy.
2 These standards are not applied in this set of financial statements, as the Group does not usually engage in such transactions or arrangements.
3 This standard is applicable only to a government that elects to present information about the general government sector in their consolidated financial statements and is generally not applicable at an individual entity level. Therefore this standard is not applied in these illustrative financial statements.
All standards listed above incorporate all amendments effective on or before 1 January 2013, unless otherwise stated. It is important to note that the IPSASB may issue new or revised standards subsequent to 30 June 2013. Therefore, users of this publication are advised to verify that there has been no change in the IPSAS requirements between 30 June 2013 and the date on which their financial statements are authorized for issue. In accordance with IPSAS 3, specific disclosure requirements apply for standards issued but not yet effective.

5 Model Public Sector Group
Independent auditors’ report to the governing body of Model Public Sector Group We have audited the accompanying consolidated financial statements of Model Public Sector Group and its controlled entities (the Group), which comprise the consolidated statement of financial position as at 31 December 2013, and the consolidated statement of financial performance, consolidated statement of financial position, consolidated statement of changes in net assets, consolidated statement of cash flows and consolidated statement of comparison between budget and actual amounts for the year then ended, and a summary of significant accounting policies and other explanatory information.
Management’s responsibility for the consolidated financial statements Management is responsible for the preparation and fair presentation of these consolidated financial statements in accordance with International Public Sector Accounting Standards, and for such internal control as the management determines is necessary to enable the preparation of consolidated financial statements that are free from material misstatement, whether due to fraud or error.
Auditors’ responsibility Our responsibility is to express an opinion on these consolidated financial statements based on our audit. We conducted our audit in accordance with the International Standards on Auditing. Those standards require that we comply with ethical requirements and plan and perform the audit to obtain reasonable assurance about whether the financial statements are free from material misstatement.
An audit involves performing procedures to obtain audit evidence about the amounts and disclosures in the consolidated financial statements. The procedures selected depend on the auditors’ judgment, including the assessment of the risks of material misstatement of the consolidated financial statements, whether due to fraud or error. In making those risk assessments, the auditor considers internal control relevant to the Group’s preparation and fair presentation of the consolidated financial statements in order to design audit procedures that are appropriate in the circumstances, but not for the purpose of expressing an opinion on the effectiveness of the Group’s internal control. An audit also includes evaluating the appropriateness of accounting policies used and the reasonableness of accounting estimates made by management, as well as evaluating the overall presentation of the consolidated financial statements.
We believe that the audit evidence we have obtained is sufficient and appropriate to provide a basis for our audit opinion.
Opinion In our opinion, the consolidated financial statements present fairly, in all material respects, the financial position of the Group as at 31 December 2013, and its financial performance and cash flows for the year then ended in accordance with International Public Sector Accounting Standards.
Professional Accountants & Co. 30 March 2014 17 Euroville High Street Euroville
Commentary The auditors’ report has been prepared in accordance with ISA 700 Forming an Opinion and Reporting on Financial Statements. The auditors’ report may differ depending on the requirements of the relevant jurisdiction.

Model Public Sector Group 6
Consolidated statement of financial performance
For the year ended 31 December 2013 2013 2012 IPSAS 1.53, IPSAS 1.63 (c)
Notes €000 €000 IPSAS 1.53, IPSAS1.63 (d) & (e)
Revenue from non-exchange transactions IPSAS 1.102 (a) IPSAS 1 108, IPSAS 23.105 (a)
Property taxes revenue 3 4,706,641 4,524,363 IPSAS 1.104, IPSAS1.106, IPSAS 23.105(a) (i)
Public contributions and donations 4 63,661 79,720 IPSAS 1.104, IPSAS1.106, IPSAS 23.105 (a) (ii)
Fines, penalties and levies 5 1,781,670 1,677,436 IPSAS 1.104, IPSAS1.106, IPSAS 23.105 (a) (i)
Licenses and permits 41,471 37,645 IPSAS 1.104, IPSAS1.106, IPSAS 23.105(a) (i)
Transfers from other governments – gifts and services-in-kind 6 3,757,835 2,636,469 IPSAS 1.104, IPSAS1.106, IPSAS
23.105(a) (ii)
10,351,278 8,955,633
Revenue from exchange transactions
Rendering of services 7 2,243,622 2,037,164 IPSAS 9.39 (b) (i)
Sale of water and electricity 8 9,869,262 8,456,389 IPSAS 9.39 (b) (ii)
Rental revenue from facilities and equipment 9 289,736 250,316 IPSAS 9.39 (b) (i) (ii)
Finance income - external investments 10 339,970 293,300 IPSAS 9.39 (b) (iii)
Finance income - outstanding receivables 11 228,425 230,391 IPSAS 9.39 (b) (iii)
Agency fees 123,651 115,991 IPSAS 1.106
Other income 12 331,513 253,906 IPSAS 1.104
13,426,179 11,637,457 IPSAS 1 108
Total revenue 23,777,457 20,593,090 IPSAS 1.104 Expenses
Bulk purchases of water and electricity 13 5,705,263 4,620,165 IPSAS 1.109 - 112, IPSAS 1.106
Employee costs 14 6,955,786 6,184,573
Remuneration of councilors 15 97,916 88,858
Depreciation and amortization expense 16 1,394,834 1,283,682
Repairs and maintenance 17 2,262,311 2,072,023
Contracted services 18 7,769 9,941
Grants and subsidies 19 103,502 93,393
General expenses 20 3,075,160 2,738,305
Finance costs 21 683,166 719,170 IPSAS 1 102 (b)
Collection cost 166,380 174,755 IPSAS 1.109 - 112, IPSAS 1.106
Total expenses 20,452,087 17,984,865 IPSAS 1. 104
Other gains/(losses) IPSAS 1. 104
Gain on sale of assets 22 42,397 16,909 IPSAS 1.107(c)
Gain on foreign exchange transactions 44 32 IPSAS 1.104
Unrealized gain on fair value of investments 23 1,543 6,866 IPSAS 1.104
Impairment loss 24 (847,513) (799,494) IPSAS 1.107(a)
Surplus before tax 2,521,841 1,832,538 IPSAS 1.102 (d)
Taxation 25 (4,104) (6,455) IPSAS 1.06
Surplus for the period 2,517,737 1,826,083 IPSAS 1.102 (d)
Attributable to:
Surplus/(deficit) attributable to minority interest 3,326 (1,160) IPSAS 1.103 (a), IPSAS 6.54 Surplus attributable to owners of the controlling entity 2,514,411 1,827,243 IPSAS 1.103 (b)
2,517,737 1,826,083

7 Model Public Sector Group
Commentary IPSAS 1.21 suggests titles for the primary financial statements, such as ‘statement of financial performance’ or ‘statement of financial position’. However, IPSAS 1.22 clarifies that entities are permitted to use other titles, e.g., ‘income statement’ or ‘balance sheet’. Also, neither IPSAS 6 nor IPSAS 1 requires the separate financial statements of the controlling entity to accompany the consolidated financial statements. Accordingly, for the presentation of the Group’s consolidated financial statements, the separate financial statements are not presented. Preparers of financial statements should however be mindful of jurisdiction-specific requirements that may require the separate financial statements of the controlling entity to accompany the consolidated financial statements.
IPSAS 1.102(a) requires disclosure of revenue on the face of the statement of financial performance. The Group has elected to present the various types of revenues on the face of the statement of financial performance considering the nature and materiality of the revenue items (per IPSAS 1.105). The Group has also elected to disclose total revenue as a line item on the face of the statement of financial performance. This information could also be provided in the notes (see IPSAS 1.108).
IPSAS 1.88(g) and IPSAS 1.88(h) require differentiation between receivables from exchange transactions and receivables from non-exchange transactions. IPSAS 23.106(a) also requires revenue from non-exchange transactions to be disclosed separately, either on the face of the statement of financial performance or in the notes to the financial statements. When considering the analysis that the users of the financial statements may perform on the financial statements, providing a similar split of revenue from exchange transactions and revenue from non-exchange transactions on the face of the statement of financial performance (rather than in the notes) may enhance the understandability of the financial statements. Providing a split between revenue from exchange transactions and revenue from non-exchange transactions, enables users of the financial statements to reconcile the revenue and receivable line items presented.
IPSAS 1.109 requires expenses to be presented based on either their function or nature. The Group elected to present the expenses by nature.
The remuneration of councilors relates to their services as the members of the governing body of the municipality. IPSAS 20.22 and 20.34 requires disclosure of the remuneration of members of key management. Accordingly, inclusion of this line item aids in the fulfilment of the requirement of IPSAS 20.
IPSAS does not have a standard on accounting for income tax. Moreover, IPSAS 1 does not require the presentation of an income tax line item. Typically, many entities within the public sector are exempt from income tax. However, in this instance, the Group is not exempt from income tax. As such, the guidance in IAS 12 Income Taxes is applied in preparing the financial statements of the Group. The use of IAS 12 for the formulation of the Group’s accounting policy is required by IPSAS 19.14, which is stated in relation to the hierarchy for the selection of accounting policies provided in IPSAS 3. This guidance stipulates that in the absence of an IPSAS that specifically applies to a transaction, other event or condition other financial reporting frameworks, such as IFRS, may be applied in selecting the accounting policy for that specific transaction, event or circumstance.

Model Public Sector Group 8
Consolidated statement of financial position
As at 31 December 2013 2013 2012 IPSAS 1.53, IPSAS 1.63 (c)
Notes €000 €000 IPSAS 1.53, IPSAS1.63 (d) (e)
Assets
Current assetsCash and cash equivalents 26 3,481,533 3,304,129 IPSAS 1.88 (i)
Receivables from exchange transactions 27 2,912,503 2,551,029 IPSAS 1.88 (h)
Receivables from non-exchange transactions 28 1,378,826 1,359,401 IPSAS 1.88 (g)
Current portion of long-term receivables from exchange transactions 27 19,758 19,193 IPSAS 1.88 (g)
Inventories 29 254,385 236,634 IPSAS 1.88 (f)
Investments 30 2,883,350 2,146,596 IPSAS 1.88 (b)
10,930,355 9,616,982 IPSAS 1.70, IPSAS 1.76
Non-current assetsProperty, plant and equipment 31 24,412,408 21,783,237 IPSAS 1.88 (a)
Investments 30 111,492 - IPSAS 1.88 (e), IPSAS 7.44
Intangible assets 32 100,432 44,884 IPSAS 1.88 (c)
Investment property 33 192,478 84,999 IPSAS 1.88 (b)
Long term receivables from exchange transactions 27 99,328 115,526 IPSAS 1.88 (g)
24,916,138 22,028,646 IPSAS 1.70, IPSAS 1.76
Total assets 35,846,493 31,645,628 IPSAS 1.89
Liabilities
Current liabilitiesTrade and other payables from exchange transactions 34 3,799,494 3,356,178 IPSAS 1.88 (k)
Refundable deposits from customers 35 291,441 244,695 IPSAS 1.89
Provisions 36 741,883 648,896 IPSAS 1.88 (l)
Finance lease obligation 41 - 2,134Current portion of borrowings 42 286,962 126,354Deferred income 37 1,665,752 1,108,680 IPSAS 1.89
Employee benefit obligation 40 296,142 306,896 IPSAS 1.88 (m)
Payments received in advance 57,756 57,368 IPSAS 1.89
Taxation 1,381 528 IPSAS 1.88 (m)
7,140,811 5,851,729 IPSAS 1.70
Non-current liabilitiesNon-current employee benefit obligation 40 5,192,992 5,361,398 IPSAS 1.88 (m)
Non-current provisions 39 2,583,436 2,157,556 IPSAS 1.88 (l)
Borrowings 42 1,142,865 1,354,781Service concession liability 46 349,900 -Deferred tax liabilities 25 6,941 8,353
9,276,134 8,882,088 IPSAS 1.70
Total liabilities 16,416,945 14,733,817 IPSAS 1.89
Net assets 19,429,548 16,911,811 IPSAS 1.88 (o)
Reserves 2,291,718 2,310,604IPSAS 1.88 (o), IPSAS 1.94 (f), IPSAS 1.95 (a)
Accumulated surplus 17,002,060 14,468,763IPSAS 1.88 (o), IPSAS 1.94 (f), IPSAS 1.95 (a)
Minority interest 135,770 132,444 IPSAS 6.54
Total net assets and liabilities 35,846,493 31,645,628 IPSAS 1.89

9 Model Public Sector Group
Commentary Neither IPSAS 6 nor IPSAS 1 require the separate financial statements of the controlling entity to accompany the consolidated financial statements. Accordingly, for the presentation of the Group’s consolidated financial statements, the separate financial statements are not presented. Preparers of financial statements should, however, be mindful of jurisdiction-specific requirements that may require the separate financial statements of the controlling entity to accompany the consolidated financial statements.
In accordance with IPSAS 1.70, the Group has classified its statement of financial position into current and non-current assets, and current and non-current liabilities. IPSAS 1 permits three presentation options for assets and liabilities as follows: (1) using a current versus non-current distinction; (2) by arranging assets and liabilities in order of their liquidity; or (3) using a mixture of current versus non-current and liquidity. However, whichever presentation option is chosen, an entity is still required to separately disclose the amounts that are expected to be settled or recovered within 12 months and those expected to be settled or recovered in more than 12 months. This separate disclosure is required where line items in the statement of financial position combine amounts to be settled or recovered within 12 months with amounts to be settled or recovered in more than 12 months. The Group has presented its statement of financial position using the current versus non-current distinction (IPSAS 1.71), but further supplemented by presenting the current and non-current classification items in order of liquidity starting with the most liquid asset.

Model Public Sector Group 10
Consolidated statement of changes in net assets
For the year ended 31 December 2013 Attributable to the owners of the controlling entity
Reserves
Self insurance
reserve
Capital replacement
reserve
Housing development
reserve Accumulated
surplus Minority interest Total
€000 €000 €000 €000 €000 €000 IPSAS 1.53, 63 (d) (e)
Balance as at 31 December 2011 658,175 615,876 508,617 13,169,456 133,604 15,085,728
Surplus/(deficit) for the period - - - 1,827,243 (1,160) 1,826,083
IPSAS 1.118 (a) (c),
Transfers to/from accumulated surplus (73,012) 570,495 30,453 (527,936) - -
Balance as at 31 December 2012 585,163 1,186,371 539,070 14,468,763 132,444 16,911,811
Surplus for the period - - - 2,514,411 3,326 2,517,737 IPSAS 1.118(a)(c)
Transfers to/from accumulated surplus (88,981) 87,702 (17,607) 18,886 - -
Balance as at 31 December 2013 496,182 1,274,073 521,463 17,002,060 135,770 19,429,548
Commentary The acquisition of an additional ownership interest in a subsidiary without a change of control is accounted for as transaction in net assets in accordance with additional guidance in IAS 27 Separate Financial Statements and IFRS 10 Consolidated Financial Statements. This guidance is not contained in IPSAS 6, but the Group has elected to apply the additional guidance in IAS 27 and IFRS 10 to these transactions, in accordance with the guidance in IPSAS 3 on the criteria selecting accounting policies. Any surplus or deficit of consideration paid over the adjustment to the carrying amount of minority interest is recognized in net assets of the controlling entity in transactions where a portion of the minority interest is acquired or sold without loss of control. The Group has elected to recognize this effect in accumulated surplus. With respect to the subsidiary to which this minority interest relates, there were no accumulated components relating to that subsidiary (such as an asset revaluation reserve) recognized in net assets. If there had been such components, they would have been re-allocated within net assets of the controlling entity.

11 Model Public Sector Group
Consolidated statement of cash flows Notes 2013 2012 IPSAS 1.53, IPSAS 1.63 (c) €000 €000 IPSAS 1.53, IPSAS1.63 (d) (e) Cash flows from operating activities IPSAS 2.18, IPSAS 2.27 Receipts Property taxes 5,387,898 4,589,492 IPSAS 2. 27 (a)
Public contributions and donations 63,661 79,720 IPSAS 2. 27(a), IPSAS 2.22 (c)
Fines, penalties and levies 1,781,670 1,677,436 IPSAS 2. 27(a), IPSAS 2.22 (a)
Licenses and permits 41,471 37,645 IPSAS 2. 27(a), IPSAS 2.22 (b)
Government grants and subsidies 4,314,907 2,635,544 IPSAS 2. 27(a), IPSAS 2.22 (d)
Rendering of services 1,442,398 1,745,995 IPSAS 2. 27(a), IPSAS 2.22 (d)
Sale of goods 9,257,191 8,201,772 IPSAS 2. 27(a), IPSAS 2.22 (c)
Finance income 454,183 408,496 IPSAS 2. 27 (a)
Other income, rentals and agency fees 315,281 290,668 IPSAS 2. 27 (a), IPSAS 2.22 (a)
23,058,660 19,666,768 IPSAS 2. 27 (a) Payments
Compensation of employees 10,914,327 9,301,878 IPSAS 2. 27 (a), IPSAS 2.22 (g)
Goods and services 5,934,897 5,686,507 IPSAS 2. 27 (a), IPSAS 2.22 (f)
Finance cost 663,394 710,888 IPSAS 2. 27 (a),
Rent paid 23,789 21,164 IPSAS 2. 27 (a), IPSAS 2.22 (f)
Taxation paid 4,663 9,981 IPSAS 2. 27 (a), IPSAS 2.22 (i)
Other payments 156,293 139,449 IPSAS 2. 27 (a)
Grants and subsidies paid 103,502 93,393 IPSAS 2. 27 (a), IPSAS 2.22 (i)
17,800,865 15,963,260 Net cash flows from operating activities 45 5,257,795 3,703,508 Cash flows from investing activities IPSAS 2.18, IPSAS 2.31 Purchase of property, plant, equipment and intangible assets (4,253,098) (2,895,348) IPSAS 2.25 (a) Proceeds from sale of property, plant and equipment 46,066 63,544 IPSAS 2.25 (b) Decrease in non-current receivables 15,633 1,819 Increase in investments (736,806) (1,962,720) IPSAS 2.25 (c) Net cash flows used in investing activities (4,928,205) (4,792,705)
Cash flows from financing activities IPSAS 2.18, IPSAS 2.31 Proceeds from borrowings 431 335 IPSAS 2.26 (a)
Repayment of borrowings (199,363) (262,568) IPSAS 2.26 (b), IPSAS 2.26 (c)
Increase in deposits 46,746 2,102 Net cash flows used in financing activities (152,186) (260,131) Net increase/(decrease) in cash and cash equivalents 177,404 (1,349,328) Cash and cash equivalents at 1 January 26 3,304,129 4,653,456 Cash and cash equivalents at 31 December 26 3,481,533 3,304,128 IPSAS 2.56
Commentary IPSAS 2.27 allows entities to report cash flows from operating activities using either the direct method or the indirect method. The Group presents its cash flows using the direct method.
IPSAS 2.42 permits interest paid to be shown as operating or financing activities and interest received to be shown as operating or investing activities, as deemed relevant for the entity. The Group has elected to classify interest received as cash flows from operating activities.

Model Public Sector Group 12
Consolidated statement of comparison of budget and actual amounts for the year ended 31 December 2013
Original budget Adjustments Final budget Actual on
comparable basis Performance
difference
IPSAS 24.14(a)(b)
2013 2013 2013 2013 2013 IPSAS 1.53, 63 (c)
Revenue €000 €000 €000 €000 €000 IPSAS 1.53, 63 (d) (e)
Property taxes 5,939,778 - 5,939,778 5,387,898 (551,880) IPSAS 24.47 (a)
Public contributions and donations 90,000 (22,000) 68,000 63,661 (4,339)
Fines, penalties and levies 1,824,300 (14,050) 1,810,250 1,781,670 (28,580)
Licenses and permits 30,200 - 30,200 41,471 11,271
Government grants and subsidies 4,314,900 - 4,314,900 4,314,907 7
Rendering of services 3,528,600 (1,246,800) 2,281,800 1,442,398 (839,402)
Sale of goods 10,223,909 - 10,223,909 9,257,191 (966,718)
Finance Income 416,800 - 416,800 454,183 37,383
Gains on disposal, rental income and agency fees 763,045 3,564 766,609 315,281 (451,328)
Total income 27,131,532 (1,279,286) 25,852,246 23,058,660 (2,793,586) Expenses
Compensation of employees 12,313,900 - 12,313,900 10,914,327 (1,399,573)
Goods and services 8,184,668 (1,856,271) 6,328,397 5,934,897 (393,500)
Finance cost 800,000 (33,503) 766,497 663,394 (103,103)
Rent paid 34,000 (10,211) 23,789 23,789 -
Taxation paid 2,100 2,500 4,600 4,663 63
Other payments 3,541,991 - 3,541,991 156,293 (3,385,698)
Grants and subsidies paid 103,502 - 103,502 103,502 -
Total expenditure 24,980,161 (1,897,485) 23,082,676 17,800,865 (5,281,811) Surplus for the period 2,151,371 618,199 2,769,570 5,257,795 2,488,225
Commentary IPSAS 24 requires a comparison of budget amounts and actual amounts arising from the execution of the budget to be included in the financial statements of entities that are required to, or elect to, make publicly available their approved budget(s), and for which they are, therefore, held publicly accountable. The Group prepares its budget on an accrual basis. As such, the budget and the financial statements are already on the same basis and further adjustments are not required to align the financial statements to the budget. The Group has the option to present this comparison either as a separate additional financial statement or as additional budget columns in the financial statements (IPSAS 24.14). The Group has chosen to present the comparison separately. For entities that do not prepare budget(s) and financial statements on a comparable basis, a separate statement of comparison of budget and actual amounts must be presented. Further, to ensure that readers do not misinterpret financial information that is prepared on different bases, the financial statements should clarify that the budget and accounting bases differ, and that the statement of comparison of budget and actual amounts is prepared on the budget basis (IPSAS 24.39).
When comparing the actual total revenue and expenditure amounts, as presented above, to the statement of financial performance, it will be noted that the total lines do not agree exactly to the total lines in the statement of financial performance. The reason for these differences is that the gains and losses that were presented under “Other gains and losses” in the statement of financial performance were grouped with revenue and expenditure for the purpose of reporting the comparison between the budget and actual. For the purpose of preparing its budget, the Group includes estimated gains and losses with revenue and expenditure. As such, the budget statement, as presented above, also reflects the classification adopted for budgeting purposes.

Index to notes to the consolidated financial statements
13 Model Public Sector Group
1. General information ......................................................................................................................... 13 2.1 Statement of compliance and basis of preparation ....................................................................... 14 2.2 Summary of significant accounting policies ................................................................................. 14
3. Property taxes revenue .................................................................................................................... 30 4. Public contributions and donations ................................................................................................... 30 5. Fines, penalties and levies ................................................................................................................ 31 6. Transfers from other governments – gifts and services-in-kind ............................................................ 31 7. Rendering of services ...................................................................................................................... 32 8. Sale of water and electricity ............................................................................................................. 33 9. Rental revenue from facilities and equipment .................................................................................... 33 10. Finance income - external investments ............................................................................................ 33 11. Finance income - outstanding receivables ........................................................................................ 33 12. Other income ................................................................................................................................ 34 13. Bulk purchases of water and electricity ........................................................................................... 34 14. Employee costs ............................................................................................................................. 34 15. Remuneration of councilors ............................................................................................................ 34 16. Depreciation and amortization expense ........................................................................................... 35 17. Repairs and maintenance ............................................................................................................... 35 18. Contracted services ....................................................................................................................... 35 19. Grants and subsidies ...................................................................................................................... 36 20. General expenses .......................................................................................................................... 36 21. Finance costs ................................................................................................................................ 36 22. Gain on sale of assets .................................................................................................................... 37 23. Unrealized gain on fair value of investments .................................................................................... 37 24. Impairment loss............................................................................................................................. 37 25. Taxation ....................................................................................................................................... 38 26. Cash and cash equivalents.............................................................................................................. 39 27. Receivables from exchange transactions ......................................................................................... 39 28. Receivables from non-exchange contracts ....................................................................................... 40 29. Inventories ................................................................................................................................... 41 30. Investments .................................................................................................................................. 41 31. Property, plant and equipment ....................................................................................................... 43 32. Intangible assets - software ............................................................................................................ 44 33. Investment property ...................................................................................................................... 44 34. Trade and other payables from exchange transactions ..................................................................... 45 35. Refundable deposits from customers .............................................................................................. 45 36. Current provisions ......................................................................................................................... 45 37. Deferred income ........................................................................................................................... 46
financial risk management ........................................................................... 46 39. Non-current provisions .................................................................................................................. 51 40. Pensions and other post-employment benefit plans .......................................................................... 52 41. Finance lease obligation ................................................................................................................. 55 42. Borrowings ................................................................................................................................... 55 43. Related party disclosures ............................................................................................................... 56 44. Commitments and contingencies ..................................................................................................... 60 45. Cash generated from operations ..................................................................................................... 59 46. Service concession arrangement ..................................................................................................... 60 47. Segment information .................................................................................................................... 60 48. Events after the reporting period ................................................................................................... 60

Notes to the consolidated financial statements
Model Public Sector Group 14
1. General information
The consolidated financial statements of the Group for the year ended 31 December 2013 were authorized for issue in accordance with the resolution of the Governing Body on 30 March 2014. The Group's principal activities are the provision of infrastructure, health services, waste management, emergency services and sale of electricity and water to the residents of the municipality. The Group's registered office is located in Euroland.
IPSAS 14.26, IPSAS 1.63 (b) (c) IPSAS 1.150 (a-d)
2.1 Statement of compliance and basis of preparation
The consolidated financial statements of the Group have been prepared in accordance with and comply with International Public Sector Accounting Standards (IPSAS). The consolidated financial statements are presented in euros, which is the functional and reporting currency of the Group and all values are rounded to the nearest thousand (€000). The accounting policies have been consistently applied to all the years presented.
IPSAS 1.127 (a) IPSAS 1.28 IPSAS 63 (d) (e)
The consolidated financial statements have been prepared on the basis of historical cost, unless stated otherwise. The cash flows statement is prepared using the direct method. The consolidated financial statements are prepared on an accrual basis.
IPSAS 1.132 (a)
2.2 Summary of significant accounting policies
a) Consolidation
Controlled entities IPSAS 6.15
The controlled entities are all those entities (including special purpose entities) over which the controlling entity has the power to govern the financial and operating policies. The controlled entities are fully consolidated from the date on which control is transferred to the controlling entity. They are de-consolidated from the date that control ceases. Inter-group transactions, balances and unrealized gains and losses on transactions between members of the group are eliminated in full. The accounting policies of the controlled entities are consistent with the policies adopted by the controlling entity.
IPSAS 6.20 IPSAS 6.47 IPSAS 6.45 IPSAS 6.49
b) Interest in joint venture
The Group has an interest in a joint venture which is a jointly controlled entity, whereby the venturers have a binding arrangement that establishes joint control over the economic activities of the entity. The Group recognizes its interest in the joint venture using the proportionate consolidation method. The Group combines its proportionate share of each of the assets, liabilities, income and expenses of the joint venture with similar items, line by line, in its consolidated financial statements. The financial statements of the joint venture are prepared for the same reporting period as the Group. Adjustments are made where necessary to bring the accounting policies in line with those of the Group.
IPSAS 8.6 IPSAS 8.7 IPSAS 8.35 IPSAS 8.38 IPSAS 6.49
The joint venture is proportionately consolidated until the date on which the Group ceases to have joint control over the joint venture. Upon loss of joint control, and provided that the former jointly controlled entity does not become a subsidiary or an associate, the Group discontinues proportionate consolidation and recognizes its remaining investment at the carrying amount. If the interest of the remaining investment constitutes significant influence, it is accounted for as an associate.
IPSAS 8.54 IPSAS 8.41 IPSAS 8.41-42 IPSAS 8.51
c) Investment in associate
The Group's investment in its associate is accounted for using the equity method. An associate is an entity in which the Group has significant influence.
IPSAS 7.11
Under the equity method, the investment in the associate is carried in the statement of financial position at cost plus post acquisition changes in the Group’s share of surplus or deficit of the associate. Goodwill relating to the associate is included in the carrying amount of the investment.
IPSAS 7.17 IPSAS 7.29
The statement of financial performance reflects the share of the results of operations of the associate. Where there has been a change recognized directly in the net assets of the associate, the Group recognizes its share of any changes and discloses this, when applicable, in the statement of changes in net assets. Unrealized gains and losses resulting from transactions between the Group and the associate are eliminated to the extent of the interest in the associate.
IPSAS 7.28 IPSAS 7.45
The share of surplus or deficit of associates is shown on the face of the statement of financial performance. This is the surplus attributable to equity holders of the associate and therefore is surplus after tax and minority interests in the controlled entities of the associates.

Notes to the consolidated financial statements
15 Model Public Sector Group
2.2 Summary of significant accounting policies continued
The financial statements of the associate are prepared for the same reporting period as the controlling entity. Where necessary, adjustments are made to bring the accounting policies in line with those of the Group. IPSAS 7.43 (e)
After application of the equity method, the Group determines whether it is necessary to recognize an additional impairment loss on the Group's investment in its associates. The Group determines at each reporting date whether there is any objective evidence that the investment in the associate is impaired.
IPSAS 7.37 IPSAS 7.38
If this is the case, the Group calculates the amount of impairment as the difference between the recoverable amount of the associate and its carrying value and recognizes the amount in the income statement.
Upon loss of significant influence over the associate, the Group measures and recognizes any retaining investment at its carrying amount.
IPSAS 7.24
d) Revenue recognition
Revenue from non-exchange transactions
Fees, taxes and fines IPSAS 23.107 (b)
The Group recognizes revenues from fees, taxes and fines when the event occurs and the asset recognition criteria are met. To the extent that there is a related condition attached that would give rise to a liability to repay the amount, deferred income is recognized instead of revenue. Other non-exchange revenues are recognized when it is probable that the future economic benefits or service potential associated with the asset will flow to the entity and the fair value of the asset can be measured reliably.
IPSAS 23.107 (a)
Transfers from other government entities IPSAS 23.107 (a)
Revenues from non-exchange transactions with other government entities are measured at fair value and recognized on obtaining control of the asset (cash, goods, services and property) if the transfer is free from conditions and it is probable that the economic benefits or service potential related to the asset will flow to the Group and can be measured reliably.
Revenue from exchange transactions Rendering of services The Group recognizes revenue from rendering of services by reference to the stage of completion when the outcome of the transaction can be estimated reliably. The stage of completion is measured by reference to labor hours incurred to date as a percentage of total estimated labor hours. IPSAS 9.19z
IPSAS 9.39(a)
Where the contract outcome cannot be measured reliably, revenue is recognized only to the extent that the expenses incurred are recoverable. IPSAS 9.25
Sale of goods Revenue from the sale of goods is recognized when the significant risks and rewards of ownership have been transferred to the buyer, usually on delivery of the goods and when the amount of revenue can be measured reliably and it is probable that the economic benefits or service potential associated with the transaction will flow to the Group.
IPSAS 9.28 IPSAS 9.39 (a)
Interest income Interest income is accrued using the effective yield method. The effective yield discounts estimated future cash receipts through the expected life of the financial asset to that asset’s net carrying amount. The method applies this yield to the principal outstanding to determine interest income each period. IPSAS 9.34 (a)
IPSAS 9.39 (a)
Dividends Dividends or similar distributions must be recognized when the shareholder’s or the Group’s right to receive payments is established.
IPSAS 9.34 (c)
Rental income Rental income arising from operating leases on investment properties is accounted for on a straight-line basis over the lease terms and included in revenue. IPSAS 13.63
IPSAS 16.86(f)
e) Taxes Current income tax Current income tax assets and liabilities for the current period are measured at the amount expected to be recovered from or paid to the taxation authorities. The tax rates and tax laws used to compute the amount are those that are enacted or substantively enacted, at the reporting date in the area where the Group operates and generates taxable income.
IAS 12.46

Notes to the consolidated financial statements
Model Public Sector Group 16
2.2 Summary of significant accounting policies continued
Current income tax relating to items recognized directly in net assets is recognized in net assets and not in the statement of financial performance. Management periodically evaluates positions taken in the tax returns with respect to situations in which applicable tax regulations are subject to interpretation and establishes provisions where appropriate.
IAS 12.61A(b)
Deferred tax Deferred tax is provided using the liability method on temporary differences between the tax bases of assets and liabilities and their carrying amounts for financial reporting purposes at the reporting date.
Deferred tax liabilities are recognized for all taxable temporary differences, except in respect of taxable temporary differences associated with investments in controlled entities, associates and interests in joint ventures, when the timing of the reversal of the temporary differences can be controlled and it is probable that the temporary differences will not reverse in the foreseeable future.
IAS 12.39
Deferred tax assets are recognized for all deductible temporary differences, the carry forward of unused tax credits and any unused tax losses. Deferred tax assets are recognized to the extent that it is probable that taxable profit will be available against which the deductible temporary differences, and the carry forward of unused tax credits and unused tax losses can be utilized, except in respect of deductible temporary differences associated with investments in controlled entities, associates and interests in joint ventures, deferred tax assets are recognized only to the extent that it is probable that the temporary differences will reverse in the foreseeable future and taxable profit will be available against which the temporary differences can be utilized.
IAS 12.34 IAS 12.24
IAS 12.44
The carrying amount of deferred tax assets is reviewed at each reporting date and reduced to the extent that it is no longer probable that sufficient taxable profit will be available to allow all or part of the deferred tax asset to be utilized. Unrecognized deferred tax assets are re-assessed at each reporting date and are recognized to the extent that it has become probable that future taxable profits will allow the deferred tax asset to be recovered.
Deferred tax assets and liabilities are measured at the tax rates that are expected to apply in the year when the asset is realized or the liability is settled, based on tax rates (and tax laws) that have been enacted or substantively enacted at the reporting date.
IAS 12.56 IAS 12.37
IAS 12.47
Deferred tax relating to items recognized outside surplus or deficit is recognized outside surplus or deficit. Deferred tax items are recognized in correlation to the underlying transaction in net assets.
Deferred tax assets and deferred tax liabilities are offset if a legally enforceable right exists to set off current tax assets against current income tax liabilities and the deferred taxes relate to the same taxable entity and the same taxation authority.
IAS 12.61A
IAS 12.71
Sales tax Expenses and assets are recognized net of the amount of sales tax, except:
When the sales tax incurred on a purchase of assets or services is not recoverable from the taxation authority, in which case, the sales tax is recognized as part of the cost of acquisition of the asset or as part of the expense item, as applicable
When receivables and payables are stated with the amount of sales tax included
The net amount of sales tax recoverable from, or payable to, the taxation authority is included as part of receivables or payables in the statement of financial position.

Notes to the consolidated financial statements
17 Model Public Sector Group
2.2 Summary of significant accounting policies continued
f) Investment property Investment properties are measured initially at cost, including transaction costs. The carrying amount includes the replacement cost of components of an existing investment property at the time that cost is incurred if the recognition criteria are met and excludes the costs of day-to-day maintenance of an investment property. IPSAS 16.26
IPSAS 16.86(a)
Investment property acquired through a non-exchange transaction is measured at its fair value at the date of acquisition. Subsequent to initial recognition, investment properties are measured using the cost model and are depreciated over a 30-year period.
IPSAS 16.27 IPSAS 16.39 IPSAS 16.42
Investment properties are derecognized either when they have been disposed of or when the investment property is permanently withdrawn from use and no future economic benefit or service potential is expected from its disposal. The difference between the net disposal proceeds and the carrying amount of the asset is recognized in the surplus or deficit in the period of derecognition.
IPSAS 16.77 IPSAS 16.80 IPSAS 16.66 IPSAS 16.71 IPSAS 16.74
Transfers are made to or from investment property only when there is a change in use.
Commentary Under IPSAS 16, an entity has a policy choice for the measurement of investment property after initial recognition. An entity may choose either the cost model or the fair value model for all of its investment properties. The Group has elected to use the cost model for all investment property.
IPSAS 16.39
g) Property, plant and equipment
All property, plant and equipment are stated at cost less accumulated depreciation and impairment losses. Cost includes expenditure that is directly attributable to the acquisition of the items. When significant parts of property, plant and equipment are required to be replaced at intervals, the Group recognizes such parts as individual assets with specific useful lives and depreciates them accordingly. Likewise, when a major inspection is performed, its cost is recognized in the carrying amount of the plant and equipment as a replacement if the recognition criteria are satisfied. All other repair and maintenance costs are recognized in surplus or deficit as incurred. Where an asset is acquired in a non-exchange transaction for nil or nominal consideration the asset is initially measured at its fair value.
IPSAS 17.88 (a) IPSAS 17.43 IPSAS 17.30 IPSAS 17.24 IPSAS 17.25 IPSAS 17.23 IPSAS 17.27 IPSAS 17.88 (b) IPSAS 17.59
Commentary Under IPSAS 17 an entity has a policy choice for the measurement of property, plant and equipment after initial recognition. An entity may choose either the cost model or the revaluation model for entire classes of property, plant and equipment. The Group has elected to use the cost model for all classes of property, plant and equipment.
Depreciation on assets is charged on a straight-line basis over the useful life of the asset. Depreciation is charged at rates calculated to allocate the cost or valuation of the asset less any estimated residual value over its remaining useful life:
Buildings 30 – 40 years
Infrastructure 30 – 40 years
Community assets 20 – 30 years
Leased assets 5 – 10 years
Housing rental 60 – 80 years
Other assets 10 – 15 years
Leased assets consist of vehicles and machinery and ‘Other assets’ include furniture & fittings and office equipment.
The assets’ residual values and useful lives are reviewed, and adjusted prospectively, if appropriate, at the end of each reporting period.
An asset’s carrying amount is written down immediately to its recoverable amount, or recoverable service amount, if the asset’s carrying amount is greater than its estimated recoverable amount or recoverable service amount.
The Group derecognizes items of property, plant and equipment and/or any significant part of an asset upon disposal or when no future economic benefits or service potential is expected from its continuing use. Any gain or loss arising on derecognition of the asset (calculated as the difference between the net disposal proceeds and the carrying amount of the asset) is included in the surplus or deficit when the asset is derecognized.
IPSAS 17.67 IPSAS 17.79 IPSAS 26.72 IPSAS 17.82 IPSAS 17.83 IPSAS 17.86

Notes to the consolidated financial statements
Model Public Sector Group 18
2.2 Summary of significant accounting policies continued
Commentary IPSAS 17.27 requires property, plant and equipment that are acquired through non-exchange contracts be measured at the fair value thereof at the date of acquisition. In this case, the corresponding credit is recognized as income in the statement of financial performance, unless there are conditions on the asset’s use. In which case, income is deferred as a liability. The fair value of the item (at initial recognition) is therefore adopted as the deemed cost of the item received. Similar requirements exist for other assets acquired through non-exchange transactions such as investment property (IPSAS 16.27) and intangible assets (IPSAS 31.43).
h) Leases
Group as a lessee Finance leases are leases that transfer substantially all of the risks and benefits incidental to ownership of the leased item to the Group. Assets held under a finance lease are capitalized at the commencement of the lease at the fair value of the leased property or, if lower, at the present value of the future minimum lease payments. The Group also recognizes the associated lease liability at the inception of the lease. The liability recognized is measured as the present value of the future minimum lease payments at initial recognition.
Subsequent to initial recognition, lease payments are apportioned between finance charges and reduction of the lease liability so as to achieve a constant rate of interest on the remaining balance of the liability. Finance charges are recognized as finance costs in surplus or deficit.
An asset held under a finance lease is depreciated over the useful life of the asset. However, if there is no reasonable certainty that the Group will obtain ownership of the asset by the end of the lease term, the asset is depreciated over the shorter of the estimated useful life of the asset and the lease term.
Operating leases are leases that do not transfer substantially all the risks and benefits incidental to ownership of the leased item to the Group. Operating lease payments are recognized as an operating expense in surplus or deficit on a straight-line basis over the lease term.
IPSAS 13.13 IPSAS 13.28 IPSAS 13.34 IPSAS 13.36 IPSAS 13.37 IPSAS 13.42
Group as a lessor Leases in which the Group does not transfer substantially all the risks and benefits of ownership of an asset are classified as operating leases. Initial direct costs incurred in negotiating an operating lease are added to the carrying amount of the leased asset and recognized over the lease term.
Rent received from an operating lease is recognized as income on a straight-line basis over the lease term. Contingent rents are recognized as revenue in the period in which they are earned.
IPSAS 13.13 IPSAS 13.65
i) Intangible assets
Intangible assets acquired separately are initially recognized at cost. The cost of intangible assets acquired in a non-exchange transaction is their fair value at the date of the exchange. Following initial recognition, intangible assets are carried at cost less any accumulated amortization and accumulated impairment losses. Internally generated intangible assets, excluding capitalized development costs, are not capitalized and expenditure is reflected in surplus or deficit in the period in which the expenditure is incurred.
The useful life of the intangible assets is assessed as either finite or indefinite.
Intangible assets with a finite life is amortized over its useful life:
Software 10 – 20 years
Intangible assets with a finite useful life are assessed for impairment whenever there is an indication that the asset may be impaired.
The amortization period and the amortization method, for an intangible asset with a finite useful life, are reviewed at the end of each reporting period. Changes in the expected useful life or the expected pattern of consumption of future economic benefits embodied in the asset are considered to modify the amortization period or method, as appropriate, and are treated as changes in accounting estimates. The amortization expense on an intangible asset with a finite life is recognized in surplus or deficit as the expense category that is consistent with the nature of the intangible asset.
Gains or losses arising from derecognition of an intangible asset are measured as the difference between the net disposal proceeds and the carrying amount of the asset and are recognized in the surplus or deficit when the asset is derecognized.
IPSAS 31.31 IPSAS 31.43 IPSAS 31.73 IPSAS 31.55 IPSAS 31.87 IPSAS 31.96 IPSAS 26.22 IPSAS 31.103 IPSAS 31.117 IPSAS 31.106 IPSAS 31.107 IPSAS 31.108 IPSAS 31.112
Notes to the consolidated financial statements
19 Model Public Sector Group
2.2 Summary of significant accounting policies continued
Research and development costs The Group expenses research costs as incurred. Development costs on an individual project are recognized as intangible assets when the Group can demonstrate:
The technical feasibility of completing the asset so that the asset will be available for use or sale Its intention to complete and its ability to use or sell the asset How the asset will generate future economic benefits or service potential The availability of resources to complete the asset The ability to measure reliably the expenditure during development
Following initial recognition of an asset, the asset is carried at cost less any accumulated amortization and accumulated impairment losses. Amortization of the asset begins when development is complete and the asset is available for use. It is amortized over the period of expected future benefit. During the period of development, the asset is tested for impairment annually with any impairment losses recognized immediately in surplus or deficit.
IPSAS 31.52 IPSAS 31.55 IPSAS 31.73 IPSAS 26.23 IPSAS 26.73 IPSAS 31.121
Commentary Only application software is classified as an intangible asset. Operating software is therefore not included in intangible assets, but rather in property, plant and equipment as it cannot be separated from the hardware. Also, software licenses (where they relate to more than one financial period) are capitalized as part of intangible assets and grouped in the software category.
j) Impairment of non-financial assets
Impairment of cash-generating assets
At each reporting date, the Group assesses whether there is an indication that an asset may be impaired. If any indication exists, or when annual impairment testing for an asset is required, the Group estimates the asset’s recoverable amount. An asset’s recoverable amount is the higher of an asset’s or cash-generating unit’s fair value less costs to sell and its value in use and is determined for an individual asset, unless the asset does not generate cash inflows that are largely independent of those from other assets or groups of assets.
IPSAS 26.22 IPSAS 26.13 IPSAS 26.78
Where the carrying amount of an asset or the cash-generating unit (CGU) exceeds its recoverable amount, the asset is considered impaired and is written down to its recoverable amount.
IPSAS 26.72
In assessing value in use, the estimated future cash flows are discounted to their present value using a pre-tax discount rate that reflects current market assessments of the time value of money and the risks specific to the asset. In determining fair value less costs to sell, recent market transactions are taken into account, if available. If no such transactions can be identified, an appropriate valuation model is used.
IPSAS 26.43 IPSAS 26.68
Impairment losses of continuing operations, including impairment on inventories, are recognized in the statement of financial performance in those expense categories consistent with the nature of the impaired asset. IPSAS 26.99
IPSAS 26.103
Goodwill is tested for impairment on an annual basis. For assets excluding goodwill, an assessment is made at each reporting date as to whether there is any indication that previously recognized impairment losses may no longer exist or may have decreased. If such indication exists, the Group estimates the asset’s or cash-generating unit’s recoverable amount. A previously recognized impairment loss is reversed only if there has been a change in the assumptions used to determine the asset’s recoverable amount since the last impairment loss was recognized. The reversal is limited so that the carrying amount of the asset does not exceed its recoverable amount, nor exceed the carrying amount that would have been determined, net of depreciation, had no impairment loss been recognized for the asset in prior years. Such reversal is recognized in surplus or deficit.
IPSAS 26.103 IPSAS 26.106 IPSAS 26.108
Impairment of non-cash-generating assets The Group assesses at each reporting date whether there is an indication that a non-cash-generating asset may be impaired. If any indication exists, or when annual impairment testing for an asset is required, the Group estimates the asset’s recoverable service amount. An asset’s recoverable service amount is the higher of the non-cash-generating asset’s fair value less costs to sell and its value in use.
IPSAS 21.26 IPSAS 21.14
Where the carrying amount of an asset exceeds its recoverable service amount, the asset is considered impaired and is written down to its recoverable service amount.
IPSAS 21.52

Notes to the consolidated financial statements
Model Public Sector Group 20
2.2 Summary of significant accounting policies continued
In assessing value in use, the Group has adopted the depreciation replacement cost approach. Under this approach, the present value of the remaining service potential of an asset is determined as the depreciated replacement cost of the asset. The depreciated replacement cost is measured as the reproduction or replacement cost of the asset, whichever is lower, less accumulated depreciation calculated on the basis of such cost, to reflect the already consumed or expired service potential of the asset.
In determining fair value less costs to sell, the price of the assets in a binding agreement in an arm's length transaction, adjusted for incremental costs that would be directly attributed to the disposal of the asset is used. If there is no binding agreement, but the asset is traded on an active market, fair value less cost to sell is the asset's market price less cost of disposal. If there is no binding sale agreement or active market for an asset, the Group determines fair value less cost to sell based on the best available information.
IPSAS 21.45 IPSAS 21.40-42
For each asset, an assessment is made at each reporting date as to whether there is any indication that previously recognized impairment losses may no longer exist or may have decreased. If such indication exists, the Group estimates the asset's recoverable service amount. A previously recognized impairment loss is reversed only if there has been a change in the assumptions used to determine the asset’s recoverable service amount since the last impairment loss was recognized. The reversal is limited so that the carrying amount of the asset does not exceed its recoverable service amount, nor exceed the carrying amount that would have been determined, net of depreciation, had no impairment loss been recognized for the asset in prior years. Such reversal is recognized in surplus or deficit.
IPSAS 21.59 IPSAS 21.65 IPSAS 26.68-69
Commentary The classification of assets as non-cash generating assets is a highly judgmental matter. It should be noted that IPSAS 21.16 clarifies that cash-generating assets are those assets that are held with the primary objective of generating a commercial return. Therefore, non-cash generating assets would be those assets from which the Group does not intend (as its primary objective) to realize a commercial return.
k) Financial instruments
Financial assets
Initial recognition and measurement
Financial assets within the scope of IPSAS 29 Financial Instruments: Recognition and Measurement are classified as financial assets at fair value through surplus or deficit, loans and receivables, held-to-maturity investments or available-for-sale financial assets, as appropriate. The Group determines the classification of its financial assets at initial recognition.
IPSAS 29.10 IPSAS 30. 31
Purchases or sales of financial assets that require delivery of assets within a time frame established by regulation or convention in the marketplace (regular way trades) are recognized on the trade date, i.e., the date that the Group commits to purchase or sell the asset.
IPSAS 29.40
The Group's financial assets include: cash and short-term deposits; trade and other receivables; loans and other receivables; quoted and unquoted financial instruments; and derivative financial instruments.
Subsequent measurement The subsequent measurement of financial assets depends on their classification.
Financial assets at fair value through surplus or deficit
Financial assets at fair value through surplus or deficit include financial assets held for trading and financial assets designated upon initial recognition at fair value through surplus and deficit. Financial assets are classified as held for trading if they are acquired for the purpose of selling or repurchasing in the near term. Derivatives, including separated embedded derivatives are also classified as held for trading unless they are designated as effective hedging instruments. Financial assets at fair value through surplus or deficit are carried in the statement of financial position at fair value with changes in fair value recognized in surplus or deficit.
IPSAS 29.10 IPSAS 29.47 IPSAS 29.64 (a)
Loans and receivables
Loans and receivables are non-derivative financial assets with fixed or determinable payments that are not quoted in an active market. After initial measurement, such financial assets are subsequently measured at amortized cost using the effective interest method, less impairment. Amortized cost is calculated by taking into account any discount or premium on acquisition and fees or costs that are an integral part of the effective interest rate. Losses arising from impairment are recognized in the surplus or deficit.
IPSAS 29.10 IPSAS 29.48 (a) IPSAS 29.65

Notes to the consolidated financial statements
21 Model Public Sector Group
2.2 Summary of significant accounting policies continued
Held-to-maturity
Non-derivative financial assets with fixed or determinable payments and fixed maturities are classified as held to maturity when the Group has the positive intention and ability to hold it to maturity. After initial measurement, held-to-maturity investments are measured at amortized cost using the effective interest method, less impairment. Amortized cost is calculated by taking into account any discount or premium on acquisition and fees or costs that are an integral part of the effective interest rate. The losses arising from impairment are recognized in surplus or deficit.
IPSAS 29.10 IPSAS 29.48 (b) IPSAS 29.63 (a)
Commentary The Group does not hold any available-for-sale financial assets. An illustrative disclosure for entities that hold available-for-sale financial assets is as follows:
Available-for-sale financial assets
The Group classifies available-for-sale financial assets as non-derivative financial assets that are designated as available for sale or are not classified as loans and receivables, held-to-maturity or financial assets at fair value through surplus or deficit.
After initial measurement, available-for-sale financial investments are subsequently measured at fair value with gains or losses recognized directly in net assets through the statement of changes in net assets until the financial asset is derecognized, at which time the cumulative gain or loss is recognized in surplus or deficit.
Derecognition
The Group derecognizes a financial asset or, where applicable, a part of a financial asset or part of a group of similar financial assets when:
IPSAS 29.19
The rights to receive cash flows from the asset have expired or is waived
The Group has transferred its rights to receive cash flows from the asset or has assumed an obligation to pay the received cash flows in full without material delay to a third party; and either: (a) the Group has transferred substantially all the risks and rewards of the asset; or (b) the Group has neither transferred nor retained substantially all the risks and rewards of the asset, but has transferred control of the asset.
IPSAS 29.20-22
Impairment of financial assets
The Group assesses at each reporting date whether there is objective evidence that a financial asset or a group of financial assets is impaired. A financial asset or a group of financial assets is deemed to be impaired if, and only if, there is objective evidence of impairment as a result of one or more events that has occurred after the initial recognition of the asset (an incurred ‘loss event’) and that loss event has an impact on the estimated future cash flows of the financial asset or the group of financial assets that can be reliably estimated. Evidence of impairment may include the following indicators:
The debtors or a group of debtors are experiencing significant financial difficulty
Default or delinquency in interest or principal payments
The probability that debtors will enter bankruptcy or other financial reorganization
Observable data indicates a measurable decrease in estimated future cash flows (e.g. changes in arrears or economic conditions that correlate with defaults)
IPSAS 29.67-68 IPSAS 30.AG5 (f)
Financial assets carried at amortized cost
For financial assets carried at amortized cost, the Group first assesses whether objective evidence of impairment exists individually for financial assets that are individually significant, or collectively for financial assets that are not individually significant. If the Group determines that no objective evidence of impairment exists for an individually assessed financial asset, whether significant or not, it includes the asset in a group of financial assets with similar credit risk characteristics and collectively assesses them for impairment. Assets that are individually assessed for impairment and for which an impairment loss is, or continues to be, recognized are not included in a collective assessment of impairment.
IPSAS 29.72-73

Notes to the consolidated financial statements
Model Public Sector Group 22
2.2 Summary of significant accounting policies continued
If there is objective evidence that an impairment loss has been incurred, the amount of the loss is measured as the difference between the assets carrying amount and the present value of estimated future cash flows (excluding future expected credit losses that have not yet been incurred). The present value of the estimated future cash flows is discounted at the financial asset’s original effective interest rate. If a loan has a variable interest rate, the discount rate for measuring any impairment loss is the current effective interest rate.
IPSAS 29. AG117 IPSAS 30.20 IPSAS 29.73 IPSAS 29.AG126 IPSAS 30.AG5 (d) (i) (ii)
The carrying amount of the asset is reduced through the use of an allowance account and the amount of the loss is recognized in surplus or deficit. Loans together with the associated allowance are written off when there is no realistic prospect of future recovery and all collateral has been realized or transferred to the Group. If, in a subsequent year, the amount of the estimated impairment loss increases or decreases because of an event occurring after the impairment was recognized, the previously recognized impairment loss is increased or reduced by adjusting the allowance account. If a future write-off is later recovered, the recovery is credited to finance costs in surplus or deficit.
Commentary The Group does not hold any available-for-sale financial assets. An illustrative disclosure of impairment considerations for entities that hold available-for-sale financial assets is as follows:
Available-for-sale financial assets
For available-for-sale financial assets, the Group assesses at each reporting date whether there is objective evidence that an investment or a group of investments is impaired.
In the case of financial assets classified as available-for-sale, objective evidence would include a significant or prolonged decline in the fair value of the investment below its cost. ‘Significant’ is evaluated against the original cost of the investment and ‘prolonged’ against the period in which the fair value was below its original cost. Where there is evidence of impairment, the cumulative loss – measured as the difference between the acquisition cost and the current fair value, less any impairment loss on that investment previously recognized in the surplus or deficit – is removed from the reserve in net assets and recognized in surplus or deficit.
In the case of debt instruments classified as available-for-sale, impairment is assessed based on the same criteria as financial assets carried at amortized cost. However, the amount recorded for impairment is the cumulative loss measured as the difference between the amortized cost and the current fair value, less any impairment loss on that investment previously recognized in surplus or deficit.
Financial liabilities
Initial recognition and measurement
Financial liabilities within the scope of IPSAS 29 are classified as financial liabilities at fair value through surplus or deficit or loans and borrowings, as appropriate. The Group determines the classification of its financial liabilities at initial recognition.
IPSAS 29.10
All financial liabilities are recognized initially at fair value and, in the case of loans and borrowings, plus directly attributable transaction costs.
IPSAS 29.45 IPSAS 29.49
The Group’s financial liabilities include trade and other payables, bank overdrafts, loans and borrowings, financial guarantee contracts.
Subsequent measurement
The measurement of financial liabilities depends on their classification.
Financial liabilities at fair value through surplus or deficit
Financial liabilities at fair value through surplus or deficit include financial liabilities held for trading and financial liabilities designated upon initial recognition as at fair value through surplus or deficit.
IPSAS 29.10 IPSAS 29.49 (a)
Financial liabilities are classified as held for trading if they are acquired for the purpose of selling in the near term. This category includes derivative financial instruments entered into by the Group that are not designated as hedging instruments in hedge relationships as defined by IPSAS 29.
Gains or losses on liabilities held for trading are recognized in surplus or deficit. IPSAS 29.64 (a)
Notes to the consolidated financial statements
23 Model Public Sector Group
2.2 Summary of significant accounting policies continued
Loans and borrowing
After initial recognition, interest bearing loans and borrowings are subsequently measured at amortized cost using the effective interest method. Gains and losses are recognized in surplus or deficit when the liabilities are derecognized as well as through the effective interest method amortization process.
IPSAS 29.65
Amortized cost is calculated by taking into account any discount or premium on acquisition and fees or costs that are an integral part of the effective interest rate.
Derecognition
A financial liability is derecognized when the obligation under the liability is discharged or cancelled or expires. IPSAS 29.41
When an existing financial liability is replaced by another from the same lender on substantially different terms, or the terms of an existing liability are substantially modified, such an exchange or modification is treated as a derecognition of the original liability and the recognition of a new liability, and the difference in the respective carrying amounts is recognized in surplus or deficit.
IPSAS 29.43
Offsetting of financial instruments
Financial assets and financial liabilities are offset and the net amount reported in the consolidated statement of financial position if, and only if, there is a currently enforceable legal right to offset the recognized amounts and there is an intention to settle on a net basis, or to realize the assets and settle the liabilities simultaneously.
IPSAS 28.47
Fair value of financial instruments
The fair value of financial instruments that are traded in active markets at each reporting date is determined by reference to quoted market prices or dealer price quotations (bid price for long positions and ask price for short positions), without any deduction for transaction costs. IPSAS 29.51
IPSAS 29.10
Derivative financial instruments
Initial recognition and subsequent measurement
The Group uses derivative financial instruments such as forward currency contracts and interest rate swaps to hedge its foreign currency risks and interest rate risks, respectively. Such derivative financial instruments are initially recognized at fair value on the date on which a derivative contract is entered into and are subsequently re-measured at fair value. Derivatives are carried as financial assets when the fair value is positive and as financial liabilities when the fair value is negative.
IPSAS 29.45 IPSAS 30.25
Any gains or losses arising from changes in the fair value of derivatives are taken directly to surplus or deficit. The Group does not apply hedge accounting.
IPSAS 29.106 (a) (b) IPSAS 29.99 (a) (b)
Commentary Although some of the hedges of the Group qualified for hedge accounting, the Group opted not to apply hedge accounting. As such, further consideration of hedging and hedge accounting was omitted from the accounting policy. Where hedge accounting is applied by an entity, the following treatment would apply:
Fair value hedges The change in the fair value of a hedging derivative is recognized in the statement of financial performance as finance costs. The change in the fair value of the hedged item attributable to the risk hedged is recorded as part of the carrying value of the hedged item and is also recognized in the statement of financial performance as finance costs. Cash flow hedges The effective portion of the gain or loss on the hedging instrument is recognized directly in statement of changes in net assets in the cash flow hedge reserve, while any ineffective portion is recognized immediately in the statement of financial performance as other operating expenses.
l) Cash and cash equivalents
Cash and cash equivalents comprise cash on hand and cash at bank, deposits on call and highly liquid investments with an original maturity of three months or less, which are readily convertible to known amounts of cash and are subject to insignificant risk of changes in value. For the purpose of the consolidated statement of cash flows, cash and cash equivalents consist of cash and short-term deposits as defined above, net of outstanding bank overdrafts.
IPSAS 2.8 IPSAS 2.9 IPSAS 2.56
Commentary The Group considers bank overdrafts to be an integral part of its cash management practices. Accordingly, bank overdrafts are grouped as part of cash and cash equivalents for the purpose of preparing the cash flow statement.

Notes to the consolidated financial statements
Model Public Sector Group 24
2.2 Summary of significant accounting policies continued
m) Inventories
Inventory is measured at cost upon initial recognition. To the extent that inventory was received through non-exchange transactions (for no cost or for a nominal cost), the cost of the inventory is its fair value at the date of acquisition.
Costs incurred in bringing each product to its present location and condition are accounted for, as follows:
Raw materials: purchase cost using the weighted average cost method Finished goods and work in progress: cost of direct materials and labor and a proportion of manufacturing overheads based on the normal operating capacity, but excluding borrowing costs
After initial recognition, inventory is measured at the lower of cost and net realizable value. However, to the extent that a class of inventory is distributed or deployed at no charge or for a nominal charge, that class of inventory is measured at the lower of cost and current replacement cost.
Net realizable value is the estimated selling price in the ordinary course of operations, less the estimated costs of completion and the estimated costs necessary to make the sale, exchange, or distribution.
Inventories are recognized as an expense when deployed for utilization or consumption in the ordinary course of operations of the Group.
IPSAS 12.15 IPSAS 12.17 (a) IPSAS 12.16 IPSAS 12.18 IPSAS 12.35 IPSAS 12.20 IPSAS 12.21 IPSAS 12.9
n) Provisions
Provisions are recognized when the Group has a present obligation (legal or constructive) as a result of a past event, it is probable that an outflow of resources embodying economic benefits or service potential will be required to settle the obligation and a reliable estimate can be made of the amount of the obligation. IPSAS 19.22
IPSAS 19.56
Where the Group expects some or all of a provision to be reimbursed, for example, under an insurance contract, the reimbursement is recognized as a separate asset only when the reimbursement is virtually certain.
IPSAS 19.63
The expense relating to any provision is presented in the statement of financial performance net of any reimbursement.
IPSAS 19.64
Rehabilitation liability
Rehabilitation costs are provided at the present value of expected costs to settle the obligation using estimated cash flows and are recognized as part of the cost of that particular asset. The cash flows are discounted at a current pre-tax rate that reflects the risks specific to the rehabilitation liability. The unwinding of the discount is expensed as incurred and recognized in the statement of financial performance as a finance cost. The estimated future costs of decommissioning are reviewed annually and adjusted as appropriate. Changes in the estimated future costs or in the discount rate applied are added to or deducted from the cost of the asset.
IPSAS 17.30 (c) IPSAS 19.53
Contingent liabilities
The Group does not recognize a contingent liability, but discloses details of any contingencies in the notes to the financial statements, unless the possibility of an outflow of resources embodying economic benefits or service potential is remote.
IPSAS 19.35 IPSAS 19.36 IPSAS 19.100
Contingent assets
The Group does not recognize a contingent asset, but discloses details of a possible asset whose existence is contingent on the occurrence or non-occurrence of one or more uncertain future events not wholly within the control of the Group in the notes to the financial statements. Contingent assets are assessed continually to ensure that developments are appropriately reflected in the financial statements. If it has become virtually certain that an inflow of economic benefits or service potential will arise and the asset’s value can be measured reliably, the asset and the related revenue are recognized in the financial statements of the period in which the change occurs.
IPSAS 19.39
Commentary IPSAS 19 provides a choice of presenting expenditures to settle a provision either net of any reimbursement or on a gross basis. The Group has elected to present the expenses net of reimbursements. Reimbursements are accounted for separately.
IPSAS 19.44–46 requires provisions to be measured as the best estimate of the present value of the amount required to settle the obligation. In making this estimate the Group considers the probability of the various uncertain outcomes of the obligation.

Notes to the consolidated financial statements
25 Model Public Sector Group
2.2 Summary of significant accounting policies continued
o) Nature and purpose of reserves
The Group creates and maintains reserves in terms of specific requirements.
Capital replacement reserve (CRR) In order to finance the provision of infrastructure and other property, plant and equipment from internal sources, amounts are transferred from the accumulated surplus to the CRR. The following provisions are set for the creation and utilization of the CRR:
The cash funds that back up the CRR are invested until utilized. The CRR may only be utilized for purchasing items of property, plant and equipment, and may not be used for their maintenance. Whenever an asset is purchased out of the CRR, an amount equal to the cost price of the asset is transferred from the CRR, and the accumulated surplus is credited by a corresponding amount.
Self-insurance reserve A general insurance reserve has been established to cover claims that may occur, subject to reinsurance, where deemed necessary. Premiums are charged to the respective services, taking into account claims history and replacement value of the insured assets. Reinsurance premiums paid to external reinsurers are regarded as an expense, and are shown as such in the statement of financial performance. The net surplus or deficit on the insurance operating account is transferred to or from the insurance reserve via the statement of changes in net assets. However, the operating account has not made a profit or loss for the past three years.
An actuarial valuation is obtained each year to assess the adequacy of the insurance reserve at year-end.
Housing development reserve In accordance with the Group’s statutory obligation to provide social housing, a separate reserve has been created to serve as an operating account for the social housing project requirements. Any surplus or deficit on operating account is transferred to or from the housing development reserve via the statement of changes in net assets. However, the operating account has not made a profit or loss for the past three years. The reserve is fully asset-backed.
An actuarial valuation is obtained each year to assess the adequacy of the insurance reserve at year-end.
p) Changes in accounting policies and estimates
The Group recognizes the effects of changes in accounting policy retrospectively. The effects of changes in accounting policy are applied prospectively if retrospective application is impractical.
IPSAS 3.27 IPSAS 3.30
Early application of IPSAS 32 Service Concession Arrangements: Grantor
The IPSASB issued IPSAS 32 in October 2011 to address a lack of guidance on how public sector entities should account for service concession arrangements from a grantor’s perspective. The standard applies the principles in IFRIC 12 Service Concession Arrangements for determining whether the grantor or the operator should recognize the asset used in a service concession arrangement. This standard is effective for annual periods beginning on or after 1 January 2014, with earlier application permitted. The Group has opted to early adopt this standard in these consolidated financial statements.
The standard requires an entity that has previously recognized service concession assets and related liabilities, revenue and expenses to apply this standard retrospectively in accordance with IPSAS 3. The standard also requires an entity that has not previously recognized service concession assets and related liabilities, revenues, and expenses and uses the accrual basis of accounting to apply this standard either retrospectively or prospectively, using deemed cost from the beginning of the earliest period for which comparative information is presented in the financial statements.
The Group had no service concession arrangement in prior periods but has entered into such an arrangement in the current period. See note 46.
IPSAS 3.33
The Group recognizes the effects of changes in accounting estimates prospectively by including in surplus or deficit.
IPSAS 3.41

Notes to the consolidated financial statements
Model Public Sector Group 26
2.2 Summary of significant accounting policies continued
q) Employee benefits
Retirement benefit plans The Group provides retirement benefits for its employees and councilors. Defined contribution plans are post-employment benefit plans under which an entity pays fixed contributions into a separate entity (a fund), and will have no legal or constructive obligation to pay further contributions if the fund does not hold sufficient assets to pay all employee benefits relating to employee service in the current and prior periods. The contributions to fund obligations for the payment of retirement benefits are charged against income in the year in which they become payable.
Defined benefit plans are post-employment benefit plans other than defined-contribution plans. The defined-benefit funds are actuarially valued tri-annually on the projected unit credit method basis. Deficits identified are recovered through lump sum payments or increased future contributions on proportional basis to all participating employers. The contributions and lump sum payments reduce the post-employment benefit obligation.
Post-retirement pension funds Pension contributions in respect of employees who were not members of a pension fund are recognized as an expense when incurred. Staff provident funds are maintained to accommodate personnel who, due to age, cannot join or be part of the various pension funds. The Group contributes monthly to the funds.
These contributions are charged to the operating account when employees have rendered the service entitling them to the contributions. Actuarial valuation of the liability is performed on an annual basis. The projected unit credit method has been used to value the obligations. The liability in respect of current pensioners is regarded as fully accrued, and, therefore, is not split between a past (or accrued) and future in-service element. The liability is recognized at the present value of the obligation, together with adjustments for the actuarial gains and losses, and past service costs.
Actuarial gains or losses are fully accounted for in the statement of financial performance in the year that they occur.
Medical aid: continued members The Group provides post-retirement benefits by subsidizing the medical aid contributions of certain retired staff. According to the rules of the medical aid funds with which the Group is associated, a retired staff is entitled to remain a continued member of such medical aid fund, and the Group will continue to subsidize medical contributions in accordance with the provisions of the employee’s employment contract and the Group’s decision on protected rights. Post-retirement medical contributions paid by the Group, depending on the employee’s contract, could be 65%, 75% or a subsidy based on a sliding scale. In each case, the employee is responsible for the balance of post-retirement medical contributions. External appointments after March 2000 do not qualify for a post-retirement medical aid subsidy.
IPSAS 25.58
These contributions are charged to the statement of financial performance when employees have rendered the service entitling them to the contribution.
The liability in respect of current retired members is regarded as fully accrued, and is therefore not split between a past (or accrued) and future in-service element. The liability is recognized at the present value of the obligation, together with adjustments for the unrecognized actuarial gains and losses, and past service costs.
Actuarial gains or losses are fully accounted for in the statement of financial performance in the year that they occur. The projected unit credit method has been used to value the obligation.
Short and long-term employee benefits The cost of all short-term employee benefits, such as leave pay, is recognized during the period in which the employee renders the related service. The Group recognizes the expected cost of performance bonuses only when the Group has a present legal or constructive obligation to make such payment, and a reliable estimate can be made.
The Group provides long-term incentives to eligible employees, payable on completion of years of employment. The Group’s liability is based on an actuarial valuation. The projected unit credit method has been used to value the obligation. Actuarial gains and losses on the long-term incentives are fully accounted for in the statement of financial performance.

Notes to the consolidated financial statements
27 Model Public Sector Group
2.2 Summary of significant accounting policies continued
r) Foreign currency transactions
Transactions in foreign currencies are initially accounted for at the ruling rate of exchange on the date of the transaction. Trade creditors or debtors denominated in foreign currency are reported at the statement of financial position reporting date by applying the exchange rate on that date. Exchange differences arising from the settlement of creditors, or from the reporting of creditors at rates different from those at which they were initially recorded during the period, are recognized as income or expenses in the period in which they arise.
IPSAS 4
s) Borrowing costs
Borrowing costs are capitalized against qualifying assets as part of property, plant and equipment.
Such borrowing costs are capitalized over the period during which the asset is being acquired or constructed and borrowings have been incurred. Capitalization ceases when construction of the asset is complete. Further borrowing costs are charged to the statement of financial performance.
IPSAS 5.17
Commentary IPSAS 5 permits the expensing of all borrowing costs in the period in which they are incurred. For the purposes of these illustrative financial statements, the more complex alternative policy choice of capitalizing borrowing costs to qualifying assets has been applied.
IPSAS 5.14
t) Related parties
The Group regards a related party as a person or an entity with the ability to exert control individually or jointly, or to exercise significant influence over the Group, or vice versa. Members of key management are regarded as related parties and comprise the councilors, the executive mayor, mayoral committee members, the city manager, deputy city manager and senior managers.
IPSAS 20.4
u) Service concession arrangements The Group analyses all aspects of service concession arrangements that it enters into in determining the appropriate accounting treatment and disclosure requirements. In particular, where a private party contributes an asset to the arrangement, the Group recognizes that asset when, and only when, it controls or regulates the services the operator must provide together with the asset, to whom it must provide them, and at what price. In the case of assets other than ’whole-of-life’ assets, it controls, through ownership, beneficial entitlement or otherwise – any significant residual interest in the asset at the end of the arrangement. Any assets so recognized are measured at their fair value. To the extent that an asset has been recognized, the Group also recognizes a corresponding liability, adjusted by a cash consideration paid or received.
IPSAS 32.9 IPSAS 32.14
v) Budget information
The annual budget is prepared on the accrual basis, that is, all planned costs and income are presented in a single statement to determine the needs of the Group. As a result of the adoption of the accrual basis for budgeting purposes, there are no basis, timing or entity differences that would require reconciliation between the actual comparable amounts and the amounts presented as a separate additional financial statement in the statement of comparison of budget and actual amounts. Explanatory comments are provided in the notes to the annual financial statements; first, the reasons for overall growth or decline in the budget are stated, followed by details of overspending or underspending on line items.
The annual budget figures included in the financial statements are for the controlling entity (the municipality) and therefore exclude the budget for its subsidiaries. The budgets of the subsidiaries are not made publicly available. These budget figures are those approved by the governing body both at the beginning and during the year following a period of consultation with the public.
IPSAS 24
w) Significant judgments and sources of estimation uncertainty
The preparation of the Group's financial statements in conformity with IPSAS requires management to make judgments, estimates and assumptions that affect the reported amounts of revenues, expenses, assets and liabilities, and the disclosure of contingent liabilities, at the end of the reporting period. However, uncertainty about these assumptions and estimates could result in outcomes that require a material adjustment to the carrying amount of the asset or liability affected in future periods.
IPSAS 1.137
Judgments
In the process of applying the Group’s accounting policies, management has made judgments, which have the most significant effect on the amounts recognized in the consolidated financial statements.
IPSAS 1.137

Notes to the consolidated financial statements
Model Public Sector Group 28
2.2 Summary of significant accounting policies continued
Operating lease commitments – group as lessor The Group has entered into property leases of certain of its properties. The Group has determined, based on an evaluation of the terms and conditions of the arrangements, (such as the lease term not constituting a substantial portion of the economic life of the commercial property) that it retains all the significant risks and rewards of ownership of these properties and accounts for the contracts as operating leases.
Estimates and assumptions
The key assumptions concerning the future and other key sources of estimation uncertainty at the reporting date, that have a significant risk of causing a material adjustment to the carrying amounts of assets and liabilities within the next financial year, are described below. The Group based its assumptions and estimates on parameters available when the consolidated financial statements were prepared. However, existing circumstances and assumptions about future developments may change due to market changes or circumstances arising beyond the control of the Group. Such changes are reflected in the assumptions when they occur.
IPSAS 1.140
Useful lives and residual values
The useful lives and residual values of assets are assessed using the following indicators to inform potential future use and value from disposal:
The condition of the asset based on the assessment of experts employed by the Group The nature of the asset, its susceptibility and adaptability to changes in technology and processes The nature of the processes in which the asset is deployed Availability of funding to replace the asset Changes in the market in relation to the asset
Impairment of non-financial assets – cash-generating assets
The recoverable amounts of cash-generating units and individual assets have been determined based on the higher of value-in-use calculations and fair values less costs to sell. These calculations require the use of estimates and assumptions. It is reasonably possible that the assumptions may change, which may then impact management’s estimations and require a material adjustment to the carrying value of tangible assets.
The Group reviews and tests the carrying value of assets when events or changes in circumstances suggest that the carrying amount may not be recoverable. Cash-generating assets are grouped at the lowest level for which identifiable cash flows are largely independent of cash flows of other assets and liabilities. If there are indications that impairment may have occurred, estimates of expected future cash flows are prepared for each group of assets. Expected future cash flows used to determine the value in use of tangible assets are inherently uncertain and could materially change over time.
Impairment of non-financial assets – cash generating assets The Group reviews and tests the carrying value of non-cash-generating assets when events or changes in circumstances suggest that there may be a reduction in the future service potential that can reasonably be expected to be derived from the asset. Where indicators of possible impairment are present, the Group undertakes impairment tests, which require the determination of the fair value of the asset and its recoverable service amount. The estimation of these inputs into the calculation relies on the use estimates and assumptions. Any subsequent changes to the factors supporting these estimates and assumptions may have an impact on the reported carrying amount of the related asset.
Fair value estimation – financial instruments Where the fair value of financial assets and financial liabilities recorded in the statement of financial position cannot be derived from active markets, their fair value is determined using valuation techniques including the discounted cash flow model. The inputs to these models are taken from observable markets where possible, but where this is not feasible, judgment is required in establishing fair values. Judgment includes the consideration of inputs such as liquidity risk, credit risk and volatility. Changes in assumptions about these factors could affect the reported fair value of financial instruments.

Notes to the consolidated financial statements
29 Model Public Sector Group
2.2 Summary of significant accounting policies continued
Provisions
Provisions were raised and management determined an estimate based on the information available. Additional disclosure of these estimates of provisions is included in Note 36.
Provisions are measured at the management's best estimate of the expenditure required to settle the obligation at the reporting date, and are discounted to present value where the effect is material.
Assumptions were used in determining the provision for rehabilitation of landfill sites. Landfill areas are rehabilitated over years and the assumption was made that the areas stay the same in size for a number of years.
Provision is made for the estimated cost to be incurred on the long-term environmental obligations, comprising expenditure on pollution control and closure over the estimated life of the landfill. The provision is based on the advice and judgment of qualified engineers.
The estimates are discounted at a pre-tax discount rate that reflect current market assessments of the time value of money.
The increase in the rehabilitation provision due to passage of time is recognized as finance cost in the statement of financial performance.
The cost of ongoing programs to prevent and control pollution and rehabilitate the environment is recognized as an expense when incurred.
Held-to-maturity investments and loans and receivables The Group assesses its loans and receivables (including trade receivables) and its held-to-maturity investments at the end of each reporting period. In determining whether an impairment loss should be recorded in surplus or deficit, the Group evaluates the indicators present in the market to determine if those indicators are indicative of impairment in its loans and receivables or held-to-maturity investments.
Where specific impairments have not been identified the impairment for trade receivables, held-to-maturity investments and loans and receivables is calculated on a portfolio basis, based on historical loss ratios, adjusted for national and industry-specific economic conditions and other indicators present at the reporting date that correlate with defaults on the portfolio. These annual loss ratios are applied to loan balances in the portfolio and scaled to the estimated loss emergence period.
Commentary IPSAS 1.137 requires an entity to disclose significant judgements applied in preparing the financial statements and significant estimates that involve a high degree of estimation uncertainty. The disclosure requirements go beyond those requirements that already exist in some other IPSAS such as IPSAS 19.
These disclosures represent a very important source of information in the financial statements because they highlight areas in the financial statements that are most prone to change in the foreseeable future. Therefore, any information given should be sufficiently detailed to help readers of the financial statements understand the impact of possible significant changes.

Notes to the consolidated financial statements
30 Model Public Sector Group
3. Property taxes revenue
2013 2012
Actual €000 €000
IPSAS 23.106 (a) Taxable land and buildings
Residential 3,892,385 3,721,485
Commercial 1,315,259 1,257,511
State 306,602 293,141
Penalties 89,657 94,168
5,603,903 5,366,305
Income forgone (897,262) (841,942)
Total property taxes revenue 4,706,641 4,524,363
Valuations
Taxable land and buildings
Residential 534,173,358 549,409,889
Commercial 180,500,237 172,957,965
Agriculture 8,777,516 8,784,443
State 42,076,739 42,907,205
Municipal 24,294,577 23,689,445
789,822,427 797,748,947
Valuations on land and buildings are performed every four years. The last valuation came into effect on 1 January 2013. Interim valuations are processed on a quarterly basis to take into account changes in individual property values due to alterations.
A general rate of € 0.009678 is applied to property valuations to determine property taxes. Rebates of 42% are granted to residential and state property owners.
Taxes are levied on an annual basis with the due date of payment being 31 May of each year. Interest at prime rate plus 1% per annum is levied on outstanding property taxes. A 2% (2012: 2%) collection charge is levied on outstanding balances two months after the final due date of 31 May.
Income forgone can be defined as income that the Group is entitled by law to levy, but which has subsequently been forgone by way of rebate or remission.
Commentary The narrative description provided above is not explicitly required by IPSAS 9. However, this information may be required by certain jurisdictions. Moreover, disclosure of the basis used to determine the property tax revenue would provide a better understanding of property taxes to the users of the financial statements.
4. Public contributions and donations
2013 2012
€000 €000 IPSAS 23.106 (a)
Bay Area Oceanarium 36,984 40,383
Other 26,677 39,337
Total transfers and sponsorships 63,661 79,720
2013 2012
€000 €000
Reconciliation of public contributions and donations
Balance unspent at beginning of year 67,684 147,404
Current year receipts 57,908 -
Conditions met - transferred to revenue (63,661) (79,720)
Conditions to be met - remain liabilities (see note 37) 61,931 67,684 IPSAS 23.106 (c)

Notes to the consolidated financial statements
31 Model Public Sector Group
4. Public contributions and donations continued
Public contributions and donations represent those funds received for specific projects undertaken by the Group to enhance infrastructure. These funds were received on the basis of the project budgets submitted. Accordingly, the Group is contractually bound to spend these funds only in connection with the projects.
Furthermore, the contracts stipulate that the funds received for the project may only be applied to the costs incurred for the project, as and when the phases of the project are certified as complete by an independent engineer. The conditions remaining therefore represent phases of the projects that are yet to be certified as complete by an independent engineer. Furthermore, the contract stipulates that where funds are not spent as specified within the contract, they must be returned to the donor.
IPSAS 23.106 (d)
5. Fines, penalties and levies
2013 2012 €000 €000 IPSAS 23.106 (a)
Fuel levy 1,637,276 1,510,960
Fines 144,394 166,476
Total 1,781,670 1,677,436
The Group is entitled by legislation to levy fines on those individuals or companies who fail to comply with the by-laws of the city.
6. Transfers from other governments – gifts and services-in-kind
2013 2012
€000 €000 IPSAS 23.106 (a)
Unconditional grants
Operational grant 970,474 836,662
Other - 73,775
970,474 910,437
Conditional grants IPSAS 23.106 (a)
National housing grant - 249,772
National infrastructure grant 136,113 129,925
Provincial health grant - 3,843
Social services grant 30,049 32,824
Basic services subsidy 1,919,890 705,761
Transportation fund (international funding) 700,901 592,282
Other organizational grants 408 11,625
2,787,361 1,726,032
Total government grants and subsidies 3,757,835 2,636,469
2013 2012
€000 €000 Government grants and subsidies - capital 1,626,991 1,385,536 IPSAS 23.106 (a)
Government grants and subsidies - operating 2,130,844 1,250,933
Total government grants and subsidies 3,757,835 2,636,469
2013 2012
Reconciliation of conditional grants €000 €000
Balance unspent at beginning of year 1,040,996 1,041,921
Current year receipts 4,320,660 2,635,544
Conditions met - transferred to revenue (3,757,835) (2,636,469)
Conditions to be met - liabilities (see note 37) 1,603,821 1,040,996 IPSAS 23.106 (c) & (e)
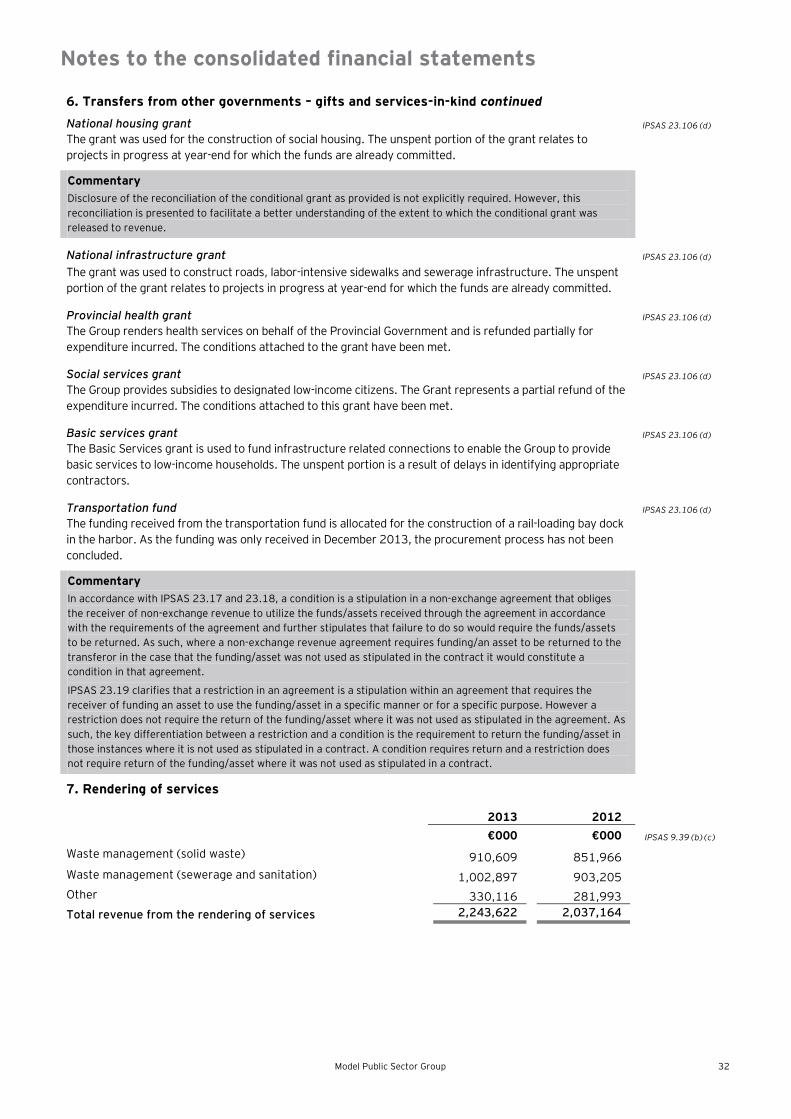
Notes to the consolidated financial statements
Model Public Sector Group 32
6. Transfers from other governments – gifts and services-in-kind continued
National housing grant IPSAS 23.106 (d)
The grant was used for the construction of social housing. The unspent portion of the grant relates to projects in progress at year-end for which the funds are already committed.
Commentary Disclosure of the reconciliation of the conditional grant as provided is not explicitly required. However, this reconciliation is presented to facilitate a better understanding of the extent to which the conditional grant was released to revenue.
National infrastructure grant IPSAS 23.106 (d)
The grant was used to construct roads, labor-intensive sidewalks and sewerage infrastructure. The unspent portion of the grant relates to projects in progress at year-end for which the funds are already committed.
Provincial health grant IPSAS 23.106 (d)
The Group renders health services on behalf of the Provincial Government and is refunded partially for expenditure incurred. The conditions attached to the grant have been met.
Social services grant IPSAS 23.106 (d)
The Group provides subsidies to designated low-income citizens. The Grant represents a partial refund of the expenditure incurred. The conditions attached to this grant have been met.
Basic services grant IPSAS 23.106 (d)
The Basic Services grant is used to fund infrastructure related connections to enable the Group to provide basic services to low-income households. The unspent portion is a result of delays in identifying appropriate contractors.
Transportation fund IPSAS 23.106 (d)
The funding received from the transportation fund is allocated for the construction of a rail-loading bay dock in the harbor. As the funding was only received in December 2013, the procurement process has not been concluded.
Commentary In accordance with IPSAS 23.17 and 23.18, a condition is a stipulation in a non-exchange agreement that obliges the receiver of non-exchange revenue to utilize the funds/assets received through the agreement in accordance with the requirements of the agreement and further stipulates that failure to do so would require the funds/assets to be returned. As such, where a non-exchange revenue agreement requires funding/an asset to be returned to the transferor in the case that the funding/asset was not used as stipulated in the contract it would constitute a condition in that agreement.
IPSAS 23.19 clarifies that a restriction in an agreement is a stipulation within an agreement that requires the receiver of funding an asset to use the funding/asset in a specific manner or for a specific purpose. However a restriction does not require the return of the funding/asset where it was not used as stipulated in the agreement. As such, the key differentiation between a restriction and a condition is the requirement to return the funding/asset in those instances where it is not used as stipulated in a contract. A condition requires return and a restriction does not require return of the funding/asset where it was not used as stipulated in a contract.
7. Rendering of services
2013 2012
€000 €000 IPSAS 9.39 (b) (c)
Waste management (solid waste) 910,609 851,966
Waste management (sewerage and sanitation) 1,002,897 903,205 Other 330,116 281,993 Total revenue from the rendering of services 2,243,622 2,037,164

Notes to the consolidated financial statements
33 Model Public Sector Group
8. Sale of water and electricity
2013 2012
€000 €000 IPSAS 9.39(b) (c)
Sale of electricity 8,052,945 6,807,930
Sale of water 1,816,317 1,648,459
Total revenue from the sale of goods 9,869,262 8,456,389
Sale of electricity
Revenue was generated from the sale of 120,000 units (2012: 100,000) electricity at an average price of €64.93 per unit (2012: €61.60).
The revenue figure includes adjustments of €2,161,345 (2012: €2,314,930) relating to estimated unused prepaid electricity as at 31 December 2013.
Sale of water
Revenue was generated from the sale of 81,049 units (2012: 147,844) water at an average price of €22.41 per unit (2012: €11.15).
Commentary IPSAS 9.39 (c) requires an entity to disclose the amount of revenue arising from exchanges of goods or services included in each significant category of revenue. To achieve this and to enhance the clarity of the financial statements the classes of revenue, amounts included in each significant category of revenue were disaggregated to clarify the major components of each category of revenue.
Furthermore, the basis for determining the revenue from the sale of electricity was also disclosed to improve the clarity of the financial statements. This additional disclosure is a mandatory disclosure.
9. Rental revenue from facilities and equipment
2013 2012
€000 €000 IPSAS 9.39 (b)
Straight-lined operating lease receipts 283,891 244,344
Contingent rentals 5,845 5,972
Total rentals 289,736 250,316
10. Finance income - external investments
2013 2012
€000 €000 IPSAS 9.39 (b)
Cash investments and fixed deposits 339,970 293,300
Total finance income – external investments 339,970 293,300
11. Finance income - outstanding receivables
2013 2012
€000 €000 IPSAS 9.39 (b)
Service, water and electricity debtors 228,425 230,391 Total finance income – outstanding receivables 228,425 230,391

Notes to the consolidated financial statements
Model Public Sector Group 34
12. Other income
2013 2012
€000 €000 IPSAS 9.39 (b)
Insurance recoveries 2,621 1,098
Bulk infrastructure levies 56,426 54,926
Infrastructure improvement fee 89,508 81,409 Other income 149,686 94,278
Services concession income 10,000 - Skills development levy 23,272 22,195
Total other income 331,513 253,906
13. Bulk purchases of water and electricity
2013 2012
€000 €000 IPSAS 1.127 (c)
Electricity 5,385,001 4,326,842
Water 320,262 293,323
Total bulk purchases 5,705,263 4,620,165
14. Employee costs
2013 2012
€000 €000 IPSAS 1.127 (c)
Employee related costs - salaries and wages 4,341,494 3,990,865
Employee related costs - contributions to pensions and medical aids 1,129,270 1,034,405
Travel, motor car, accommodation, subsistence and other allowances 287,457 273,051
Housing benefits and allowances 31,061 31,315
Overtime payments 310,412 277,658
Performance and other bonuses - 1,880
Contribution - long service awards 878,229 600,062
Expenditure recharged to capital projects (22,137) (24,663)
Employee costs 6,955,786 6,184,573
15. Remuneration of councilors
2013 2012
€000 €000 IPSAS 20.34
Executive mayor 1,050 971
Deputy executive mayor 740 766
Speaker 740 766
Chief whip 695 719
Mayoral committee members 7,350 6,497
Sub-council chairpersons 15,206 15,117
Councilors 67,924 54,274
Councilors’ pension and medical aid contributions 4,067 9,511
Councilors’ travel 144 237
Total councilors’ remuneration 97,916 88,858

Notes to the consolidated financial statements
35 Model Public Sector Group
15. Remuneration of councilors continued
In-kind benefits
The executive mayor, deputy executive mayor, speaker and executive committee members hold full-time appointments and are provided with offices and secretarial support at the cost of the Council.
The executive mayor is entitled to stay at the mayoral residence owned by the Council at no cost. The executive mayor has use of the Council-owned vehicle for official duties.
16. Depreciation and amortization expense
2013 2012
€000 €000 IPSAS 1.127(c)
Property, plant and equipment 1,378,163 1,270,877 IPSAS 17.90 (a)
Intangible assets 15,018 10,207 IPSAS 31.117 (d)
Investment property carried at cost 1,653 2,598 IPSAS 1.127 (c)
Total depreciation and amortization 1,394,834 1,283,682
17. Repairs and maintenance
2013 2012 IPSAS 1.127 (c)
€000 €000
Property 1,307,598 1,209,336
Investment property – earning rentals 38,223 46,394 IPSAS 16.86 (f) (ii)
Equipment 679,871 568,654
Vehicles 188,976 190,643
Other 47,643 57,016
Total repairs and maintenance 2,262,311 2,072,023
Other includes repairs and maintenance expenses relating to office equipment.
18. Contracted services
2013 2012 IPSAS 1.127 (c)
€000 €000
Actuarial valuations 2,398 3,398
Investment valuations 4,022 3,896
Property valuations 1,349 2,647
Total contracted services 7,769 9,941
Actuarial valuations IPSAS 1.127 (c)
ABC Limited has been contracted for a period of three years to provide actuarial valuations of the post-retirement medical aid benefit liability on an annual basis. The total value of the contract is €7.194 million of which €2.398 million (2012: €4.796 million) relates to future periods.
Property valuations IPSAS 1.127 (c)
XYZ Limited has been contracted for a period of three years to provide property valuations on an annual basis. The total value of the contract is €9.794 million of which €3.876 million (2012: €6,898 million) relates to future periods. These valuations are undertaken for the purpose of updating the valuation register of the municipality. Property taxes are based on the values of property included in the valuation register.

Notes to the consolidated financial statements
Model Public Sector Group 36
19. Grants and subsidies 2013 2012
€000 €000 IPSAS 1.127 (c)
Community development 9,326 - Education initiatives and programs 67,157 - Social development 3,964 5,365 Community trust 7,667 6,191 Sporting bodies 10,000 5,354 Total grants and subsidies 98,114 16,910
20. General expenses
The following are included in general expenses:
2013 2012
€000 €000 IPSAS 1.127 (c)
Advertising 31,821 28,515
Admin fees 25,557 26,217
Audit fees 17,655 19,443
Conferences and delegations 30,629 25,508
Consulting fees 150,960 145,448
Consumables 290,523 298,912 IPSAS 11.47 (d)
Electricity 93,874 71,025
Fuel and oil 191,191 144,049
Insurance 26,659 26,611
Legal expenses 35,260 36,294
Licenses and permits 70,303 70,869
Chemicals 171,325 167,339
Water purification cost 400,348 363,415
Postage 26,599 25,993
Printing and stationery 62,049 57,496
Hire charges 147,652 119,064 IPSAS 13.44 (c) (i)
Rental 57,806 64,085 IPSAS 13.44 (c) (i)
Security costs 316,400 276,722
Sewage treatment costs 647,450 535,209
Skills development levies 48,398 43,499
Inventory scrapping 5,402 1,243
Telecommunication 115,442 115,859
Training 70,109 53,728
Other 41,748 21,762
Total general expenses 3,075,160 2,738,305
21. Finance costs
2013 2012 IPSAS 1.127 (c)
€000 €000
Borrowings (amortized cost) 642,664 663,565
Finance leases (amortized cost) 4,862 21,718
Unwinding of discount 35,350 33,604
Bank overdrafts 290 283
Total finance costs 683,166 719,170
Borrowing cost capitalized IPSAS 5.40 (b)
The total amount of borrowing costs capitalized during the period was €42 million (2012: €63 million).

Notes to the consolidated financial statements
37 Model Public Sector Group
22. Gain on sale of assets 2013 2012
€000 €000
Property, plant and equipment 41,893 16,641 IPSAS 1.127 (c)
Other assets 504 268 IPSAS 1.127 (c)
Total gain on sale of assets 42,397 16,909 23. Unrealized gain on fair value of investments
2013 2012
€000 €000
Investments at fair value 1,543 6,866 IPSAS 1.127 (c)
Total unrealized gain 1,543 6,866
24. Impairment loss
2013 2012 IPSAS 26.115 IPSAS 26.120
€000 €000
Property, plant and equipment 27,392 25,958
Intangible assets 725 - Allowance for impairment loss on receivables from exchange transactions 820,121 773,536
Total impairment loss 848,238 799,494
Property, plant and equipment includes: land and buildings, infrastructure assets, leased vehicles, office equipment and community assets.
Recoverable amount IPSAS 26.122, IPSAS 26.123
Value in use Management has used the following key assumptions in preparing the cash flow forecast: 2013 2012 % % Inflation 6.0 6.0 Growth rate 7.0 7.0 Discount rate 5.6 5.6 The inflation assumption made was based on forecasted inflation figures prepared by the Department of Finance and the Central Reserve Bank. The growth rate was based on the long-term average growth rate for services and the public sector in which the Group operates.
For cash generating assets the projected cash flow is for a period of three years and was based on the most reliable information available to management at 31 December 2013.
The Group holds both cash-generating and non-cash-generating assets. The impairments recognized only relate to the cash-generating assets. No impairments were identified on the non-cash-generating assets.
Fair value less cost to sell The fair value less cost to sell was based on the trade-in/resale value of the assets in the open market. For the vehicles, land and buildings that were impaired, an active market exists for the resale of these assets. The fair value less cost to sell was based on the values attainable from the resale of the assets in the open market. These values take into consideration the age and condition of the assets and is supported by past experience in the resale of vehicles, land and buildings in the open market.
Due to their nature, there is no active market for infrastructure assets, community assets, plant and equipment. As such, the recoverable amount of these assets is their value in use.
Events that lead to the recognition of impairment losses
As part of the annual assessment of assets, it was noted that the condition and performance of certain assets deteriorated to such an extent that they required greater-than-anticipated maintenance.

Notes to the consolidated financial statements
Model Public Sector Group 38
25. Taxation
2013 2012 €000 €000 IAS 12.79
Current income tax: Current income tax charge 5,481 7,342 IAS 12.80 (a)
Deferred tax: Relating to origination and reversal of temporary differences (1,377) (887) IAS 12.80 (c)
Income tax expense reported in the statement of financial performance 4,104 6,455
The reconciliations between tax expense and the product of accounting profit multiplied by the Group's tax rate for the years ended 31 December 2013 and 2012 are as follows:
IAS 12.81 (c) (i)
2013 2012 €000 €000 Accounting surplus before income tax 2,521,841 1,832,538 IAS 12.8 1(c)
Income tax at a rate of 28% 706,115 513,111 Government grants exempt from tax (1,052,194) (738,219) Fines, penalties and levy’s (494,764) (463,227) Non-deductible expenses:
Depreciation and amortization 390,554 359,431 Impairment losses 237,304 223,858 Legal expenses 9,873 10,162 Grants and subsidies paid 28,981 26,150 Skills’ development levy 13,551 12,180 Hire charges 41,343 33,338 Other non-deductible expenses 123,341 29,671
At the effective tax rate of 0.2% (2012: 0.4%) 4,104 6,455
Deferred tax relates to the following:
Statement of financial position
Statement of financial performance IAS 12.81 (g)
2013 2012 2013 2012 €000 €000 €000 €000 Accelerated depreciation for tax purposes (4,165) (5,012) (826) (532) Revaluation of investments to fair value (1,041) (1,253) (207) (133) Post employment benefits (1,735) (2,088) (344) (222)
Deferred tax (income) (1,377) (887)
Deferred tax (liabilities) (6,941) (8,353)
At 31 December 2013, there was no recognized deferred tax liability (2012: €Nil) for taxes that would be payable on the unremitted earnings of some of the Group’s subsidiaries. The Group has determined that undistributed surpluses of its subsidiaries will not be distributed in the foreseeable future.
IAS 12.81(f)
The temporary differences associated with investments in subsidiaries, for which a deferred tax liability has not been recognized in the consolidated financial statements, aggregate to €1.265 million (2012: €1.083 million).

Notes to the consolidated financial statements
39 Model Public Sector Group
Commentary The tax effects illustrated in the tax expense reconciliation above can be reconciled using a tax rate of 28% and applying it to the amounts in the following notes:
Government grants exempt from income tax as per note 6 Fines, penalties and levies per note 5 (it should be noted that the full amount is not exempt from income tax) Depreciation and amortization as per note 16 Impairment losses as per note 24 Legal expenses as per note 20 Grants and subsidies paid as per note 19 Skills’ development levy as per note 20 Hire charges as per note 20 Other non-deductible expenses, being a portion of other expenses in note 20
Although municipalities are likely to be tax exempt in many jurisdictions, the income tax considerations are included for illustrative purposes.
26. Cash and cash equivalents 2013 2012
€000 €000 Bank 125,693 148,609 Cash-on-hand and in transit 35,177 29,500 Short-term deposits 3,320,663 3,126,020
Total cash and cash equivalents 3,481,533 3,304,129
Cash at banks earns interest at floating rates based on daily bank deposit rates.
Short-term deposits are made for varying periods, depending on the immediate cash requirements of the Group and earn interest at the respective short-term deposit rate.
The Group’s bank balances amounting to €125.693 million include an amount of €43 million which must be used on infrastructure projects.
IPSAS 2.59
27. Receivables from exchange transactions
2013 2012 IPSAS 1.93
Current receivables €000 €000
Service, water and electricity debtors 6,016,348 5,403,663
Other exchange debtors 358,585 277,136
Less: impairment allowance (3,462,430) (3,129,770) IPSAS 1.20
Total current receivables 2,912,503 2,551,029
Non-current receivables
Sporting bodies 1,194 1,363
Public organizations 200,373 230,416
Less: impairment allowance (82,481) (97,060)
119,086 134,719
Current portion transferred to current receivables (19,758) (19,193)
Total non-current receivables 99,328 115,526
Total receivables 3,011,831 2,666,555
As at 31 December 2013, trade receivables of €3.462 billion (2012: €3.129 billion) were impaired and fully provided for.
IPSAS 30.44 (a)

Notes to the consolidated financial statements
Model Public Sector Group 40
27. Receivables from exchange transactions continued Reconciliation of allowance for impairment of receivables
Current
receivable Non-current receivables Total IPSAS 30.43 (d)
€000 €000 €000
At 1 January 2012 2,629,365 118,401 2,747,766
Charge for the year 773,367 169 773,536
Utilized (272,692) (21,510) (294,202)
Unused amounts reversed (3,562) - (3,562)
Discount rate adjustment 3,292 - 3,292
At 31 December 2012 3,129,770 97,060 3,226,830
Charge for the year 820,121 - 820,121
Utilized (487,421) (14,579) (502,000)
Unused amounts reversed (40) - (40)
At 31 December 2013 3,462,430 82,481 3,544,911 IPSAS 30.43(d) As at 31 December 2013 , the ageing analysis of current exchange receivables is as follows: IPSAS 30.44 (a)
At 31 December 2013 Neither past due nor
impaired
Past due but not impaired
Total <30days 30-60 days >60 days €000 €000 €000 €000 €000 Service, water and electricity debtors 2,612,579 1,404,151 89,870 154,843 963,715 Other debtors (exchange transactions) 299,924 238,147 26,488 23,702 11,587
Total 2,912,503 1,642,298 116,358 178,545 975,302
At 31 December 2012 IPSAS 30.44 (a)
Neither past due nor
impaired
Past due but not impaired
Total <30days 30-60 days >61 days €000 €000 €000 €000 €000 Service, water and electricity debtors 2,344,368 912,806 357,266 156,755 917,541 Other debtors (exchange transactions) 206,661 15,020 194,931 14,605 (17,895)
Total 2,551,029 927,826 552,197 171,360 899,646
28. Receivables from non-exchange contracts IPSAS 1.93
Current receivables 2013 2012
€000 €000
Property tax debtors 1,928,182 1,939,105
Other debtors (non-exchange transactions) 217,607 167,375
Less: impairment allowance (766,963) (747,079)
Total current receivables 1,378,826 1,359,401

Notes to the consolidated financial statements
41 Model Public Sector Group
29. Inventories 2013 2012
€000 €000 IPSAS 1.94 (c)
Consumable stores 207,628 197,484 IPSAS 12.47 (b)
Medical supplies 310 492 IPSAS 12.47 (b)
Spare parts and meters 22,634 14,351 IPSAS 12.47 (b)
Water for distribution 15,070 18,293 IPSAS 12.47 (b)
Other goods held for resale 8,743 3,549 IPSAS12.47 (b)
Catering - 2,465
Total inventories at the lower of cost and net realizable value 254,385 236,634 IPSAS 12.47 (b)
At 31 December 2013, €52.300 million (2012: €42.300 million) of total inventory was carried at fair value less cost to sell.
The amount of write-down of inventories recognized as an expense is €5.400 billion (2012: €1.200 billion), which is recognized in general expenses.
IPSAS 12.47(c) IPSAS 12.47(e)
No inventory items were pledged as security during the current or prior financial year. IPSAS 12.47(h)
30. Investments
The reconciliation and fair value of current investments is as follows:
Carrying amount Fair value
IPSAS 30.11(a)-(b)
€000 €000
Financial instruments at fair value through surplus/deficit Public traded government bonds
Opening balance at 1 January 2012 28,352 28,352
Additional investments made 1,467,399 1,467,399 Fair value increase 6,866 6,866
At 31 December 2012 1,502,617 1,502,617
Additional investments made 341,580 341,580
Fair value increase 1,080 1,080
At 31 December 2013 1,845,277 1,845,277
Held-to-maturity financial instruments
Fixed deposits
Opening balance at 1 January 2012 114,795 114,795
Additional investments made 486,321 486,321
Interest capitalized 42,863 42,863
At 31 December 2012 643,979 643,979
Additional investments made 289,249 289,249
Interest capitalized 104,845 104,845
At 31 December 2013 1,038,073 1,038,073

Notes to the consolidated financial statements
Model Public Sector Group 42
30. Investments continued
The reconciliation and fair value of non-current investments is as follows:
Carrying amount Fair value
IPSAS 30.11(a)-(b)
€000 €000
Financial instruments at fair value through surplus/deficit
Public traded government bonds
Opening balance at 1 January 2012 - -
Additional investments made - -
Fair value increase - -
At 31 December 2012 - -
Additional investments made 77,581 77,581
Fair value increase 463 463
At 31 December 2013 78,044 78,044
Held-to-maturity financial instruments Fixed deposits
Opening balance at 1 January 2012 - -
Additional investments made - -
Interest capitalized - -
At 31 December 2012 - - Additional investments made 28,396 28,396
Interest capitalized 5,052 5,052
At 31 December 2013 33,448 33,448
2013 2012
€000 €000
Total current investments 2,883,350 2,146596
Total non-current investments 111,492 -
Total investments 2,994,842 2,146596

Notes to the consolidated financial statements
43 Model Public Sector Group
31. Property, plant and equipment
Land and Buildings Infrastructure Community
Leased assets Other
Service concession
assets Housing
rental stock Total Cost €000 €000 €000 €000 €000 €000 €000 €000
At 1 January 2012 3,479,202 15,255,740 5,596,164 269,325 4,202,040 - 1,149,123 29,951,594
Additions 125,292 1,832,881 216,014 - 699,216 - 11,621 2,885,024 IPSAS 17.88 (e) (i)
Disposals (395) (1) - - (43,627) - (2,602) (46,625) IPSAS 17.88 (e) (ii)
Transfers/adjustments 202,606 (37,920) 45,817 (34,955) (198,856) - 7,732 (15,576)
At 31 December 2012 3,806,705 17,050,700 5,857,995 234,370 4,658,773 - 1,165,874 32,774,417 IPSAS 17.88 (d)
Additions 73,596 2,645,556 232,914 - 735,892 350,000 152,690 4,190,648 IPSAS 17.88 (e) (i)
Disposals (213) - - - (181,834) - (2,874) (184,921) IPSAS 17.88 (e) (ii)
Transfer/adjustments (1,021,034) 38,404 1,114,437 (234,370) (166,718) - 227,101 (42,180)
At 31 December 2013 2,859,054 19,734,660 7,205,346 - 5,046,113 350,000 1,542,791 36,737,964 IPSAS 17.88 (d)
Depreciation and impairment
At 1 January 2012 (1,655,793) (4,996,423) (553,294) (155,590) (1,805,579) - (527,666) (9,694,345)
Depreciation (91,825) (475,869) (232,331) (13,188) (431,002) - (26,662) (1,270,877) IPSAS 17.88 (e) (vii)
Impairment (9,866) - - - (16,092) - - (25,958) IPSAS 17.88 (e) (iv)
At 31 December 2012 (1,757,484) (5,472,292) (785,625) (168,778) (2,252,673) - (554,328) (10,991,180) IPSAS 17.88 (d)
Depreciation (81,381) (590,791) (220,508) - (445,276) (12,000) (28,207) (1,378,163) IPSAS 17.88 (e) (vii)
Disposals 165 - - - 68,342 - 2,147 70,654 IPSAS 17.88 (e) (ii)
Impairment (20,327) (234) - - (6,831) - - (27,392)
Transfer/adjustment 672,512 (242,404) (523,168) 168,778 (19,964) - (55,229) 525
At 31 December 2013 (1,186,515) (6,305,721) (1,529,301) - (2,656,402) (12,000) (635,617) (12,325,556) IPSAS 17.88 (d)
Net book values
At 31 December 2013 1,672,539 13,428,939 5,676,045 - 2,389,711 338,000 907,174 24,412,408
At 31 December 2012 2,049,221 11,578,408 5,072,370 65,592 2,406,100 - 611,546 21,783,237
The transfer and adjustment column relates to reclassifications between the different classes of assets and also to other categories of assets including inventory and intangible assets.
The Group is required to measure the residual value of all items of property, plant and equipment. Management does not expect a residual value for these assets, because they will be utilized for their entire economic lives and do not have a significant scrap value. During the current financial year, the Group reviewed the estimated useful lives and residual values of property, plant and equipment, where appropriate.
Fully depreciated assets at an original cost of €1.300 billion (2012: €1.940 billion) are still in use. These will be donated to non-profit organizations in the near future.
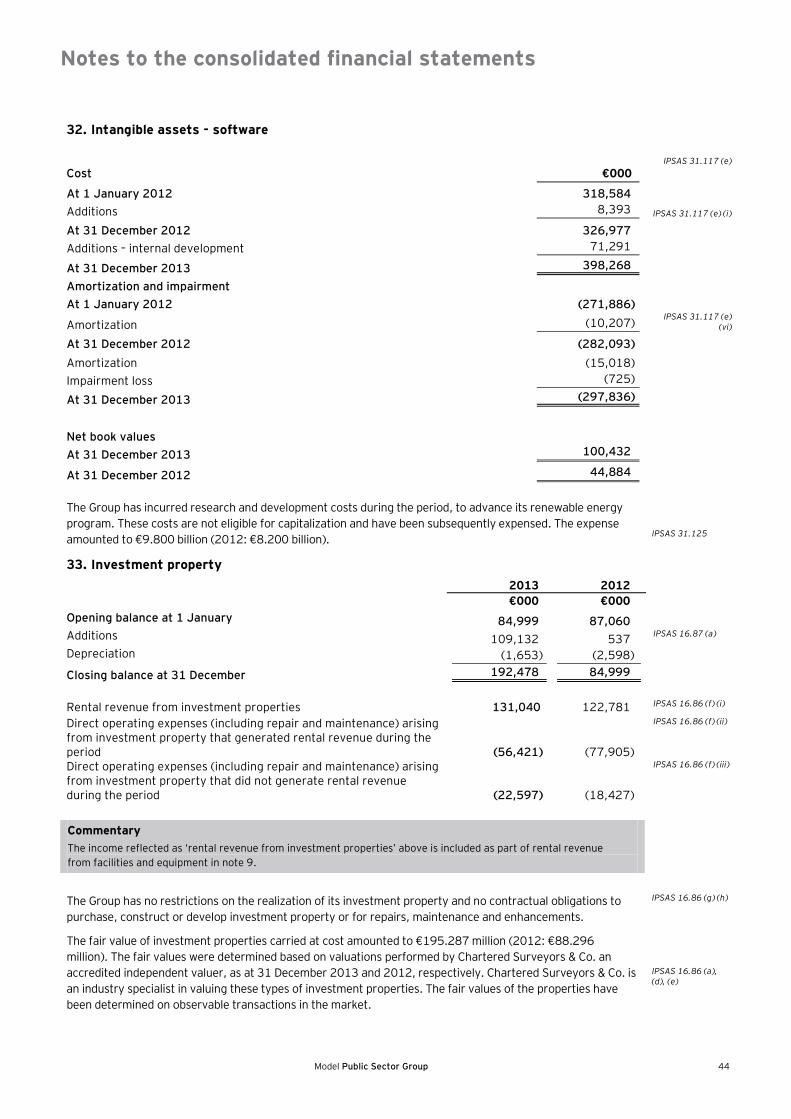
Notes to the consolidated financial statements
Model Public Sector Group 44
32. Intangible assets - software
IPSAS 31.117 (e) Cost €000
At 1 January 2012 318,584
Additions 8,393 IPSAS 31.117 (e) (i)
At 31 December 2012 326,977
Additions – internal development 71,291
At 31 December 2013 398,268
Amortization and impairment
At 1 January 2012 (271,886)
Amortization (10,207) IPSAS 31.117 (e) (vi)
At 31 December 2012 (282,093)
Amortization (15,018)
Impairment loss (725)
At 31 December 2013 (297,836)
Net book values
At 31 December 2013 100,432
At 31 December 2012 44,884
The Group has incurred research and development costs during the period, to advance its renewable energy program. These costs are not eligible for capitalization and have been subsequently expensed. The expense amounted to €9.800 billion (2012: €8.200 billion). IPSAS 31.125
33. Investment property 2013 2012 €000 €000
Opening balance at 1 January 84,999 87,060 Additions 109,132 537 IPSAS 16.87 (a)
Depreciation (1,653) (2,598)
Closing balance at 31 December 192,478 84,999
Rental revenue from investment properties 131,040 122,781 IPSAS 16.86 (f) (i)
Direct operating expenses (including repair and maintenance) arising from investment property that generated rental revenue during the period (56,421) (77,905)
IPSAS 16.86 (f) (ii)
Direct operating expenses (including repair and maintenance) arising from investment property that did not generate rental revenue during the period (22,597) (18,427)
IPSAS 16.86 (f) (iii)
Commentary The income reflected as ‘rental revenue from investment properties’ above is included as part of rental revenue from facilities and equipment in note 9.
The Group has no restrictions on the realization of its investment property and no contractual obligations to purchase, construct or develop investment property or for repairs, maintenance and enhancements.
IPSAS 16.86 (g) (h)
The fair value of investment properties carried at cost amounted to €195.287 million (2012: €88.296 million). The fair values were determined based on valuations performed by Chartered Surveyors & Co. an accredited independent valuer, as at 31 December 2013 and 2012, respectively. Chartered Surveyors & Co. is an industry specialist in valuing these types of investment properties. The fair values of the properties have been determined on observable transactions in the market.
IPSAS 16.86 (a), (d), (e)

Notes to the consolidated financial statements
45 Model Public Sector Group
34. Trade and other payables from exchange transactions 2013 2012
€000 €000
Trade payables 2,599,475 2,170,658 Payments received in advance 800,480 785,846 Employee advances 9,746 6,489 Third-party payments 298,908 285,034 Other payables 90,885 108,151
Total trade and other payables 3,799,494 3,356,178
Trade payables are non-interest bearing and are normally settled on 60-day terms. Other payables are non-interest bearing and have an average term of six months. Interest payable is normally settled quarterly throughout the financial year. For explanations on the Group's credit risk management processes, refer to note 38.
35. Refundable deposits from customers
2013 2012 €000 €000 Consumer deposits 272,795 233,248
Other deposits 18,646 11,447
Total deposits 291,441 244,695
Guarantees held in lieu of electricity and water deposits were €38.60 million (2012: €29.26 million). Deposits are released when the owner/occupant of a property terminates the contract with the Group to supply water and electricity to the property, or when certain contractual services are delivered.
36. Current provisions
Environmental
rehabilitation Leave
benefits Performance
bonuses Total €000 €000 €000 €000
Balance at the beginning of the year 327,645 299,783 21,468 648,896 IPSAS 19.97 (a)
Additional provisions raised 236,187 38,908 55,068 330,163 IPSAS 19.97 (b)
Provision utilized (388,314) (28,762) (23,468) (440,544) IPSAS 19.97 (c)
Change in provision due to change in discount factor and time value of money (9,611) (7,489) 1,076 (16,024) IPSAS 19.97 (e)
Transferred from non-current provisions 219,392 - - 219,392
Balance as at 31 December 2013 385,299 302,440 54,144 741,883 IPSAS 19.97 (a)
Leave benefits
Annual leave accrues to employees on a monthly basis, subject to certain conditions and constraints. The provision is an estimate of the amount due to staff as at the financial year-end, based on the value of statutory and non-statutory leave. The provision was calculated based on the leave entitlement due to staff at year end adjusted for:
Experience adjustment in relation to the forfeiture of leave, leave encashment trends and leave taken trends The salary scales applicable at the time of leave encashment and realization of leave by employees Uncertainty is related to this provision is contained in the rate at which leave is realized either through taking the leave or by having leave paid out along with the timing of such realization
IPSAS 19.98 (a) (b)
Performance bonuses IPSAS 19.98 (a) (b)
Performance bonuses accrue to staff on an annual basis subject to the achievement of predetermined performance standards. The provision is an estimate of the amount due to staff in the service of the Group at the reporting date. At the reporting date, the performance assessment process was not yet complete and, as such, the provision is based on an extrapolation of the quarterly performance assessments taking performance trends and the availability of budget for bonuses into consideration.
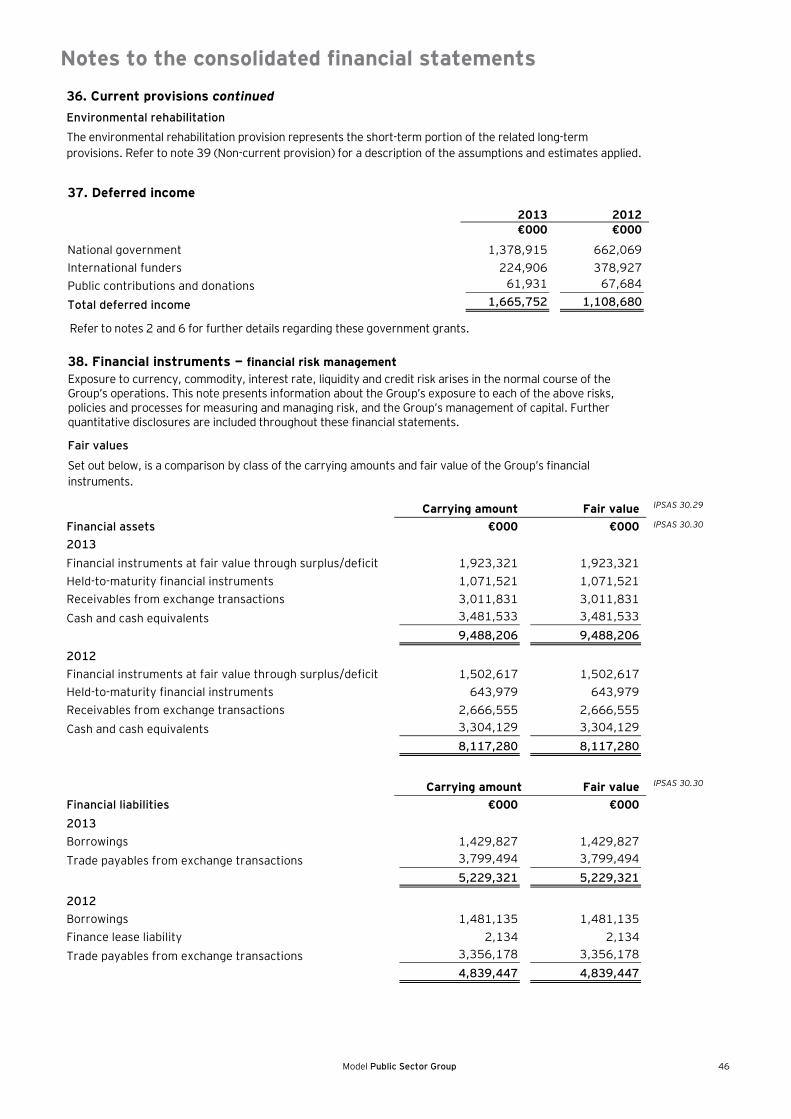
Notes to the consolidated financial statements
Model Public Sector Group 46
36. Current provisions continued
Environmental rehabilitation The environmental rehabilitation provision represents the short-term portion of the related long-term provisions. Refer to note 39 (Non-current provision) for a description of the assumptions and estimates applied.
Refer to notes 2 and 6 for further details regarding these government grants.
38. Financial instruments financial risk management Exposure to currency, commodity, interest rate, liquidity and credit risk arises in the normal course of the Group’s operations. This note presents information about the Group’s exposure to each of the above risks, policies and processes for measuring and managing risk, and the Group’s management of capital. Further quantitative disclosures are included throughout these financial statements.
Fair values Set out below, is a comparison by class of the carrying amounts and fair value of the Group’s financial instruments.
Carrying amount Fair value IPSAS 30.29
Financial assets €000 €000 IPSAS 30.30
2013
Financial instruments at fair value through surplus/deficit 1,923,321 1,923,321
Held-to-maturity financial instruments 1,071,521 1,071,521
Receivables from exchange transactions 3,011,831 3,011,831
Cash and cash equivalents 3,481,533 3,481,533
9,488,206 9,488,206
2012
Financial instruments at fair value through surplus/deficit 1,502,617 1,502,617
Held-to-maturity financial instruments 643,979 643,979
Receivables from exchange transactions 2,666,555 2,666,555
Cash and cash equivalents 3,304,129 3,304,129
8,117,280 8,117,280
Carrying amount Fair value IPSAS 30.30
Financial liabilities €000 €000
2013
Borrowings 1,429,827 1,429,827
Trade payables from exchange transactions 3,799,494 3,799,494
5,229,321 5,229,321
2012
Borrowings 1,481,135 1,481,135
Finance lease liability 2,134 2,134
Trade payables from exchange transactions 3,356,178 3,356,178
4,839,447 4,839,447
37. Deferred income 2013 2012
€000 €000 National government 1,378,915 662,069 International funders 224,906 378,927 Public contributions and donations 61,931 67,684
Total deferred income 1,665,752 1,108,680

Notes to the consolidated financial statements
47 Model Public Sector Group
38. Financial instruments financial risk management continued
The fair value of the financial assets and liabilities are included at the amount at which the instrument could be exchanged in a current transaction between willing parties, other than in a forced sale or liquidation.
IPSAS 30.31
The following methods and assumptions were used to estimate the fair values: IPSAS 30.31
Cash and short-term deposits, trade receivables, trade payables and other current liabilities approximate their carrying amounts largely due to the short-term maturities of these instruments
IPSAS 30.31
Long-term fixed-rate and variable-rate receivables / borrowings are evaluated by the Group based on parameters such as interest rates, specific country risk factors, individual creditworthiness of the customer and the risk characteristics of the financed project. Based on this evaluation, allowances are taken to account for the incurred losses of these receivables and market related interest rates. As at 31 December 2013 and 2012, respectively, the carrying amounts of such receivables, net of allowances, are not materially different from their calculated fair values
IPSAS 30.31
Fair value of quoted notes and bonds is based on price quotations at the reporting date. The fair value of unquoted instruments, loans from banks and other financial liabilities, obligations under finance leases, as well as other non-current financial liabilities is estimated by discounting future cash flows using rates currently available for debt on similar terms, credit risk and remaining maturities
IPSAS 30.31
Fair value of financial assets is derived from quoted market prices in active markets, if available IPSAS 30.31
Fair value of unquoted available-for-sale financial assets is estimated using appropriate valuation techniques
IPSAS 30.31
Fair value hierarchy
The Group uses the following hierarchy for determining and disclosing the fair value of financial instruments by valuation technique:
IPSAS 30.32
Level 1: Quoted (unadjusted) prices in active markets for identical assets or liabilities IPSAS 30.32(a)
Level 2: Inputs other than quoted prices included within Level 1 that are observable for the asset or liability, either directly (i.e., as price) or indirectly (i.e., derived from prices)
IPSAS 30.32(b)
Level 3: Techniques which use inputs that have a significant effect on the recorded fair value that are not based on observable market data
IPSAS 30.32(c)
As at 31 December 2013, the Group held the following financial instruments measured at fair value:
Assets measured at fair value 31 December
2013 Level 1 Level 2 Level 3 IPSAS 30.33
€000 €000 €000 €000
Investments 1,923,321 1,644,250 279,071 -
1,923,321 1,644,250 279,071 -
During the reporting period ending 31 December 2013, there were no transfers between level 1 and level 2 fair value measurements.
IPSAS 30.33(b)
As at 31 December 2012, the Group held the following financial instruments measured at fair value:
Assets measured at fair value
31 December 2012 Level 1 Level 2 Level 3
€000 €000 €000 €000
Investments 1,502,617 1,238,557 264,060 -
1,502,617 1,238,557 264,060 -
During the reporting period ending 31 December 2012, there were no transfers between level 1 and level 2 fair value measurements. IPSAS 30.33(b)

Notes to the consolidated financial statements
Model Public Sector Group 48
38. Financial instruments financial risk management continued
Credit risk Credit risk is the risk of financial loss to the Group if customers or counterparties to financial instruments fail to meet their contractual obligations, and it arises principally from the Group’s investments, loans, receivables, and cash and cash equivalents. The carrying amount of financial assets represents the maximum credit exposure. The maximum exposure to credit risk as at 31 December was:
2013 2012 €000 €000 Investments 1,071,521 643,979 Trade receivables and other receivables 3,011,831 2,666,555 Cash and cash equivalents 3,481,533 3,304,129
Maximum exposure to credit risk 7,564,885 6,614,663
Credit quality Credit quality is assessed risk of default attached to counterparties to which the Group extends credit and also those parties with whom the Group invests. As such, the credit quality assessed extends to the customers, investments and banks of the Group.
For financial statement purposes, the investments and balances with banks are limited to the investments, loans receivable and cash and cash equivalents line items in the statement of financial position. The Group determines credit quality of the investments and banks using information obtained from external rating agencies. In accordance with its financial risk management policy, the Group does not invest in instruments with a credit rating below BB and does not advance loans to counterparties with a credit rating below BB. Furthermore, the Group does not make deposits with banks with a credit rating below Aa3. Accordingly, the credit rating attached to the investments, loans receivable and cash and cash equivalents line items are, as follows:
2013 2012 Rating Rating
Investments Aa3 Aa2 Loans receivable BB BB Cash and cash equivalents AA- AA+
The customer base of the Group is diverse and consists of individuals, companies, non-profit organizations and government entities. Credit ratings, from external rating agencies, are not readily available for all customers. Also, it is not financially viable to obtain external credit ratings for all customers due to the nature of the customer base. Furthermore, the Group, as a local government authority, is mandated by the Constitution of Euroland to provide basic services to all its constituents irrespective of their financial standing. As such, the Group is required, by legislation, to extend services and extended payment terms to all customers irrespective of their financial standing. For the purpose of determining the credit quality of customers, the Group applies its past experience with customers in determining the risk of default posed by customers. In line with the methodology applied, customers are classified into the following credit quality groups:
High - Those customers who have no history of defaulting on payments to the Group and only includes customers who settle their accounts in full and within the prescribed minimum period.
Medium - Those customers with a history of late payments only. These customers usually arrange ahead of time with the Group in settling balances in arrears and when payments are made, the outstanding amounts (including interest) are settled in full.
Low - Those customers with a significant history of defaults. The balances of these customers are rarely settled in full. The recovery of outstanding balances from these customers is problematic.

Notes to the consolidated financial statements
49 Model Public Sector Group
38. Financial instruments financial risk management continued
The credit quality of the balance of receivables and other receivables is made up, as follows:
2013 2012 €000 €000
High 4,160,687 3,638,065 Medium 2,269,465 1,984,399 Low 1,134,733 992,199
Total instruments at amortized cost exposed to credit risk 7,564,885 6,614,663
Investments The Group limits its exposure to credit risk by investing with only reputable financial institutions that have a sound credit rating (rated BB and above), which are within the specific guidelines set in accordance with the Council’s approved investment policy. Consequently, the Group does not consider there to be any significant exposure to credit risk.
Receivables Receivables are amounts owed by consumers, and are presented net of impairment losses. The Group has a credit risk policy in place, and the exposure to credit risk is monitored on an ongoing basis. The Group is compelled, by its constitutional mandate, to provide all of its residents with basic minimum services, without recourse to an assessment of creditworthiness. There were no material changes in the exposure to credit risk and its objectives, policies and processes for managing and measuring the risk during the year under review. The Group’s strategy for managing its risk includes encouraging residents to install water management devices that control water flow to households, as well as prepaid electricity meters. In certain instances, a deposit is required for new service connections, serving as a guarantee.
The Group’s maximum exposure to credit risk is represented by the carrying value of each financial asset in the statement of financial performance. The Group has no significant concentration of credit risk, with exposure spread over a large number of consumers, and is not concentrated in any particular sector or geographic area. The Group establishes an allowance for impairment that represents its estimate of anticipated losses in respect of receivables.
The outstanding amounts of the 10 largest debtors represent 0.8% (2012: 1.2%) of the total outstanding balance. The average credit period on services rendered is 30 days from date of invoice. Interest is raised at the three-month government bond rate plus 1% on any unpaid accounts after the due date. The Group provided fully for all receivables outstanding over 365 days where there was no evidence of expected recovery. Receivables up to 365 days are provided for based on estimated irrecoverable amounts, determined by reference to past default experience.
Cash and cash equivalents The Group limits its exposure to credit risk by investing cash and cash equivalents with only reputable financial institutions that have a sound credit rating, and within specific guidelines set in accordance with Council’s approved investment policy. Consequently, the Group does not consider there to be any significant exposure to credit risk.
Liquidity risk Liquidity risk is the risk of the Group not being able to meet its obligations as they fall due. The Group’s approach to managing liquidity risk is to ensure that sufficient liquidity is available to meet its liabilities when due, without incurring unacceptable losses or risking damage to the Group’s reputation.
The Group ensures that it has sufficient cash on demand to meet expected operating expenses through the use of cash flow forecasts. On average, 94.93% (2012: 93.88%) of receivables are settled within 30 days after the due date, and payables are settled within 30 days of invoice.

Notes to the consolidated financial statements
Model Public Sector Group 50
38. Financial instruments financial risk management continued
The following are contractual liabilities of which interest is included in borrowings: On
demand > 3
months 3 – 12
months 1 – 5
years > 5years Total 2013 €000 €000 €000 €000 €000 €000
Liabilities
Borrowings - - 286,962 - 1,142,865 1,429,827
Payables 2,127,717 531,929 1,139,848 - - 3,799,494
Total liabilities 2,127,717 531,929 1,426,810 - 1,142,865 5,229,321
On demand
> 3 months
3 – 12 months
1 – 5 years > 5years Total
2012 €000 €000 €000 €000 €000 €000
Liabilities
Borrowings - - 126,354 - 1,354,781 1,481,135
Finance lease obligation - 534 1,600 - 2,134
Payables 1,678,089 1,006,853 671,236 - - 3,356,178
Total liabilities 1,678,089 1,007,387 799,190 - 1,354,781 4,839,447
Capital management The primary objective of managing the Group’s capital is to ensure that there is sufficient cash available to support the Group’s funding requirements, including capital expenditure, to ensure that the Group remains financially sound. The Group monitors capital using a gearing ratio, which is net debt, divided by total capital, plus net debt. In a capital-intensive industry, a gearing ratio of 54.5% or less can be considered reasonable. Included in net debt are interest-bearing loans and borrowings, payables, less investments.
Currency risk The Group is exposed to foreign-currency risk through the importation of goods and services, either directly or indirectly, through the award of contracts to local importers. The Group manages any material direct exposure to foreign-currency risk by entering into forward exchange contracts. The Group manages its indirect exposure by requiring the local importer to take out a forward exchange contract at the time of procurement, in order to predetermine the euro value of the contracted goods or services. The Group was not a direct party to any outstanding forward exchange contracts at the reporting date. The movement in the currency was not material to the Group’s procurement.
Market risk Market risk is the risk of changes in market prices, such as foreign-exchange rates and interest rates, affecting the Group’s income or the value of its financial instrument holdings. The objective of market risk management is to manage and control market risk exposures within acceptable parameters, while optimizing the return on the risk. The weighted average interest rates and maturity profile on financial instruments as at 31 December 2013 are as follows:
IPSAS 30.46 (a), (b)
Weighted average
interest rate 1 year or
less 1 – 5 years >5years Total Financial assets % €000 €000 €000 €000
Investments 6.70 2,883,350 111,492 - 2,994,842
Cash and cash equivalents 6.06 3,481,533 - - 3,481,533
Total financial assets 6,364,883 111,492 - 6,476,375
Financial liabilities
Borrowings 11.53 286,962 914,292 228,573 1,429,827
Total liabilities 286,962 914,292 228,573 1,429,827

Notes to the consolidated financial statements
51 Model Public Sector Group
38. Financial instruments continuedInterest rate sensitivity analysis Financial assets If the weighted average interest rate at 31 December 2013 had been 100 basis points higher or lower the interest income and interest expense would have been affected as follows:
Increase (+) / decrease (-) in
basis points
Effect on surplus/deficit
before tax IPSAS 30.41(a) IPSAS 30.47(a)
€000
2013
Financial assets
Investments +100 30,942
-100 (30,942)
Cash and cash equivalents +100 34,198
-100 (34,198)
Financial liabilities
Borrowings +100 (5,579)
-100 5,579
2012
Financial assets
Investments +100 26,574
-100 (26,574)
Cash and cash equivalents +100 29,371
-100 (29,371)
Financial liabilities
Borrowings +100 (5,761)
-100 5,761
39. Non-current provisions
Long service
leave Environmental rehabilitation Total
€000 €000 €000
Balance at the beginning of the year 313,527 1,844,029 2,157,556 IPSAS 19.97(a)
Additional provisions raised 26,905 335,350 362,255 IPSAS 19.97(b) Increase due to unwinding of time value for money 39,775 286,549 326,324 IPSAS 19.97(e)
Amounts used (40,927) (128,673) (169,600) IPSAS 19.97(c) Increase due to increase in input costs assumption 37,535 88758 126,293 IPSAS 19.97(e)
376,815 2,426,013 2,802,828
Less: current portion - (219,392) (219,392)
Non-current provisions 376,815 2,206,621 2,583,436 IPSAS 19:97 (a)
Various assumptions are applied in arriving at the carrying value of provisions that are recognized in terms of the requirements of IPSAS 19 Provisions, Contingent Liabilities and Contingent Assets.
Management further relies on input from the Group’s lawyers in assessing the probability on matters of a contingent nature. Contingent liabilities are disclosed in note 44. IPSAS 19.98(a)(b)

Notes to the consolidated financial statements
Model Public Sector Group 52
39. Non-current provisions continued
Long-service leave The vested leave benefit has been valued by CBR Ltd. The provision is utilized when eligible employees receive the value of the vested benefits. The valuation is performed every three years and the effective date of the last valuation is 31 December 2013.
The fund benefit liability as at 31 December 2013 has been discounted at the market yields on government bonds consistent with the estimated term of the liability. A discount rate of 7.5% (2012: 8.8%) per annum has been used.
Key financial assumptions: 2013 2012
% %
Discount rate 7.5 8.8
General inflation rate (CPI) 5.4 5.9
Salary increases 9.2 6.6
Environmental rehabilitation A provision for the estimated cost of rehabilitating waste sites is made based on the Group's licensing terms on the waste landfill sites. The provision has been determined on the basis of a recent independent study. The cost factors derived from the study by a firm of consulting engineers have been applied and projected at an annual inflation rate of 5.4% (2012: 5.9%) and a discount rate that reflects the risks specific to the liability of 11% (2012: 11%).
The payment dates of total closure and rehabilitation are uncertain, but are currently expected to be between 2020 and 2030.
40. Pensions and other post-employment benefit plans
The Group makes provision for post-retirement benefits to eligible councilors and employees. IPSAS 25.140
Post retirement medical aid IPSAS 25.141 (b)
For the past service of current and retired employees, the Group recognizes and provides for actuarially determined present value of post retirement medical aid employer contributions on an accrual basis, using the projected credit method. The actuarial valuation is performed bi-annually and the effective date of the most recent valuation is 31 December 2013.
The members of medical aid schemes entitled to a post retirement medical scheme subsidy as at 31 December 2013 constituted 12,641 (2012: 12,654) in-service members and 8 754 (2012: 8,729) retired members.
It was assumed that the employer's health care arrangements and subsidy policy would remain as outlined in the accounting policy, and that the level of benefits and contributions would remain unchanged, with the exception of inflationary adjustments. Implicit in this approach is the assumption that the current levels of cross-subsidization from in-service members to retiree members within the medical scheme are sustainable and will continue.
It is further assumed that the subsidy will continue until the last survivor’s death for eligible members and their spouses, and to age 21, if earlier, for dependent children.
Continuation of membership It is assumed that 100% of in-service members entitled to a post-retirement subsidy retiring from the Group will remain on the employer's health care arrangements.
Family profile Family profile was based on actual data and, therefore, no assumptions had to be made.
Plan assets Currently, no long-term assets are set aside off balance sheet in respect of the employer’s post-employment healthcare liability.
Discount rate The fund benefit liability to the Group as at 31 December 2013 has been discounted at a rate determined on the basis of the yield of 8% (2012: 8.7%) per annum on government bonds.

Notes to the consolidated financial statements
53 Model Public Sector Group
40. Pensions and other post-employment benefit plans continued Retirement pension benefits For past service of employees and retired employees, the Group recognizes and provides for the actuarially determined present value of post-retirement pensions on an accrual basis, using the projected unit credit method.
The number of employees who were eligible for a post retirement pension at 31 December 2013 was 35 (2012: 40) current employees and 120 (2012: 130) retired employees.
Plan assets Currently, no long-term assets are set aside off balance sheet in respect of the employer’s post-employment pension liability and the plan is currently treated as an unfunded plan. As such, no further information on plan assets is presented.
The fund benefit liability to the Group as at 31 December 2013 has been discounted at a rate determined on the basis of the yield of 8% (2012: 8.7%) per annum on government bonds.
The following tables summarize the components of net benefit expense recognized in surplus or deficit and the funded status and amounts recognized in the statement of financial position for the plan.
Net benefit expense 2013
Defined benefit plan
Post employment
medical benefits Total IPSAS 25.141 (g)
€000 €000 €000
Current service cost 651 59,194 59,845
Interest cost on benefit obligation 1,536 254,270 255,806
Actuarial gains recognized (2,265) (162,725) (164,990) Expense recognized in the statement of financial performance (78) 150,739 150,661
Net benefit expense 2012
Defined benefit plan
Post employment
medical benefits Total IPSAS 25.141 (g)
€000 €000 €000
Current service cost 50,846 4,280 55,126
Interest cost on benefit obligation 243,681 5,401 249,082
Actuarial losses recognized 302,782 2,360 305,142 Expense recognized in the statement of financial performance 597,309 12,041 609,350
Benefit liability as at 31 December 2013
Defined benefit plan
Post employment
medical benefits Total IPSAS 25.141 (f)
€000 €000 €000 Current benefit obligation 290,219 5,923 296,142 Non-current benefit obligation 5,089,132 103,860 5,192,992 Total employee benefit liability 5,379,351 109,783 5,489,134

Notes to the consolidated financial statements
Model Public Sector Group 54
40. Pensions and other post-employment benefit plans continued Benefit liability as at 31 December 2012
Defined
benefit plan
Post employment
medical benefits Total IPSAS 25.141 (f)
€000 €000 €000
Current benefit obligation 300,758 6,138 306,896
Non-current benefit obligation 5,254,170 107,228 5,361,398
Total employee benefit liability 5,554,928 113,366 5,668,294
Changes in the present value of the defined benefit obligation are:
Defined
benefit plan
Post employment
medical benefits Total IPSAS 25.141 (f)
€000 €000 €000
Defined benefit obligation at 1 January 2012 5,272,189 111,932 5,384,121
Interest cost 243,681 5,401 249,082
Current service cost 50,846 4,280 55,126
Contributions paid (314,570) (10,607) (325,177)
Actuarial losses on obligation 302,782 2,360 305,142
Defined benefit obligation at 31 December 2012 5,554,928 113,366 5,668,294
Interest cost 254,270 1,536 255,806
Current service cost 59,194 651 59,845
Contributions paid (326,316) (3,505) (329,821)
Actuarial gains on obligation (162,725) (2,265) (164,990) Defined benefit obligation at 31 December 2013 5,379,351 109,783 5,489,134
Contributions of €329.821 million (2012: €325.177 million) are recognized in surplus and deficit in each year respectively. IPSAS 25.141
(q)
The principal assumptions used in determining pension and post-employment medical benefit obligations for the Group’s plans are shown below: IPSAS 25.141
(n)
2013 2012
% %
Discount rate 8.0 8.7
General inflation 5.4 5.9
General salary inflation rate 9.2 6.6
Health care cost inflation rate 7.2 7.4
Net effective discount rate 0.8 1.2
A one percentage point change in the assumed rate of increase in healthcare inflation would have the following effects: IPSAS 25.141
(o)
Increase Decrease
2013 €000 €000 Effect on the current service cost 17,428 14,000 Effect on the current interest cost 42,205 34,268 Effect on the defined benefit obligation 593,796 481,118 2012 Effect on the current service cost 11,190 8,989 Effect on the current interest cost 40,447 32,841 Effect on the defined benefit obligation 496,639 402,397

Notes to the consolidated financial statements
55 Model Public Sector Group
40. Pensions and other post-employment benefit plans continued
A one percentage point change in the assumed discount rate would have the following effects: IPSAS 1.140 IPSAS 1.141 (b)
Increase Decrease €000 €000
2013 Effect on the current service cost 11,092 7,664
Effect on the current interest cost 20,953 13,926
Effect on the defined benefit obligation 94,256 195,803
2012 Effect on the current service cost 11,190 4,921
Effect on the current interest cost 20,953 13,346
Effect on the defined benefit obligation 78,833 163,766
Amounts for the current and previous four periods are, as follows IPSAS 25.141(p)
Post employment medical benefits
2009 2010 2011 2012 2013
€000 €000 €000 €000 €000
Defined benefit obligation 13,614 13,008 15,215 17,797 17,004 Experience adjustments on plan liabilities - - - - -
Defined benefit plan
2009 2010 2011 2012 2013 €000 €000 €000 €000 €000 Defined benefit obligation 1,752,666 2,095,539 2,500,154 2,982,893 3,566,435 Experience adjustments on plan liabilities - - - - -
41. Finance lease obligation Amounts payable under finance leases 2012
Minimum lease payments
Future finance charges
Present value of minimum
lease payments €000 €000 €000
Within one year (current portion) 5,132 (2,998) 2,134
The average lease term was five years and the average effective borrowing rate was 5.64%. Interest rates were variable. No arrangements have been entered into containing contingent rent. Leased assets (see note 31) have been pledged as security for the finance lease obligation. There are no outstanding finance lease liabilities as at 31 December 2013.
42. Borrowings
2013 2012 €000 €000
Government bonds issued 995,000 995,000 Bank loans 434,827 486,135
1,429,827 1,481,135 Less: total current portion of bank loans (286,962) (126,354)
Total non-current borrowings 1,142,865 1,354,781

Notes to the consolidated financial statements
Model Public Sector Group 56
42. Borrowings continued Government bonds issued
IPSAS 30.10 The Group issued €995 million government bonds to the open market. These bonds are unsecured and have the following terms and conditions:
Subscription price of €10 per bond The bonds matures in 2020 Coupon rate for the bonds is 10% per annum Interest is compounded monthly and paid quarterly to bond holders At the reporting date, the accrued interest was settled
The Group has not breached or defaulted on the bonds in issue.
Bank loans IPSAS 30.22
The Group has a 5-year bank loan due 2017, which is repayable quarterly and has an initial interest rate of 7.6% per annum.
The loan is unsecured and carries a penalty clause which stipulates that, in the event of default of a quarterly payment, the entity will be required to make a penalty payment. During the last quarter of 2012, the entity failed to make timely payment on the bank loan. As at the 2012 reporting date, the entity finalized negotiations with the bank to settle the quarterly payment within one month after the reporting date. As a result of the negotiations an additional penalty payment accrued to the entity that was capitalized in the current portion of the loan. The penalty amounted to €86.79 million.
As a further consequence of the default, the interest rate was increased to 23.6% per annum. This increase in the interest rate has led to an increase in the amount of interest capitalized on the loan.
43. Related party disclosures IPSAS 20.25 .26
These financial statements include the financial statements of the Group and the controlled entities listed in the following table:
IPSAS 20.25 .26
% equity interest
Name Country of incorporation 2013 2012
Conferencing company Euroland 53% 53% Projects company Euroland 100% 100% Infrastructure company Euroland 100% 100%
Key management’s interest: Senior Executive, F. Friedman has a 25% interest in Full Flavor Caterers Limited. Total transactions with the company amounted to €1.500 million (2012: €1.300 million) and were included in general expenses in note 20. Included in the payables balance is €300,000 (2012: €215,000) related to amounts payable to the related party.
Terms and conditions of transactions with related parties The sales to and purchases from related parties are made at terms equivalent to those that prevail in arm’s length transactions. Outstanding balances at the year-end are unsecured, interest free and settlement occurs in cash. There have been no guarantees provided or received for any related party receivables or payables. For the year ended 31 December 2013, the Group has not recorded any impairment of receivables relating to amounts owed by related parties (2012: €Nil). This assessment is undertaken each financial year through examining the financial position of the related party and the market in which the related party operates.
Key management personnel The key management personnel, as defined by IPSAS 20 Related Party Disclosures, are the members of Council, who together constitute the governing body of the Group. The total remuneration of members of Council and the number of individuals, on a full-time equivalent basis, receiving remuneration from the Group are:
Total remuneration €97.920 million IPSAS 20.34(a)
Number of persons 132 persons

Notes to the consolidated financial statements
57 Model Public Sector Group
43. Related party disclosures continued
Remuneration of key management personnel
2013
Annual salary Bonus Allowances* Contributions** Total
€000 €000 €000 €000 €000
City manager 1,532 138 2 242 1,914
Deputy city manager (appointed 1/06/2013) 789 138 - 108 1,035
Head of community services 1,140 112 84 172 1,508
Head of corporate services 1,155 184 107 93 1,539
Head of economic, environmental and spatial planning 1,145 58 37 98 1,338
Head of finance 1,123 124 211 185 1,643
Head of health 912 177 133 183 1,405
Head of integrated human settlement services 1,392 110 - 174 1,676
Head of safety and security 1,090 104 95 158 1,447
Head of social development and early childhood development (1/01/2013 to 31/12/2013) 682 - - 1 683
Head of tourism, events and marketing (appointed 1/07/2013) 610 - - 1 611
Head of transport, roads and stormwater 1,313 - 75 100 1,488
Head of utility services 1,134 52 47 176 1,409
Head of conferencing company 1,322 179 - - 1,501
Total 15,339 1,376 791 1691 19,197
2012 Annual salary Bonus Allowances* Contributions** Total€000 €000 €000 €000 €000
City manager 1,334 375 14 217 1,940Head of community services 1,024 305 84 150 1,563Head of corporate services 1,069 298 71 159 1,597Head of economic, environmental and spatial planning 930 235 87 155 1,407Head of finance 957 305 117 171 1,550Head of health 851 282 133 163 1,429Head of integrated human settlement services 1,051 298 8 160 1,517Head of safety and security 931 149 95 138 1,313Head of strategy and planning (until 31/04/2012) 489 248 16 50 803Head of transport, roads and stormwater 1,197 339 3 189 1,728Head of utility services 1,164 264 47 159 1,634Head of conferencing company 1,167 120 7 20 1,314
Total 12,164 3218 682 1731 17,795 *Allowances include travel, vehicle, accommodation, subsistence and other allowances ** Contributions include contributions to unemployment insurance fund (UIF), medical and pension funds

Notes to the consolidated financial statements
Model Public Sector Group 58
43. Related party disclosures continued
Commentary IPSAS 20 describes key management personnel (KMP) as all directors or members of the governing body of the entity and other persons having the authority and responsibility for planning, directing, and controlling the activities of the reporting entity (see IPSAS 20.4 for details). The remuneration of KMP is often established by statute or some other formal independent tribunal or process. However, the responsibilities of their office may enable them to influence the benefits that flow to them or their related parties. Consequently, IPSAS 20 requires specific disclosure to be made in aggregate about:
The remuneration of KMP and close family members of KMP during the reporting period
Loans made to them
The consideration provided to them for services they provide to the entity other than as a member of the governing body or an employee
Due to the nature of related party transactions, they may be considered qualitatively material despite the amount or size of the transaction.
It should be noted that there are likely to be additional jurisdiction-specific rules around related party disclosures and, in particular, around KMP. For instance, although IPSAS 20 requires disclosure of aggregate information in respect of the remuneration of KMP, for the purposes of these illustrative financial statements, the Group has provided additional detail such as the names and designations of the KMP. This level of detail may, however, not be appropriate or necessary in all jurisdictions.
44. Commitments and contingencies 44.1 Capital commitments IPSAS 17.89(c)
2013 2012 Authorized but not yet contracted: €000 €000 Infrastructure 256,987 135,853 Approved and contracted: Infrastructure 1,418,983 1,203,958 Community 21,302 166,267 Other 587,050 8,990 Total capital commitments 2,284,777 1,515,068
44.2 Operating lease rentals
The Group as lessee IPSAS 13.44 Future minimum lease payments under non-cancellable operating leases: 2013 2012 €000 €000 Land and buildings Due within one year 25,785 45,031 Due within two to five years 42,657 12,024 Later than five years - - 68,442 57,055 Vehicles and other equipment Due within one year 56 116 Due within two to five years - 254 Later than five years - 69 56 439 Total operating lease expense commitments 68,498 57,494
Minimum lease payments recognized as an expense during the period amount to €45 million (2012: €63 million). Leased premises are contracted for the remaining periods of between one and four years, with renewal options available in certain instances.

Notes to the consolidated financial statements
59 Model Public Sector Group
44. Commitments and contingencies continued 44.2 Operating lease rentals continued The Group as lessor
Future minimum lease income under non-cancellable operating leases: 2013 2012
Buildings €000 €000 Due within one year 17,204 17,833 IPSAS 13.69 (a) (i) Due within two to five years 62,138 59,327 IPSAS 13.69 (a) (ii)
Later than five years 241,871 249,486 IPSAS 13.69 (a) (iii)
Total 321,213 326,646
The Group lets properties under operating leases. Property rental income earned during the year was €20 million (2012: €26 million). The properties are maintained by the tenants at no cost to the Group. No investment properties have been disposed of since 31 December 2013.
The impact of charging the escalations in operating leases on a straight-line basis over the term of the lease has been an increase of €1 million in current year income. IPSAS 13.44 (d)
44.3 Contingencies
At year end, the Group had the following contingent liabilities:
2013 2012 €000 €000
IPSAS 19.100(a) National union of workers 2,894,329 2,894,329
A claim amounting to €900,000 on behalf of ex-employees for labor disputes was instituted against the Group. IPSAS 19.100(b)
The arbitrator has pronounced on the matter, but the Group has instituted review proceedings. The legal representatives assessed the probability of the claim being awarded as high but not definitive. Therefore, the full amount is included as a contingency.
45. Cash generated from operations
2013 2012 IPSAS 2.56
€000 €000
Surplus for the year before tax 2,521,841 1,832,538
Adjusted for: Depreciation 1,394,834 1,283,682 Non-cash grants received (95,963) (208,493) Contributed assets (76,435) - Impairment 27,392 25,958 Gains and losses on disposal of assets (42,397) (16,909) Contribution to provisions 815,325 498,789 Contribution to impairment allowance 352,544 523,050 Finance income (569,982) (530,589) Finance cost 683,166 719,170
Working capital adjustments:
Increase in inventory (17,751) (37,076) Increase in receivables (735,555) (724,761) Increase in deferred income 557,072 60,240 Increase in payables 443,316 271,703 Increase in payments received in advance 388 6,207
Net cash flows from operating activities 5,257,795 3,703,508

Notes to the consolidated financial statements
Model Public Sector Group 60
46. Service concession arrangement During the current reporting period, the Group entered into a service concession arrangement with a private company to provide public bus transportation services to the inner-city district in an effort to reduce congestion and boost economic development in the area. The first phase was launched during the current year. The private company service provider is required to supply the infrastructure for the bus routes, which will be constructed over a period of three years and brought into service in phases.
The Group provides the private company with the exclusive rights to operate the service for 25 years, with no option of renewal, and the pricing of fares is subject to regulation by the Group. The service provider will earn revenue from the fares collected. Upon expiry of the arrangement, the Group will retain the infrastructure assets and the service provider will retain the vehicles. The following service concession assets and liabilities have been recognized as at the reporting date:
IPSAS 32.31-32
2013 2012
€000 €000 Fair value of service concession assets recognized in property, plant and equipment – infrastructure (see note 31) 359,900 - IPSAS 32.32
Accumulated depreciation to-date (12,000) -
Net carrying amount 347,900 - IPSAS 32.32
Service concession liability - opening 359,900 - IPSAS 32.15 IPSAS 32.32 Service concession revenue recognized (10,000) -
Service concession liability - closing 349,900 -
Commentary IPSAS 32 requires consideration of all aspects of the service concession arrangement when determining the appropriate disclosures to be provided in the notes. Since each service concession arrangement is likely to have unique characteristics, IPSAS 32 implies a degree of judgment to ensure that the appropriate information is included. IPSAS 32.32 includes a list of broad disclosure items that are required. For the purposes of these illustrative financial statements, the Group only entered into the service concession arrangement during the current reporting period. In subsequent periods, comparative information will be required.
47. Segment information IPSAS 18.12-15 For management purposes, the Group is broadly organized into business units based on the nature of the services they provide. The Group has four primary reportable segments:
The emergency services segment, which consists of all emergency services such as medical and ambulance services, traffic police, and fire. The electricity services segment, which covers all aspects of the supply chain for the provision of electricity to businesses and households. The water services segment, which covers all aspects of the provision of clean drinking water to businesses and households, and sanitation and sewage. The other segment, which consists of less significant services and the remainder of the Group’s business units, including waste removal.
No individually material operating segments have been aggregated to form the above reportable operating segments. The Group does not monitor segments geographically.
Management monitors the operating results of its business units separately for the purpose of making decisions about resource allocation and performance assessment. Segment performance is evaluated based on non-financial metrics and the segment’s operating surplus or deficit, measured consistently with the accounting policies applied in the consolidated financial statements. However, the Group's financing (including finance costs and finance income) and revenue from taxes are managed on a group basis and are not allocated to operating segments.
Inter-business unit services are not valued and are deemed to have been supplied for no consideration, and are therefore not eliminated. However, the quality of services provided internally is monitored as part of the non-financial service performance information.

Notes to the consolidated financial statements
61 Model Public Sector Group
47. Segment information continued Commentary IPSAS 18.65 encourages entities to provide certain minimum information about secondary segments. For example, if an entity determines its primary segments based on service type, but also reports internally on geographical segments, then it is encouraged to provide additional information about the geographical segments, consisting of segment expense, total carrying amount of segment assets, and total capital outlay during the period. For the purposes of these illustrative financial statements, the Group does not report internally to its governing body on the basis of geographical segments. Therefore, no further disclosure has been provided in this regard.
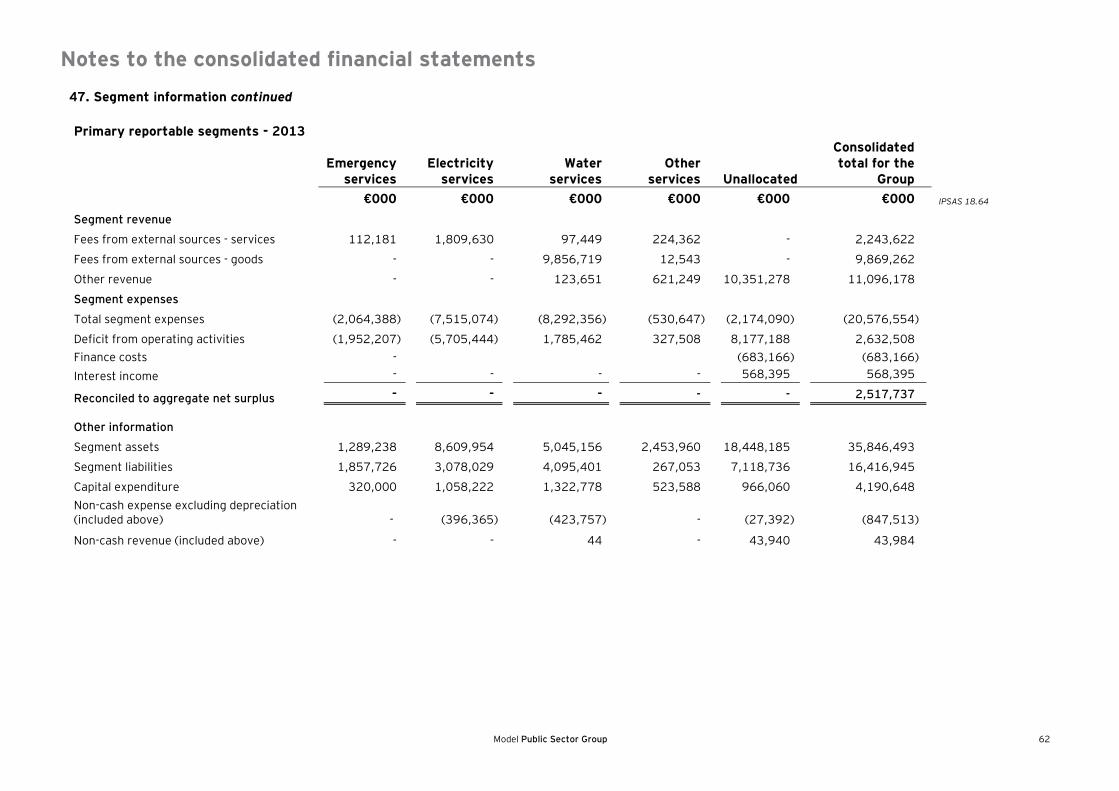
Notes to the consolidated financial statements
Model Public Sector Group 62
47. Segment information continued
Primary reportable segments - 2013
Emergency
services Electricity
services Water
services Other
services Unallocated
Consolidated total for the
Group
€000 €000 €000 €000 €000 €000 IPSAS 18.64
Segment revenue
Fees from external sources - services 112,181 1,809,630 97,449 224,362 - 2,243,622 Fees from external sources - goods - - 9,856,719 12,543 - 9,869,262 Other revenue - - 123,651 621,249 10,351,278 11,096,178 Segment expenses Total segment expenses (2,064,388) (7,515,074) (8,292,356) (530,647) (2,174,090) (20,576,554) Deficit from operating activities (1,952,207) (5,705,444) 1,785,462 327,508 8,177,188 2,632,508 Finance costs -
- - - (683,166) (683,166)
Interest income - 568,395 568,395
Reconciled to aggregate net surplus - - - - - 2,517,737 Other information
Segment assets 1,289,238 8,609,954 5,045,156 2,453,960 18,448,185 35,846,493 Segment liabilities 1,857,726 3,078,029 4,095,401 267,053 7,118,736 16,416,945 Capital expenditure 320,000 1,058,222 1,322,778 523,588 966,060 4,190,648 Non-cash expense excluding depreciation (included above)
- (396,365) (423,757) - (27,392) (847,513)
Non-cash revenue (included above) - - 44 - 43,940 43,984

Notes to the consolidated financial statements
63 Good Public Sector Group
47. Segment information continued
Primary reportable segments - 2012
Emergency
services Electricity
services Water
services Other
services Unallocated Consolidated
total for group
€000 €000 €000 €000 €000 €000 IPSAS 18.64
Segment revenue
Fees from external sources - services 101,858 1,716,724 14,866 203,716 - 2,037,164
Fees from external sources - goods - - 8,443,846 12,543 - 8,456,389
Other revenue - - 115,991 504,222 8,955,633 9,575,846 Segment expenses Total segment expenses (1,846,316) (6,519,095) (7,212,535) (477,014) (1,992,877) (18,047,837) Deficit from operating activities (1,744,457) (4,802,372) 1,362,168 243,468 6,962,756 2,021,562 Finance costs -
- - - (719,170) (719,170)
Interest income - 523,691 523,691
Reconciled to aggregate net surplus - - - - - 1,826,083
Other information
Segment assets 1,150,565 7,665,750 4,503,116 2,190,155 16,136,042 31,645,628 Segment liabilities 1,804,894 2,952,037 3,945,407 275,742 5,755,737 14,733,817 Capital expenditure 240,087 733,152 916,441 323,099 672,245 2,885,024 Non-cash expense excluding depreciation (included above) - (372,355) (399,747) - (27,392) (799,494)
Non-cash revenue (included above) - - 32 - 23,775 23,807
48. Events after the reporting period There are no material non-adjusting events after the reporting date.


EY is a global leader in assurance, tax, transaction and advisory services. The insights and quality services we
ED None
a high recycled content.
purposes only and is not intended to be relied upon as