model quality evaluation of coupled rc frame-wall …
TRANSCRIPT
19th International Conference on the Application of ComputerScience and Mathematics in Architecture and Civil Engineering
K. Gurlebeck, T. Lahmer and F. Werner (eds.)Weimar, Germany, 04–06 July 2012
MODEL QUALITY EVALUATION OF COUPLED RC FRAME-WALLSYSTEMS FOR GLOBAL DAMAGE ASSESSMENT
S. Marzban∗, J. Schwarz∗∗
∗ Bauhaus-Universitat WeimarGraduiertenkolleg 1462 ’Modellqualitaten’,Berkaer Straße 9, 99423 Weimar, GermanyE-mail: [email protected]
∗∗ Zentrum fur die Ingenieuranalyse von Erdbebenschaden - ErdbebenzentrumMarienstraße 13B, 99421 Weimar, Germany
Email: [email protected]
Keywords: Model quality, Coupled frame-wall systems, global/partial models
Abstract. Civil engineers take advantage of models to design reliable structures. In order tofulfill the design goal with a certain amount of confidence, the utilized models should be ableto predict the probable structural behavior under the expected loading schemes. Therefore,a major challenge is to find models which provide less uncertain and more robust responses.The problem gets even twofold when the model to be studied is a global model comprised ofdifferent interacting partial models. This study aims at model quality evaluation of globalmodels with a focus on frame-wall systems as the case study. The paper, presents the resultsof the first step taken toward accomplishing this goal. To start the model quality evaluation ofthe global frame-wall system, the main element (i.e. the wall) was studied through nonlinearstatic and dynamic analysis using two different modeling approaches. The two selected modelsincluded the fiber section model and the Multiple-Vertical-Line-Element-Model (MVLEM). Theinfluence of the wall aspect ratio (H/L) and the axial load on the response of the models wasstudied. The results from nonlinear static and dynamic analysis of both models are presentedand compared. The models resulted in quite different responses in the range of low aspect ratiowalls under large axial loads due to different contribution of the shear deformations to the topdisplacement. In the studied cases, the results implied that careful attention should be paidto the model quality evaluation of the wall models specifically when they are supposed to becoupled to other partial models such as a moment frame or a soil-footing substructure whichtheir response is sensitive to shear deformations. In this case, even a high quality wall modelwould not result in a high quality coupled system since it fails to interact properly with the restof the system.
1

1 INTRODUCTION
In the field of civil engineering the goal is to design structures that, with a certain amountof confidence, will be able to fulfill their purpose of construction i.e. withstand loading anddeformation schemes the structure is expected to undergo during its lifetime. In other words acivil engineer aims at designing reliable structures by examining the probable response of thestructure under expected loading conditions. Such terms are normally observed in the civil en-gineering technical literature due to the facts that the human knowledge about the nature of thephenomena underlying the structural behavior is limited and that many phenomena even haverandomness as their inherent characteristic. Consequently, any model which is an abstraction ofthe phenomena to be studied, also faces deficiencies in terms of knowledge i.e. uncertainties.Finding models that can be employed as tools to further design reliable structures has thereforeturned into a challenge. As a solution, model quality criteria are defined which allow for mak-ing decisions over a range of plausible models. Since most of the engineering models, whenpossible, are discretized into smaller distinct but coupled parts (so called partial models) to easetheir study, the model quality evaluation originally starts from the partial models and their cou-pling. The ongoing study, conducted by the first author, aims at evaluating the global modelquality of coupled partial models for damage assessment purposes considering the quality ofthe partial models and their coupling. To find a general solution coupled reinforced concrete(RC) frame-wall systems are studied as an example of widely used coupled structural systems.In the present study, the model quality evaluation process is started by investigating the wallmodels since the wall element is the crucial partial model in the coupled system. Based on a lit-erature survey, two of the well known modeling approaches, namely the fiber section model andthe Multiple-Vertical-Line-Element-Model (MVLEM) were chosen for further studies. To takethe first step, the model responses under cyclic deformation-controlled loading are comparedto a selected observed response. To further investigate the differences, the models responsesare then compared through static and dynamic analysis. Finally, the results are discussed andconclusions are derived.
2 MODEL QUALITY EVALUATION OF COUPLED SYSTEMS
The main challenge in the model quality evaluation process is to prove the model to be anappropriate representative of the real structural system for its intended purpose of use. The dif-ficulty gets even twofold in the absence of adequate observed data from real and experimentalsystems to validate the global model. For the specific case of a frame-wall system, for instance,almost negligible amount of experimental data is available for the coupled system (particularlyin interaction with the soil-footing substructure). Although, an extensive number of experi-ments can be found in the literature individually focused on wall or frame elements. So, one ofthe primary challenges in the field of frame-wall systems, is to validate the global model whenthere is only a chance to validate its partial models against experimental data. In fact RC struc-tural walls have gained considerable attention in the construction/rehabilitation of new/existingbuildings in regions with medium to high seismic hazard. This is mainly because: they pro-vide structures with lateral stiffness, strength and ductility if properly designed/constructed andthey have shown reasonable performance during the past earthquakes. In the most commonbuilding configuration, the RC walls are combined with a gravity resisting system (usually RCmoment frames or slabs) to form an integrated lateral/vertical load-carrying system. In suchframe-wall structures the most lateral resisting of the system is supplied by the walls. There-fore, their modeling and design becomes a critical issue, since the structural performance under
2
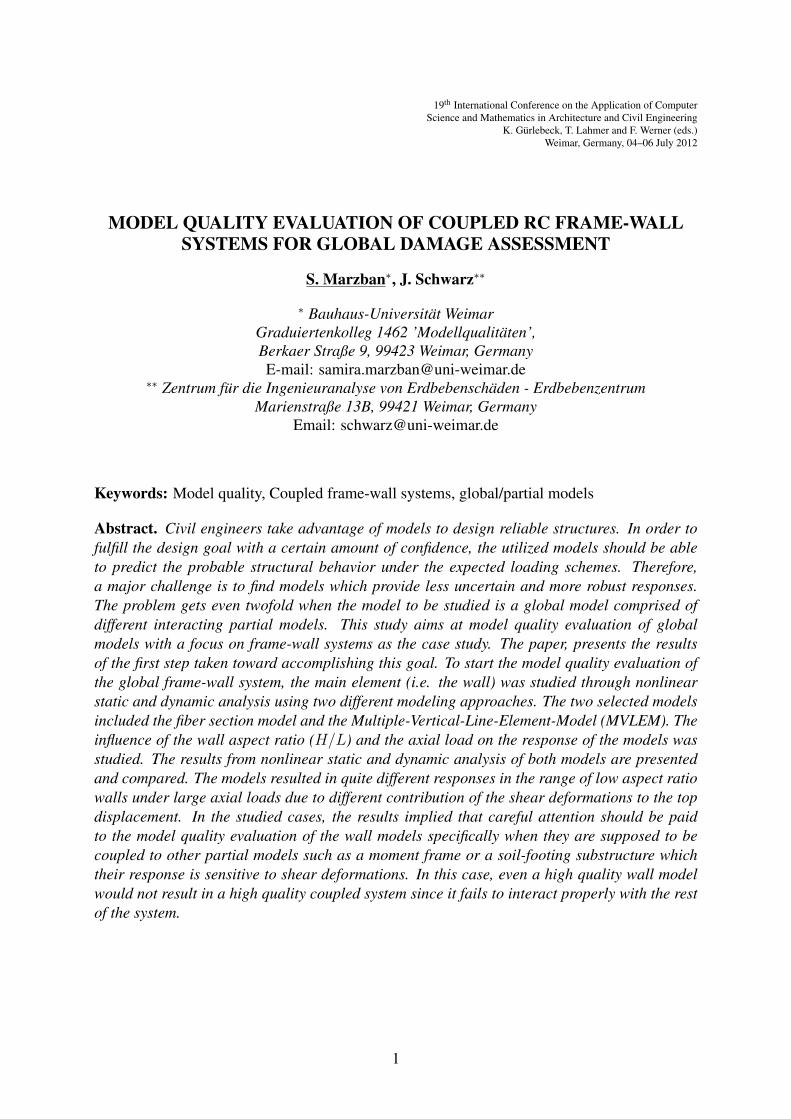
Damage is concentrated in the wall. System undergoes small displacements.
Damage is extended to the frame. System undergoes large displacements.
Fixed-base structure Flexible-base structure
Figure 1: Structural response of a coupled frame-wall system in the presence/absence of the couplings (Originallyfrom [1])
seismic actions relies mainly on their performance. Nevertheless, it has been learned from thepast earthquakes that the wall performance can be significantly affected by the interactions withother substructures (see Figure 1).
So far, it is quite well understood that neglecting the coupling effects may lead to a misesti-mation of the structural response/damage. In spite of being aware of this, however, it has been acommon practice to ignore the interaction among the substructures in frame-wall systems. Theabsence of adequate observed data for the global model to be validated on one hand and thecomplexity of the available models which does not allow for parametric studies on the globalmodel on the other hand may be the main reasons. For instance, many researchers have focusedon the study of RC walls ([28, 11, 13, 19, 5, 12, 6, 18, 15, 24] among the others) whereas quitea few have investigated the coupled frame-wall systems particularly in interaction with the soil-foundation substructure ([23, 3, 16, 27, 21, 26, 4] among the others). Evidently, there is still acrucial need to quantitatively measure the importance of coupling effects by means of tools likethe sensitivity analysis. Based on the results from a sensitivity analysis one can decide whetheror not the global model under study can be reduced to its partial models by disregarding someuninfluential parameters/aspects/interactions.
3 MODELING APPROACHES
The global model of the system to be studied is constructed by means of coupling differentpartial models. The choice of a specific modeling approach not only depends on the capabilitiesof the resulting partial model in representing a part of the whole system, but also on its capacityto interact properly with the rest of the system. In other words, when dealing with globalmodels, the high quality of a partial model does not necessarily signify that its applicationwill lead to a high quality of the global model. In fact, in cases where the desired degree ofcoupling to the other partial models can not be reached, the overall quality may even decrease.Finally, one also has to consider the amount of computational time and effort to be suppliedwhen selecting a model out of a number of plausible models.
In the superstructure of a RC frame-wall system at least two partial models can be distin-guished, namely: the wall and the frame. According to the technical literature, the numericalmodeling of RC frame elements has been well developed ([7, 17, 25, 8] among the others). Dis-tributed and lumped plasticity elements are widely being used to analyze and design RC frames.Distributed plasticity models are mainly based on the fiber section concept which allows for theinteraction between flexural and axial behaviors. Models based on this concept provide pow-
3

erful tools for the analysis of RC frame elements in which the shear deformations are roughlyignorable. The main challenge, however, is to find an appropriate model for the wall element.
Numerous micro/macro models have also been proposed for structural walls ([10] reviewsa selected number of the available models). According to the technical literature, the mostefficient models, in terms of the capabilities and accuracy on one hand and the required compu-tational time and cost on the other hand, are based on the fiber section concept. This modelingmethod is considered as a micro-modeling approach and thus is able to predict both local andglobal damages in the wall. The main drawback is that since fibers only undergo axial defor-mations the model fails to detect shear deformations. This may result in unrealistic predictionsof the wall response in the case of squat walls (i.e. aspect ratios less than 2.0, as a practicalcriteria). Not to mention that the model also fails to consider some observed phenomena likeneutral axis shift. To further develop the method macro models have been proposed which notonly benefit from the fiber section concept but also from some additional features that cover theshortcomings of the fiber section method. “Multiple Vertical Line Element Model (MVLEM)”is one of the well known solutions. Fibers are individually defined as ’vertical line elements’over the section and a shear spring is added to allow for deformations under shear actions.Although in this case, no interaction between the flexural and shear behaviors is consideredwhich seems to be inconsistent with experimental observations according to [19]. Nevertheless,the MVLEM constructed through the above-mentioned procedure provides a powerful tool topredict RC wall behavior under lateral loadings.
The basic concept for creating the MVLEM is to separate the flexural and shear behaviorsof the wall element (see Figure 2). Here the two modes of deformation are assumed to beuncoupled. The flexural and axial behaviors of the wall (and their corresponding interaction)are represented by the contribution of fibers whereas the shear spring constitutes the behaviorunder shear actions. Relative rotation of the upper bound of the wall to its base is defined byconsidering a center of rotation. The point is located on the central column of the element at aspecific height ch where h is the height of the wall (see Figure 3). c is practically set to be 0.4for common applications [28]. It is however recommended to include more elements along theheight of the wall where significant nonlinear behavior is expected. This is to avoid curvaturemisestimations in the regions where it is highly variable [8]. Although, the total number ofdivisions along the height or the length of the wall does not have a significant effect on theoverall behavior of the wall. Nevertheless, by adding more elements it is more likely that onecan detect the desired local behavior/damage [15, 20].
Flexure ShearDeformation
Figure 2: Schematic deformation decoupling of a RC wall element in MVLEM [19]
4

MOMENT
ch
(1-c)hΦ = φh
CURVATURE
φ
Δ = Φ(1-c)h
Φ
Figure 3: Center of rotation in MVLEM [19]
Quite well known material models are available for concrete (e.g. Kent-Scott-Park modelwith tensile strength) and steel (e.g. Menegotto-Pinto model) to define the vertical line ele-ments’ sectional force-deformation relationships under axial actions. There are also a handfulof choices for the hysteretic behavior to be assigned to the shear spring i.e. the sectional force-deformation relationship under shear actions ([16, 9, 19, 29, 15]). Here, the major concern is torepresent the low hysteretic energy absorbtion capability in shear. Mostly, this is done by meansof origin-oriented or pinching hysteretic materials. In this study a pinching hysteretic materialwith a trilinear backbone curve was used. Its behavior under cyclic loading is determined bymeans of some predefined rules. The cracking and yield properties of the backbone curve werecalculated according to [16, 22]. The aforementioned hysteretic material allows for pinching offorce and deformation, damage due to ductility and energy, and degraded unloading stiffnessbased on ductility. More details about hysteretic materials can be found in [14].
To study the MVLEM the results from static monotonic and cyclic as well as dynamic anal-ysis of the model were compared to the corresponding results of a fiber section model. Bothmodels were created and analyzed using the OpenSees platform. The fiber section model con-sisted of a single column defined with nonlinearBeamColumn element to which a fiber sectionwas assigned. Concrete02 (Kent-Scott-Park model with linear tension softening) and Steel02(Giuffre-Menegotto-Pinto model) were chosen to represent the constitutive material relation-ships of the concrete and the reinforcing steel, respectively. In order to consider the deforma-tions due to shear, the force-deformation relationship of the section under shear actions wasseparately calculated as discussed before and was added to the previously defined fiber section.To create the MVLEM, two MVLEM sets were stacked along the height of the wall each hav-ing half the height of the wall. Each of the MVLEM sets consisted of 11 truss elements towhich fiber sections with the same material properties as those of the fiber section model wereassigned. The truss elements were connected by means of rigid beams at their end nodes. Thecentral columns were divided into two rigid parts at 40% of their heights. Horizontal (shear) andvertical springs were defined to connect the two parts of each central column. The shear springproperties were calculated in the same manner as those of the fiber section model. The twomodels created through the abovementioned procedures are schematically shown in Figure 4.The numerical results will be presented in the following section.
5

RigidBeams
ShearSpringFibers
BoundaryElementsFiber Section Simple
Cantilever
Fiber Section Model MVLEM
FORCE
DISPLACEMENT
Cracking, C
Yield, Y
C’
Y’
1
2
3Shear Force
Shear Deformation
Figure 4: The two studied models: the fiber section model and the MVLEM
4 NUMERICAL RESULTS: MVLEM VS FIBER SECTION MODEL
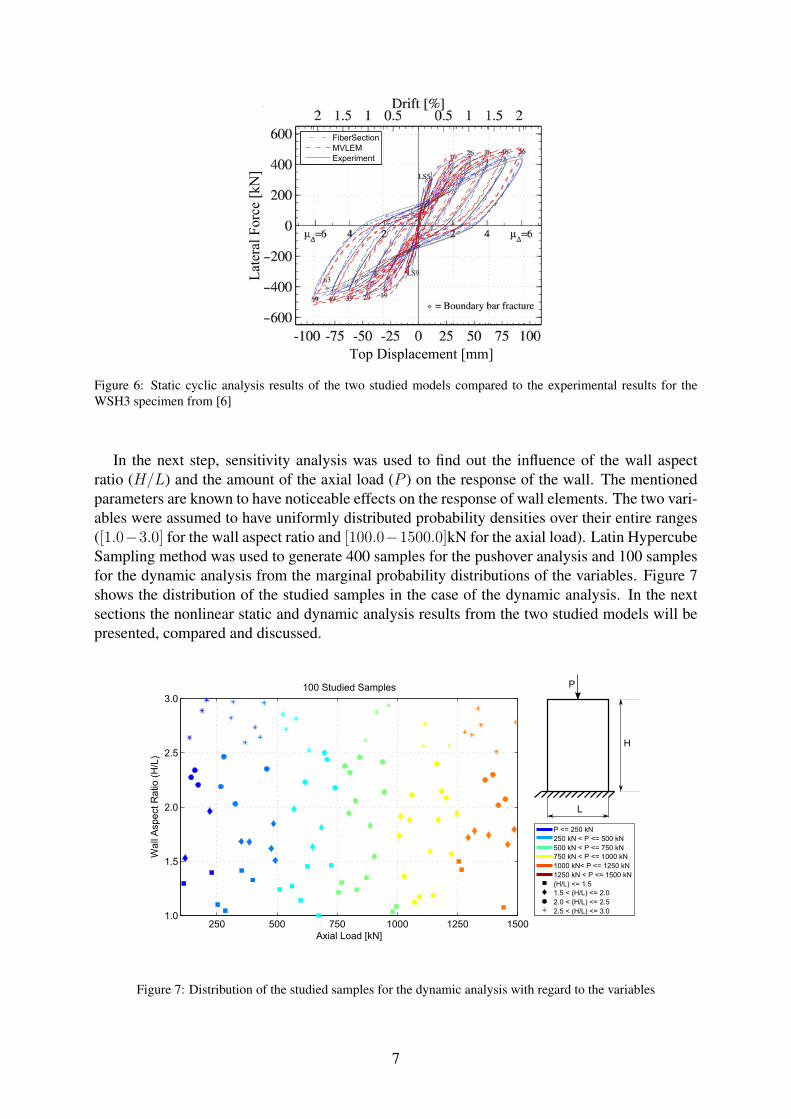
To take the first step, the MVLEM was verified/validated against observed response of aselected wall specimen to check its potential for further studies. For this purpose, the specimenWSH3, one of the 6 wall specimens tested within an experimental program conducted at theETH Zurich [6], was chosen as the reference experimental model. During the test the specimenswere subjected to a deformation-controlled quasi-static cyclic loading. Details about the loadingschemes can be found in [6]. The WSH3 with a height of 4.56m had a rectangular section of2.0m length and 0.15m thickness. The reinforcement layout is shown in Figure 5. Compressivestrength (f ′c) and modulus of elasticity (Ec) for concrete were reported to be 39.2 MPa and 35.2GPa, respectively. Also, the yield strength of steel (fy) for boundary and web reinforcementswere respectively recorded to be 601.0 MPa and 569.2 MPa. Additional information about thesectional and material properties can be found in [6]. It is worth mentioning that throughout therest of the study the sectional and material properties are kept unchanged. Comparison of theresults from this step are presented in Figure 6. Very good agreement can be seen between thethree responses (i.e. MVLEM, fiber section model and the experimental results). The modelwas therefore qualified to be used for further sensitivity/uncertainty studies.
150
10030 100 125 125 125 125 125 145 145 125 125 125 125 125 100 100 30
2000
6o1222 o 8
o4.2@ 75
o6 @ 150
o6@ 75
o6 @ 150
o6@ 75
o4.2@ 75
6o12
Figure 5: Reinforcement layout for the WSH3 specimen [6]
6
−600
−400
−200
0
200
400
600 FiberSectionMVLEMExperiment
Lat
eral
For
ce [
kN]
Top Displacement [mm]
Figure 6: Static cyclic analysis results of the two studied models compared to the experimental results for theWSH3 specimen from [6]
In the next step, sensitivity analysis was used to find out the influence of the wall aspectratio (H/L) and the amount of the axial load (P ) on the response of the wall. The mentionedparameters are known to have noticeable effects on the response of wall elements. The two vari-ables were assumed to have uniformly distributed probability densities over their entire ranges([1.0−3.0] for the wall aspect ratio and [100.0−1500.0]kN for the axial load). Latin HypercubeSampling method was used to generate 400 samples for the pushover analysis and 100 samplesfor the dynamic analysis from the marginal probability distributions of the variables. Figure 7shows the distribution of the studied samples in the case of the dynamic analysis. In the nextsections the nonlinear static and dynamic analysis results from the two studied models will bepresented, compared and discussed.
250 500 750 1000 1250 15001.0
1.5
2.0
2.5
3.0100 Studied Samples
Wal
l Asp
ect R
atio
(H
/L)
Axial Load [kN]
L
H
P
P <= 250 kN250 kN < P <= 500 kN500 kN < P <= 750 kN750 kN < P <= 1000 kN1000 kN< P <= 1250 kN1250 kN < P <= 1500 kN(H/L) <= 1.51.5 < (H/L) <= 2.02.0 < (H/L) <= 2.52.5 < (H/L) <= 3.0
Figure 7: Distribution of the studied samples for the dynamic analysis with regard to the variables
7
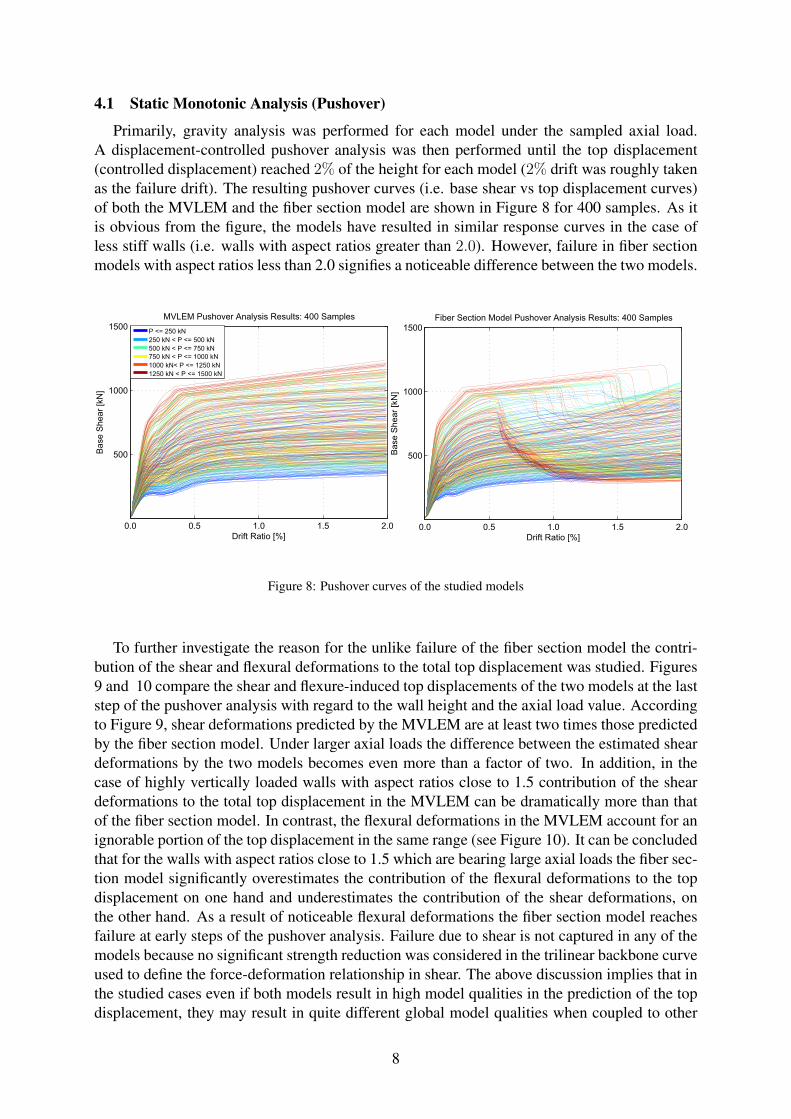
4.1 Static Monotonic Analysis (Pushover)
Primarily, gravity analysis was performed for each model under the sampled axial load.A displacement-controlled pushover analysis was then performed until the top displacement(controlled displacement) reached 2% of the height for each model (2% drift was roughly takenas the failure drift). The resulting pushover curves (i.e. base shear vs top displacement curves)of both the MVLEM and the fiber section model are shown in Figure 8 for 400 samples. As itis obvious from the figure, the models have resulted in similar response curves in the case ofless stiff walls (i.e. walls with aspect ratios greater than 2.0). However, failure in fiber sectionmodels with aspect ratios less than 2.0 signifies a noticeable difference between the two models.
0.0 0.5 1.0 1.5 2.0
500
1000
1500Fiber Section Model Pushover Analysis Results: 400 Samples
Drift Ratio [%]
Bas
e S
hear
[kN
]
0.0 0.5 1.0 1.5 2.0
500
1000
1500MVLEM Pushover Analysis Results: 400 Samples
Drift Ratio [%]
Bas
e S
hear
[kN
]
P <= 250 kN250 kN < P <= 500 kN500 kN < P <= 750 kN750 kN < P <= 1000 kN1000 kN< P <= 1250 kN1250 kN < P <= 1500 kN
Figure 8: Pushover curves of the studied models
To further investigate the reason for the unlike failure of the fiber section model the contri-bution of the shear and flexural deformations to the total top displacement was studied. Figures9 and 10 compare the shear and flexure-induced top displacements of the two models at the laststep of the pushover analysis with regard to the wall height and the axial load value. Accordingto Figure 9, shear deformations predicted by the MVLEM are at least two times those predictedby the fiber section model. Under larger axial loads the difference between the estimated sheardeformations by the two models becomes even more than a factor of two. In addition, in thecase of highly vertically loaded walls with aspect ratios close to 1.5 contribution of the sheardeformations to the total top displacement in the MVLEM can be dramatically more than thatof the fiber section model. In contrast, the flexural deformations in the MVLEM account for anignorable portion of the top displacement in the same range (see Figure 10). It can be concludedthat for the walls with aspect ratios close to 1.5 which are bearing large axial loads the fiber sec-tion model significantly overestimates the contribution of the flexural deformations to the topdisplacement on one hand and underestimates the contribution of the shear deformations, onthe other hand. As a result of noticeable flexural deformations the fiber section model reachesfailure at early steps of the pushover analysis. Failure due to shear is not captured in any of themodels because no significant strength reduction was considered in the trilinear backbone curveused to define the force-deformation relationship in shear. The above discussion implies that inthe studied cases even if both models result in high model qualities in the prediction of the topdisplacement, they may result in quite different global model qualities when coupled to other
8

partial models which are sensitive to shear deformations.
250 500 750 1000 1250 15000
200
400
600
800
1000
1200
1400
1600
1800MVLEM Normalized to Fiber Section Model Results: 400 Samples
Axial Load [kN]
Max
imum
She
ar D
efor
mat
ion
Rat
io [%
]
1.0 1.5 2.0 2.5 3.00
200
400
600
800
1000
1200
1400
1600
1800MVLEM Normalized to Fiber Section Model Results: 400 Samples
Wall Aspect ratio (H/L)
Max
imum
She
ar D
efor
mat
ion
Rat
io [%
]
(H/L) <= 1.51.5 < (H/L) <= 2.02.0 < (H/L) <= 2.52.5 < (H/L) <= 3.0
P <= 250 kN250 kN < P <= 500 kN500 kN < P <= 750 kN750 kN < P <= 1000 kN1000 kN< P <= 1250 kN1250 kN < P <= 1500 kN
Figure 9: Scatter of the normalized shear-induced top displacement of the studied samples with regard to thevariables
250 500 750 1000 1250 15000
200
400
600
800
1000
1200
1400
1600
1800MVLEM Normalized to Fiber Section Model Results: 400 Samples
Axial Load [kN]
Max
imum
Fle
xura
l Def
orm
atio
n R
atio
[%]
1.0 1.5 2.0 2.5 3.00
200
400
600
800
1000
1200
1400
1600
1800MVLEM Normalized to Fiber Section Model Results: 400 Samples
Wall Aspect ratio (H/L)
Max
imum
Fle
xura
l Def
orm
atio
n R
atio
[%]
(H/L) <= 1.51.5 < (H/L) <= 2.02.0 < (H/L) <= 2.52.5 < (H/L) <= 3.0
P <= 250 kN250 kN < P <= 500 kN500 kN < P <= 750 kN750 kN < P <= 1000 kN1000 kN< P <= 1250 kN1250 kN < P <= 1500 kN
Figure 10: Scatter of the normalized flexure-induced top displacement of the studied samples with regard to thevariables
4.2 Dynamic Analysis
44 ground motions were selected according to the far-field record set of FEMAp695 [2]to perform the dynamic analysis. The record set includes twenty-two records (44 individualcomponents) taken from the PEER NGA database. Details about the ground motions can befound in [2]. In sum, 100 samples were chosen which implies a total 440 number of nonlineardynamic analysis. As in the case of the pushover analysis, each model was imposed to thesampled axial load before the dynamic analysis was performed. The fundamental periods of themodels were then computed and used to calculate the spectral accelerations of the models for
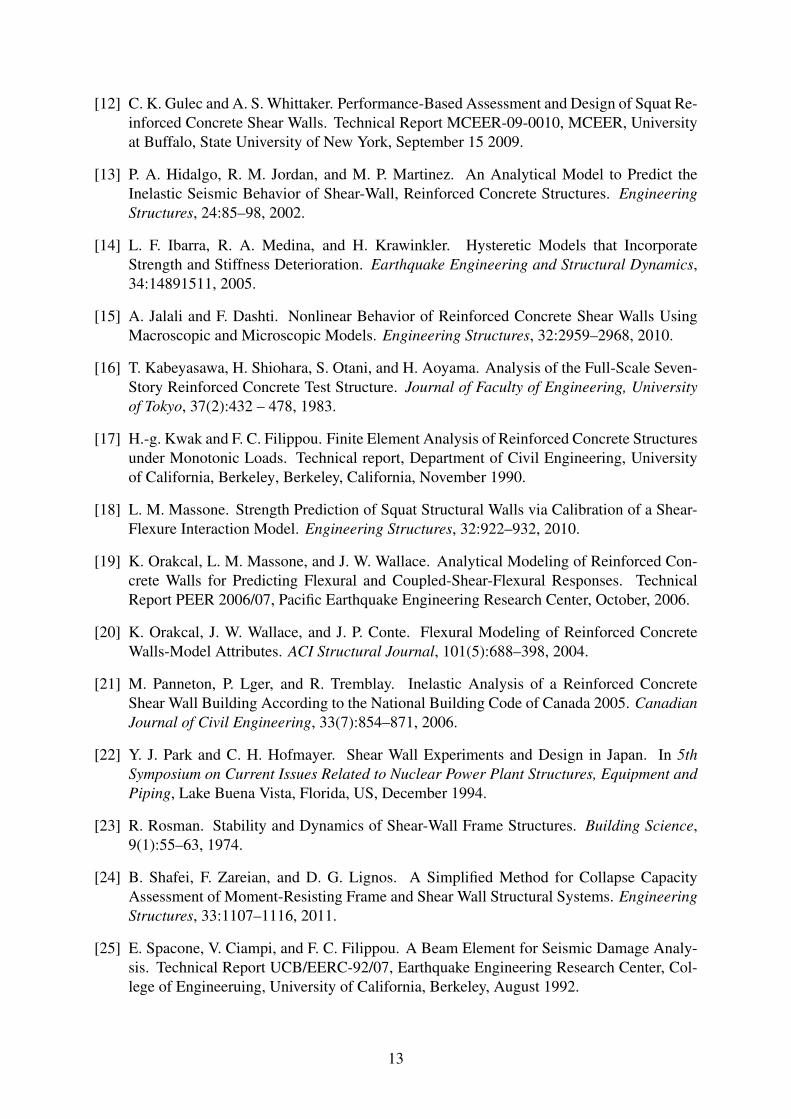
9
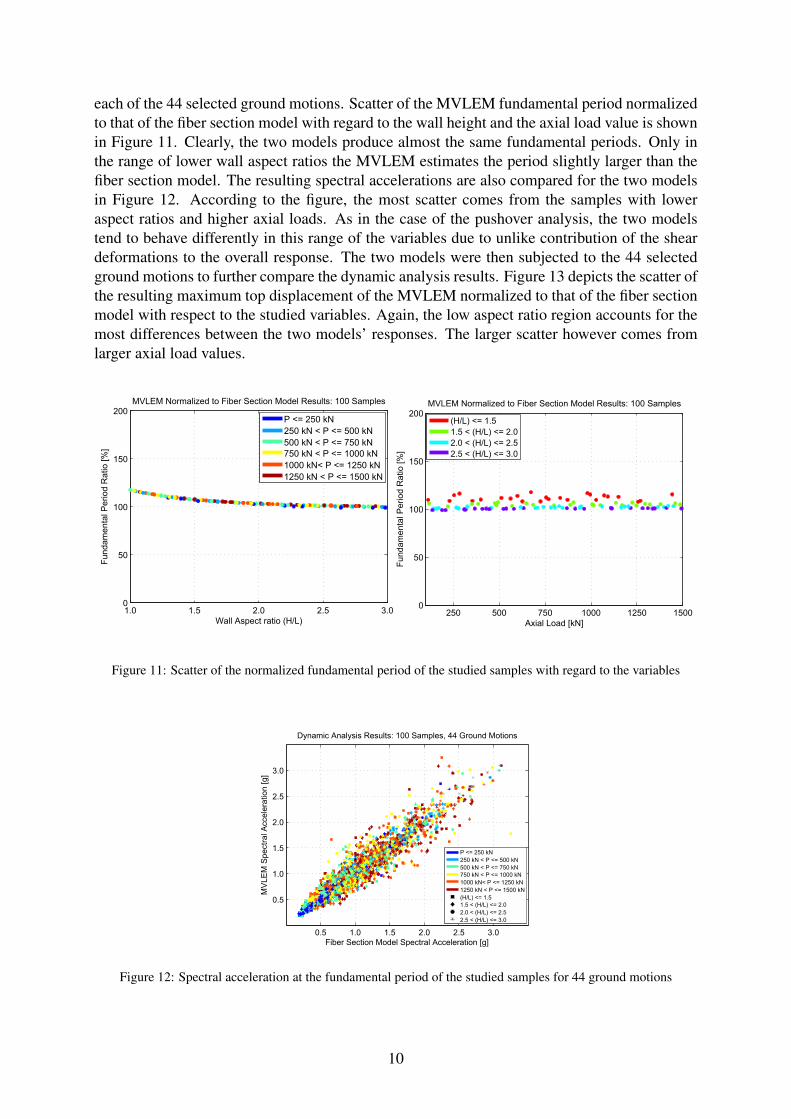
each of the 44 selected ground motions. Scatter of the MVLEM fundamental period normalizedto that of the fiber section model with regard to the wall height and the axial load value is shownin Figure 11. Clearly, the two models produce almost the same fundamental periods. Only inthe range of lower wall aspect ratios the MVLEM estimates the period slightly larger than thefiber section model. The resulting spectral accelerations are also compared for the two modelsin Figure 12. According to the figure, the most scatter comes from the samples with loweraspect ratios and higher axial loads. As in the case of the pushover analysis, the two modelstend to behave differently in this range of the variables due to unlike contribution of the sheardeformations to the overall response. The two models were then subjected to the 44 selectedground motions to further compare the dynamic analysis results. Figure 13 depicts the scatter ofthe resulting maximum top displacement of the MVLEM normalized to that of the fiber sectionmodel with respect to the studied variables. Again, the low aspect ratio region accounts for themost differences between the two models’ responses. The larger scatter however comes fromlarger axial load values.
250 500 750 1000 1250 15000
50
100
150
200MVLEM Normalized to Fiber Section Model Results: 100 Samples
Axial Load [kN]
Fun
dam
enta
l Per
iod
Rat
io [%
]
1.0 1.5 2.0 2.5 3.00
50
100
150
200MVLEM Normalized to Fiber Section Model Results: 100 Samples
Wall Aspect ratio (H/L)
Fun
dam
enta
l Per
iod
Rat
io [%
]
(H/L) <= 1.51.5 < (H/L) <= 2.02.0 < (H/L) <= 2.52.5 < (H/L) <= 3.0
P <= 250 kN250 kN < P <= 500 kN500 kN < P <= 750 kN750 kN < P <= 1000 kN1000 kN< P <= 1250 kN1250 kN < P <= 1500 kN
Figure 11: Scatter of the normalized fundamental period of the studied samples with regard to the variables
0.5 1.0 1.5 2.0 2.5 3.0
0.5
1.0
1.5
2.0
2.5
3.0
Dynamic Analysis Results: 100 Samples, 44 Ground Motions
Fiber Section Model Spectral Acceleration [g]
MV
LEM
Spe
ctra
l Acc
eler
atio
n [g
]
P <= 250 kN250 kN < P <= 500 kN500 kN < P <= 750 kN750 kN < P <= 1000 kN1000 kN< P <= 1250 kN1250 kN < P <= 1500 kN(H/L) <= 1.51.5 < (H/L) <= 2.02.0 < (H/L) <= 2.52.5 < (H/L) <= 3.0
Figure 12: Spectral acceleration at the fundamental period of the studied samples for 44 ground motions
10

1.0 1.5 2.0 2.5 3.00
50
100
150
200
250
300MVLEM Normalized to Fiber Section Model Results: 100 Samples
Wall Aspect ratio (H/L)
Max
imum
Top
Dis
plac
emen
t Rat
io [%
]
250 500 750 1000 1250 15000
50
100
150
200
250
300MVLEM Normalized to Fiber Section Model Results: 100 Samples
Axial Load [kN]
Max
imum
Top
Dis
plac
emen
t Rat
io [%
]
P <= 250 kN250 kN < P <= 500 kN500 kN < P <= 750 kN750 kN < P <= 1000 kN1000 kN< P <= 1250 kN1250 kN < P <= 1500 kN
(H/L) <= 1.51.5 < (H/L) <= 2.02.0 < (H/L) <= 2.52.5 < (H/L) <= 3.0
Figure 13: Scatter of the normalized maximum top displacement of the studied samples with regard to the variables
5 CONCLUSIONS
In order to take the first step in the model quality evaluation of coupled frame-wall systems,the main partial model of the system i.e. the wall element was studied through nonlinear staticand dynamic analysis. Fiber section model and the Multiple-Vertical-Line-Element-Model(MVLEM) were selected from two major modeling categories (micro- and macro-modelingapproaches respectively). To check the potential of the models in the prediction of the wall re-sponse, comparison to a selected observed response was made. The models produced responsesin close agreement with the observed behavior. Later, the influence of the wall aspect ratio(H/L) and the axial load on the response of the models was investigated through sensitivityanalysis. In case of the pushover analysis, the models resulted in quite similar behavior for highaspect ratio walls under low axial loads. However, a dramatic difference was seen between themodel responses in the range of low aspect ratio walls under high levels of axial load due tothe unlike contribution of the shear deformations to the total top displacement. In the afore-mentioned range of the variables, the fiber section reached flexural failure at early steps of thepushover analysis since the flexural deformations had to increase significantly in order to fillin for the less contribution of the shear deformations to the top displacement. In the studiedcases, this implies that careful attention should be paid to the model quality evaluation of thewall models specifically when they are supposed to be coupled to other partial models. Otherpartial models may include a moment frame or a soil-footing substructure which their responsecan be sensitive to shear deformations. If this is the case then even a high quality wall modelwould not result in a high quality coupled system since it fails to interact properly with the restof the system. Based on the above discussion, one may be able to define coupling capabilitiesas one of the properties of a given model. Finally, the dynamic analysis results were presentedand compared. According to the results, as in the case of the pushover analysis the most differ-ences between the models’ responses is concentrated in the range of low aspect ratios and largeaxial loads. Further check of the model responses with other models (numerical and physical)is required in order to infer conclusions about the quality of the models. This is the focus of anongoing research by the first author.
11

ACKNOWLEDGMENTS
The first author is currently a member of the Research Training Group 1462 (GRK 1462)at the Faculty of Civil Engineering, Bauhaus University of Weimar. The ongoing research isfunded by the German Research Foundation (DFG). This support is gratefully acknowledged.
REFERENCES
[1] Applied Technology Council. ATC-40: Seismic Evaluation and Retrofit of ConcreteBuildings. Technical report, Seismic Safety Commission, State of California, Redwood,California, US, 1996.
[2] Applied Technology Council. FEMAp695: Quantification of Building Seismic Perfor-mance Factors. Technical report, Federal Emergency Management Agency (FEMA),Washington, D.C., US, June 2009.
[3] G. Areiza and C. N. Kostem. Interaction of Reinforced Concrete Frame-Cracked ShearWall Systems Subjected to Earthquake Loadings. Technical Report 433,4, Fritz Engineer-ing Laboratory, Department of Civil Engineering, Lehigh University, Bethlehem, Penn-sylvania, July 1979.
[4] Y. Bao and S. K. Kunnath. Simplified Progressive Collapse Simulation of RC Frame-wallStructures. Engineering Structures, 32:3153–3162, 2010.
[5] Y. Belmouden and P. Lestuzzi. Analytical Model for Predicting Nonlinear Reversed CyclicBehaviour of Reinforced Concrete Structural Walls. Engineering Structures, 29:1263–1276, 2007.
[6] A. Dazio, K. Beyer, and H. Bachmann. Quasi-Static Cyclic Tests and Plastic Hinge Anal-ysis of RC Structural Walls. Engineering Structures, 31:1556–1571, 2009.
[7] F. C. Filippou and A. Issa. Nonlinear Analysis of Reinforced Concrete Frames UnderCyclic Load Reversals. Technical Report UCB/EERC88/12, Earthquake Engineering Re-search Center, College of Engineering, University of California, Berkeley, September1988.
[8] M. Fischinger, T. Vidic, and Fajfar P. Nonlinear Seismic Analysis and Design of ReinforcedConcrete Buildings, chapter Nonlinear Seismic Analysis Of Structural Walls Using TheMultiple-Vertical-Line-Element Model, pages 191–202. Elsevier Applied Science, 1992.
[9] M. Fischinger, T. Vidic, J. Selih, P. Fajfar, H. Y. Zhang, and F.B. Damjanic. Validation ofa Macroscopic Model for Cyclic Response Prediction of RC Walls. In 2nd InternationalConeference on Computer Aided Analysis and Design of Concrete Structures, volume 2,pages 1131–1142, Zell am See, Austria, 4-6 April 1990.
[10] K. Galal and H. El-Sokkary. Advancement In Modeling of RC Shear Walls. In 14th WorldConference on Earthquake Engineering, Beijing, China, October 12-17 2008.
[11] A. Ghobarah and M. Youssef. Modelling of Reinforced Concrete Structural Walls. Engi-neering Structures, 21:912–923, 1999.
12
[12] C. K. Gulec and A. S. Whittaker. Performance-Based Assessment and Design of Squat Re-inforced Concrete Shear Walls. Technical Report MCEER-09-0010, MCEER, Universityat Buffalo, State University of New York, September 15 2009.
[13] P. A. Hidalgo, R. M. Jordan, and M. P. Martinez. An Analytical Model to Predict theInelastic Seismic Behavior of Shear-Wall, Reinforced Concrete Structures. EngineeringStructures, 24:85–98, 2002.
[14] L. F. Ibarra, R. A. Medina, and H. Krawinkler. Hysteretic Models that IncorporateStrength and Stiffness Deterioration. Earthquake Engineering and Structural Dynamics,34:14891511, 2005.
[15] A. Jalali and F. Dashti. Nonlinear Behavior of Reinforced Concrete Shear Walls UsingMacroscopic and Microscopic Models. Engineering Structures, 32:2959–2968, 2010.
[16] T. Kabeyasawa, H. Shiohara, S. Otani, and H. Aoyama. Analysis of the Full-Scale Seven-Story Reinforced Concrete Test Structure. Journal of Faculty of Engineering, Universityof Tokyo, 37(2):432 – 478, 1983.
[17] H.-g. Kwak and F. C. Filippou. Finite Element Analysis of Reinforced Concrete Structuresunder Monotonic Loads. Technical report, Department of Civil Engineering, Universityof California, Berkeley, Berkeley, California, November 1990.
[18] L. M. Massone. Strength Prediction of Squat Structural Walls via Calibration of a Shear-Flexure Interaction Model. Engineering Structures, 32:922–932, 2010.
[19] K. Orakcal, L. M. Massone, and J. W. Wallace. Analytical Modeling of Reinforced Con-crete Walls for Predicting Flexural and Coupled-Shear-Flexural Responses. TechnicalReport PEER 2006/07, Pacific Earthquake Engineering Research Center, October, 2006.
[20] K. Orakcal, J. W. Wallace, and J. P. Conte. Flexural Modeling of Reinforced ConcreteWalls-Model Attributes. ACI Structural Journal, 101(5):688–398, 2004.
[21] M. Panneton, P. Lger, and R. Tremblay. Inelastic Analysis of a Reinforced ConcreteShear Wall Building According to the National Building Code of Canada 2005. CanadianJournal of Civil Engineering, 33(7):854–871, 2006.
[22] Y. J. Park and C. H. Hofmayer. Shear Wall Experiments and Design in Japan. In 5thSymposium on Current Issues Related to Nuclear Power Plant Structures, Equipment andPiping, Lake Buena Vista, Florida, US, December 1994.
[23] R. Rosman. Stability and Dynamics of Shear-Wall Frame Structures. Building Science,9(1):55–63, 1974.
[24] B. Shafei, F. Zareian, and D. G. Lignos. A Simplified Method for Collapse CapacityAssessment of Moment-Resisting Frame and Shear Wall Structural Systems. EngineeringStructures, 33:1107–1116, 2011.
[25] E. Spacone, V. Ciampi, and F. C. Filippou. A Beam Element for Seismic Damage Analy-sis. Technical Report UCB/EERC-92/07, Earthquake Engineering Research Center, Col-lege of Engineeruing, University of California, Berkeley, August 1992.
13

[26] B. Taskin and Z. Hasgr. Monte Carlo Analysis of Earthquake Resistant RC 3D ShearWall-Frame Structures. Structural Engineering and Mechanics, 22(3):371–399, 2006.
[27] A. Vulcano. Use of Wall Macroscopic Models in the Nonlinear Analysis of RC Frame-wallStructures. In 10th World Conference on Earthquake Engineering, Balkema, Rotterdam,1992.
[28] A. Vulcano and V. V. Bertero. Analytical Models for Predicting the Lateral Responseof RC Shear Wall: Evaluation of Their Reliability. Technical Report UCB/EERC-87/19,Earthquake Engineering Research Center, November 1987.
[29] H. Xiaolei, C. Xuewei, J. Cheang, M. Guiniu, and W. Peifeng. Numerical Analysis ofCyclic Loading Test of Shear Walls based on OpenSees. In 14th World Conference onEarthquake Engineering, Beijing, China, 12-17 October 2008.
14