model studies of laser absorption computed tomography for remote
TRANSCRIPT

Model studies of laser absorption computed tomographyfor remote air pollution measurement
David C. Wolfe, Jr., and Robert L. Byer
Laser absorption computed tomography offers the possibility of sensitive remote atmospheric measure-ments of pollutants over kilometer sized areas with 2-D resolution at modest laser source powers. Wepresent detailed model studies which demonstrate the potential of this new remote sensing technique. Thetomographic reconstruction process is studied as a function of measurement signal to noise, laser power,range, and system geometry. The analysis shows that the proposed system is capable of providing 2-D mapsof pollutant concentration at ranges and resolutions superior to that attainable from contemporary directdetection laser radars.
1. IntroductionThe past decade has witnessed a revolution in the
field of medical imaging brought about by the applica-tion of reconstructive tomography. From its first ap-plications in radiology, the scope of tomographicimaging has steadily increased to the point where itsapplication is an accepted part of medical practice. Theawarding of the 1979 Nobel Prize in medicine toHounsfield and Cormack is testimony to the importanceof tomography in contemporary medical practice." 2
In the late 1970s investigators began to explore thepossible uses of tomography outside the field of medi-cine. There have been many efforts to employ tomo-graphic techniques in such disparate areas as phase-flowdiagnostics in reactor cooling loops, 3 determination ofgeological features with acoustic and electromagneticwaves,4 in laboratory gas concentration measure-ments,5 6 and remote air pollution monitoring.7-11
There has also been interest in applying laser tomog-raphy to fluid mechanics problems as an adjunct tohot-wire anemometry, schlieren imaging, and inter-ferometric holography which are currently used in flowvisualization.
In this paper we address the problem of applyingtomography using laser sources over kilometer ranges
The authors are with Stanford University, Edward L. GinztonLaboratory of Physics, Stanford, California 94305.
Received 5 October 1981.0003-6935/82/07 1 165-14$01.00/0.© 1982 Optical Society of America.
to derive 2-D maps of air pollution concentration. Itis shown here that the construction of a system that cangenerate pollution maps with ranges of 6 km, resolutioncells of 200 m, and detection sensitivities of fractions ofppm to ppb is within the current state of the art.Moreover, the use of tomography allows measurementsto be made at much less laser power than the directdetection laser light radar systems now in use. Thereis a corresponding signal-to-noise and measurementrange advantage using tomography. We also show thatit is possible to obtain pollution information with farfewer line integral measurements than is customary inmedical practice. This latter finding is important,because it permits the construction of simpler and lesscostly laser tomographic systems.
In 1978 Byer and Shepp 7 proposed air pollution to-mography measurements using an approach shown inFig. 1. A laser in the center of the imaging circle of ra-dius R shines a beam toward mirrors that are on polesthat are high enough to be above obstacles such as treesor buildings. The mirror M, is shaped to provide a fanbeam which illuminates the detectors Dj on the oppositeperimeter of the circle. The required number of fansis generated by rotating the beam of the laser in theimaged plane thus illuminating each mirror in turn.The mirror acts as a virtual source which simulates a fanbeam similar to those produced in medical CT scanners.In practice each mirror could be optics mounted on asupporting structure or at a higher cost in requiredtransmitted energy, buildings, trees, or available terrainfeatures. The image can be reconstructed by means ofconventional algorithms to provide maps of the laserbeam attenuation for the species of interest. The vir-tual source idea greatly reduces implementation costsand increases system reliability because one laser source
1 April 1982 / Vol. 21, No. 7 / APPLIED OPTICS 1165

Fig. 1. Virtual source laser computer tomography: M is the ithvirtual source; Dj is the jth detector of the ith projection fan; L is thelaser source. The outer circle defines the locations of the virtualsources and detectors while the inner circle defines the area being
imaged. The cross hatched areas represent pollution clouds.
is located at a central transmitting station and not ateach mirror site. This paper presents results of a sim-ulation of pulsed and cw virtual source optical tomog-raphy.
In Sec. II we briefly survey the state of the art of laserradar (lidar) which is currently used to measure airpollution concentrations. This discussion provides abasis for comparison with the tomographic method.Section III provides a brief introduction to the subjectof tomographic image reconstruction. This part is in-tended primarily for the reader unfamiliar with thereconstruction process. The next section describes themathematical model used to simulate the remote airpollution tomographic scanner and discusses a fewimplementation details of the simulator. Section Vdiscusses the results of the simulation study and treatsthe questions of required resolution, signal-to-noise,required transmitted energies, and fan taper distortionof the image. A final section presents the conclusionsof this modeling study.
11. Laser Radar TechnologyThere are at present two general approaches for ob-
taining air pollution measurements: in situ and remotesensing. The in situ methods usually utilize monitoringstations at fixed locations that sample the air at periodicintervals. These stations utilize chemical analysis orspectroscopic methods that require integration timesof up to 1 hr. Thus, the temporal resolution of the datais low. A network of these stations is expensive to equipand operate so that the spatial resolution of the data isalso limited. This approach is the one in predominantuse today.
In the early 1970s laser radar was proposed as a re-mote measurement approach.12-14 During the lastdecade lidar techniques have evolved such that mea-surements of many pollutant species over ranges of afew kilometers are possible. However, the developmentof lidar has been slowed due to the requirement for highpower tunable laser sources. The lidar consists of a
pulsed or cw laser transmitter, beam forming optics, areceiving telescope that focuses the return signal on thedetector, postdetection electronics for gain and signalconditioning, and a computer for. data processing andsystem control. The return signal is derived from eitherscattering or emission from the species of interest as inRaman or fluorescence lidars, or from absorption witheither a man-made or natural retroreflector or partic-ulate backscatter as the reflector.
Lidar measurements using Raman scattering havebeen shown to lack the sensitivity for kilometer mea-surement ranges except for N2 and 02 determination.15Fluorescence lidar measurements have proven usefulfor measuring alkali metal vapors in the stratospheresbut are not useful in the troposphere due to quenchingat high gas densities. Lidar measurements by absorp-tion are the method of choice for remote measurementof atmospheric pollutants, humidity, and tempera-ture.
Absorption lidars are conveniently divided into twosubcategories: long path absorption using cooperativeor topographic retroreflectors and DIAL (differentialabsorption lidars) systems that derive their return fromatmospheric particulates which act as a distributedretroreflector.
The methods differ in the way in which energy isscattered back to the receiving telescope. In the longpath case, the transmitted pulse sent to the retrore-flector is scattered, and a small fraction of the trans-mitted energy is collected by the receiver. On both theoutward and inward legs of the path, the pulse is at-tenuated by molecular absorption of the gas species ofinterest. In the distributed retroreflector case thepropagation path is divided into spatial resolution cellsand range resolved pollution measurements can bemade. In contrast, the long path method allows onlya path average measurement to be made with no rangeresolution. As in the long path case, attenuation is dueto molecular absorption on both of the pulse propaga-tion paths.
To make range resolved measurements it is necessaryto use DIAL. Unfortunately, the use of DIAL requireshigh transmitted powers. This problem arises becausethe backscatter coefficient a, is very small in the in-frared spectral region where most of the pollutants havesuitable absorption lines. Moreover, the energy penaltyincreases with wavelength due to the inverse variationof backscattering with wavelength so that there is anincreasing penalty as one goes further into the infrared.Typical energies required for kilometer range mea-surements are in the 0.1-1.0-J/pulse range.'7 It is im-portant to note that long path absorption measurementsrequire 2-5 orders of magnitude less transmitted laserpower than the DIAL method.
Currently there is a lack of tunable coherent sourcesthat can produce pulse energies >100 mJ over a widetuning range, and progress in alleviating this situationhas been slow. The laser source problem has delayedwide application of the DIAL technique. DIAL mea-surements have been made to ranges of 3 km with cur-rent tunable source technology. DIAL is most useful
1166 APPLIED OPTICS / Vol. 21, No. 7 / 1 April 1982

in local enforcement situations such as stack monitoringbecause the necessary equipment can be placed in ve-hicles for portability.18
Laser absorption tomography can overcome thelimited range of the DIAL technique. The process ofcollecting projection data in an absorption tomographyexperiment is equivalent to a series of long path ab-sorption measurements. It should be possible to makerange resolved measurements with tomography at asignificantly reduced transmitted energy. In addition,since the spatial resolution properties of a tomographicmeasurement are solely dependent on the geometry ofthe detector-source grid and not the distribution andbackscattering efficiency of the aerosols on which thedistributed reflector lidars depend, the size of the res-olution cells does not increase with increasing wave-length as in the case for a DIAL system operating at afixed energy.
The potential for significantly increased atmosphericmeasurement capability and the potential applicationsof laser tomography in laboratory and industrial ap-plications provide ample motivation for our modelstudies.
Ill. Tomographic Inversion AlgorithmsTomographic reconstruction methods are extensively
reviewed in the literature. 19 -2 5 In this section we con-sider image reconstruction from projection data that areobtained via optical absorption measurements in a fanbeam geometry. If It is the intensity in W/m2 trans-mitted from the laser, Pr is the power received on thedetector and a,,a is the attenuation coefficient. Therelation between the transmitted intensity and detectorpower may be written as
P = H f H fHIt (U Lx)
AL 'L UL
exp |- RCa(u,L',r,)drdudvdX, (1)
where R is the distance between the laser and a pointon the detector surface, u and v are local coordinates onthe detector surface transverse to R and X is thewavelength. The quantities Xi, XH, VL, LH, UL, and UH
delimit the spectral and spatial extent of the detector.For a monochromatic beam whose transverse variationsin a are greater than the incident beamwidth thepreceding integral reduces to
Pr = Pt exp - fRca(r,X)dr, (2)
where Pr and Pt are the received and transmittedpowers. One can compute the line integrals by takingthe logarithm of the transmitted and received powersto obtain the projection numbers
P = ln(Pt/Pr) = a(rX)dr. (3)
The projection numbers are used as input to a re-construction algorithm which generates the tomogram.The two most common classes of algorithms are basedeither on the iterative improvement of an initial esti-
CENTRALRAY
Fig. 2. Geometry of a fan beam: y' is the angular position of thereconstructed pixel (ro) with respect to the central ray of the current
fan; f3 is the rotation angle of the current fan.
mate of the picture or convolution-backprojectionmethods based on Fourier theory. The iterativemethods have the advantage of permitting more free-dom in the placement of the virtual sources and detec-tors, but they have the disadvantages of greatly in-creased computational burden and possible convergencefailure in high input noise situations. The convolu-tion-backprojection method requires less computation,is more stable against noise, and converges more rapidly.It has the disadvantage of requiring a more symmetricalgeometry in the measurement system. In this paper weconsider only the convolution-backprojection approachand leave the possible application of iterative methodsfor further study.26
The convolution-backprojection algorithms are basedon the theoretical work done on the projection recon-struction problem by Radon early in this century.2 7
The fan beam geometry of interest to us here is shownin Fig. 2. The source of radiation located at S illumi-nates an array of detectors along the arc on the opposingside of the circle. The function to be reconstructed isin the polar coordinate system and is denoted as f(rs).d is the angle of the projection with respect to the fixedx,y coordinate system, while y is the angle of the de-tector with respect to the center ray of the projection.,Ym represents the maximum half-angle of the fan beam.The distance from S to the pixel at (rk) is
L(/3,r,) = [p2
+ r2
+ 2pR sin(3 - ]112. (4)
The angular position of the ray which passes through(r4o) in the current projection is given by
-0(,r,o) = tan-' [-]
tan r cos(Q- lLp + r sin( - )
(5)
As shown by Herman and Naparstek,2 8 the image isrelated to the fan beam projection
f(ro) d C
x (SP,(Y) E ' -y) 12 (n - )d e[sin(7y' - )
(6)
1 April 1982 / Vol. 21, No. 7 / APPLIED OPTICS 1167

This integral can be written as a succession of 1-D in-tegrals. The first is the convolution of the modifiedprojection data pa6 with a kernel function. The outerintegral represents the contribution of each fan in thereconstruction process and is termed the backprojectionintegral.
Each of these two integrals may be written in variousdiscrete forms depending on what approximations aremade in the sampling and interpolation processes nec-essary in the approximation procedure. 29 Assumingthat sufficiently sampled projection data are available,the convolution-backprojection method provides arelatively fast means for the reconstruction of 2-D im-ages of attenuation. Because of its simplicity and speedadvantages, the convolution-backprojection algorithmis the method of choice in medical x-ray CT scannermachines.
IV. Computer ModelThe model used in this study is based on the conser-
vation of laser energy propagating from the actualsource to the detector and is similar in spirit to themodels commonly used for existing lidar systems.
Figure 3 shows the geometry of the tomographicmeasurement. The laser beam is emitted from a centrallaser and illuminates the mirror Mi which becomes thevirtual source. The illumination may have a Gaussianintensity distribution as shown in the figure. The ra-diation may also undergo attenuation along the pathfrom the laser to the mirror.30 Hence we may write thepower incident on mirror M; as
Pin = Pt exp - S Rti(r)dr. (7)
Here Pt is the laser source power, R is the distance toMi, and ai is the attenuation coefficient due to pollu-tants between the laser and the mirror. In a similarfashion we may write the power received at detector jas
Pi =iAjDiPiIn exp |-jC aijd(r) . (8)
Here Pij is the power received at detector j due'to illu-mination at mirror i, Aj is the effective receiving areaof detector I, dij is the distance between M' and thedetector j, aij is the total attenuation coefficient be-tween i and j, and 1i is the fraction of power incidenton Mi that is scattered toward the detectors. i pro-vides a measurement of how much incident radiationis collected for reradiation back to the detector array.Each of the mirrors acts as an antenna and as such hasa directivity as defined in antenna theory.31 That is,Dij is the directivity of the virtual source in the ith di-rection of the jth detector. The purpose of the direc-tivity is to take the angular dependence of the mirrorscattering into account. The total transmitted powerPt is defined as
Pt = S I+(0, )d Q, (9)
where '1 is the radiation intensity in watts/steradian.The average power radiated per unit solid angle is
DETECTOR ARRAY
Di \0VI RTUALSOURCE
M;
Fig. 3. Propagation of fan beam from laser to detector array.Crosshatched areas represent pollution clouds while shaded areas
represent beam intensity profiles.
"Jav = P 4ir
(10)
The directivity is defined as ratio
Dij(0,0) = ij(, = (i(0,0.(11
The directivity in Eq. (11) is the directivity along thedirection i, j. Substituting Eq. (7) into Eq. (8) the re-ceived power at the detector array becomes
pi = it exp - r Ci(r)dr - J .ijtr)d (12)
As before, the attenuation terms include both scatteringand absorption losses. The scattering can be estimatedseparately or normalized by making two measurementswith the laser tuned on and off the absorption line.With the latter method, a can be treated strictly as anabsorption term. Experimentally, the laser tuning canbe reset after each scan at each fan position. In eithercase we combine tomographic scanning with the nor-malization of on/off tuning.
In both the transit from the laser to the mirror andfrom the mirror to the detector, the beam encountersattenuation from pollutant clouds. These clouds aremodeled as a superposition of elliptical disks, each ofwhich is described by geometric parameters and an at-tenuation amplitude. For each disk, the distance of thebeam enclosed by the disk is first calculated and thenmultiplied by the attenuation coefficient of the disk.The total line integral in a given direction is the sum ofall the line integrals of all the intersected disks in thesame direction. In this manner, phantoms of arbitrarycomplexity may be constructed limited only by execu-tion time and memory constraints. Similar methodshave been employed in simulations of medical tomo-graphic applications. 2 9
We must also model the directivity of the scatteredbeam. Since we assume a laser source, we chose to usean intensity distribution typical of such sources. Mostlasers used in Lidars are operated in a near Gaussianintensity mode. When the beam hits the mirror theresulting fan beam also has a Gaussian profile in thevertical and horizontal directions. Since it is desirableto have the scattered radiation concentrated in thehorizontal plane, it is advantageous to have differentmirror radii of curvature in the vertical and horizontal
1168 APPLIED OPTICS / Vol. 21, No. 7 / 1 April 1982

directions. In addition, we specify two angles beyondwhich the laser intensity is truncated to zero. This givesa model beam which is a product of Gaussian functionsin two dimensions.
The parameters required to specify the beam are thetwo angles of truncation and the two half-intensityangles. This model has the advantage that it permitsa fast evaluation of the directivity integral18 as its de-nominator is the product of two integrals of the form
2 J exp(_x2)dx, (13)
where a is the truncation half-angle and 3 is the half-power angle. In the program, the kernels of the inte-grals are contained in two functions which are passedas parameters to a subroutine where they are integratednumerically. The directivity in the desired directionmay then be calculated from the expression
=ij 7%h exp(-YhX2) (14)
JO exp(-j3hx2 )dx exp(-&y 2)dy
where the h subscript denotes angles in the image planeand v denotes the vertical plane orthogonal to the imageplane. 4 'h is the maximum intensity at the center of thefan and the line between Mi and the detector j. Thisapproach provides a simple method of computing theappropriate directivity characteristic since it is assumedthat each mirror scatters identically. In some of thesimulations presented later, we consider Lambertianscatterers as virtual sources. In this case the directiv-ities are equal to 2 over a hemisphere. The case ofLambertian scattering is important in modeling situa-tions where available topographic features are used asvirtual sources.
Once the power incident on the detector is known itcan be compared with the noise power. We decided touse a simple phenomenological description for detectornoise. In this model there are several noise sources thatcharacterize the detectors. They include thermal noisecollected by the receiving optics, dark current noise, andshot noise. The dominant terms depend on the phys-ical nature of the detector and its environment. How-ever, in general, the signal-to-noise may be calculatedby the expression32
S = Pr(4hvP, f/ + 2NEP2Af)-/2, (15)
where Pr is the received signal power, Af is the amplifierbandwidth, v is the frequency, h is Planck's constant,n is the quantum efficiency, and NEP is the noiseequivalent power of the detector. The factor of 2 arisesfrom the necessity to take account of the noise resultingfrom two measurements. The first term in the de-nominator represents signal dependent noise (shotnoise), while the second represents the noise in the ab-sence of signal (dark current and thermal backgroundnoise) characterized by the noise equivalent power.Usually one or the other of these terms is dominant. Inthis paper we consider only infrared systems in whichthe detectors are background-limited and Eq. (15) re-duces to
(16)
The dark current noise limit usually applies to photo-conductors and other detectors used in the infraredregion of the spectrum. The NEP is defined by
NEP = D*(AAf)-1/2 (17)
where A is the area of the detector's photosensitivesurface, and D* is the detectivity of the detector.
From the above expressions one may compute thevariance of the equivalent Gaussian noise source. Onthe computer, the Gaussian noise source is simulatedfrom an available system uniform random numbergenerator. The process is repeated for each detectorin the array thus simulating a series of noisy line integralmeasurements which are then input to the reconstruc-tion algorithm. For Monte Carlo simulation, an en-semble of noisy pictures may be generated on whichstatistics may be collected either on a pixel or spatialaverage basis.
It should be noted that Eq. (15) only applies for highphoton count rates. In some laboratory applicationswhere the count rates are low, the Gaussian noise modelbecomes unsatisfactory and it is necessary to use Pois-son or conditional Poisson statistics as is done in x-raytomography.33
We may summarize the model by stating what is re-quired as input. In a given calculation the model re-quires that the user supply a scaling parameter thatestablishes the dimensions of the geometric parameters;a set of geometric and attenuation values of the diskscomprising the cloud model; the number of desired fanbeams; the number of detectors around the circle andtwo angles describing the horizontal and vertical extentof the fan; a parameter which specifies what fraction ofthe laser energy incident on the mirror is reflected backas fan energy; two angles specifying the vertical andhorizontal half- power points of the laser intensity re-flected back from the virtual source; an effective areathat describes the collection properties of the receivingoptics; a noise equivalent power and bandwidth to de-scribe the background noise properties of the detectors;and a parameter that specifies how many random pic-tures to generate in Monte Carlo simulations.
The preceding ideas are incorporated into a series ofprograms that comprise the optical tomography simu-lator. There is an input program which creates filesthat are read by the main program which reconstructsthe images and collects statistics. The output of thereconstruction program can be fed into either a programwhich takes cross sections through the data and greyscales the image for later bitmap display or prints theimage directly.
The plots shown in the next section were generatedby a Pascal program which reads the grey scale codeddata and generates a shaded line printer plot usingstandard ordered dither techniques.34 Dither matricesallow one to trade the number of grey levels against thenumber of pixels in the image. This technique is usefulwith display devices such as plasma displays and lineprinters that have high spatial resolution but are only
1 April 1982 / Vol. 21, No. 7 / APPLIED OPTICS 1169
P = NP(2Af)112.

capable of two levels in amplitude resolution. A seriesof test pattern generator programs showed that theoptimal trade off in grey scale vs pixel resolution for theavailable line printers occurred on 50 X 50 pixel gridswith 10-16 grey levels. All the reconstructions of thispaper use these values. With the exception of thePascal display code generator and an assembly languageroutine which controls setting the seed of the randomnumber generator, all code is written in FORTRAN fortransportability. This permitted the simulator to berun on a DECSYSTEM-20 at Stanford University forpicture display runs and at the NASA Ames ResearchCenter's CDC 7600 for computation-intensive MonteCarlo runs.
V. Computer Simulations and Reconstructions
A. IntroductionWe now present the results of our simulation studies.
We chose to model tomography on a kilometer scale asit would apply to air pollution measurements. How-ever, the simulation results also provide a guide to to-mographic measurements on meter or centimeter scaleswhich are of interest in combustion diagnostics or flowvisualization applications. In Sec. B we give examplesof how the simulator can be used to study reconstructionaccuracy requirements for a class of images. The sim-ulations show how the global reconstruction accuracyvaries as a function of the number of fans used in thereconstruction.
The virtual source geometry gives rise to new possi-bilities for reconstruction artifacts. The first of thesearises from the attenuation of the laser beam on its wayto the virtual source mirror. We refer to this artifactas depletion distortion. The second artifact arises froma combination of variations in the laser intensity pro-files, range variations of the rays of a given fan, and di-rectivity and apodization effects of the virtual sourcemirrors. This second artifact source we call directivitydistortion because it appears as a nonuniform weightingof the rays of a given fan beam. In Sec. C we brieflydiscuss depletion distortion but concentrate on direc-tivity distortion as it is more significant in practice. Wealso suggest corrective measurements for both prob-lems.
Section D treats a simulation of the imaging of a smallpollution cloud in detector noise. This simultaneouslydemonstrates the resolution potential and provides anestimate of the pollution concentrations that can beimaged by virtual source laser tomography.
Section E presents results of Monte Carlo simulationsof four different tomographic situations but with re-constructions of the same object. A cw and a pulsedlaser source are simulated, each with a directive fanbeam and Lambertian scattering virtual source. Thesesimulations compare the input laser power required toobtain a given picture averaged signal-to-noise ratio.This type of simulation permits one to make judgmentsof the relative advantages and disadvantages of thesystems simulated in the light of available laser sourcetechnology.
Section F is a similar Monte Carlo study of a systemwith uniform errors in the line integral measurementssuch as might be caused by laser peak-to-peak powervariations.
We conclude in Sec. G with two reconstructions of amore complicated pollution cloud to illustrate theoverall imaging capability of the virtual source con-cept.
B. Convergence of Approximate PhantomsFirst we investigate how the degree of approximation
of an artifact affects the reconstruction accuracy. Ineach of three cases, no noise was added to the projectiondata. In the first case, a single disk was taken as anapproximation to a Gaussian function whose firststandard deviation radius was taken to be equal to theradius of the approximating disk. In the second trial,the same Gaussian was approximated by a superposi-tion of thirteen disks. A twenty-three disk approxi-mation was used for the final trial. hy = 114° withtwenty detectors/fan were used in the simulation. Theresults of the simulation are shown in Fig. 4. The rel-ative reconstruction error is calculated by comparingthe reconstructed image with the input phantom on apixel by pixel basis and then summing the squared errorat all pixels and normalizing by the number of pixels.
Figure 4 shows that all three reconstruction errorcurves level off at <200 fans. The curves for both thethirteen- and twenty-three-disk cases taper off at <50fans and twenty detectors/fan. This suggests that forimages with low spatial frequency content, such as theseGaussian functions, acceptable image quality is at-tainable with <100 fans. This conclusion has impor-tant implications on the cost of implementing laser to-mography systems for a wide variety of applications inwhich the expected images are well approximated byGaussians.
Figure 4 also shows that a single disk function as anapproximation to a Gaussian cloud provides a conser-vative bound on the error since the single disk error isgreater than that of the multidisk approximations. Asa result, we may use simple phantoms of only a few disksfor computation intensive runs. Similar simulationswith objects that are nearly circularly symmetric show
z0I-
Ua:
(nZ-o a
0 0
W w W
-J
LW
100
50
LASER COMPUTED ABSORPTION TOMOGRAPHYRECONSTRUCTION ERROR
* I CIRC (R) APPROXIMATIONTO A GAUSSIAN
x 13 CIRC (R) FUNCTIONS APPROXIMATIONTO A GAUSSIAN
^ 23 CIRC CR) FUNCTIONS APPROXIMATIONTO A GAUSSIAN
Xg
x 0* xX X X*
I.1: , , II , I II , I *I .I, .I ,
0 20 40 60 80 100 120 140NUMBER OF FAN VIEWS
160 180 200
Fig. 4. Reconstruction error vs number of fan views for three dif-ferent approximations to a Gaussian object.
1170 APPLIED OPTICS / Vol. 21, No. 7 / 1 April 1982
x
that one may often reconstruct such objects with anaccuracy of a few percent with 10 fans or less. The re-duced number of fans required for the reconstructionof such objects implies faster data taking and recon-struction times and the use of significantly simplifiedand less costly collection geometries.
C. Probe Depletion and Beam Tapering Artifacts
The geometric configuration of the virtual sourcescanner introduces the possibility of two new kinds ofartifacts. The first arises because the probe beam maybe selectively depleted on its way from the laser to thevirtual source. The magnitude of this error on picture
ol ~ ~ ~ ~~~I
.j~~~~~~~f.,: ! !, S .s~~~~~~~~~~~~~~~~~~~~~~~~~~~~~t . i-i: 700 E 0 :::~~~~~~~~~~~~~~~~~~~~~~~~ .*;.~r~fI L
U~~~~
(a) 4.k~, f i F
Swahili:~~~~~~1
I I~~~~~~~~a
I, I * ,,~~~~~~~~~~ ~ eecmu ictos
01 :. j~:~j, * 1H.
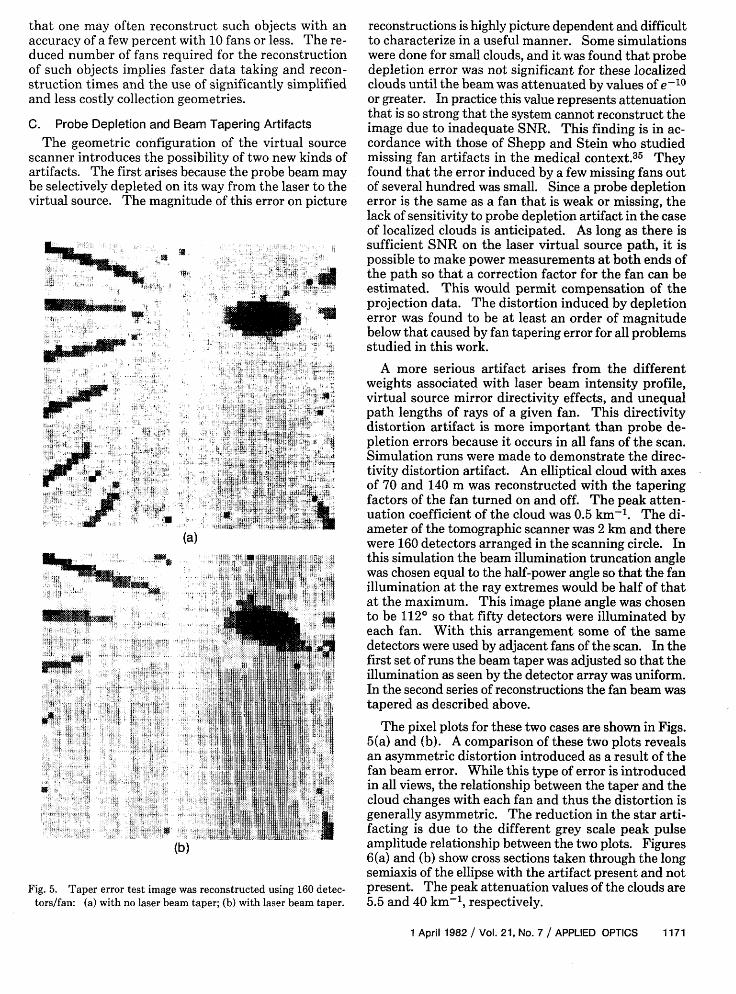
Fig. 5. Taper error test image was reconstructed using 160 detec-tors/fan: (a) with no laser beam taper; (b) with laser beam taper.
reconstructions is highly picture dependent and difficultto characterize in a useful manner. Some simulationswere done for small clouds, and it was found that probedepletion error was not significant for these localizedclouds until the beam was attenuated by values of e-10
or greater. In practice this value represents attenuationthat is so strong that the system cannot reconstruct theimage due to inadequate SNR. This finding is in ac-cordance with those of Shepp and Stein who studiedmissing fan artifacts in the medical context. 35 Theyfound that the error induced by a few missing fans outof several hundred was small. Since a probe depletionerror is the same as a fan that is weak or missing, thelack of sensitivity to probe depletion artifact in the caseof localized clouds is anticipated. As long as there issufficient SNR on the laser virtual source path, it ispossible to make power measurements at both ends ofthe path so that a correction factor for the fan can beestimated. This would permit compensation of theprojection data. The distortion induced by depletionerror was found to be at least an order of magnitudebelow that caused by fan tapering error for all problemsstudied in this work.
A more serious artifact arises from the differentweights associated with laser beam intensity profile,virtual source mirror directivity effects, and unequalpath lengths of rays of a given fan. This directivitydistortion artifact is more important than probe de-pletion errors because it occurs in all fans of the scan.Simulation runs were made to demonstrate the direc-tivity distortion artifact. An elliptical cloud with axesof 70 and 140 m was reconstructed with the taperingfactors of the fan turned on and off. The peak atten-uation coefficient of the cloud was 0.5 km-1. The di-ameter of the tomographic scanner was 2 km and therewere 160 detectors arranged in the scanning circle. Inthis simulation the beam illumination truncation anglewas chosen equal to the half-power angle so that the fanillumination at the ray extremes would be half of thatat the maximum. This image plane angle was chosento be 112° so that fifty detectors were illuminated byeach fan. With this arrangement some of the samedetectors were used by adjacent fans of the scan. In thefirst set of runs the beam taper was adjusted so that theillumination as seen by the detector array was uniform.In the second series of reconstructions the fan beam wastapered as described above.
The pixel plots for these two cases are shown in Figs.5(a) and (b). A comparison of these two plots revealsan asymmetric distortion introduced as a result of thefan beam error. While this type of error is introducedin all views, the relationship between the taper and thecloud changes with each fan and thus the distortion isgenerally asymmetric. The reduction in the star arti-facting is due to the different grey scale peak pulseamplitude relationship between the two plots. Figures6(a) and (b) show cross sections taken through the longsemiaxis of the ellipse with the artifact present and notpresent. The peak attenuation values of the clouds are5.5 and 40 km-', respectively.
1 April 1982 / Vol. 21, No. 7 / APPLIED OPTICS 1171

7
01
0U
Z
-
.,z
4
z
4
5.5
4.0
2.5
-0.5
-0.354 0 0.354
DISTANCE I KM)
(a)
(lo,-
4.0
3.0
2.0 -
1.0
0.0 -'
-1.0
-0.354 0DISTANCE (KM)
(b)
Fig. 6. Cross sections through the long axis of the ellipse of Fig. 5:(a) cross section through 5(a); (b) cross section through 5(b). Note
the large amplitude change due to laser beam taper.
We conclude that it is important to know the inten-sity characteristics of the laser, the mirror directivities,and the ray ranges so that the measurements may becorrected for ray tapering errors.
D. Detection Sensitivity
The purpose of this section is to find the minimumgas concentration that can be measured by the tomo-graphic scanner. The approach is to keep all systemparameters fixed except the amplitude of a very smallcloud which is simulated by a disk phantom. The am-plitude of the disk is lowered until it is deemed that thedisk is no longer visible in the detector noise. In thesereconstructions it is assumed that background noise inthe detector is the dominant statistical instability in thesystem.
In this series of runs a small cloud, 33 m in diameter,was imaged by a tomographic scanner with the sameillumination taper and geometry as that in the preced-ing section. The size of the cloud was chosen to satisfythe Nyquist sampling criterion in the projection data.As in the preceding section the effective reflectivity ofthe virtual source is 50% with a 10-cm collecting mirror.
In this case we use a 50-W cw laser operated at a 10.6-gm wavelength. These values are typical for an inex-pensive CO2 laser. We also assume that the detectorshave a moderate sensitivity with a NEP of 10-11 W/Hz1/2 and a bandwidth of 10 kHz.
The cw measurement is similar in concept to a pulsedmeasurement except the pulse width of the laser as seenby the detector is determined by the illumination timeof the virtual source. By a simple geometric argumentthe width of the pulse is tp = Wt8 /2rR, where t is thetime required for a complete scan of the laser, W is theangle subtended for the virtual source mirror as seenfrom the position of the laser source, and R is the dis-tance between the laser and the mirror. In the noisedriven simulations in this paper we set the scan rate sothat the specified bandwidth of the detector just re-solves the pulse. We require that tp = 2/B, where B isthe detector bandwidth. If we assume the values R =1 km, B = 104 Hz, and W = 10 cm, we get a total scantime of 12.6 sec which is well within the capabilities ofa mechanical beam rotating device.
The image reconstruction for a peak cloud attenua-tion amplitude of 10.0 km- is shown in Fig. 7(a). Ex-amination of other members of the ensemble for thissituation shows that the image defects in the recon-struction are due to deterministic errors intrinsic to theinversion process and not noise fluctuations. Thus weare in a high signal-to-noise regime. Figure 7(b) showsa reconstruction taken for a cloud amplitude of 0.005km-'. Many points in the reconstruction begin to ap-proach the cloud in intensity but it is still possible to seethe cloud. At an amplitude of 0.0025 km-' shown inFig. 7(c), it is quite difficult to separate the cloud fromthe background noise. The output signal-to-noisevaries between 1 and 10 over the picture, while the av-erage signal-to-noise of the input projections is -100.At this point we are on the borderline of usefulimaging.
The amplitude of the cloud is the product of Nu, thenumber density of the absorbing gas, and the absorptioncross section. The exponential factor for the caseshown in Fig. 7(c) is the cloud amplitude times the cloudwidth L. Its value for the case shown in Fig. 7(c) is0.008. In the infrared, the molecular absorption crosssections vary between 10-17 cm2 for fundamentaltransitions and 10-21 cm2 for overtone transitions.3 6
This implies that the range of minimum detectableconcentrations for the above system should lie between0.2 ppb and 2 ppm. Thus tomographic imaging is verysensitive which is an important feature in a number ofpotential applications.
E. Average Signal-to-Noise RatiosIn this section we discuss the spatial average signal-
to-noise ratios obtained for four different imagingconfigurations. Our purpose is to determine the inputpower required to produce a given picture SNR. Thesesimulations allow us to assess the realizability of thelaser tomographic system with currently available op-tics, lasers, and detectors. In each case the goal was to
1 172 APPLIED OPTICS / Vol. 21, No. 7 / 1 April 1982

see if each system could reconstruct a 100-m 10-km-1disk cloud in the same 2-km diam scanning geometryused in the previous section but with seventy andtwenty detectors/fan. In the first case, we consider acw laser system operating at 10.6 Aim with a directive fanbeam reflected from a mirror which acts as the virtualsource. The second case is also a cw 10.6-gm systemexcept the virtual source is a Lambertian reflector whichreflects the incident laser energy into 27r sr. The di-rectivity for such a beam is 2. The first case has a di-rectivity of 7900 so that a comparison of the two results
U -
(a)
(b)
(c)
Fig. 7. Sample realization from a 33-m diam cloud at various opticalabsorption densities: diagonal distance is 1 km; (a) cloud absorptionamplitude is 10 km-'; (b) cloud absorption amplitude is 0.005 km-I;
(c) cloud absorption amplitude is 0.0025 km-'.
shows the advantage of using a directive fan beam. Forboth cw laser source cases a detector of modest sensi-tivity is chosen with a NEP of 10-11 W/Hz1 2.
The third and fourth cases consider pulsed lasersources with directive virtual sources and Lambertianscatterers. The directivities are the same as those usedin the cw case mentioned above. The primary moti-vation is to see whether existing objects such as build-ings, trees, and hillsides could act as virtual sources. Ifsuch objects were available, the implementation cost ofthe tomographic system could be reduced.
In each of the four cases the simulation was run inMonte Carlo mode with 100 observations for each valueof the laser output power. Batch means were used toestimate the pixel and picture wide means and variancesused in the SNR calculations. The data were plottedagainst both the laser output power and the fan averageinput SNR at the detectors. The purpose here was tocompare the spatial average SNR of the image with thesignal-to-noise value of 100 which is accepted as a cri-terion for good imaging. We now look at the averagesignal-to-noise performance for four laser systems.
The power levels for the cw runs were chosen to bethose easily obtainable by cw CO2 lasers operating in the9-10-gm region. The pulse power levels are typical ofa Nd:YAG pumped tunable source such as a LiNbO3parametric oscillator system operating at 4 gim. Weassume in each case that we are imaging a 1-km diamarea by means of a virtual source detector array ar-ranged on the circumference of a 2-km diam circle.These results may be scaled to other conditions by usingEq. (19) as long as proper caution is observed in inter-preting the parameters. In short, these runs were de-signed to determine if it is possible to image with cw orpulsed lasers in a typical situation and if it is feasible toimage with inexpensive retroreflectors and receiver/detector optics.
The results for the fan beam cw laser are plotted inFig. 8(a). About 3 W of laser power is required toachieve the adequate signal-to-noise ratio. Since thereare CO2 lasers currently on the market which can gen-erate 50-100 W of cw power, we conclude that imagingover the distances of 1-2 km is possible with this system.A similar run was made with the power and directivityeach increased by a factor of 10 with the same cloud. Inthese conditions it is possible to image a 10-km diamcircle within a 20-km diam detector circle with an inputpower of 30 W for a spatial SNR in the image of 100.This is clearly the order of distance required for met-ropolitan air pollution monitoring applications. Itshould be pointed out that this is about the most we canexpect by increasing the directivity of the beam in thevertical direction because atmospheric turbulence limitsthe attainable beam divergence angle to values >0.1mrad.
Figure 8(b) shows the SNR for the Lambertian virtualsource case. At no place in the data is the SNR greaterthan 10. We conclude that it-is not possible to imageover the stated distance using a Lambertian source witha 30-50-W cw infrared source. However, simulationsof this type show that it is possible to image over much
1 April 1982 / Vol. 21, No. 7 / APPLIED OPTICS 1173

FAN AVERAGE PEAK PROJECTION SIGNALTO NOISE RATIO
.4 103 104 106
-
S
IL(t
C2
C
-
2
uJ
U
2
.I.-
-:4
0In
0*
10 2
10~~~~~~~~~~~
0.1 I 10 10
LASER OUTPUT POWER WATTS]
(a)I 10 100
0.1
0.010.1 1 10
LASER OUTPUT POWER [WATTS]
(b)
improvement factor lying between 105 and 108 com-pared to a distributed particulate retroreflector lidaror DIAL lidar measurement.
An additional improvement in directivity can beobtained by using more complicated virtual sources thatdirect radiation to one detector at a time rather than onefan at a time. For a very concentrated beam the di-rectivity D 41r/(0102), where 01 and 02 are the half-power beamwidths in the horizontal and vertical di-rections.3i As previously mentioned, atmosphericturbulence limits beam divergence angles to 0.1 mradfor the beamwidth so that D = 1.26 X 10⁹. This rep-resents an improvement of the order of 105 over the fanbeam tomographic system modeled above.
F. Systematic Random Variations
The preceding runs were predicted on the assumptionthat all statistical uncertainties were due to backgroundnoise. This neglects such problems as laser amplitudevariations as well as reflector and detector variations.Laser amplitude pulse variations in particular are aproblem due to the poor pulse stability of many lasers.
FAN AVERAGE PEAK PROJECTION SIGNALTO NOISE
,,_7 0 10 7 109
0
100
Fig. 8. Fan average SNR and tomographic reconstruction SNR vstransmitted laser power for a cw C02 laser source: (a) directive virtual
source; (b) Lambertian virtual source.
smaller distances such as those useful in combustiondiagnostics with cw laser sources and Lambertianscattering virtual sources.
Figure 9(a) shows SNR variation with input powerfor a pulsed laser with fan beam virtual source. Notethat we obtain a SNR of >104 for input peak powers >10kW. Since laser sources are available that can producepeak powers of 10 MW, it is apparent from the stand-point of background noise alone that there is no problemin using such a system for tomographic imaging for10-km diam image circles.
Figure 9(b) shows that with a pulsed source with1-MW peak power and Lambertian scattering it ispossible to obtain sufficient signal for successful imag-ing. This indicates that it is possible to utilize topo-graphic targets as virtual sources at a potential savingsin optical component and setup costs. In contrast withprevious lidar methods, laser tomography concentratesthe imaging radiation so that it is utilized efficiently. Inthe cases discussed in this section, tomography providesan improvement of the order of 103 over a remote re-troreflector lidar system. As determined by the dis-cussion in Sec. II, the tomography approach offers an
0
a loB
W
Cn0
z0I-
-i IO54
0
_1 - IIII I II TI 'I
.O4L
104
I-4 3By 103
cc02
v)
0I-_j 102
-CU,
10 IIC
Il 4, , ,
03 104 105 IC
LASER OUTPUT POWER [WATTS](a)
FAN AVERAGE PEAK INPUT PROJECTIONSIGNAL TO NOISE
102 0os 104a. . ... . . . .. , . . ...
-4 5
104 105
LASER OUTPUT POWER [WATTS](b)
16
Fig. 9. Fan average SNR and tomographic reconstruction SNR vstransmitted laser power for a pulsed laser source: (a) directive virtual
source; (b) Lambertian virtual source.
1174 APPLIED OPTICS / Vol. 21, No. 7 / 1 April 1982
_1
I , ., , .. " I I
II . I
I I I I I 1 .1 . . I I I .1. 1 . I . 11
I
I
f
E...I . . I I--- ,
D3

0
w
It
LI-
U)
0L)LO
Li
-Ju-I
LASER COMPUTED ABSORPTIONTOMOGRAPHY RECONSTRUCTION ERROR
00
50 F-
0 I 4 !
I 10 102 103 104
AVERAGE PROJECTION SIGNAL TO NOISE RATIO
Fig. 10. Laser tomography reconstruction error vs average projectionsignal-to-noise ratio.
In theory, this problem can be dealt with by eitherbuilding more stable laser sources or taking severalscans and averaging them.
In this section we simulate random fluctuations in theline integral measurement due to pulse amplitudevariations. Here we simulate such a fluctuation byadding a uniform noise sample to each line integralmeasurement. As an example of this type of study wereconstructed a circular disk cloud 100 m across and anamplitude of 10 km-' with the same collection geometryas in Sec. E. In this case the taper in the fan beam wasomitted, reflecting the assumption of uniform apodi-zation at the detector array.
Uniform random variations were added to the pro-jection data to simulate the desired fluctuations. Thefluctuation variances were scaled as a fraction of thepower incident on the array to facilitate the computa-tion of SNRs. The abscissa in Fig. 10 represents valuesof the reconstruction error at the pixel at the center ofthe phantom while the ordinate specifies the input SNRof the line integrals averaged over all the rays. ThisSNR was adjusted during the simulation by varying theoutput power of the laser. Figure 10 shows that theerror begins to rise for SNRs <80. This indicates that,for convolution-backprojection algorithms of the typestudied here, the systematic input fluctuations shouldbe held to a few percent to maintain reconstructionaccuracy.
In practice, laser fluctuation noise will dominate noisein line integral measurements arising from detector,background, and scintillation. In the case of scintilla-tion recent work37 has shown that previous theoreticalestimates of the magnitude of atmospheric scintillationwere overly pessimistic. This finding is supported bymany experimental lidar measurements where mean-ingful measurement accuracies were obtained withoutcorrecting for scintillation effects.38 In practice, it ispossible to nullify the effects of scintillation by doublepulsing the laser transmitter.3 9 Thus power fluctua-tions due to scintillation are not considered a seriouslimitation in the laser tomographic measurement.
Fortunately, there are several methods of reducingthe effects of random fluctuations. First, it is possibleto build laser sources with fluctuations of <2%. Second,it is possible to take several scans and average the re-sults, thus smoothing the input data which are thenapplied to the reconstruction algorithm. Fortunately,the requirement for real-time data acquisition for airpollution monitoring is minimal, a complete pictureevery few minutes is adequate in practice. Since acomplete scan can be taken in a few seconds, many scansmay be averaged to obtain a complete picture thus re-laxing other system variance requirements.
The convolution-backprojection algorithm is stablewith respect to changes in the assumed input noisedistribution for equal projection signal-to-noise ratios. 35
One might suspect, from the weak dependence of theoutput statistics on the input noise distribution that therequirement for the maintenance of reconstructionaccuracy stated above, that the input signal-to-noise ofthe projections >100:1 provides a design rule that isvalid for a wide variety of input noises. All the noisesimulations that have been run to date support this rulefor the convolution-backprojection algorithms used inthis study.
G. Imaging of Multicloud PhantomsThe previous simulations have used simple mono-
cloud phantoms. The model is capable of handling amore complicated class of images, however. In thissection an example of a reconstruction of a more com-plicated multicloud phantom is presented. Here weconsider three clouds which are approximated by a su-perposition of nine disks. A 6.30-km diam system im-ages an area of 3.15-km diam as before with uniformillumination across the detector array. A 500-W cwlaser is used as the primary energy source illuminatingdetectors with a NEP of 10-l W/Hz1 2 and a bandwidthof 10 kHz. Note that each pixel diagonal is -60 macross. The first cloud appears in the first quadrant asa superposition of two disks and is intended to showintermediate resolution capabilities. Each of theseclouds is circular with a 315-m diam and a 1.05-km'absorption amplitude. The second cloud is composedof two small partially overlapping circular disks with100-m diam and 1.6-km- 1 peak absorption amplitudes.This could be a model for a highly localized pollutionsource. The small cloud serves as a test of the resolu-tion of the reconstruction. The final artifact is com-posed of four 2.05-km-1 315-m diam clouds that arepartially overlapped. This configuration was designedto show the type of cloud that would be formed fromseveral point sources in close proximity. This behaviorwould be typical of emissions from several smokestackscombining into an area source.
In Fig. 11(a) we see a reconstruction for 20 fans. Inthis image we have assumed that pump depletion andbeam taper error are compensated but a 2% projectioninput noise -remains. Note that the star artifacts areclearly visible near the edges of the image. These couldlead to the erroneous conclusion that they are real pol-lution clouds.
1 April 1982 / Vol. 21, No. 7 / APPLIED OPTICS 1175

In Fig. 11(b) the same phantom is reconstructed witha 100-fan sampling density. The higher rotationalsampling rate has the effect of reducing the amplitudeof the star artifacts to the point where they are barelynoticeable. In addition, the reconstruction accuracyof the clouds is enhanced as is particularly evident in theintermediate sized cloud. In both reconstructions aseventy-element sampling array is assumed. This issufficient to produce resolution of the order of 180 m outof a resolution circle diameter of 3.15 km. Such spatialresolution over this range is quite impressive in com-parison with the DIAL lidar measurement approach.
¢I; ' ; I' td'' i
'W ~ ~ ~ ~ ~ ~~t
r~i (a)
8~~~~~~~~~~i: 'l I 4 ' 'I1:'
It~~~~~~~~~~~~~~~~~~~~~~~~~~~~~~~~~~~~~~~~I
iP~~~~~~~~~~~~I
. Multicloud reconstructiontest: (a) seventyFig.1 t. detectors and - : fans
twen i.:Ty fan; (b one hundred -de tecor and one hunre fans.tX:--: 0 ) ; ;:l
We see that it is possible to obtain spatial resolutionthat is more than sufficient at the relatively low cost ofseventy line integral measurements rather than thethousands of such measurements that are used inmedical practice. This finding is important because ofthe reduced system complexity that it implies. Inmedical tomography it is possible to reuse the detectorarray in each fan of the scan. In the virtual sourcescheme this is not possible because the detector arrayis fixed. If the resolution requirements of pollutionmonitoring were equal to those of medical practice, ofthe order of 104 rays, the construction costs and lowreliability of such a system would be prohibitive. Wehave seen that reconstruction with sufficient resolutionand sensitivity can be obtained with a few hundred line-integral measurements which results in lower costs,reduced system complexity, and less computer recon-struction time than would otherwise be the case.
VI. ConclusionIn conclusion we summarize the important points
learned from this investigation. First we note that airpollution monitoring requires much lower spatial res-olution than medical applications. In medicine, theprimary problem is usually one of detecting small tu-mors situated in complex organ structures and hencefine resolution is emphasized. In the pollution moni-toring application, the primary demand is for gridspacings commensurate with the capabilities of mi-crometereorological models. Since spacings of hun-dreds of meters over ranges of tens of kilometers aremore than sufficient for this purpose, we have seen thatarrays of one hundred detectors or so provide sufficientresolution for this application. Current air pollutionmonitoring grids consist of fixed stations spaced kilo-meters apart. A coarse tomographic grid of the kinddiscussed here would bring a tenfold increase in reso-lution capability. Such a spacing would provide moreuseful data that would support microclimatologicalmodels.
In the case where a nearly circularly symmetric objectis imaged, acceptable image quality may be obtainedwith fewer than ten views. This conclusion is inde-pendent of whether virtual source or conventional to-mography is employed. This implies that tomographicimaging of flames and nozzle flow situations may bedone successfully with relatively few detector ar-rays.
4 0'41
Another important advantage of laser tomographyis that measurements can be made over larger ranges orwith a large signal-to-noise advantage over currenttechniques. We have demonstrated that ranges of upto 20 km are possible with currently available com-mercial lasers, detectors, and optics, depending on at-mospheric burden. Such ranges are beyond the capa-bilities of direct detection DIAL systems operating atacceptable transmitted laser energies. Even betterperformance is expected if virtual sources are used thatfocus all the incident radiation into one ray at a timerather than one fan at a time. We have shown that itis possible to do virtual source tomography with pulsed
1176 APPLIED OPTICS / Vol. 21, No. 7 / 1 April 1982

sources by using available topographic features in placeof the virtual source mirrors. It is worth noting that thiskind of signal-to-noise performance indicates an ad-vantage of applying laser tomographic techniques tolaboratory sized problems as well.
We have noted that the performance of distributedreflector lidar systems decreases with increasingwavelength due to the reduced scattering efficiency.Laser tomography has a definite advantage because theresolution attained by the system is dependent solelyon the number and arrangement of the projectionmeasurements. If the system utilizes several sourcesin order to measure many different pollutants, all themeasurements can be made with the same spatial res-olution permitting the construction of pollution mapswith the same resolution for all monitored species. Thisis not the case for DIAL measurements due to the needto use larger resolution cells with increasing wave-length.
The simulations point out the possibility of imagedistortion from two types of measurement error. Thefirst type of error occurs because the pollution -cloudmay intercept the beam on its way from the laser sourceto the virtual source. This distortion may be minimizedby using a sufficient number of fans and measuring thelaser power at the virtual source site so that a correctionmay be applied. The second source of error arises fromthe transverse variations in the laser beam intensity.This type of distortion may also be remedied by one oftwo schemes. One could conceive of designing the beamforming optics to provide uniform illumination of thedetector field. This approach would probably be dif-ficult to design and keep in alignment. The secondtechnique involves tuning the laser off the absorptionline as in a regular DIAL measurement and measuringthe taper directly at the detector array so that the valuesmay compensate in the computer prior to reconstruc-tion. This method has the advantage of simplicitybecause it eases the design constraints on the virtualsource optics.
The signal-to-noise simulations indicate that, for theranges discussed here, background noise is much lessimportant than other random variations in system pa-rameters. As in the DIAL case, the effects of theserandom disturbances can be minimized by signal av-eraging and proper system design. Experience fromthese simulations also points out the need to restrict thefluctuations in the input projections to <5% in order tomaintain reconstruction accuracy. For the usual con-volution-backprojection algorithms the problem offluctuations and taper errors suggests that the imple-mentation of a practical system will be largely concernedwith the elimination of these fluctuations.
The advantages of laser tomography do not implythat tomography will completely replace DIAL lidarmeasurements. DIAL has the advantage that it iscomparatively compact and can be placed in vehiclessuch as vans and aircraft. Its short range capabilitiesare not a handicap in local applications as stack moni-toring. In fact, DIAL complements wide area moni-toring provided by optical computed tomography. For
example, a laser tomography system could provide alocal control board with information for area inventorieswhile mobile DIAL systems could be sent to problemareas on a short time basis.
We would like to acknowledge Lawrence Shepp forvaluable discussions on the topic of this paper and onthe subject of tomography in general. We also thankDavid Lu and Warren Corey of the Stanford DigitalSystems Laboratory for their ideas and code contribu-tions to the simulator. We also would like to thankRobert Mackenzie of the NASA/Ames Research Centerfor the time made available on the Ames CDC 7600computer system under contract NSG 2289 and the AirForce Office of Scientific Research for financial aidunder contract F4920-77-C-0092.
References1. G. N. Hounsfield, Br. J. Radiol. 46,1016 (1972).2. A. M. Cormack, J. Appl. Phys. 34, 2722 (1963).3. P. A. Schlosser, A. C. DeVuano, F. A. Kulaki, and P. Munshi,
IEEE Trans. Nucl. Sci. NS-27, 788 (1980).4. K. A. Dines and R. J. Lytle, Proc. IEEE 67,1065 (1979).5. P. J. Emmerman, R. Goulard, R. J. Santoro, H. G. Semerjian, J.
Energy 4, No. 2, 70 (1980).6. R. J. Santoro, H. G. Semerjian, P. J. Emmerman, and R. Goulard,
"Optical Tomography for Flow Field Diagnostics," AIAA Paper,80-1541, Snowmass, July 1980.
7. R. L. Byer and L. A. Shepp, Opt. Lett. 4, 75 (1979).8. D. C. Wolfe and R. L. Byer, "Air Pollution Monitoring by Com-
puted Tomography," in Proceedings, Computer Software andApplications Conference, Chicago, Nov. 1979 (IEEE, New York,1979), pp. 867-870.
9. D. C. Wolfe and R. L. Byer, "Modeling Studies for OpticalComputed Tomography," at Conference on Laser Engineeringand Applications, Washington, D.C., 30 May-1 June 1979.
10. D. C. Wolfe and R. L. Byer, "Laser Computed Tomography Ab-sorption," paper presented at the Ninth International LaserRadar Conference, Munich, Germany, July 1979.
11. D. C. Wolfe, "On the Application of Optical Computed Tomog-raphy to Remote Air Pollution Measurement," Ph.D. Thesis,Stanford U., May 1980.
12. H. Kildal and R. L. Byer, Proc. IEEE 59, 1644 (1970).13. R. L. Byer and M. Garbuny, Appl. Opt. 12, 1496 (1973).14. M. L. Wright, E. K. Proctor, L. S. Gasiorck, and R. M. Liston, "A
Preliminary Study of Air Pollution Measurement by Active Re-mote Sensing Techniques," Final Report, SRI Project 1966,contract NAS 1-1167, prepared for NASA Research Center,Hampton, Va., 1975.
15. H. Inaba, "Detection of Atoms and Molecules by Raman Scat-tering and Resonance Fluorescence," in Laser Monitoring of theAtmosphere, E. D. Hinkley, Ed. (Springer, New York, 1976),Chap. 5, pp. 153-236.
16. P. B. Russell, W. Viezee, and R. D. Hake, Jr., "Lidar Measure-ments of Stratospheric Aerosols over Menlo Park, California: Oct.1972-Mar. 1974", Final Report to NASA SRI Project 2217.
17. R. L. Byer, "Remote Detection of Air Pollutants," at Conferenceon Laser Engineering and Applications, Washington, D.C., May1977.
18. R. L. Byer, "Infrared Lidar Absorption Measurements in theAtmospheric," paper presented at the Sixth FACSS Conference,Philadelphia, Pa., Sept. 1979.
19. H. J. Scudder, Proc. IEEE 66, 628 (1978).
1 April 1982 / Vol. 21, No. 7 / APPLIED OPTICS 1177
20. Z. H. Cho and J. R. Burger, IEEE Trans. Nucl. Sci. NS-24, 886(1977).
21. A. C. Kak, Proc. IEEE 67,1245 (1979).22. M. Goitein, Nucl. Instrum. Methods 101, 509 (1972).23. R. N. Bracewell, Aust. J. Phys. 9, 198 (1956).24. P. F. C. Gilbert, J. Theor. Biol. 36,105 (1972).25. G. N. Hounsfield, "A Method of Apparatus for Examination of
a Body by Radiation such as X-ray or Gamma Radiation," ThePatent Office, London, Patent Specification 1,283,915 (1972).
26. R. Gordon, R. Bender, and G. T. Herman, J. Theor. Biol. 29,471(1970).
27. J. Radon, Ber. Verh. Saechs. Akad. Wiss. Leipzig Math. Phys. K1.9, 262 (1917), in German.
28. G. T. Herman and A. Naparstek, SIAM (Soc. Ind. Appl. Math.)J. Appl. Math. 33, 511 (1977).
29. L. A. Shepp and B. A. Logan, IEEE Trans. Nucl. Sci. NS-21, 21(1974).
30. E. J. McCartney, Optics of the Atmosphere (Wiley, New York,1976), Chap. 1.
31. J. D. Kraus, Antennas (McGraw-Hill, New York, 1950), Chap.2.
32. R. M. Gagliardi and S. Karp, Optical Communications (Wiley,New York, 1976).
33. S. L. Wood, "A System Theoretic Approach to Image Recon-struction," Stanford U. Dissertation, May 1978.
34. W. M. Newman and R. F. Sproull, Principles of InteractiveComputer Graphics (McGraw-Hill, New York, 1979), Chap.13.
35. L. A. Shepp and J. A. Stein, "Simulated Reconstruction Artifactsin Computerized X-ray Tomography," in Reconstruction To-mography in Diagnostic Radiology and Nuclear Medicine, M.M. Ter Pogossian et al., Eds. (University Park Press, Baltimore,Md., 1977).
36. G. Herzberg, Infrared and Raman Spectra (Van NostrandReinhold, New York, 1945).
37. S. F. Clifford and S. Wandzura, Appl. Opt. 20, 514 (1981).38. R. L. Byer and M. Endemann, "Remote Measurements of Trace
Species in the Troposphere," paper presented at the NineteenthAIAA Aerospace Sciences Meeting, 12-15 Jan. 1981, St. Louis,Mo.
39. N. Menyuk and D. K. Killinger, Opt. Lett. 6, 301 (1981).40. R. N. Bracewell, Fourier Transform and Its Applications
(McGraw- Hill, New York, 1978), Chap. 12.41. E. L. Hall, Computer Image Processing and Recognition (Aca-
demic, New York, 1979), Chap. 5.
COURSE TITLE:
COURSE TOPICS:
CONTACT:
COURSE LENGTH:
DATES:
Laser Fundamentals and Systems
Basic elements of a laser, power and wavelength measurements,optical amplifiers and gain, three and four level lasers,optical cavity and mode structure, characteristics of lasermirrors, oprical cleaning methods, laser calculation work-shops, analysis of seven specific lasers and survey ofcommercial laser systems.
ENGINEERING TECHNOLOGY, INC.PO Box 9000Waco, Texas 76710(817) 772-0082
5 DaysCost $650.00
June 21-25, 1982 (Washington, DC)
CONTINUING EDUCATION UNITS: 3 CEU's
1178 APPLIED OPTICS / Vol. 21, No. 7 / 1 April 1982
-