model to metal reconciliation: delivering on...
TRANSCRIPT
Model to Metal Reconciliation: Delivering on Promises Marcelo Godoy, PhD
Montreal, 11 September 2014
Purposes
2
Improve reliability of business plans
Comply with Reserve reporting requirements
Explain of business plan variances
Continuous improvement
Identify issues at critical points
Build a more profitable business

The need for reconciliation
Reconciliations should be consistently monitored over time.
Even a successful predictive approach can deteriorate due
to changes in geology, ore type, sampling procedures, grade
control methods, mining methods, milling controls,
personnel, etc.
Lack of systematic reconciliation means that there are no
controls to monitor the predictions, and to moderate
expectations
This may result in non-optimal use of the resource, pressure
on the mining team, profit objectives not being met and
unhappy shareholders.

Outcomes of a robust reconciliation system
Recognition of trends can provide insight into how the current
predictions may become realized during future production
It is useful to know that the mill is receiving the predicted ore at a
lower than expected grade, even while there is still uncertainty as to
whether this is due to problems with:
ore reserve (due to data, interpretation or estimation)
grade control (due to similar errors plus ore loss and dilution)
mining (due to deviations from the plan), and / or
milling (due to sampling errors or losses)
Similarly it is useful to know that production is exceeding predictions
since this may mean the grade control process, the mine plan and
the revenues are all suboptimal.
Basic reconciliation procedures
A simple scientific approach should enable a robust reconciliation
method to be quickly developed. The essential steps are:
1. Establish an audit trail for all data
2. Agree to report results routinely in a consistent format and ensure
that there are cross-functional reconciliation meetings in place to
discuss results and develop action plans
3. Collect and tabulate the data
4. Report variations based on consistent volumes (bench by bench,
stope by stope) or periods (monthly, quarterly, annually)
5. Graph the variations (or factors) for each parameter to determine
trends
6. Analyse and explain the differences
7. Alter the input parameters systematically to reduce future
reconciliation differences
F1, F2 and F3
Mine call factors and mill call factors have been used
in many mines without any clear systematic definition.
Harry Parker (2012) has provided a solution to many
of the reconciliation problems, since by his
definitions…

Relationship between factors
F1=GRADE CONTROL (PRODUCTION)
ORE RESERVE (PREDICTION)
and
F2=MILL (PRODUCTION)
GRADE CONTROL (PREDICTION)
and
F3=MILL (PRODUCTION)
ORE RESERVE (PREDICTION)
Therefore F3 = F1 ∗ F2.

Inputs to the Reconciliation Factors
Resource / Reserve
Model
Grade Control
model
Processing
Crushing
Mining and
Stockpiling
Oreblock / Stope
design
F1
F1b
F1a
F2a
F3
F2
F2c
F2b
Inputs:
Resource model
Exploration data
Original topography
Mining surface (start)
Mining surface (end)
Inputs:
GC model
GC data
Inputs:
Ore block polygons
Stope design
Assigned grades Inputs:
Haulage records (source,
destination, tonnes, material
type)
Opening stocks
Closing stocks Inputs:
Shift by shift crushing
records (Source,
material type, tonnes,
moisture)
Opening and closing
stocks Inputs:
Shift by shift processing
records(tonnes, moisture,
head grade, recovery)
Opening and closing circuit
stocks
Bullion measurements
Shaw, W.J., Weeks, A., Khosrowshahi, S., Godoy M. 2013. Reconciliation – Delivering on Promises. 36th APCOM Applications
of Computers and Operations Research in the Mining Industry, Porto Alegre, Brazil

Example of an F1 reconciliation
More ore tonnes at the expected grade
More ore tonnes at lower grade

Mine plan compliance
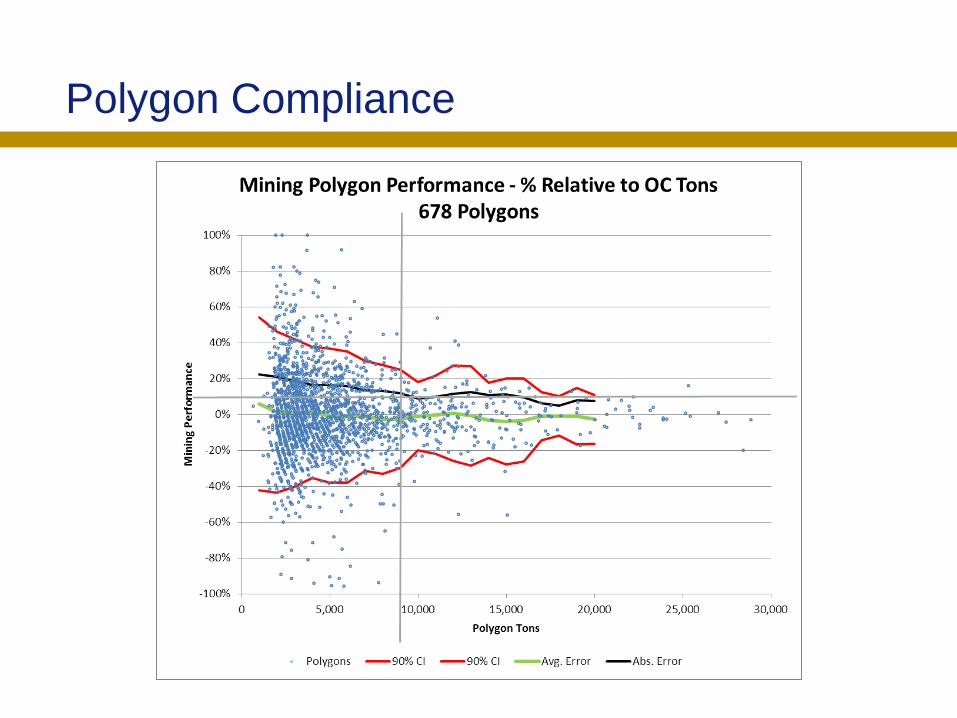
Polygon Compliance

Advantages of a good reconciliation process
Once problems have been highlighted solutions can be
considered. Typical examples are:
Problems Solutions
Cannot achieve reserves Compare mapping x geological model
Tonnage is too high Examine moisture content
Tonnage is too low Examine bulk density
Mill has less ore than mining Check stockpiles and weightometers
Mill has lower head grades Check circuit sampling and tailings.

Sampling errors Estimation errors Boundary definition
Mining selectivity Blast movement
Possible contributors to F1 variances

Traditional ore control process
Grade control
data
Digline generation
assuming error
free estimates
Error free data is
assumed
OK
ID2
Grade
Estimation
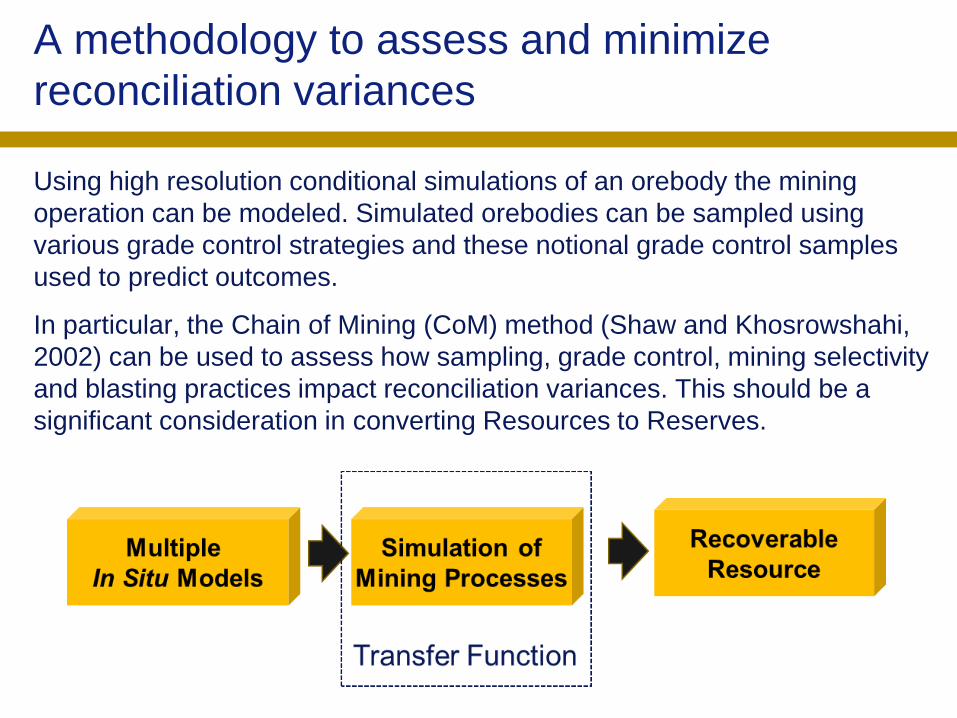
A methodology to assess and minimize
reconciliation variances
Using high resolution conditional simulations of an orebody the mining
operation can be modeled. Simulated orebodies can be sampled using
various grade control strategies and these notional grade control samples
used to predict outcomes.
In particular, the Chain of Mining (CoM) method (Shaw and Khosrowshahi,
2002) can be used to assess how sampling, grade control, mining selectivity
and blasting practices impact reconciliation variances. This should be a
significant consideration in converting Resources to Reserves.

Blasting Digline
Optimization GC Data Sampling
Errors
The Chain of Mining method
Reference
CoM produces recoverable resource models of tonnes
and grade which can be used to assess risk.
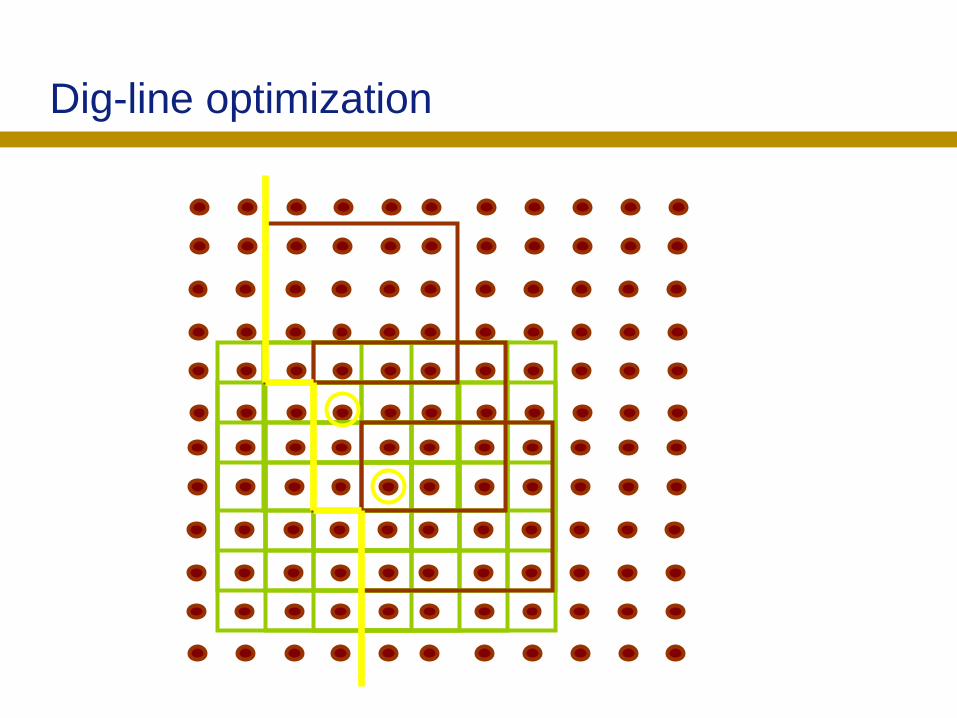
Dig-line optimization

Sim #1 Sim #2 Sim #3
Collection of
boundaries produce
probability of
boundary of mining
Sim #4
Sim #n
Dig-line optimization

Modelling the impact of blasting
Lateral
displacement
Vertical
heave GC Model Result

Case Study: Escondida
Khosrowshahi, S., Shaw, W.J. and Yeates, G., 2005, Quantification of risk
using simulation of the Chain of Mining - a case study on Escondida Copper.

Simulated models

Sampling error
Escondida: Blast hole field repeats
0
1
2
3
4
5
0 1 2 3 4 5
CuT_MEL
Cu
T_
GG
Low sampling and
assaying precision error
CuT: BH vs RC &D (4 4 2m search)
0
1
2
3
4
5
0 1 2 3 4 5
B_CUTR
D_
CU
T
High sampling and
assaying precision error
Precision of 9.2% demonstrated by
289 field repeats
Precision of 40.9% demonstrated by
633 paired Blast Hole and Resource
Hole samples

Mining Selectivity
Impact of different selectivity on digline optimization
Waste
HG oxide
MG oxide
HG sulphide
MG
sulphide
LG sulphide
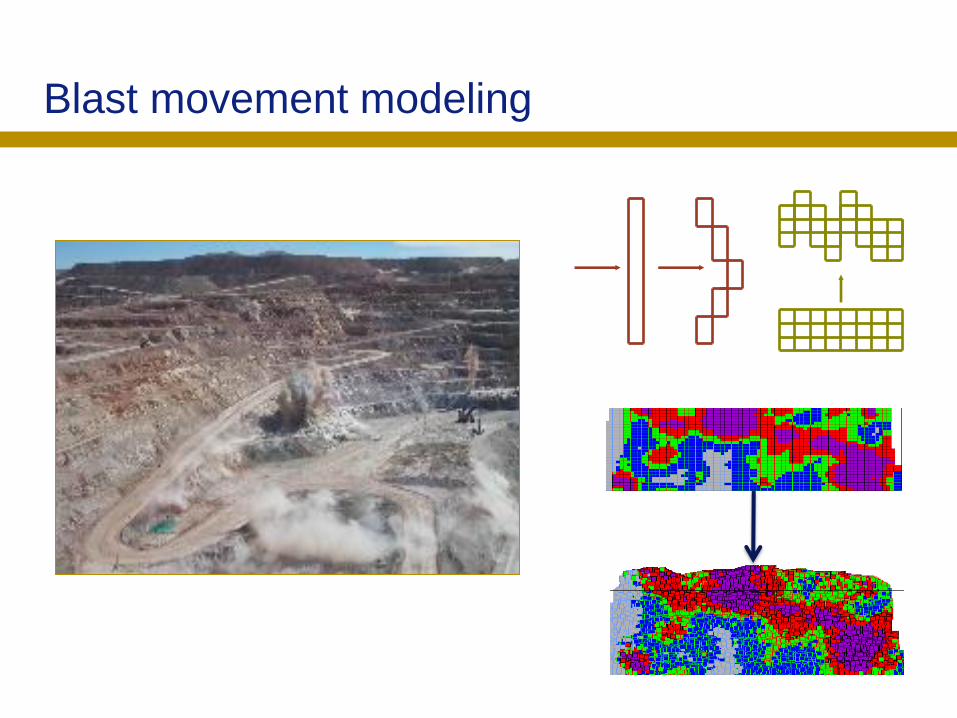
Blast movement modeling
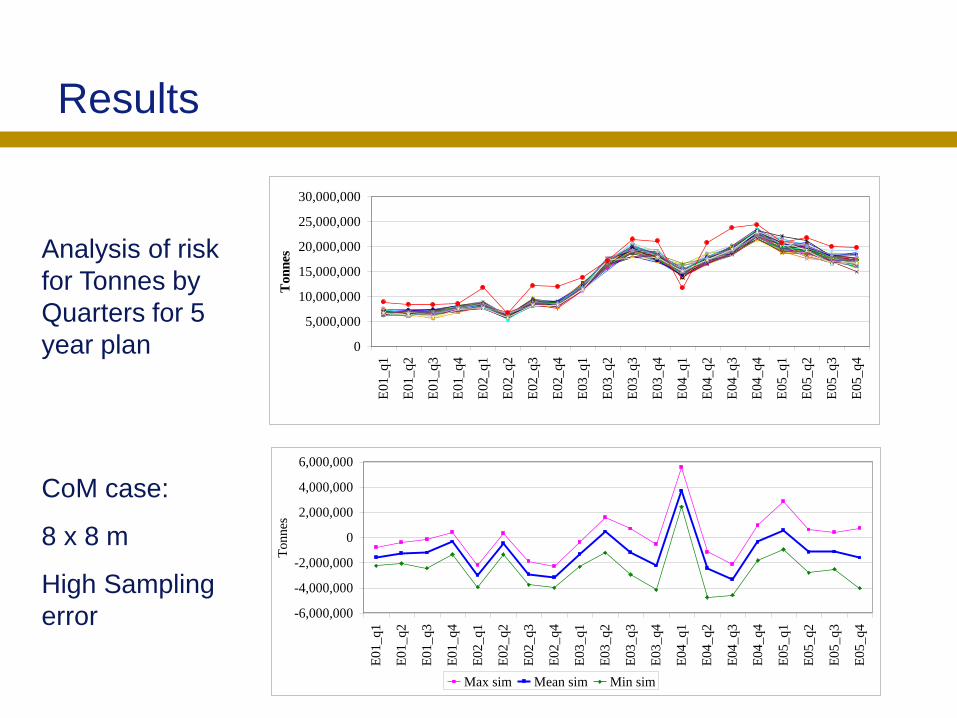
Analysis of risk
for Tonnes by
Quarters for 5
year plan
CoM case:
8 x 8 m
High Sampling
error
0
5,000,000
10,000,000
15,000,000
20,000,000
25,000,000
30,000,000
E01_q1
E01_q2
E01_q3
E01_q4
E02_q1
E02_q2
E02_q3
E02_q4
E03_q1
E03_q2
E03_q3
E03_q4
E04_q1
E04_q2
E04_q3
E04_q4
E05_q1
E05_q2
E05_q3
E05_q4
Ton
nes
0
5,000,000
10,000,000
15,000,000
20,000,000
25,000,000
30,000,000
E01_q1
E01_q2
E01_q3
E01_q4
E02_q1
E02_q2
E02_q3
E02_q4
E03_q1
E03_q2
E03_q3
E03_q4
E04_q1
E04_q2
E04_q3
E04_q4
E05_q1
E05_q2
E05_q3
E05_q4
-6,000,000
-4,000,000
-2,000,000
0
2,000,000
4,000,000
6,000,000
E01_q1
E01_q2
E01_q3
E01_q4
E02_q1
E02_q2
E02_q3
E02_q4
E03_q1
E03_q2
E03_q3
E03_q4
E04_q1
E04_q2
E04_q3
E04_q4
E05_q1
E05_q2
E05_q3
E05_q4
Tonnes
Max sim Mean sim Min sim
Results
Conclusions
A robust reconciliation system enables:
The total mining operation to be seen in context
Major problems and sources of error to be
identified
Both underestimation and overestimation to be
critically monitored improvements to be tested and
evaluated
Reporting to management and communication to
shareholders to be clear and consistent

Conclusions
The Chain of Mining method…
Is a uncertainty based method to evaluate
recoverable reserves and production expectations
Allows for reliable predictions of mining outcomes
Provides estimates that include the impact of ore
control and mining practices
Implicitly uses local orebody morphology to define
ore loss and dilution