modeling americans’ autonomous vehicle preferences: a ... · 13 unaffordable while private sav...
TRANSCRIPT
1
2
3
4
5
6
7
8
9
10
11
12
13
14
15
16
17
18
19
20
21
22
23
24
25
26
MODELING AMERICANS’ AUTONOMOUS VEHICLE PREFERENCES: A FOCUS
ON DYNAMIC RIDE-SHARING, PRIVACY & LONG-DISTANCE MODE CHOICES
Krishna Murthy Gurumurthy
Department of Civil, Architectural and Environmental Engineering
The University of Texas at Austin
Kara M. Kockelman*, Ph.D., P.E.
Professor and Dewitt Greer Centennial Professor of Transportation Engineering
Department of Civil, Architectural and Environmental Engineering
The University of Texas at Austin – 6.9 E. Cockrell Jr. Hall
Austin, TX 78712-1076
Presented at the 98th Annual Meeting of the TRB, Washington, D.C., January 2019 and published in Technological Forecasting and Social Change 150 (2019).
ABSTRACT
Rapid advances in technologies have accelerated the timeline for public use of fully-automated
and communications-connected vehicles. Public opinion on self-driving vehicles or AVs is
evolving rapidly, and many behavioral questions have not yet been addressed. This
study emphasizes AV mode choices, including Americans’ willingness to pay (WTP) to ride
with a stranger in a shared AV fleet vehicle on various trip types and the long-distance travel
impacts of AVs. Exactly 2,588 complete responses to a stated-preference survey with 70
questions provide valuable insights on privacy concerns, safety and dynamic ride-sharing
with strangers, long-distance travel and preferences for smarter vehicles and transport
systems. Two hurdle models (which allow for a high share of zero-value responses) were
estimated: one to predict WTP to share a ride and another to determine WTP to anonymize
location while using AVs, and a multinomial logit was developed to estimate long-distance mode
choices with AVs and SAVs available. Results suggest that WTP to share rides will rise over
time, for a variety of reasons, and SAV use will be
27
particularly popular for long-distance business travel. Elasticity estimates suggest that privacy may 28
not be an important concern for AV-based travel. 29
Keywords: Autonomous vehicles, shared, dynamic ride-sharing, travel behavior survey, 30
willingness to pay, mode choice, privacy. 31
MOTIVATION 32
Roughly 30 U.S. states have already passed legislation relating to fully automated, or autonomous, 33
vehicles (AVs) and a federal law is underway (Stocker and Shaheen, 2019). Several companies, 34
like Waymo, Lyft, and Ford Motor Company are testing AVs on public roads. With increasing 35
access to these vehicles, the public opinions regarding vehicle automation and AVs are evolving 36
rapidly. Past studies suggest that AVs are becoming more acceptable over time and may be a real 37
mode option for use in the relatively near future (see, e.g., Vujanic and Unkefer, 2011; Schoettle 38
and Sivak, 2014; Bansal and Kockelman, 2018). Sommer (2013) reported that around half of 39
Americans were concerned about riding in an AV, even though they admitted to the technology’s 40
many benefits, and this view was supported by respondents’ answers in Schoettle and Sivak’s 41
(2014) survey. Another U.S. survey, by Kelly Blue Book (2016), suggests that respondents 42

Gurumurthy and Kockelman 2
believed conventional vehicles are still safer than AVs – at least for the time-being. Schoettle and 1
Sivak’s (2016) second AV survey revealed similar reactions, with more than 35% of U.S. 2
respondents very concerned about AVs, and partial autonomy less feared. Deloitte (2014), MIT 3
AgeLab (Abraham et al., 2016), Bansal and Kockelman (2018), Lee et al. (2017), Krueger et al. 4
(2016), Haboucha et al. (2017), and Lavieri et al. (2017) have all concluded from their surveys that 5
younger people are more likely to use AVs. Demographic evolution encompassing entire nations 6
(like population aging) is also important to consider, when anticipating the future use and adoption 7
of advanced transport technologies. Until AVs are widely available in showrooms, at reasonably 8
affordable prices, there will be regular fluctuations in public perceptions in any country or setting. 9
Thus, regular survey efforts, and better surveys, with greater nuance, can make valuable 10
contributions to transportation planning, policymaking, and vehicle production decisions. 11
Ride-sourcing is a pre-arranged or on-demand form of mobility arranged via smartphone 12
applications (Stocker and Shaheen, 2017). Ride-sourcing demand and supply have risen over time, 13
especially in dense settings like San Francisco (SFMTA, 2015). Real-time or dynamic ride-sharing 14
(DRS) is becoming popular as a new form of carpooling. DRS is offered by ride-sourcing 15
companies (via, for example, uberPool and Lyft Line), and travelers share rides with strangers in 16
order to lower costs. Many recent studies illuminate the operational benefits of DRS (see, e.g., 17
Agatz et al., 2010; Bischoff et al., 2016; Fagnant and Kockelman, 2018; Loeb et al., 2018; Farhan 18
and Chen, 2018; Gurumurthy and Kockelman, 2018; Gurumurthy et al., 2019). Since AVs will be 19
expensive to acquire for personal use (Fagnant and Kockelman, 2015), a shift towards shared AVs 20
(SAVs) and DRS is likely. 21
Greenblatt and Shaheen (2015) conducted a study on AVs and their synergy with on-demand 22
mobility, such as ride-sourcing and DRS, and concluded that many energy and emission benefits 23
arise from fusing the services, but provide no quantifiable result on user’s willingness to share 24
rides (with strangers) to acquire those benefits. Bansal and Kockelman (2018) estimated SAV use 25
for different pricing levels, with respondents unwilling to use SAVs at the time, but did not 26
consider DRS. Quarles and Kockelman (2018) estimated that 16% of Americans are willing to 27
share rides with strangers by paying about 40 percent less (e.g., 60 ¢/mile rather than $1 per mile 28
of SAV use). However, travelers’ reactions to different vehicle response times and wait times has 29
not been carefully investigated. Detailed DRS investigations are few. A recent Swiss stated-30
preference survey by Stoiber et al. (2019) reveals that SAVs with DRS are likely to be more 31
popular than privately-owned AVs. Comfort, cost and travel time characteristics of SAVs with 32
DRS are expected to help increase use. Krueger et al. (2016) captured certain nuances by modeling 33
a discrete choice decision between SAVs without DRS, SAVs with DRS and a respondent-specific 34
travel alternative. They concluded that DRS is a preferred option among young people and people 35
who regularly use carsharing services, and service parameters (like response times) can impact 36
these preferences. Lavieri and Bhat (2019) corroborated this finding using data from the Dallas-37
Fort Worth area, with their results showing travel delays impacting the share-ride decision much 38
more than the notion that one is traveling with a stranger. They note the importance of trip type on 39
willingness to share rides, with commute trips more likely to be shared and an average 50¢/mi 40
willingness to pay to avoid sharing. 41
Americans are increasingly concerned about the use of personal information. Smartphone GPS can 42
record the user’s locations, and internet-related services curate advertisements specific to each 43
user. Such concerns may be exacerbated with AV cameras and cell connectivity (Schoettle and 44
Sivak, 2014). For example, SAVs may rely on facial recognition to confirm pickup and dropoff. 45
Gurumurthy and Kockelman 3
Existing work on related public opinions remains weak: e.g., what are people willing to pay for 1
privacy-enforcing measures? This survey paper tackles such questions. 2
Related to this, automation can pose ethical dilemmas. Bonnefon et al. (2016) and Goodall (2017) 3
believe that public opinion must be considered in crash-response programming and the like. 4
Jenkins (2016) and Lin (2017) described several possible outcomes of an inevitable crash scenario, 5
and Fleetwood (2017) censured algorithms that teach AVs to choose targets by force, arguing that 6
they should not be readily allowed for public use. However, the public perception of what is most 7
ethical in crash response contexts, and other situations, like who is to blame for a computer’s 8
decision or criteria to pass to be allowed to use SAVs, is yet to be determined. This paper’s survey 9
adds new questions and public opinions to that discussion. 10
Finally, the long-distance (LD) travel implications of AVs are an important consideration. 11
LaMondia et al. (2016) introduced AVs as new mode for LD trips originating in Michigan to 12
understand changing mode shares and found a decline in air travel as a possibility, with mode share 13
being lost to AVs. Bansal and Kockelman (2017, 2018) suggested that LD-trip frequency may well 14
double, and Perrine et al. (2019) predict major losses (on the other of 50%) in U.S. airline revenues 15
(for domestic trips), long term, once AVs are widely available. Huang et al. (2019) used a 16
traditional travel demand model with destination and mode choices in order to anticipate shifts in 17
travel patterns from conventional modes to SAVs and autonomous trucks. While these studies 18
probe into system aggregate impact for LD trips, modeling effort to capture primary influential 19
factors in LD trip making are not entirely captured. Questions probing actual Americans on these 20
topics and factors that are tied into developing trends can then be modeled to better understand LD 21
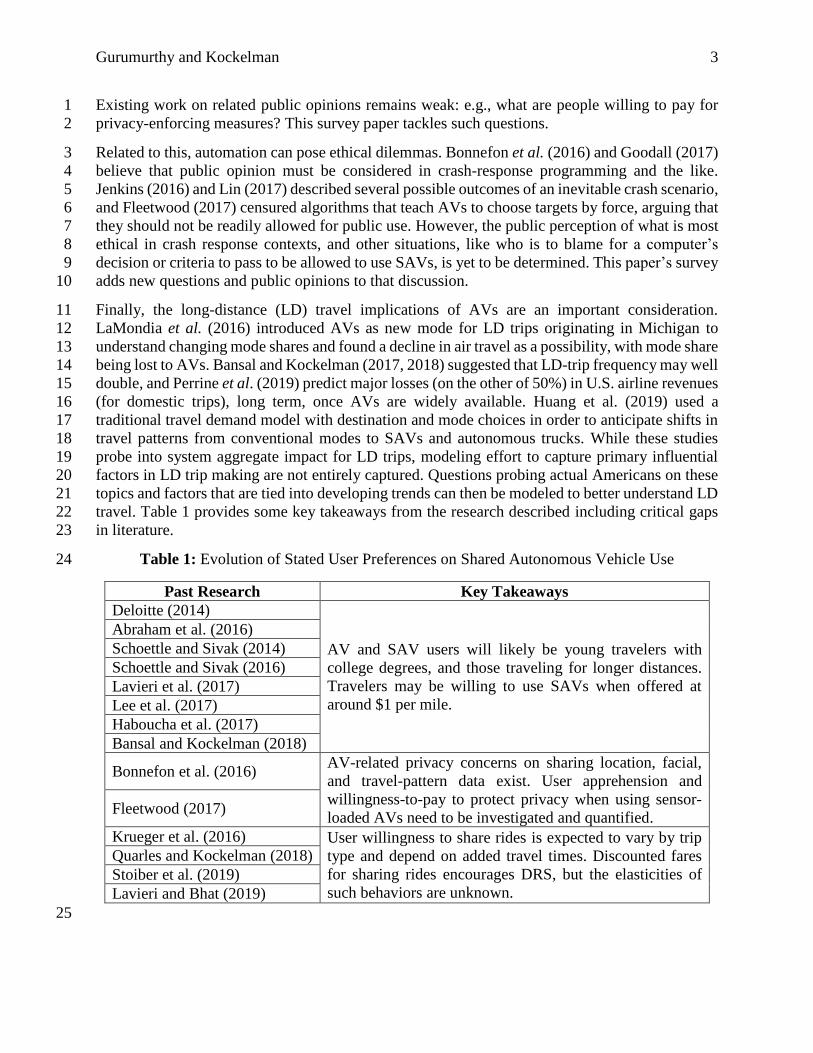
travel. Table 1 provides some key takeaways from the research described including critical gaps 22
in literature. 23
Table 1: Evolution of Stated User Preferences on Shared Autonomous Vehicle Use 24
Past Research Key Takeaways
Deloitte (2014)
AV and SAV users will likely be young travelers with
college degrees, and those traveling for longer distances.
Travelers may be willing to use SAVs when offered at
around $1 per mile.
Abraham et al. (2016)
Schoettle and Sivak (2014)
Schoettle and Sivak (2016)
Lavieri et al. (2017)
Lee et al. (2017)
Haboucha et al. (2017)
Bansal and Kockelman (2018)
Bonnefon et al. (2016) AV-related privacy concerns on sharing location, facial,
and travel-pattern data exist. User apprehension and
willingness-to-pay to protect privacy when using sensor-
loaded AVs need to be investigated and quantified. Fleetwood (2017)
Krueger et al. (2016) User willingness to share rides is expected to vary by trip
type and depend on added travel times. Discounted fares
for sharing rides encourages DRS, but the elasticities of
such behaviors are unknown.
Quarles and Kockelman (2018)
Stoiber et al. (2019)
Lavieri and Bhat (2019)
25
Gurumurthy and Kockelman 4
This paper addresses many such investigative gaps. A description of the survey design and data 1
processing methods are presented next, followed by summary statistics, model formulation, results 2
discussion, and various conclusions. 3
SURVEY DESIGN & DATA PROCESSING 4
The survey consists of 70 questions, tackling various aspects of AV and SAV use, including DRS 5
preferences (which are rides shared with strangers), privacy and security concerns, ethical 6
implications of crash response algorithms, long-distance travel shifts, and future travel choices, 7
with each subject section having about 5 to 8 questions. This paper focuses on responses to DRS, 8
privacy, crash ethics and long-distance questions.1 9
AVs and SAVs are introduced to respondents of the survey before they were shown the questions. 10
A futuristic setting is described with AVs and SAVs being fully-automated, which is also referred 11
to as SAE Level 5 driving automation2. Personal AVs are hypothesized to be relatively 12
unaffordable while private SAV rides are described to be widely available in the next 10 years and 13
reasonably affordable at $1.50/mi. This was then followed up with a section on current AV 14
perceptions including questions on impressions of and WTP for AVs, SAV use, and DRS with 15
strangers. Questions regarding an acceptable age for children/young people to travel individually 16
or in a group were also asked, along with questions regarding opportunities for serving persons 17
with disabilities. A slider response was used to obtain continuous responses on WTP, including 18
for DRS with a stranger - by time of day (night vs. daytime) and assuming different time delays. 19
An open-ended slider response can lead to response biases, but Miller et al. (2011) have shown 20
that this approach still leads to appropriate policy decisions. The value of providing one’s location 21
en route (to a close friend or family member, to increase travelers’ sense of security) was also 22
addressed, when sharing an SAV ride with an unknown person. To assess the ethical implications, 23
three distinct ethical dilemmas were posed to the respondents: two regarding AV crashes with a 24
pedestrian and other cars on the road, and one addressing crash responsibility. Questions on LD 25
travel were based on mode-choice preferences for different types of trips in the presence of 26
affordable AVs and SAVs, following the traditional choice experiment. A demographic section 27
was included towards the survey’s end, to provide control variables and correct for various 28
sampling biases, to better represent the U.S. population. 29
Data Collection 30
Survey Sampling International’s (SSI) panel of Americans was used to access respondents from 31
across the United States using Qualtrics, an online survey tool, in June 2017. Biases that are present 32
in personal interviews (Breidert et. al., 2006) are eliminated this way, and incentives along with 33
1 Gurumurthy (2017) contains information on results of all questions asked in this extensive survey. 2 https://www.sae.org/standards/content/j3016_201806/
Gurumurthy and Kockelman 5
mandating responses ensured no missing data. Nearly 10,000 Americans were targeted before the 1
required sample attributes were obtained, due to two screening procedures. The first screen 2
blocked respondents from accessing the survey in its entirety if they failed to answer two initial 3
basic questions regarding AVs and SAVs, after relevant information was provided. The second 4
level of screening was done by removing respondents who took less than 15 minutes to complete 5
the survey. This cutoff was estimated from the observed mean response time of 20 minutes from 6
the data, as well as accounting for fast computer/cellphone users who may have taken the survey. 7
Both screens helped ensure respondents were intellectually engaged, and paying attention. 8
Most questions contained a text input option as “Other: _____” for respondents to elaborate, and 9
expand response options. These inputs were manually mapped to an existing option or to a new 10
option, as appropriate. After screening respondents and remapping responses, usable sample size 11
was n = 2,588 respondents, from across the United States, with purposeful oversampling (n = 1258) 12
of Texans, due to the research sponsor’s (the Texas Department of Transportation’s) strong interest 13
in understanding Texans’ preferences. Both sets of responses are summarized below, after a 14
discussion on sample weighting or expansion. 15
Population Weighting 16
The 2,588 complete responses were associated with respondent weights to ensure that all reported 17
statistics and regression analyses reflect the broader population of interest. The U.S. Census 18
Bureau’s Public Use Microdata Sample (PUMS) for years 2011-2015 provided national and state 19
percentages across various classifications: location (Texas vs. U.S.), income and race, household 20
size and worker count, vehicle ownership, age, gender, educational attainment and marital status. 21
Certain demographics were under-represented (e.g., males who had not finished high school) and 22
some others were overrepresented (e.g., gender ratio was 47/53 rather than 49/51, 24% of the 23
sample were people 65 years or older rather than 18%), resulting in slightly higher weights. 24
MATLAB code performed iterative proportional fitting over all the combinations of dimensions, 25
ending once categorical percentages fell within 0.001% of the population percentages. Population-26
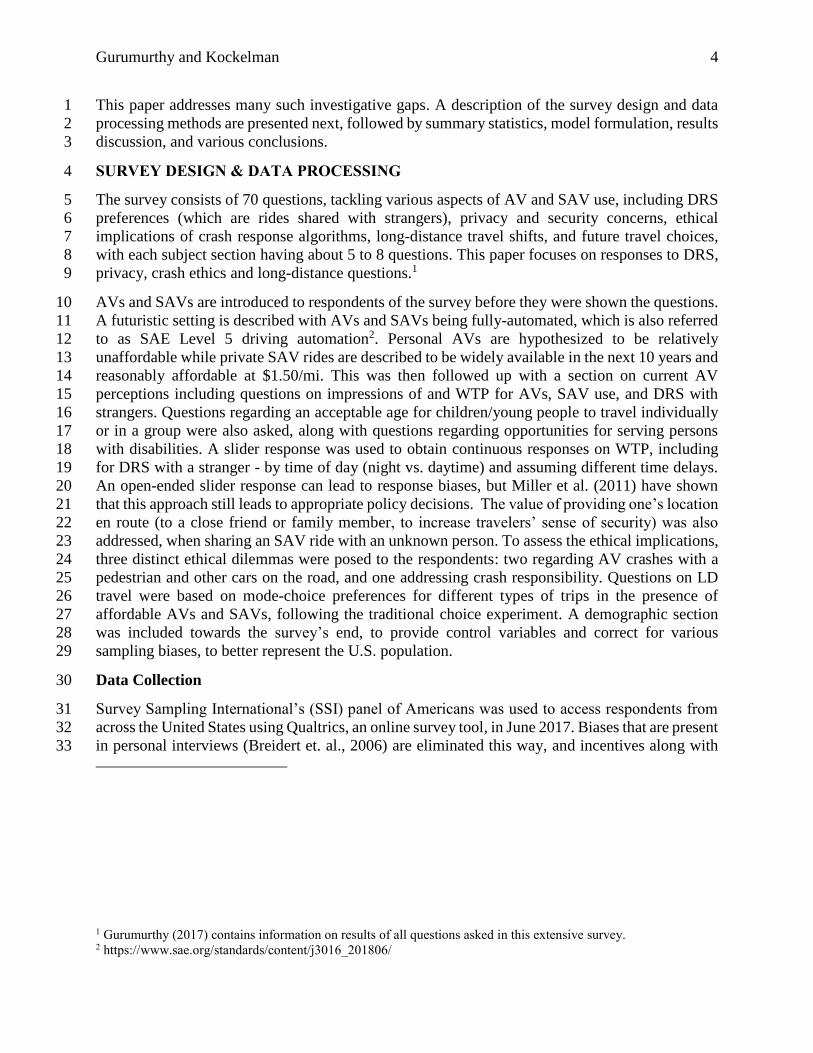
weighted sample characteristics are shown in Table 2. All of the following results reflect these 27
adjustments to raw sample statistics. 28
Table 2: Survey Data’s Population-Weighted Summary Statistics
Sample Demographics Mean SD Min Max
Age (in yrs) 46.00 16.34 21 70
Gender (Male) 48.64 % - 0 1
Employed Full-Time 37.59 % - 0 1
Education – Bachelor’s 17.56 % - 0 1
U.S. License Holder 89.77 % 24.86 % 0 1
Disabled 7.91 % - 0 1
HH Size 2.330 1.047 1 11
HH Annual Income $70,340 $47,226 $5,000 $250,000
No. of Workers in HH 1.150 0.951 0 5
No. of Children in HH 0.535 0.917 0 9
No. of Vehicles in HH 1.750 0.960 0 6
SUMMARY STATISTICS 29
Gurumurthy and Kockelman 6
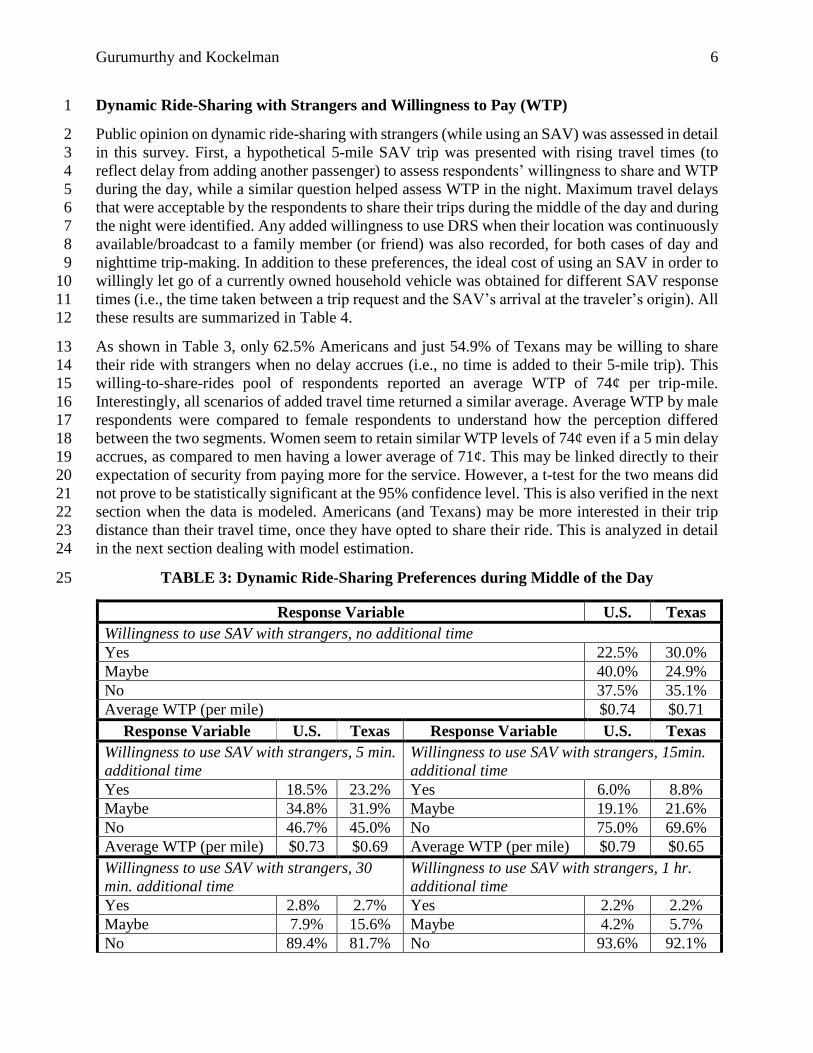
Dynamic Ride-Sharing with Strangers and Willingness to Pay (WTP) 1
Public opinion on dynamic ride-sharing with strangers (while using an SAV) was assessed in detail 2
in this survey. First, a hypothetical 5-mile SAV trip was presented with rising travel times (to 3
reflect delay from adding another passenger) to assess respondents’ willingness to share and WTP 4
during the day, while a similar question helped assess WTP in the night. Maximum travel delays 5
that were acceptable by the respondents to share their trips during the middle of the day and during 6
the night were identified. Any added willingness to use DRS when their location was continuously 7
available/broadcast to a family member (or friend) was also recorded, for both cases of day and 8
nighttime trip-making. In addition to these preferences, the ideal cost of using an SAV in order to 9
willingly let go of a currently owned household vehicle was obtained for different SAV response 10
times (i.e., the time taken between a trip request and the SAV’s arrival at the traveler’s origin). All 11
these results are summarized in Table 4. 12
As shown in Table 3, only 62.5% Americans and just 54.9% of Texans may be willing to share 13
their ride with strangers when no delay accrues (i.e., no time is added to their 5-mile trip). This 14
willing-to-share-rides pool of respondents reported an average WTP of 74¢ per trip-mile. 15
Interestingly, all scenarios of added travel time returned a similar average. Average WTP by male 16
respondents were compared to female respondents to understand how the perception differed 17
between the two segments. Women seem to retain similar WTP levels of 74¢ even if a 5 min delay 18
accrues, as compared to men having a lower average of 71¢. This may be linked directly to their 19
expectation of security from paying more for the service. However, a t-test for the two means did 20
not prove to be statistically significant at the 95% confidence level. This is also verified in the next 21
section when the data is modeled. Americans (and Texans) may be more interested in their trip 22
distance than their travel time, once they have opted to share their ride. This is analyzed in detail 23
in the next section dealing with model estimation. 24
TABLE 3: Dynamic Ride-Sharing Preferences during Middle of the Day 25
Response Variable U.S. Texas
Willingness to use SAV with strangers, no additional time
Yes 22.5% 30.0%
Maybe 40.0% 24.9%
No 37.5% 35.1%
Average WTP (per mile) $0.74 $0.71
Response Variable U.S. Texas Response Variable U.S. Texas
Willingness to use SAV with strangers, 5 min.
additional time
Willingness to use SAV with strangers, 15min.
additional time
Yes 18.5% 23.2% Yes 6.0% 8.8%
Maybe 34.8% 31.9% Maybe 19.1% 21.6%
No 46.7% 45.0% No 75.0% 69.6%
Average WTP (per mile) $0.73 $0.69 Average WTP (per mile) $0.79 $0.65
Willingness to use SAV with strangers, 30
min. additional time
Willingness to use SAV with strangers, 1 hr.
additional time
Yes 2.8% 2.7% Yes 2.2% 2.2%
Maybe 7.9% 15.6% Maybe 4.2% 5.7%
No 89.4% 81.7% No 93.6% 92.1%
Gurumurthy and Kockelman 7
Average WTP (per mile) $0.77 $0.65 Average WTP (per mile) $0.74 $0.62
1
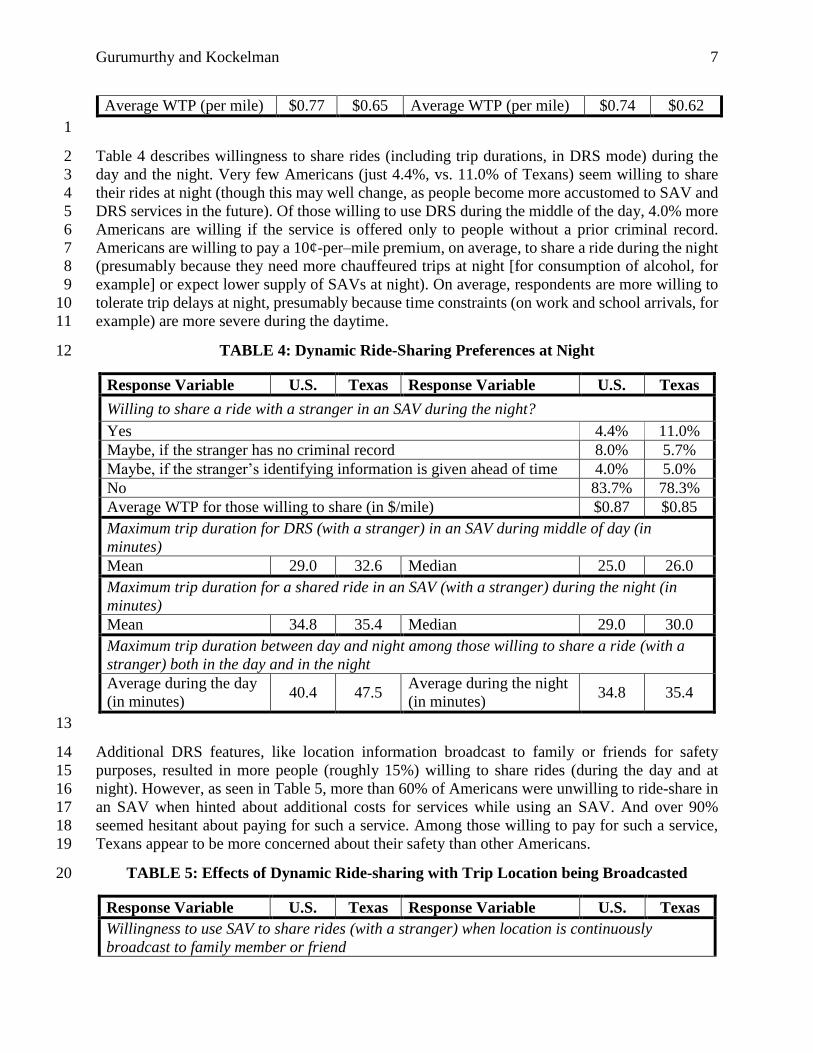
Table 4 describes willingness to share rides (including trip durations, in DRS mode) during the 2
day and the night. Very few Americans (just 4.4%, vs. 11.0% of Texans) seem willing to share 3
their rides at night (though this may well change, as people become more accustomed to SAV and 4
DRS services in the future). Of those willing to use DRS during the middle of the day, 4.0% more 5
Americans are willing if the service is offered only to people without a prior criminal record. 6
Americans are willing to pay a 10¢-per–mile premium, on average, to share a ride during the night 7
(presumably because they need more chauffeured trips at night [for consumption of alcohol, for 8
example] or expect lower supply of SAVs at night). On average, respondents are more willing to 9
tolerate trip delays at night, presumably because time constraints (on work and school arrivals, for 10
example) are more severe during the daytime. 11
TABLE 4: Dynamic Ride-Sharing Preferences at Night 12
Response Variable U.S. Texas Response Variable U.S. Texas
Willing to share a ride with a stranger in an SAV during the night?
Yes 4.4% 11.0%
Maybe, if the stranger has no criminal record 8.0% 5.7%
Maybe, if the stranger’s identifying information is given ahead of time 4.0% 5.0%
No 83.7% 78.3%
Average WTP for those willing to share (in $/mile) $0.87 $0.85
Maximum trip duration for DRS (with a stranger) in an SAV during middle of day (in
minutes)
Mean 29.0 32.6 Median 25.0 26.0
Maximum trip duration for a shared ride in an SAV (with a stranger) during the night (in
minutes)
Mean 34.8 35.4 Median 29.0 30.0
Maximum trip duration between day and night among those willing to share a ride (with a
stranger) both in the day and in the night
Average during the day
(in minutes) 40.4 47.5
Average during the night
(in minutes) 34.8 35.4
13
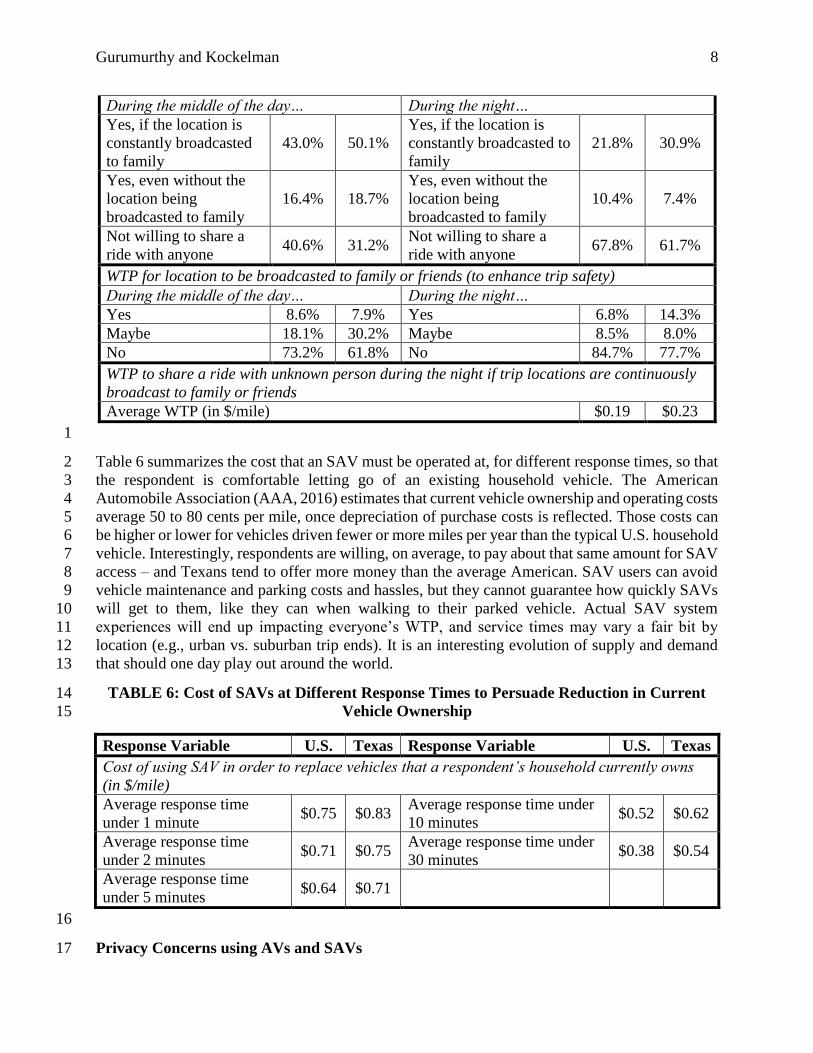
Additional DRS features, like location information broadcast to family or friends for safety 14
purposes, resulted in more people (roughly 15%) willing to share rides (during the day and at 15
night). However, as seen in Table 5, more than 60% of Americans were unwilling to ride-share in 16
an SAV when hinted about additional costs for services while using an SAV. And over 90% 17
seemed hesitant about paying for such a service. Among those willing to pay for such a service, 18
Texans appear to be more concerned about their safety than other Americans. 19
TABLE 5: Effects of Dynamic Ride-sharing with Trip Location being Broadcasted 20
Response Variable U.S. Texas Response Variable U.S. Texas
Willingness to use SAV to share rides (with a stranger) when location is continuously
broadcast to family member or friend
Gurumurthy and Kockelman 8
During the middle of the day… During the night…
Yes, if the location is
constantly broadcasted
to family
43.0% 50.1%
Yes, if the location is
constantly broadcasted to
family
21.8% 30.9%
Yes, even without the
location being
broadcasted to family
16.4% 18.7%
Yes, even without the
location being
broadcasted to family
10.4% 7.4%
Not willing to share a
ride with anyone 40.6% 31.2%
Not willing to share a
ride with anyone 67.8% 61.7%
WTP for location to be broadcasted to family or friends (to enhance trip safety)
During the middle of the day… During the night…
Yes 8.6% 7.9% Yes 6.8% 14.3%
Maybe 18.1% 30.2% Maybe 8.5% 8.0%
No 73.2% 61.8% No 84.7% 77.7%
WTP to share a ride with unknown person during the night if trip locations are continuously
broadcast to family or friends
Average WTP (in $/mile) $0.19 $0.23
1
Table 6 summarizes the cost that an SAV must be operated at, for different response times, so that 2
the respondent is comfortable letting go of an existing household vehicle. The American 3
Automobile Association (AAA, 2016) estimates that current vehicle ownership and operating costs 4
average 50 to 80 cents per mile, once depreciation of purchase costs is reflected. Those costs can 5
be higher or lower for vehicles driven fewer or more miles per year than the typical U.S. household 6
vehicle. Interestingly, respondents are willing, on average, to pay about that same amount for SAV 7
access – and Texans tend to offer more money than the average American. SAV users can avoid 8
vehicle maintenance and parking costs and hassles, but they cannot guarantee how quickly SAVs 9
will get to them, like they can when walking to their parked vehicle. Actual SAV system 10
experiences will end up impacting everyone’s WTP, and service times may vary a fair bit by 11
location (e.g., urban vs. suburban trip ends). It is an interesting evolution of supply and demand 12
that should one day play out around the world. 13
TABLE 6: Cost of SAVs at Different Response Times to Persuade Reduction in Current 14
Vehicle Ownership 15
Response Variable U.S. Texas Response Variable U.S. Texas
Cost of using SAV in order to replace vehicles that a respondent’s household currently owns
(in $/mile)
Average response time
under 1 minute $0.75 $0.83
Average response time under
10 minutes $0.52 $0.62
Average response time
under 2 minutes $0.71 $0.75
Average response time under
30 minutes $0.38 $0.54
Average response time
under 5 minutes $0.64 $0.71
16
Privacy Concerns using AVs and SAVs 17

Gurumurthy and Kockelman 9
Privacy is not on top of respondents’ minds when general AV-related concerns are requested. 1
However, when targeted as a separate topic, more privacy-related concern was observed. Table 7 2
demonstrates this, with 89% of Americans (and 83% of Texans) to at least some privacy concerns. 3
However, many respondents (39.8% of Americans and 40.6% of Texans) appear unwilling to pay 4
to anonymize their location while using SAVs. Respondents were also asked to rate their levels of 5
comfort when their location data is used for different socially meaningful purposes. Nearly 48% 6
Americans, on average, were comfortable or somewhat comfortable with this data being used for 7
policing activities, managing traffic and for general community surveillance. However, more than 8
half were against targeted advertising use. Their WTP is modeled in detail in the next section. 9
TABLE 7: Privacy Concerns Related to AVs and SAVs and WTP for Privacy 10
Response Variable U.S. Texas Response Variable U.S. Texas
WTP for anonymizing user location for the entire trip while using an AV or SAV if they opt in
Average (in $/trip) 1.10 1.19
Comfort level in allowing trip-location data usage…
…to aid policing activities with a warrant …for general community surveillance
Very uncomfortable 17.7% 15.9% Very uncomfortable 19.2% 26.1%
Somewhat uncomfortable 6.2% 9.1% Somewhat uncomfortable 14.0% 15.1%
Unsure 22.4% 29.7% Unsure 30.0% 26.3%
Somewhat comfortable 27.8% 23.6% Somewhat comfortable 23.8% 21.6%
Very comfortable 25.9% 21.7% Very comfortable 13.0% 10.9%
…to manage traffic & forecast travel
conditions …to facilitate directed advertising
Very uncomfortable 15.4% 18.8% Very uncomfortable 42.5% 49.2%
Somewhat uncomfortable 8.7% 12.6% Somewhat uncomfortable 17.9% 21.3%
Unsure 22.4% 24.3% Unsure 24.0% 15.9%
Somewhat comfortable 39.0% 30.2% Somewhat comfortable 11.8% 10.2%
Very comfortable 14.5% 14.1% Very comfortable 3.8% 3.4%
11
Crash Ethics While Using AVs 12
Two distinct crash scenarios were presented in the survey, describing an AV crashing into a group 13
of pedestrians in one case and crashing into other cars on the road in another. Respondents picked 14
from a broad list of options to describe ethical and non-ethical crash outcomes, along with who 15
should be held accountable for such events. 16
The most popular belief is that AVs should not change course, once a crash is inevitable, and 17
should crash into the first pedestrian or vehicle that crosses its path. Many others feel strongly that 18
vehicle and pedestrian differences should be ignored while heading into a crash. Presumably, 19
Americans recognize that there is no great solution to most crash situations and no new target (like 20
a heavier vehicle or older adult) should be picked, leaving outcomes more to random chance and 21
relatively similar to what humans may do under such difficult situations, with little response time 22
available. Nevertheless, a strong share of respondents (about 20 percent) would like children to be 23
avoided, when feasible, and more crash-worthy vehicles be selected, to minimize loss of life. More 24
than 60% believe that AV manufacturers should be held responsible for such crashes. 25
Gurumurthy and Kockelman 10
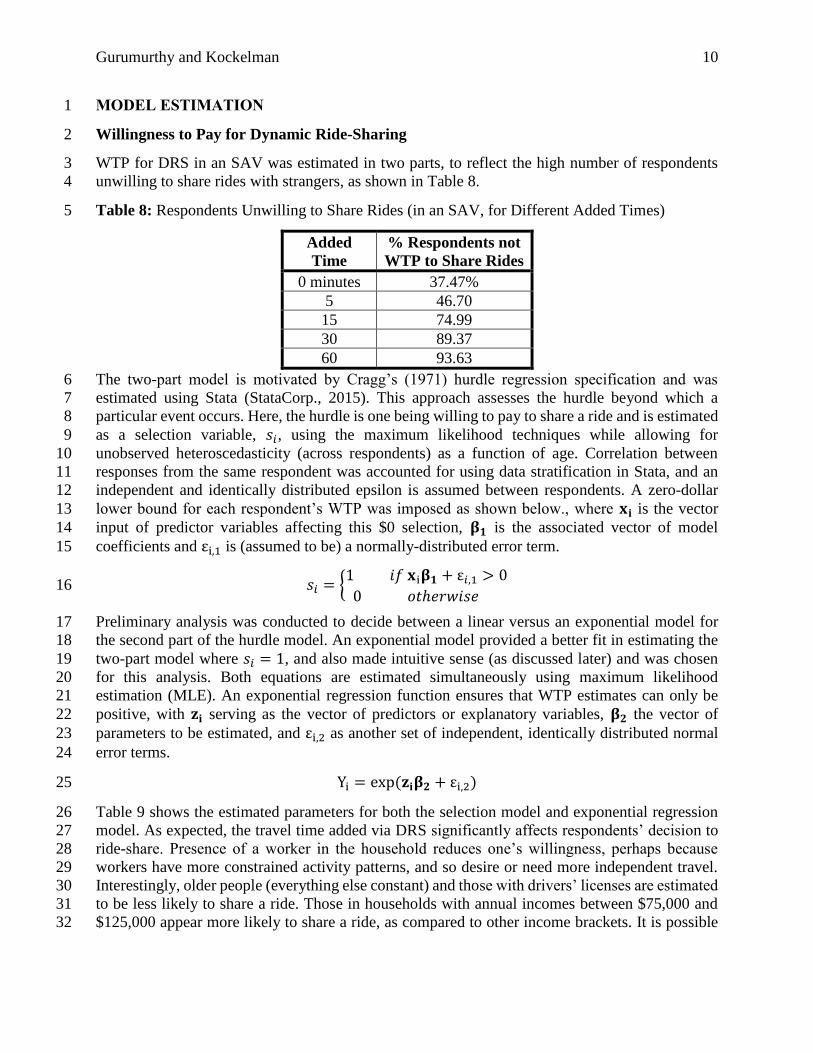
MODEL ESTIMATION 1
Willingness to Pay for Dynamic Ride-Sharing 2
WTP for DRS in an SAV was estimated in two parts, to reflect the high number of respondents 3
unwilling to share rides with strangers, as shown in Table 8. 4
Table 8: Respondents Unwilling to Share Rides (in an SAV, for Different Added Times) 5
Added
Time
% Respondents not
WTP to Share Rides
0 minutes 37.47%
5 46.70
15 74.99
30 89.37
60 93.63
The two-part model is motivated by Cragg’s (1971) hurdle regression specification and was 6
estimated using Stata (StataCorp., 2015). This approach assesses the hurdle beyond which a 7
particular event occurs. Here, the hurdle is one being willing to pay to share a ride and is estimated 8
as a selection variable, 𝑠𝑖, using the maximum likelihood techniques while allowing for 9
unobserved heteroscedasticity (across respondents) as a function of age. Correlation between 10
responses from the same respondent was accounted for using data stratification in Stata, and an 11
independent and identically distributed epsilon is assumed between respondents. A zero-dollar 12
lower bound for each respondent’s WTP was imposed as shown below., where 𝐱𝐢 is the vector 13
input of predictor variables affecting this $0 selection, 𝛃𝟏 is the associated vector of model 14
coefficients and εi,1 is (assumed to be) a normally-distributed error term. 15
𝑠𝑖 = {1 𝑖𝑓 𝐱i𝛃𝟏 + ε𝑖,1 > 0
0 𝑜𝑡ℎ𝑒𝑟𝑤𝑖𝑠𝑒 16
Preliminary analysis was conducted to decide between a linear versus an exponential model for 17
the second part of the hurdle model. An exponential model provided a better fit in estimating the 18
two-part model where 𝑠𝑖 = 1, and also made intuitive sense (as discussed later) and was chosen 19
for this analysis. Both equations are estimated simultaneously using maximum likelihood 20
estimation (MLE). An exponential regression function ensures that WTP estimates can only be 21
positive, with 𝐳𝐢 serving as the vector of predictors or explanatory variables, 𝛃𝟐 the vector of 22
parameters to be estimated, and εi,2 as another set of independent, identically distributed normal 23
error terms. 24
Yi = exp (𝐳𝐢𝛃𝟐 + εi,2) 25
Table 9 shows the estimated parameters for both the selection model and exponential regression 26
model. As expected, the travel time added via DRS significantly affects respondents’ decision to 27
ride-share. Presence of a worker in the household reduces one’s willingness, perhaps because 28
workers have more constrained activity patterns, and so desire or need more independent travel. 29
Interestingly, older people (everything else constant) and those with drivers’ licenses are estimated 30
to be less likely to share a ride. Those in households with annual incomes between $75,000 and 31
$125,000 appear more likely to share a ride, as compared to other income brackets. It is possible 32
Gurumurthy and Kockelman 11
that lower income brackets cannot simply afford to use an SAV, while those in higher income 1
brackets prefer private rides. 2
Respondents with an associate’s degree or higher are more willing to share rides (i.e., offer a non-3
zero valuation for such travel), everything else constant. Interestingly, those currently living in 4
more densely populated but less densely employed neighborhoods appear less willy to share rides, 5
and this could be people living close to downtown where walking gets you to most places. 6
While coefficients of the exponential regression model cannot be used directly to infer changes in 7
one’s expected WTP (due to the non-linear transformation that ensures non-negativity in this 8
response variable), one finds that added travel time does not significantly affect WTP once a 9
traveler is ready to share a ride. Older persons and those without any college education appear to 10
be willing to pay a lower value, assuming they are already willing to share a ride, in this hurdle 11
model specification. 12
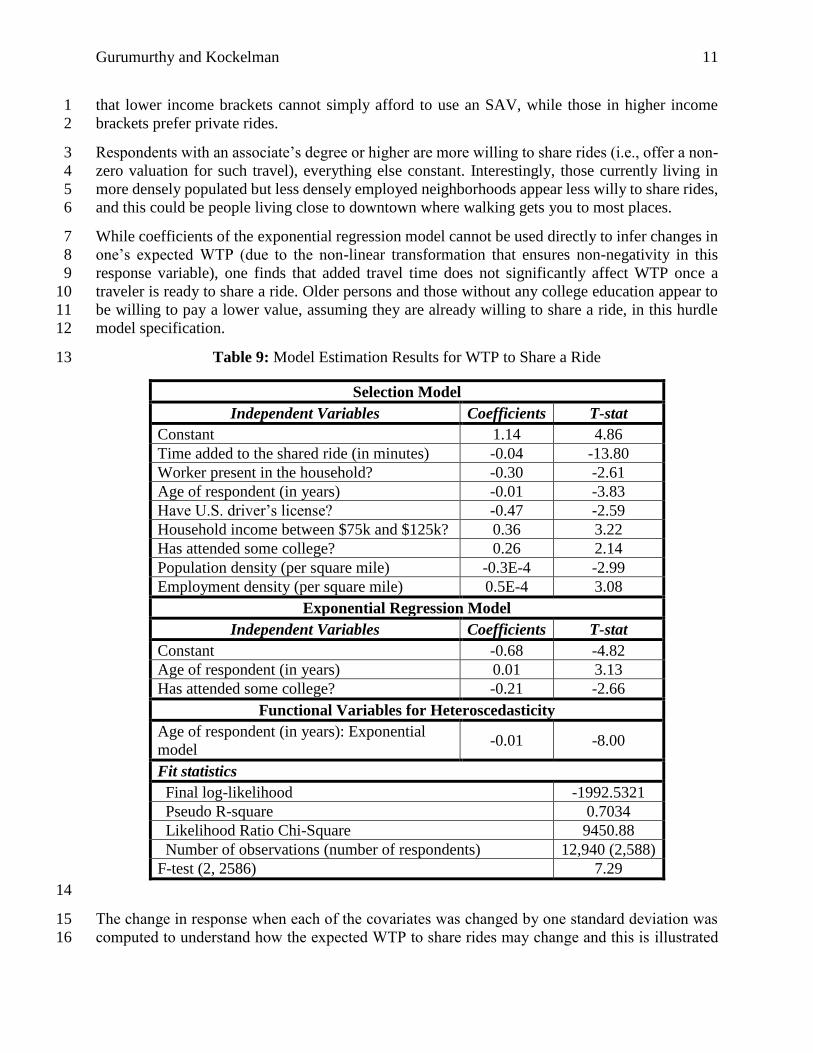
Table 9: Model Estimation Results for WTP to Share a Ride 13
Selection Model
Independent Variables Coefficients T-stat
Constant 1.14 4.86
Time added to the shared ride (in minutes) -0.04 -13.80
Worker present in the household? -0.30 -2.61
Age of respondent (in years) -0.01 -3.83
Have U.S. driver’s license? -0.47 -2.59
Household income between $75k and $125k? 0.36 3.22
Has attended some college? 0.26 2.14
Population density (per square mile) -0.3E-4 -2.99
Employment density (per square mile) 0.5E-4 3.08
Exponential Regression Model
Independent Variables Coefficients T-stat
Constant -0.68 -4.82
Age of respondent (in years) 0.01 3.13
Has attended some college? -0.21 -2.66
Functional Variables for Heteroscedasticity
Age of respondent (in years): Exponential
model -0.01 -8.00
Fit statistics
Final log-likelihood -1992.5321
Pseudo R-square 0.7034
Likelihood Ratio Chi-Square 9450.88
Number of observations (number of respondents) 12,940 (2,588)
F-test (2, 2586) 7.29
14
The change in response when each of the covariates was changed by one standard deviation was 15
computed to understand how the expected WTP to share rides may change and this is illustrated 16
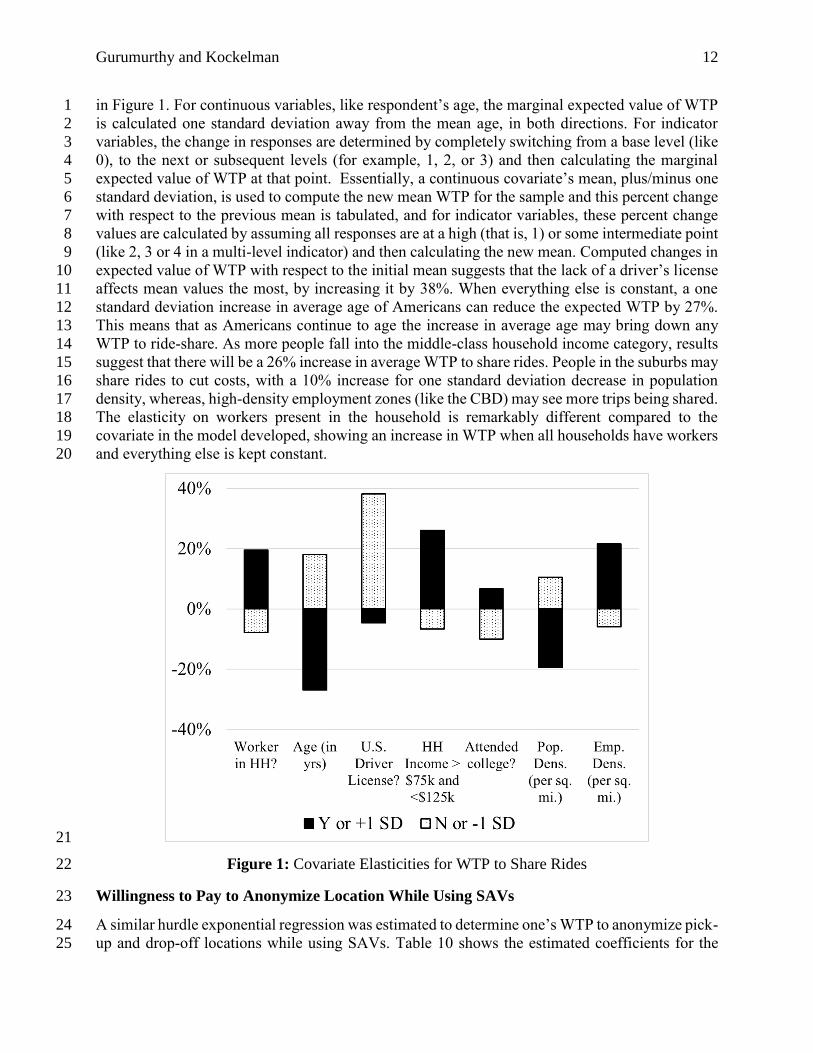
Gurumurthy and Kockelman 12
in Figure 1. For continuous variables, like respondent’s age, the marginal expected value of WTP 1
is calculated one standard deviation away from the mean age, in both directions. For indicator 2
variables, the change in responses are determined by completely switching from a base level (like 3
0), to the next or subsequent levels (for example, 1, 2, or 3) and then calculating the marginal 4
expected value of WTP at that point. Essentially, a continuous covariate’s mean, plus/minus one 5
standard deviation, is used to compute the new mean WTP for the sample and this percent change 6
with respect to the previous mean is tabulated, and for indicator variables, these percent change 7
values are calculated by assuming all responses are at a high (that is, 1) or some intermediate point 8
(like 2, 3 or 4 in a multi-level indicator) and then calculating the new mean. Computed changes in 9
expected value of WTP with respect to the initial mean suggests that the lack of a driver’s license 10
affects mean values the most, by increasing it by 38%. When everything else is constant, a one 11
standard deviation increase in average age of Americans can reduce the expected WTP by 27%. 12
This means that as Americans continue to age the increase in average age may bring down any 13
WTP to ride-share. As more people fall into the middle-class household income category, results 14
suggest that there will be a 26% increase in average WTP to share rides. People in the suburbs may 15
share rides to cut costs, with a 10% increase for one standard deviation decrease in population 16
density, whereas, high-density employment zones (like the CBD) may see more trips being shared. 17
The elasticity on workers present in the household is remarkably different compared to the 18
covariate in the model developed, showing an increase in WTP when all households have workers 19
and everything else is kept constant. 20
21
Figure 1: Covariate Elasticities for WTP to Share Rides 22
Willingness to Pay to Anonymize Location While Using SAVs 23
A similar hurdle exponential regression was estimated to determine one’s WTP to anonymize pick-24
up and drop-off locations while using SAVs. Table 10 shows the estimated coefficients for the 25
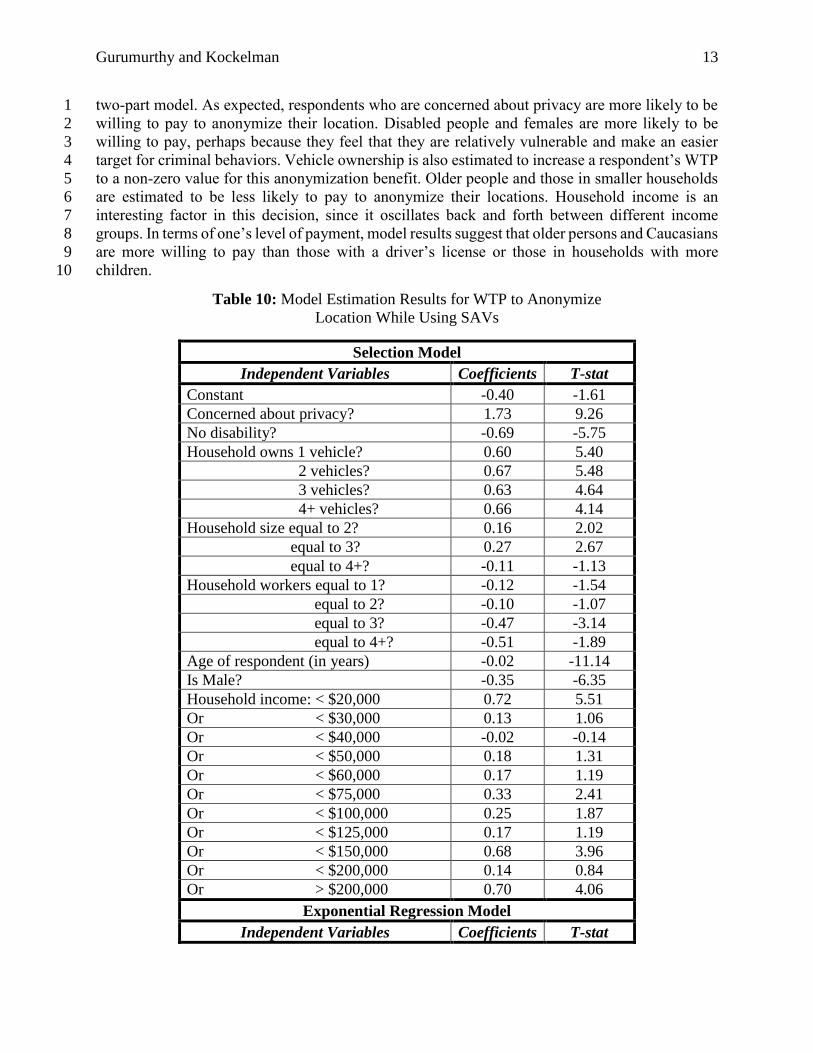
Gurumurthy and Kockelman 13
two-part model. As expected, respondents who are concerned about privacy are more likely to be 1
willing to pay to anonymize their location. Disabled people and females are more likely to be 2
willing to pay, perhaps because they feel that they are relatively vulnerable and make an easier 3
target for criminal behaviors. Vehicle ownership is also estimated to increase a respondent’s WTP 4
to a non-zero value for this anonymization benefit. Older people and those in smaller households 5
are estimated to be less likely to pay to anonymize their locations. Household income is an 6
interesting factor in this decision, since it oscillates back and forth between different income 7
groups. In terms of one’s level of payment, model results suggest that older persons and Caucasians 8
are more willing to pay than those with a driver’s license or those in households with more 9
children. 10
Table 10: Model Estimation Results for WTP to Anonymize
Location While Using SAVs
Selection Model
Independent Variables Coefficients T-stat
Constant -0.40 -1.61
Concerned about privacy? 1.73 9.26
No disability? -0.69 -5.75
Household owns 1 vehicle? 0.60 5.40
2 vehicles? 0.67 5.48
3 vehicles? 0.63 4.64
4+ vehicles? 0.66 4.14
Household size equal to 2? 0.16 2.02
equal to 3? 0.27 2.67
equal to 4+? -0.11 -1.13
Household workers equal to 1? -0.12 -1.54
equal to 2? -0.10 -1.07
equal to 3? -0.47 -3.14
equal to 4+? -0.51 -1.89
Age of respondent (in years) -0.02 -11.14
Is Male? -0.35 -6.35
Household income: < $20,000 0.72 5.51
Or < $30,000 0.13 1.06
Or < $40,000 -0.02 -0.14
Or < $50,000 0.18 1.31
Or < $60,000 0.17 1.19
Or < $75,000 0.33 2.41
Or < $100,000 0.25 1.87
Or < $125,000 0.17 1.19
Or < $150,000 0.68 3.96
Or < $200,000 0.14 0.84
Or > $200,000 0.70 4.06
Exponential Regression Model
Independent Variables Coefficients T-stat
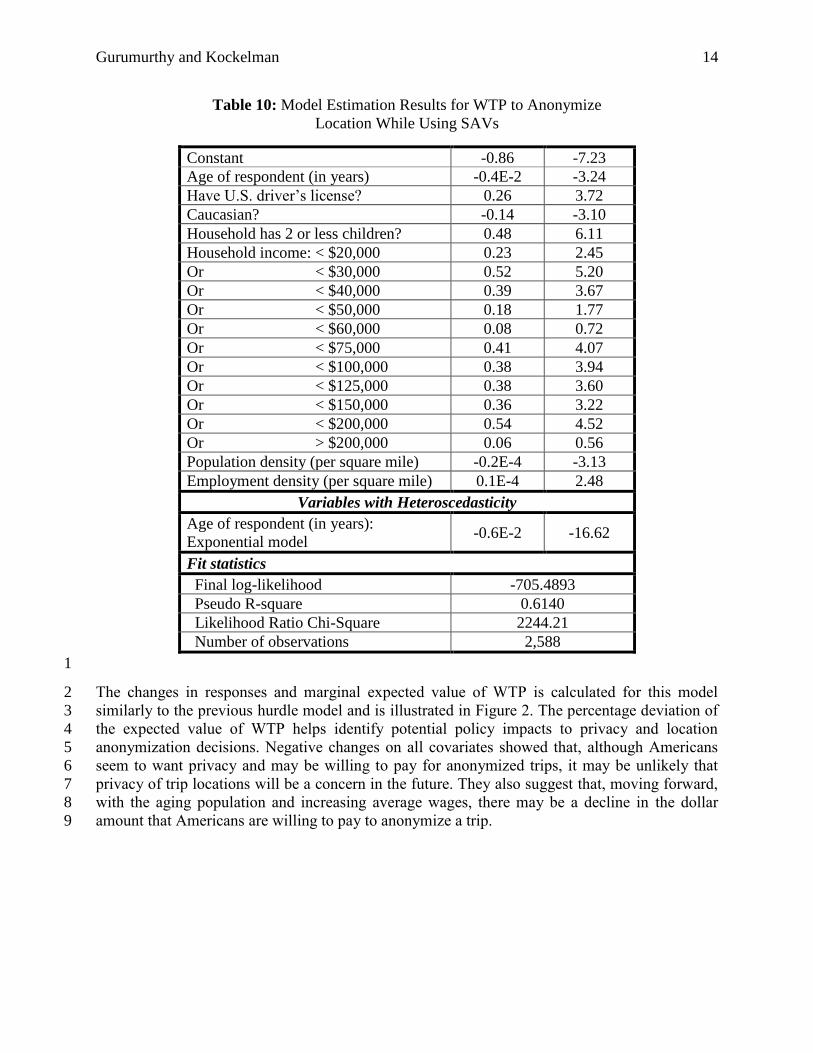
Gurumurthy and Kockelman 14
Table 10: Model Estimation Results for WTP to Anonymize
Location While Using SAVs
Constant -0.86 -7.23
Age of respondent (in years) -0.4E-2 -3.24
Have U.S. driver’s license? 0.26 3.72
Caucasian? -0.14 -3.10
Household has 2 or less children? 0.48 6.11
Household income: < $20,000 0.23 2.45
Or < $30,000 0.52 5.20
Or < $40,000 0.39 3.67
Or < $50,000 0.18 1.77
Or < $60,000 0.08 0.72
Or < $75,000 0.41 4.07
Or < $100,000 0.38 3.94
Or < $125,000 0.38 3.60
Or < $150,000 0.36 3.22
Or < $200,000 0.54 4.52
Or > $200,000 0.06 0.56
Population density (per square mile) -0.2E-4 -3.13
Employment density (per square mile) 0.1E-4 2.48
Variables with Heteroscedasticity
Age of respondent (in years):
Exponential model -0.6E-2 -16.62
Fit statistics
Final log-likelihood -705.4893
Pseudo R-square 0.6140
Likelihood Ratio Chi-Square 2244.21
Number of observations 2,588
1
The changes in responses and marginal expected value of WTP is calculated for this model 2
similarly to the previous hurdle model and is illustrated in Figure 2. The percentage deviation of 3
the expected value of WTP helps identify potential policy impacts to privacy and location 4
anonymization decisions. Negative changes on all covariates showed that, although Americans 5
seem to want privacy and may be willing to pay for anonymized trips, it may be unlikely that 6
privacy of trip locations will be a concern in the future. They also suggest that, moving forward, 7
with the aging population and increasing average wages, there may be a decline in the dollar 8
amount that Americans are willing to pay to anonymize a trip.9

1
Figure 2: Covariate elasticities for WTP to Anonymize Location in an SAV2
Gurumurthy and Kockelman 16
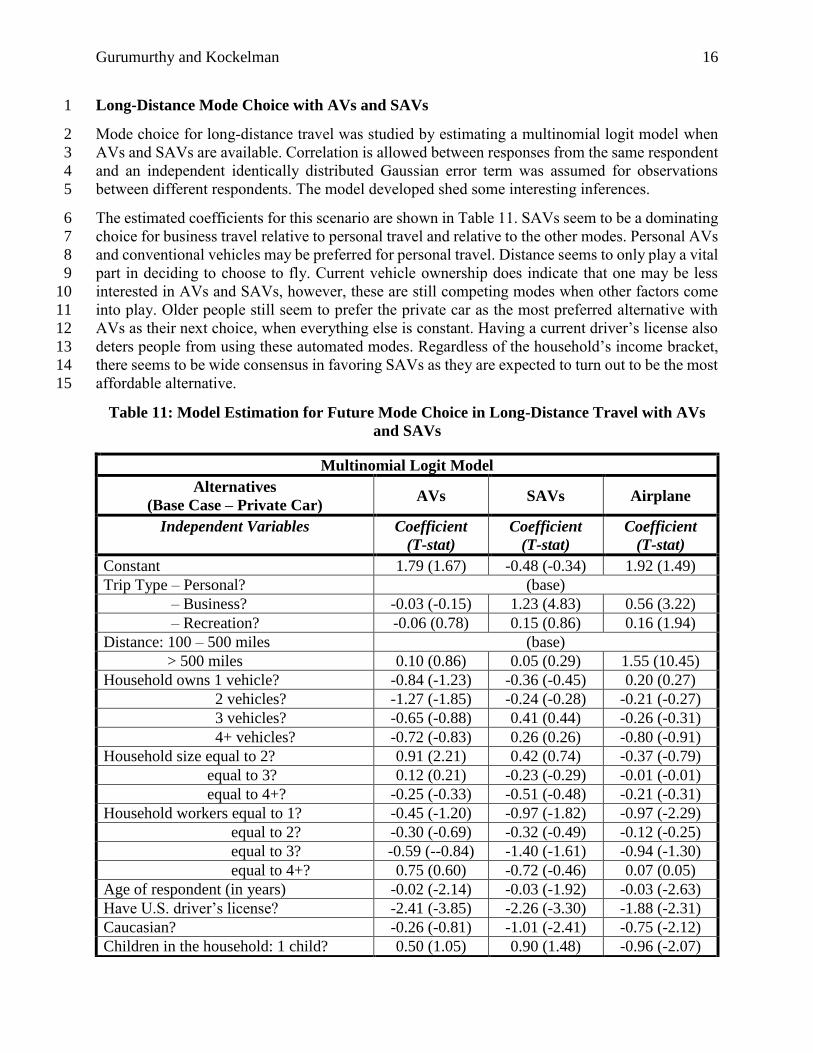
Long-Distance Mode Choice with AVs and SAVs 1
Mode choice for long-distance travel was studied by estimating a multinomial logit model when 2
AVs and SAVs are available. Correlation is allowed between responses from the same respondent 3
and an independent identically distributed Gaussian error term was assumed for observations 4
between different respondents. The model developed shed some interesting inferences. 5
The estimated coefficients for this scenario are shown in Table 11. SAVs seem to be a dominating 6
choice for business travel relative to personal travel and relative to the other modes. Personal AVs 7
and conventional vehicles may be preferred for personal travel. Distance seems to only play a vital 8
part in deciding to choose to fly. Current vehicle ownership does indicate that one may be less 9
interested in AVs and SAVs, however, these are still competing modes when other factors come 10
into play. Older people still seem to prefer the private car as the most preferred alternative with 11
AVs as their next choice, when everything else is constant. Having a current driver’s license also 12
deters people from using these automated modes. Regardless of the household’s income bracket, 13
there seems to be wide consensus in favoring SAVs as they are expected to turn out to be the most 14
affordable alternative. 15
Table 11: Model Estimation for Future Mode Choice in Long-Distance Travel with AVs
and SAVs
Multinomial Logit Model
Alternatives
(Base Case – Private Car) AVs SAVs Airplane
Independent Variables Coefficient
(T-stat)
Coefficient
(T-stat)
Coefficient
(T-stat)
Constant 1.79 (1.67) -0.48 (-0.34) 1.92 (1.49)
Trip Type – Personal? (base)
– Business? -0.03 (-0.15) 1.23 (4.83) 0.56 (3.22)
– Recreation? -0.06 (0.78) 0.15 (0.86) 0.16 (1.94)
Distance: 100 – 500 miles (base)
> 500 miles 0.10 (0.86) 0.05 (0.29) 1.55 (10.45)
Household owns 1 vehicle? -0.84 (-1.23) -0.36 (-0.45) 0.20 (0.27)
2 vehicles? -1.27 (-1.85) -0.24 (-0.28) -0.21 (-0.27)
3 vehicles? -0.65 (-0.88) 0.41 (0.44) -0.26 (-0.31)
4+ vehicles? -0.72 (-0.83) 0.26 (0.26) -0.80 (-0.91)
Household size equal to 2? 0.91 (2.21) 0.42 (0.74) -0.37 (-0.79)
equal to 3? 0.12 (0.21) -0.23 (-0.29) -0.01 (-0.01)
equal to 4+? -0.25 (-0.33) -0.51 (-0.48) -0.21 (-0.31)
Household workers equal to 1? -0.45 (-1.20) -0.97 (-1.82) -0.97 (-2.29)
equal to 2? -0.30 (-0.69) -0.32 (-0.49) -0.12 (-0.25)
equal to 3? -0.59 (--0.84) -1.40 (-1.61) -0.94 (-1.30)
equal to 4+? 0.75 (0.60) -0.72 (-0.46) 0.07 (0.05)
Age of respondent (in years) -0.02 (-2.14) -0.03 (-1.92) -0.03 (-2.63)
Have U.S. driver’s license? -2.41 (-3.85) -2.26 (-3.30) -1.88 (-2.31)
Caucasian? -0.26 (-0.81) -1.01 (-2.41) -0.75 (-2.12)
Children in the household: 1 child? 0.50 (1.05) 0.90 (1.48) -0.96 (-2.07)
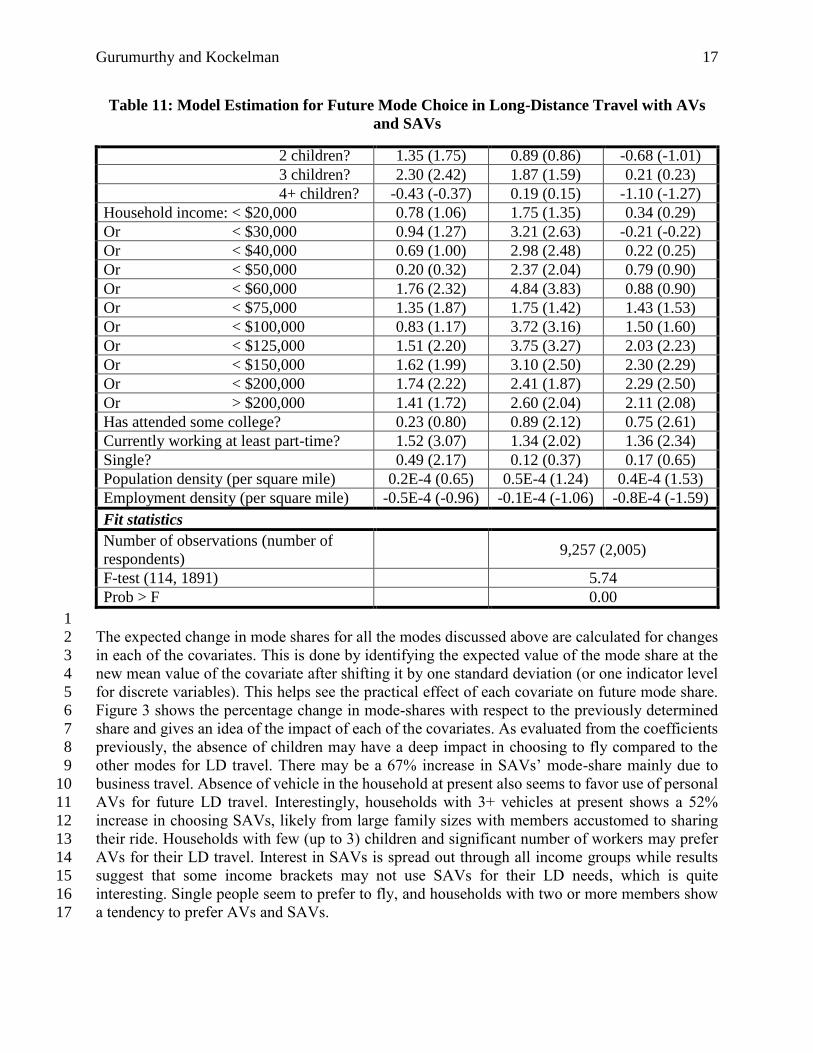
Gurumurthy and Kockelman 17
Table 11: Model Estimation for Future Mode Choice in Long-Distance Travel with AVs
and SAVs
2 children? 1.35 (1.75) 0.89 (0.86) -0.68 (-1.01)
3 children? 2.30 (2.42) 1.87 (1.59) 0.21 (0.23)
4+ children? -0.43 (-0.37) 0.19 (0.15) -1.10 (-1.27)
Household income: < $20,000 0.78 (1.06) 1.75 (1.35) 0.34 (0.29)
Or < $30,000 0.94 (1.27) 3.21 (2.63) -0.21 (-0.22)
Or < $40,000 0.69 (1.00) 2.98 (2.48) 0.22 (0.25)
Or < $50,000 0.20 (0.32) 2.37 (2.04) 0.79 (0.90)
Or < $60,000 1.76 (2.32) 4.84 (3.83) 0.88 (0.90)
Or < $75,000 1.35 (1.87) 1.75 (1.42) 1.43 (1.53)
Or < $100,000 0.83 (1.17) 3.72 (3.16) 1.50 (1.60)
Or < $125,000 1.51 (2.20) 3.75 (3.27) 2.03 (2.23)
Or < $150,000 1.62 (1.99) 3.10 (2.50) 2.30 (2.29)
Or < $200,000 1.74 (2.22) 2.41 (1.87) 2.29 (2.50)
Or > $200,000 1.41 (1.72) 2.60 (2.04) 2.11 (2.08)
Has attended some college? 0.23 (0.80) 0.89 (2.12) 0.75 (2.61)
Currently working at least part-time? 1.52 (3.07) 1.34 (2.02) 1.36 (2.34)
Single? 0.49 (2.17) 0.12 (0.37) 0.17 (0.65)
Population density (per square mile) 0.2E-4 (0.65) 0.5E-4 (1.24) 0.4E-4 (1.53)
Employment density (per square mile) -0.5E-4 (-0.96) -0.1E-4 (-1.06) -0.8E-4 (-1.59)
Fit statistics
Number of observations (number of
respondents)
9,257 (2,005)
F-test (114, 1891) 5.74
Prob > F 0.00
1
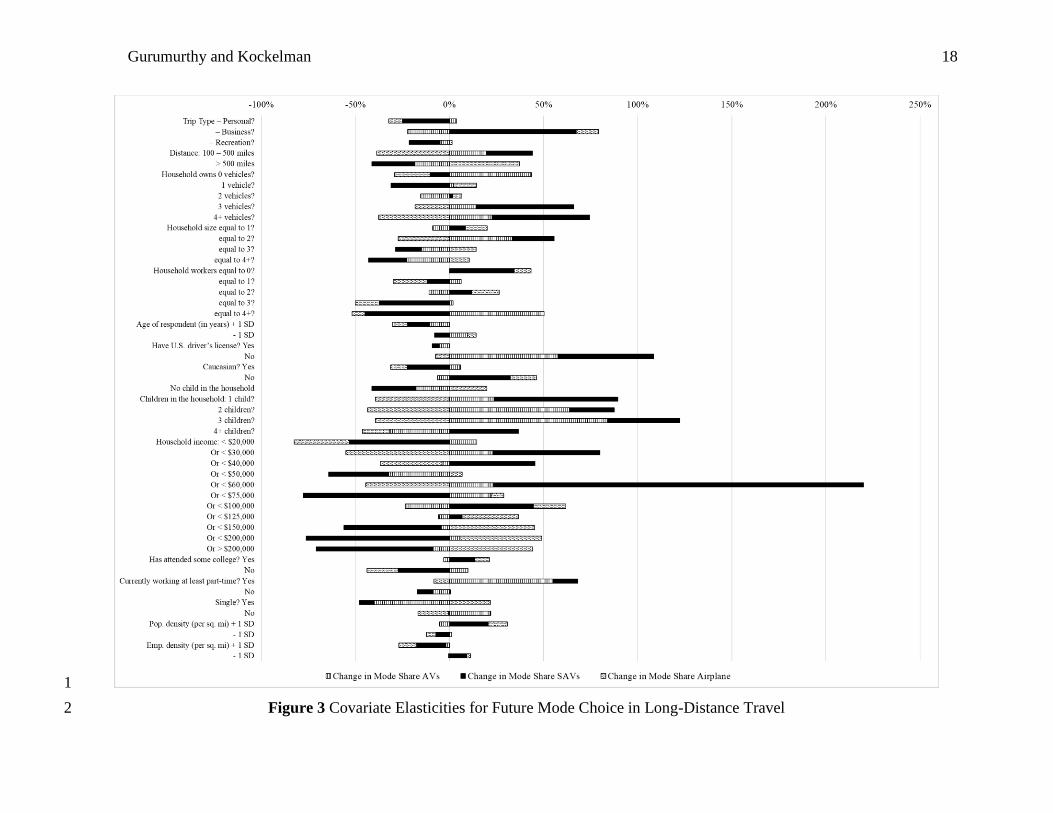
The expected change in mode shares for all the modes discussed above are calculated for changes 2
in each of the covariates. This is done by identifying the expected value of the mode share at the 3
new mean value of the covariate after shifting it by one standard deviation (or one indicator level 4
for discrete variables). This helps see the practical effect of each covariate on future mode share. 5
Figure 3 shows the percentage change in mode-shares with respect to the previously determined 6
share and gives an idea of the impact of each of the covariates. As evaluated from the coefficients 7
previously, the absence of children may have a deep impact in choosing to fly compared to the 8
other modes for LD travel. There may be a 67% increase in SAVs’ mode-share mainly due to 9
business travel. Absence of vehicle in the household at present also seems to favor use of personal 10
AVs for future LD travel. Interestingly, households with 3+ vehicles at present shows a 52% 11
increase in choosing SAVs, likely from large family sizes with members accustomed to sharing 12
their ride. Households with few (up to 3) children and significant number of workers may prefer 13
AVs for their LD travel. Interest in SAVs is spread out through all income groups while results 14
suggest that some income brackets may not use SAVs for their LD needs, which is quite 15
interesting. Single people seem to prefer to fly, and households with two or more members show 16
a tendency to prefer AVs and SAVs. 17
Gurumurthy and Kockelman 18
1
Figure 3 Covariate Elasticities for Future Mode Choice in Long-Distance Travel2

Gurumurthy and Kockelman 19
CONCLUSIONS 1
This study builds on gaps in past public AV-perception studies by emphasizing ethics, privacy, the 2
nuances of dynamic ride-sharing (with strangers in SAVs), and long-distance trip shifts. AVs and 3
SAVs are still emerging, and perceptions will evolve as providers deliver more demonstrations 4
and first-hand experiences. In the meantime, policymakers, producers, planners and engineers can 5
all benefit from a sense of what Americans and others expect to do with such technologies. 6
Dynamic ride-sharing preferences among adults were assessed in detail here and provided valuable 7
insights. A hurdle model to predict this WTP during the day suggests added travel time to a shared 8
trip did not influence WTP after a person is willing to share their ride, which is in line with findings 9
by Lavieri and Bhat (2019). SAV service boasting low added travel time on shared rides can attract 10
several riders, and when used in tandem with smart pricing to cater to the distribution of WTP, it 11
can be an effective service. Practical significance was analyzed by changing the average 12
respondent’s covariate. An aging population can decrease interest in DRS, meaning the future of 13
the service lies almost entirely in the younger generation. Policymakers should cater to this target 14
audience to maximize benefits. Eventually, phasing out driver licensure can also help improve 15
SAV use and increase DRS. Higher employment densities or household incomes may increase 16
WTP by 21% and 26%, respectively, meaning higher WTP is nearly inevitable with an improving 17
economy. Few respondents appear willing to use DRS at night, but background checks on riders 18
can help increase ridership. 19
Greater levels of concern emerge when privacy is the focus of a survey question, rather than as 20
one among many potential issues to be selected by a respondent. A hurdle model developed for 21
WTP to anonymize location while using AVs indicated that, at present, there were many indicators 22
alluding toward privacy concerns (like age, number of children in the household, vehicle 23
ownership and income). However, an elasticity analysis revealed that this may not be true in the 24
future. Change in all of the covariates led to a decrease in the expected WTP indicating that this 25
may soon not be an issue. However, this bold claim warrants a more elaborate privacy study, 26
though it is beyond the scope of this paper. 27
Crash ethics, although not modeled, were investigated, using three targeted questions based on 28
different crash scenarios. Americans feel that any AV, when having no choice but to crash into 29
one or more pedestrians or vehicles should not change its trajectory (to select a different pedestrian 30
or vehicle to crash into), even if the current trajectory does not minimize overall harm. They expect 31
this to be left to chance and believe that AV manufacturers must be held accountable. The future 32
of insurance companies may change drastically if this is mandated by governments. 33
Americans expect much of their long-distance travel (for trips over 50 miles, one-way) to shift 34
toward AVs and SAVs. For example, nearly 50% of trips between 50 and 500 miles (one-way) are 35
expected to eventually take place in an AV or SAVs, however, this is slightly lower than LaMondia 36
et al.’s (2016) prediction of around 55%, on average for these ranges showing a shift in 37
perceptions. A multinomial logit for long-distance mode choices in the presence of affordable AVs 38
Gurumurthy and Kockelman 20
and SAVs, suggests that Americans prefer SAVs, irrespective of their household’s income, ceteris 1
paribus. Some business travel under 500 miles is also expected to be completed using SAVs. Older 2
people are estimated to prefer to use their own vehicles, now and in the future. Shifts in mode 3
splits were also examined. For example, SAV share for long-distance trips rises by 67% when the 4
average long-distance traveler is traveling for business. Work-centric households (more than 5
average number of workers in the household) may prefer to own AVs more than other households. 6
Middle-class households may be greatly inclined towards SAVs (196% increase in share if the 7
average respondent was earning between $75k and $120k). The aviation sector may wish to adjust 8
its investments and future marketing strategies in response to changes in market share for long-9
distance travel. 10
These results suggest that Americans are not yet very confident about AV use, but expect to 11
develop heavy usage levels. WTP, demand levels, perception and public opinion are helpful to 12
transportation planners and policymakers, technologists and vehicle manufacturers, fleet managers 13
and system operators, as well as airlines, land developers, attorneys, insurers, and the tourism 14
industry. Regular survey efforts help nations and regions, companies and public agencies, better 15
prepare for the coming paradigm shifts, hopefully with equity, environment, and efficiency in 16
mind. The limitation to keep the survey relatively brief meant that some other new innovative 17
questions were removed before final dissemination. Upcoming surveys should consider inquiry 18
into new AV and SAV design in the absence of a driver. Ride-sourcing companies do not allow 19
users to rate those in their shared rides. Screening based on an existing social connection (e.g., via 20
Facebook or LinkedIn), or satisfying a criminal background check may help with shared rides. 21
Future work can tackle such aspects of SAVs and DRS. Additionally, in the realm of DRS, 22
acceptable waiting times can be assessed instead of forcing a pre-determined waiting time on the 23
respondent for WTP questions. 24
ACKNOWLEDGEMENTS 25
The authors are grateful for the funding support of the Texas Department of Transportation (under 26
research project 0-6838), data summary assistance from Hyungseung (Jeffrey) Hahm and for the 27
survey design suggestions of Dr. Patrick Lin, Dr. Luis Willumsen, Jeff Miles, Todd Litman and 28
several others, along with the editing and administrative support of Scott Schauer-West. 29
REFERENCES 30
Abraham, H., Lee, C., Brady, S., Fitzgerald, C., Mehler, B., Reimer, B. and Coughlin, J., 2016. 31
Autonomous Vehicles, Trust, and Driving Alternatives: A survey of consumer preferences. MIT 32
AgeLab White Paper (2016-6). AgeLab, Massachusetts Institute of Technology. Retrieved from: 33
http://agelab.mit.edu/files/publications/2016_6_Autonomous_Vehicles_Consumer_Preferences.p34
df (July 20, 2017). 35
Agatz, N., Erera, A., Savelsbergh, M. and Wang, X. 2011. Dynamic ride-sharing: A simulation 36
study in metro Atlanta. Procedia Social and Behavioral Sciences 17: 532-550. 37
American Automobile Association. 2016. Driving Costs Hit Six-Year Low, Finds AAA. Online 38
at: https://newsroom.aaa.com/2016/04/driving-costs-hit-six-year-low-finds-aaa-2/ 39
Bansal, Prateek and Kockelman, K. 2017. Forecasting Americans' Long-Term Adoption of 40
Connected and Autonomous Vehicle Technologies. Transportation Research Part A 95: 49-63. 41
Gurumurthy and Kockelman 21
Bansal, Prateek and Kockelman, K. 2018. Are We Ready to Embrace Connected & Self-Driving 1
Vehicles? A Case Study of Texans. Transportation 45 (2): 641-675. 2
Bischoff, J., Soeffker, N. and Maciejewski, M. 2016. A framework for agent based simulation of 3
demand responsive transport systems. Proceedings in the International Conference on Operations 4
Research, Hamburg, Germany. Retrieved from: http://dx.doi.org/10.14279/depositonce-5760 5
(June 30, 2017). 6
Bonnefon, J., Shariff, A. and Rahwan, I. 2016. The social dilemma of autonomous vehicles. 7
Science 352(6293): 1573-1576. 8
Breidert, C., Hahsler, M., and Reutterer, T. 2006. A Review of Methods for Measuring 9
Willingness-To-Pay. Innovative Marketing 2(4): 8-32. 10
Cragg, J. 1971. Some Statistical Models for Limited Dependent Variables with Application to 11
the Demand for Durable Goods. Econometrica 39(5): 829-844. 12
Deloitte. 2014. Global Automotive Consumer Study Exploring consumers’ mobility choices and 13
transportation decisions. Retrieved from: 14
https://www.autonews.com/assets/PDF/CA92618116.PDF (July 10, 2017). 15
Fagnant, D.J., Kockelman, K., 2015. Preparing a nation for autonomous vehicles: opportunities, 16
barriers and policy recommendations. Transportation. Research Part A 77, 167–181. 17
Fagnant, Daniel J. and Kockelman, Kara M. 2018. Dynamic ride-sharing and fleet sizing for a 18
system of shared autonomous vehicles. Transportation 45: 143-158. 19
Farhan, Javed and Chen, T. Donna. 2018. Impact of Ridesharing on Operational Efficiency of 20
Shared Autonomous Electric Vehicle Fleet. Transportation Research Part C: Emerging 21
Technologies 93: 310-321. 22
Fleetwood, J. 2017. Public Health, Ethics, and Autonomous Vehicles. American Journal of 23
Public Health 107(4): 532-537. 24
Goodall, N.J. 2017. From Trolleys to Risk: Models for Ethical Autonomous Driving. American 25
Journal of Public Health 107 (4): 496. 26
Greenblatt, J.B. and Shaheen, S. 2015. Automated vehicles, on-demand mobility, and 27
environmental impacts. Current Sustainable/Renewable Energy Reports 2(3): 74-81. 28
Gurumurthy, K.M. 2017. Perceptions and preferences of autonomous and shared autonomous 29
vehicles: A focus on dynamic ride-sharing (Master’s Thesis). Retrieved from: 30
http://hdl.handle.net/2152/63553 (October 5, 2018). 31
Gurumurthy, K.M., and Kockelman, K. 2018. Analyzing the Dynamic Ride-Sharing Potential for 32
Shared Autonomous Vehicle Fleets Using Cellphone Data from Orlando, Florida. Computers, 33
Environment and Urban Systems 71: 177-185. 34
Gurumurthy, K.M., Kockelman, K.M., and Simoni, M.D. 2019. Benefits and Costs of Ride-35
Sharing in Shared Automated Vehicles across Austin, Texas: Opportunities for Congestion 36
Pricing. Transportation Research Record: Journal of the Transportation Research Board 2673 37
(6): 548-556. 38
Gurumurthy and Kockelman 22
Haboucha, C.J., Ishaq, R., and Shiftan, Y. 2017. User preferences regarding autonomous 1
vehicles. Transportation Research Part C 78: 37-49. 2
Huang, Y., Kockelman, K.M., and Quarles, N. 2019. How Will Self-Driving Vehicles Affect 3
U.S. Megaregion Traffic? The Case of the Texas Triangle. Presented at the 98th Annual Meeting 4
of the Transportation Research Board, Washington, DC. 5
Jenkins, R. 2016. Autonomous Vehicle Ethics & Law – Toward an Overlapping Consensus. A 6
New America Foundation Report. Retrieved from: https://na-7
production.s3.amazonaws.com/documents/AV-Ethics-Law.pdf (July 10, 2017). 8
Kelly Blue Book. 2016. Future Autonomous Vehicle Driver Study – September 2016. Retrieved 9
from: 10
https://mediaroom.kbb.com/download/Kelley+Blue+Book+Future+Autonomous+Vehicle+Drive11
r+Study+-+FINAL.pdf (July 10, 2017). 12
Krueger, R., Rashidi, T., and Rose, J. 2016. Preferences for shared autonomous vehicles. 13
Transportation Research Part C (69): 343-355. 14
LaMondia, J.J., Fagnant, D.J., Qu, H., Barrett, J. and Kockelman, K., 2016. Shifts in Long-15
Distance Travel Mode Due to Automated Vehicles: Statewide Mode-Shift Simulation Experiment 16
and Travel Survey Analysis. Transportation Research Record (2566): 1-11. 17
Lavieri, P., Garikapati, V., Bhat, C., Pendyala, R., Astroza, S., and Dias, F. 2017. Modeling 18
Individual Preferences for Ownership and Sharing of Autonomous Vehicle Technologies. 19
Transportation Research Record: Journal of the Transportation Research Board 2665: 1-10. 20
Lavieri, P., and Bhat, C. 2019. Modeling Individual’s Willingness to Share Trips with Strangers 21
in an Autonomous Vehicle Future. Transportation Research Part A 124: 242-261. 22
Lee C., Ward C., Raue M., D’Ambrosio L., Coughlin J., 2017. Age Differences in Acceptance of 23
Self-Driving Cars: A Survey of Perceptions and Attitudes. Proceedings in the 3rd International 24
Conference on Human Aspects of IT for the Aged Population, Vancouver, Canada. Retrieved 25
from: https://link.springer.com/chapter/10.1007/978-3-319-58530-7_1 (July 20, 2017). 26
Loeb, B., Kockelman, K., and Liu. J. 2018. Shared Autonomous Electric Vehicle (SAEV) 27
Operations Across the Austin, Texas Network with a Focus on Charging Infrastructure 28
Decisions. Transportation Research Part C: Emerging Technologies 89: 222-233. 29
Miller, K., Hofstetter, R., Krohmer, J., and Zhang, J.Z. 2011. How Should Consumers’ 30
Willingness to Pay Be Measured? An Empirical Comparison of State-of-the-Art Approaches. 31
Journal of Marketing Research 48(1): 172-184. 32
Perrine, K., Kockelman, K., and Huang, Y. 2018. Anticipating Long-Distance Travel Shifts due 33
to Self-Driving Vehicles. Presented at the 97th Annual Meeting of the Transportation Research 34
Board, Washington, D.C. 35
PUMS (Public Use Microdata Sample) (2011-2015) United State Census Bureau: American 36
Community Survey. Retrieved from: https://www.census.gov/programs-37
surveys/acs/data/pums.html (June 10, 2017). 38

Gurumurthy and Kockelman 23
Quarles, N., and Kockelman, K., 2017. Americans’ Plans for Acquiring and Using Electric, 1
Shared and Self-Driving Vehicles. Under review for publication in Transportation, and available 2
at http://www.caee.utexas.edu/prof/kockelman/public_html/TRB18surveyFleetEvolution.pdf 3
San Francisco Municipal Transportation Agency. 2015. Travel Decisions Survey 2015 – 4
Summary Report, San Francisco. Retrieved from: 5
https://www.sfmta.com/sites/default/files/reports/2016/Travel%20Decision%20Survey%2020156
%20Report_Accessible.pdf (June 30, 2017). 7
Schoettle, B. and Sivak, M., 2014. A Survey of Public Opinion About Autonomous and Self-8
Driving Vehicles in the U.S., the U.K., and Australia. University of Michigan, Technical Report 9
No. UMTRI-2014-21. Retrieved from: https://deepblue.lib.umich.edu/handle/2027.42/108384 10
(June 30, 2017). 11
Schoettle, B. and Sivak, M., 2016. Motorists Preferences for Different Levels of Vehicle 12
Automation – 2016. University of Michigan, Technical Report No. SWT-2016-8. Retrieved 13
from: http://umich.edu/~umtriswt/PDF/SWT-2016-8.pdf (July 20, 2017). 14
Stocker, A., and Shaheen, S. 2019. Shared Automated Vehicle (SAV) Pilots and Automated 15
Vehicle Policy in the U.S.: Current and Future Developments. Road Vehicle Automation 5, 16
Lecture Notes in Mobility. Eds. Meyer, G., and Beiker, S.: Springer International Publishing, 17
131-147. 18
Sommer, K., 2013. Continental Mobility Study 2013. Continental AG. Retrieved from: 19
https://www.continental-20
corporation.com/resource/blob/7380/6cddc571cd3d3b5cacd279fe0d1a00c1/mobistud-2013-dl-21
data.pdf (June 30, 2017). 22
StataCorp, 2015. Stata Statistical Software: Release 14. College Station, TX: StataCorp LP. 23
Stoiber, T., Schubert, I., Hoerler, R., Burger, P. 2019. Will consumers prefer shared and pooled-24
use autonomous vehicles? A stated choice experiment with Swiss households. Transportation 25
Research Part D 71: 265-282. 26
Vujanic, A., and Unkefer, H., 2011. Embedded software consumer pulse survey. Accenture 27
Research. Retrieved from: 28
https://newsroom.accenture.com/content/1101/files/EmbeddedSoftwareOverall.pdf (June 30, 29
2017). 30