modeling & forecasting covid -19 in nm
TRANSCRIPT
Modeling & Forecasting COVID-19 in NM
August 24, 2021
UNCLASSIFIED
UNCLASSIFIEDLos Alamos National Laboratory
Copyright Notice And Disclaimer
For Scientific and Technical Information Only © Copyright Triad National Security, LLC. All Rights Reserved.
For All Information Unless otherwise indicated, this information has been authored by an employee or employees of the Triad National Security, LLC., operator of the Los Alamos National Laboratory with the U.S. Department of Energy. The U.S. Government has rights to use, reproduce, and distribute this information. The public may copy and use this information without charge, provided that this Notice and any statement of authorship are reproduced on all copies.
While every effort has been made to produce valid data, by using this data, User acknowledges that neither the Government nor Triad makes any warranty, express or implied, of either the accuracy or completeness of this information or assumes any liability or responsibility for the use of this information. Additionally, this information is provided solely for research purposes and is not provided for purposes of offering medical advice. Accordingly, the U.S. Government and Triad are not to be liable to any user for any loss or damage, whether in contract, tort (including negligence), breach of statutory duty, or otherwise, even if foreseeable, arising under or in connection with use of or reliance on the content displayed on this site.

Short- & Long-Term Forecast for NM: Cases
Los Alamos National Laboratory
UNCLASSIFIED
UNCLASSIFIED
So what?Our model suggests that the number of daily cases is expected to range between 350 and
1,500 in the next few weeks

Short- & Long-Term Forecast for NM: Deaths
Los Alamos National Laboratory
UNCLASSIFIED
UNCLASSIFIED
So what?Our model suggests that the number of daily
deaths is expected to range between 0 and 7 in the next few weeks

Growth Rate for NM
8/24/2021 | 4Los Alamos National Laboratory
So what?As of August 24th, the average growth rate in NM is at 0.36% (up from 0.23%)
8/24/2021 | 5Los Alamos National Laboratory
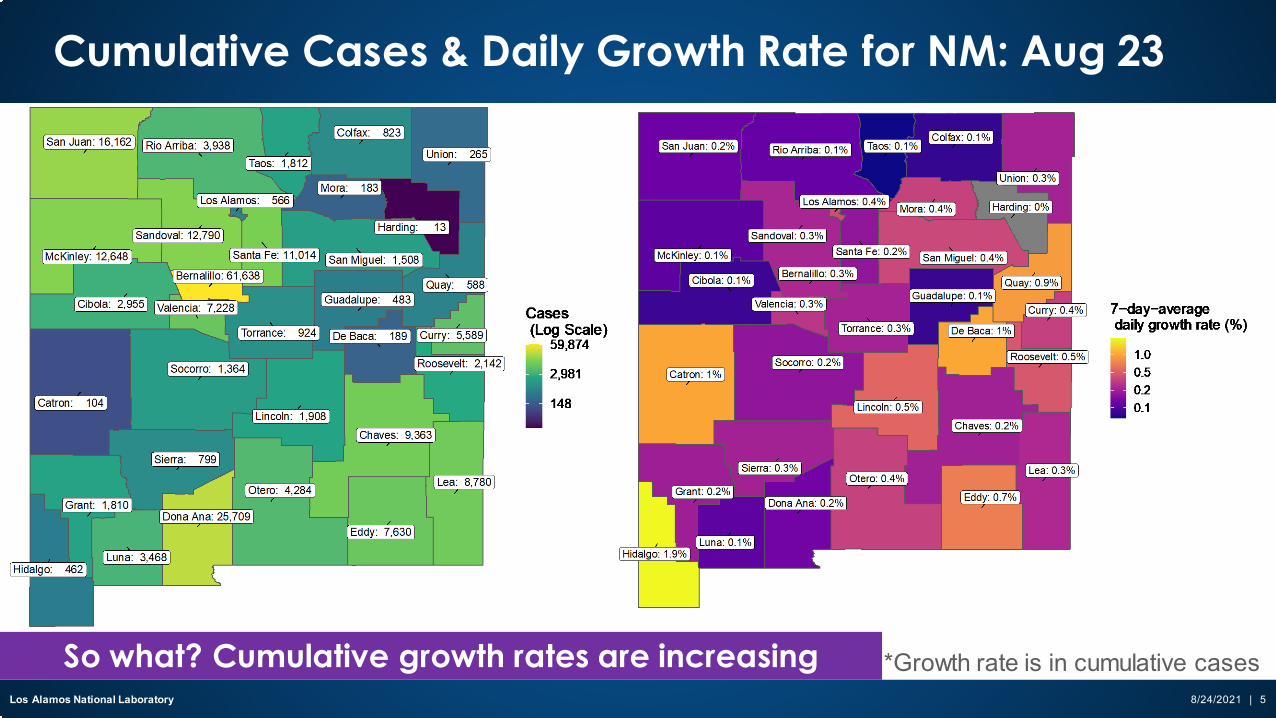
Cumulative Cases & Daily Growth Rate for NM: Aug 23
*Growth rate is in cumulative casesSo what? Cumulative growth rates are increasing
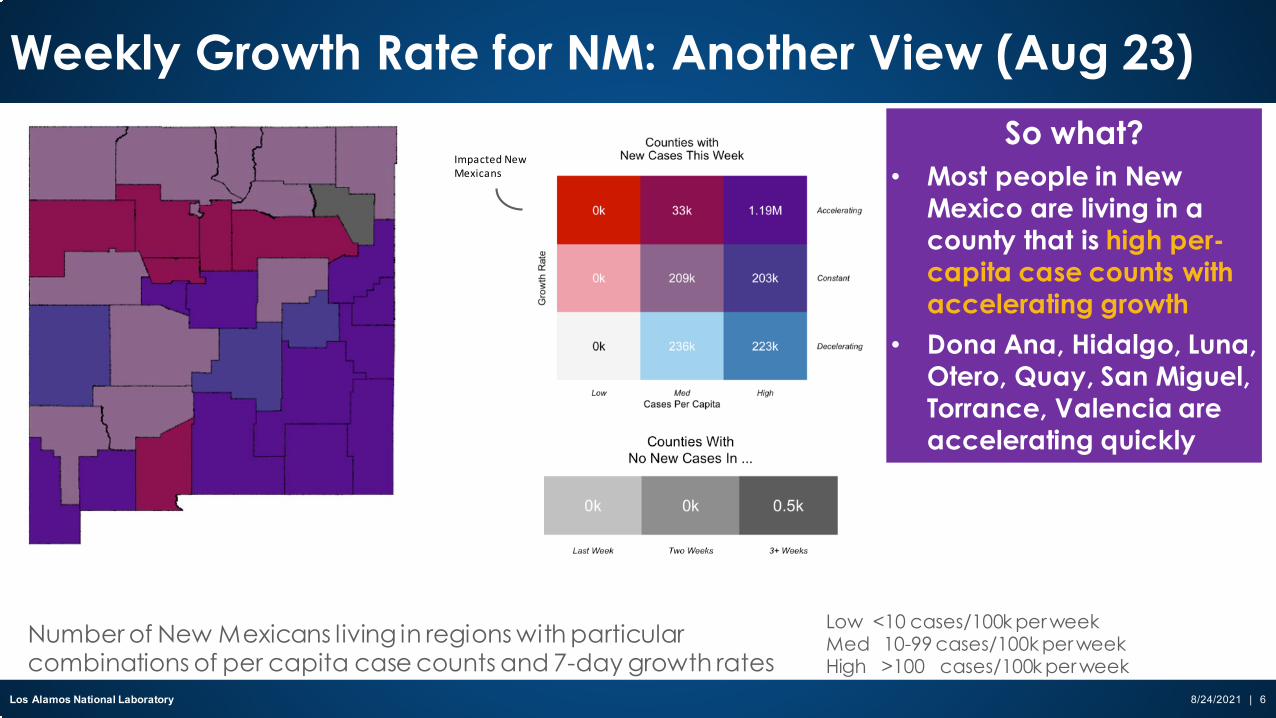
Weekly Growth Rate for NM: Another View (Aug 23)
8/24/2021 | 6Los Alamos National Laboratory
So what?• Most people in New
Mexico are living in a county that is high per-capita case counts with accelerating growth
• Dona Ana, Hidalgo, Luna, Otero, Quay, San Miguel, Torrance, Valencia are accelerating quickly
Low <10 cases/100k per weekMed 10-99 cases/100k per weekHigh >100 cases/100k per week
Number of New Mexicans living in regions with particular combinations of per capita case counts and 7-day growth rates
Impacted New Mexicans

Los Alamos National Laboratory
> Additional Regional Forecasts
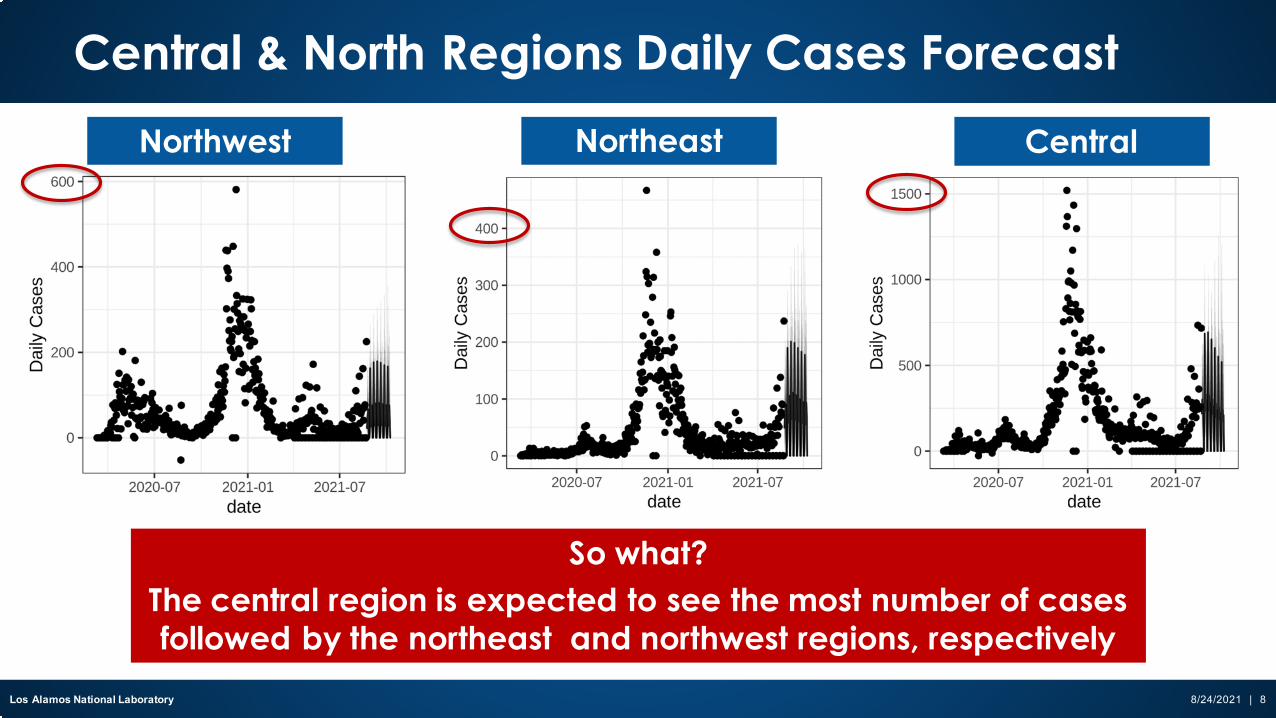
Central & North Regions Daily Cases Forecast
8/24/2021 | 8Los Alamos National Laboratory
Northwest Northeast Central
So what?The central region is expected to see the most number of cases followed by the northeast and northwest regions, respectively
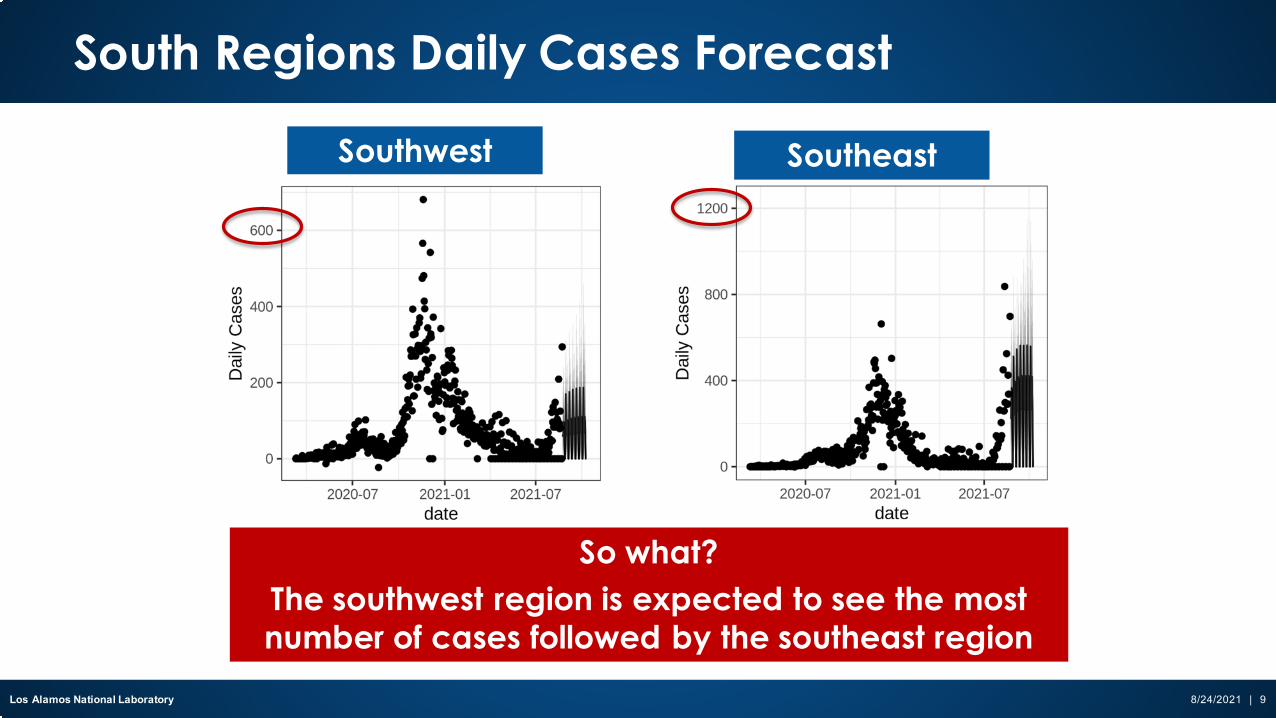
South Regions Daily Cases Forecast
8/24/2021 | 9Los Alamos National Laboratory
Southwest Southeast
So what?The southwest region is expected to see the most number of cases followed by the southeast region
Los Alamos National Laboratory
> Non-Congregational Shelter Forecast
8/24/2021 | 11Los Alamos National Laboratory
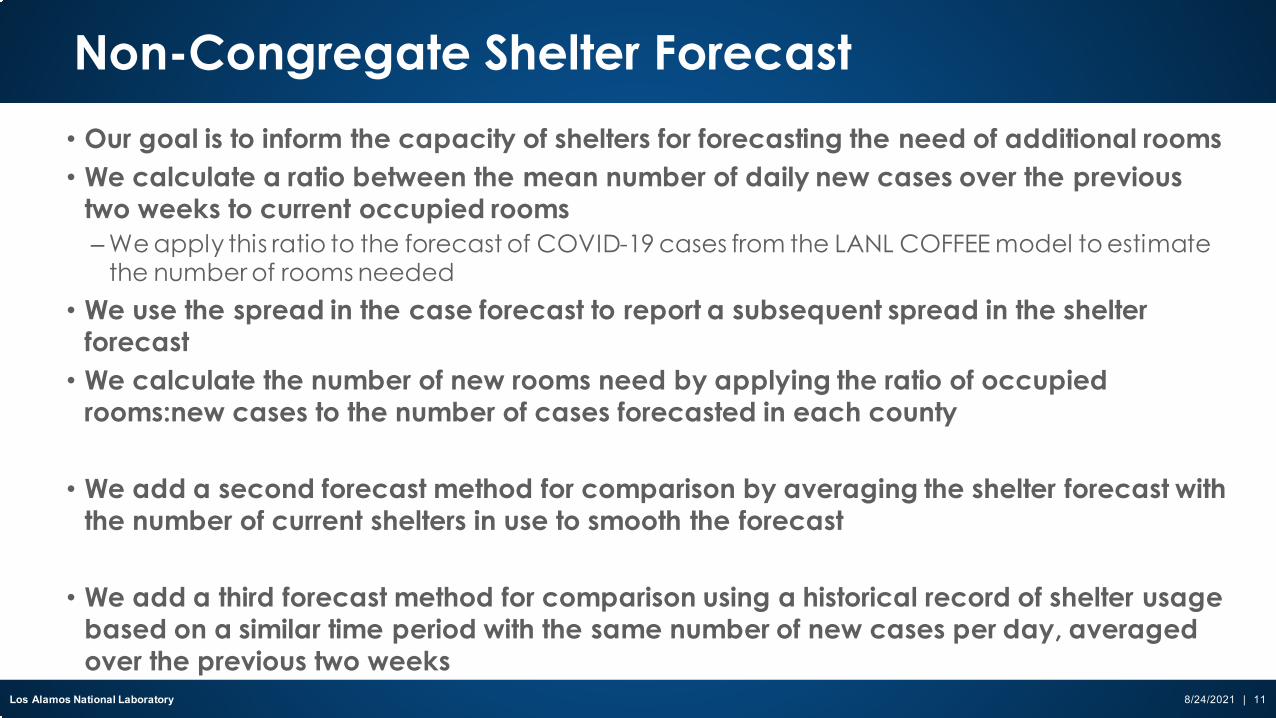
Non-Congregate Shelter Forecast• Our goal is to inform the capacity of shelters for forecasting the need of additional rooms• We calculate a ratio between the mean number of daily new cases over the previous
two weeks to current occupied rooms– We apply this ratio to the forecast of COVID-19 cases from the LANL COFFEE model to estimate
the number of rooms needed• We use the spread in the case forecast to report a subsequent spread in the shelter
forecast• We calculate the number of new rooms need by applying the ratio of occupied
rooms:new cases to the number of cases forecasted in each county
• We add a second forecast method for comparison by averaging the shelter forecast with the number of current shelters in use to smooth the forecast
• We add a third forecast method for comparison using a historical record of shelter usage based on a similar time period with the same number of new cases per day, averaged over the previous two weeks

Recommendations
8/24/2021 | 12Los Alamos National Laboratory
• In addition to the counties that already have shelters:
• Based on current trends in new cases per day and case forecasts, we recommend the following counties be considered for potential shelter locations:– Eddy

8/24/2021 | 13Los Alamos National Laboratory

Bernalillo
8/24/2021 | 14Los Alamos National Laboratory
8/29/21 9/5/21 9/12/21# of rooms needed
(case ratio forecast)33
(14-63)32
(13-64)30
(11-65)
# of rooms needed (smoothing forecast) 34 33 32
# of rooms needed (historical similarity) 41
Number of cases as of 8/22/21: 64,028Number of shelter rooms available: 221Total number of patients/medical workers (including specialty): 35Occupied rooms:new cases ratio: 0.212-week avg. new cases per day: 171

8/24/2021 | 15Los Alamos National Laboratory
Santa Fe
8/24/2021 | 16Los Alamos National Laboratory
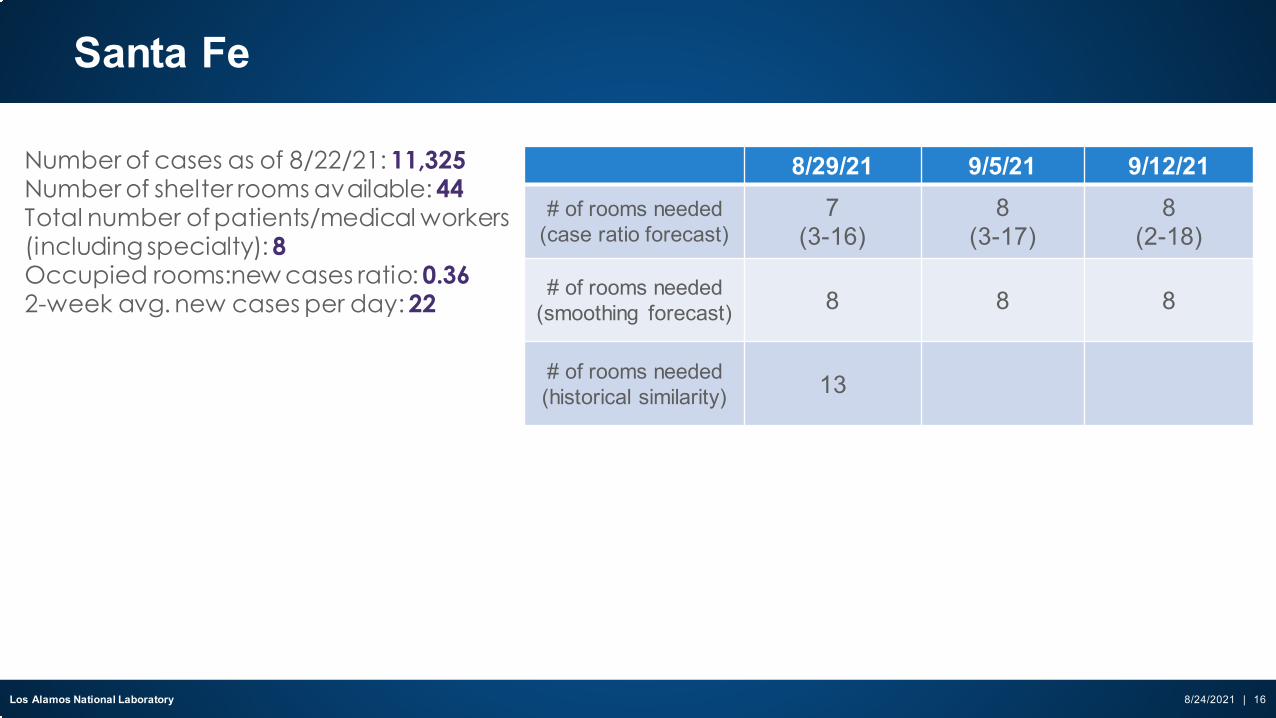
8/29/21 9/5/21 9/12/21# of rooms needed
(case ratio forecast)7
(3-16)8
(3-17)8
(2-18)
# of rooms needed (smoothing forecast) 8 8 8
# of rooms needed (historical similarity) 13
Number of cases as of 8/22/21: 11,325Number of shelter rooms available: 44Total number of patients/medical workers (including specialty): 8Occupied rooms:new cases ratio: 0.362-week avg. new cases per day: 22
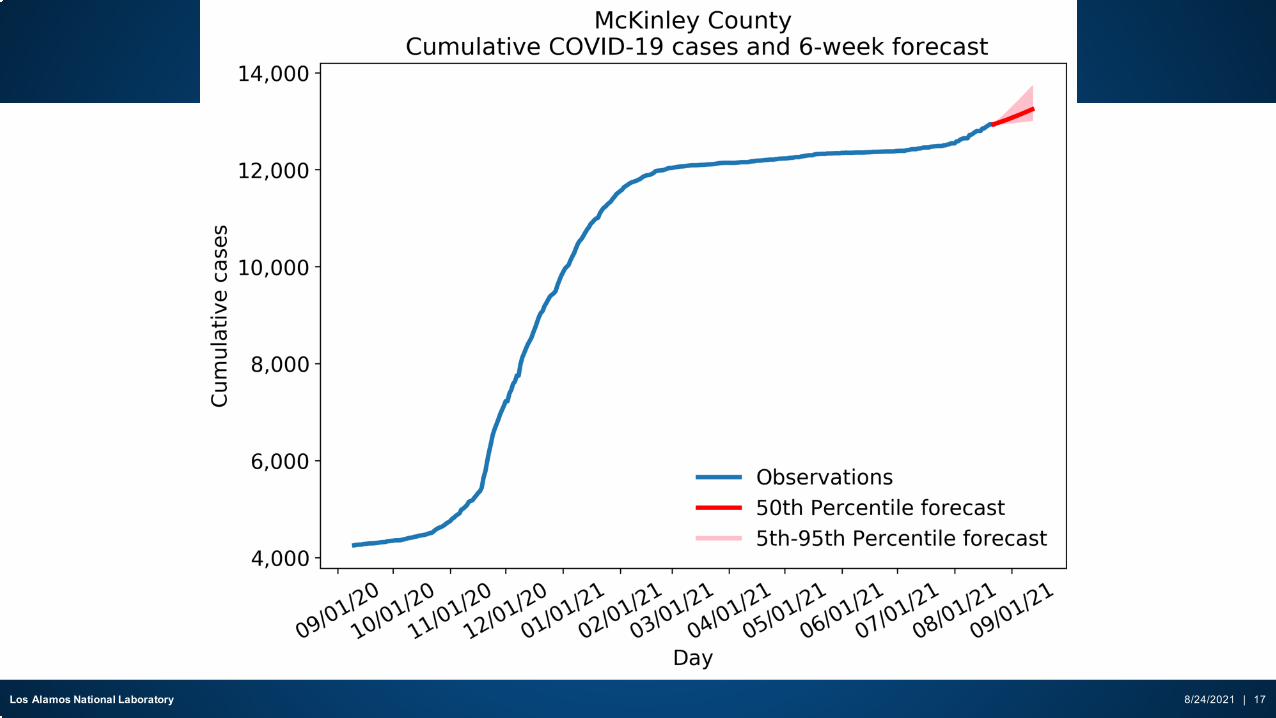
8/24/2021 | 17Los Alamos National Laboratory

McKinley
8/24/2021 | 18Los Alamos National Laboratory
8/29/21 9/5/21 9/12/21# of rooms needed
(case ratio forecast)70
(19-187)81
(24-20)87
(26-217)
# of rooms needed (smoothing forecast) 91 88 88
# of rooms needed (historical similarity) 23
Number of cases as of 8/22/21: 12,935Number of shelter rooms available: 410Total number of patients/medical workers (including specialty): 111Occupied rooms:new cases ratio: 5.42-week avg. new cases per day: 21

8/24/2021 | 19Los Alamos National Laboratory

San Juan
8/24/2021 | 20Los Alamos National Laboratory
8/29/21 9/5/21 9/12/21# of rooms needed
(case ratio forecast)1
(0-2)1
(0-2)1
(0-2)
# of rooms needed (smoothing forecast) 1 1 1
# of rooms needed (historical similarity) 1
Number of cases as of 8/22/21: 16,607Number of shelter rooms available: 67Total number of patients/medical workers (including specialty): 1Occupied rooms:new cases ratio: 0.032-week avg. new cases per day: 32

8/24/2021 | 21Los Alamos National Laboratory

Eddy
8/24/2021 | 22Los Alamos National Laboratory
8/29/21 9/5/21 9/12/21# of rooms needed
(case ratio forecast)- - -
# of rooms needed (smoothing forecast) - - -
# of rooms needed (historical similarity) -
Number of cases as of 8/22/21: 8,494Number of shelter rooms available: 0Total number of patients/medical workers (including specialty): 0Occupied rooms:new cases ratio: 02-week avg. new cases per day: 62
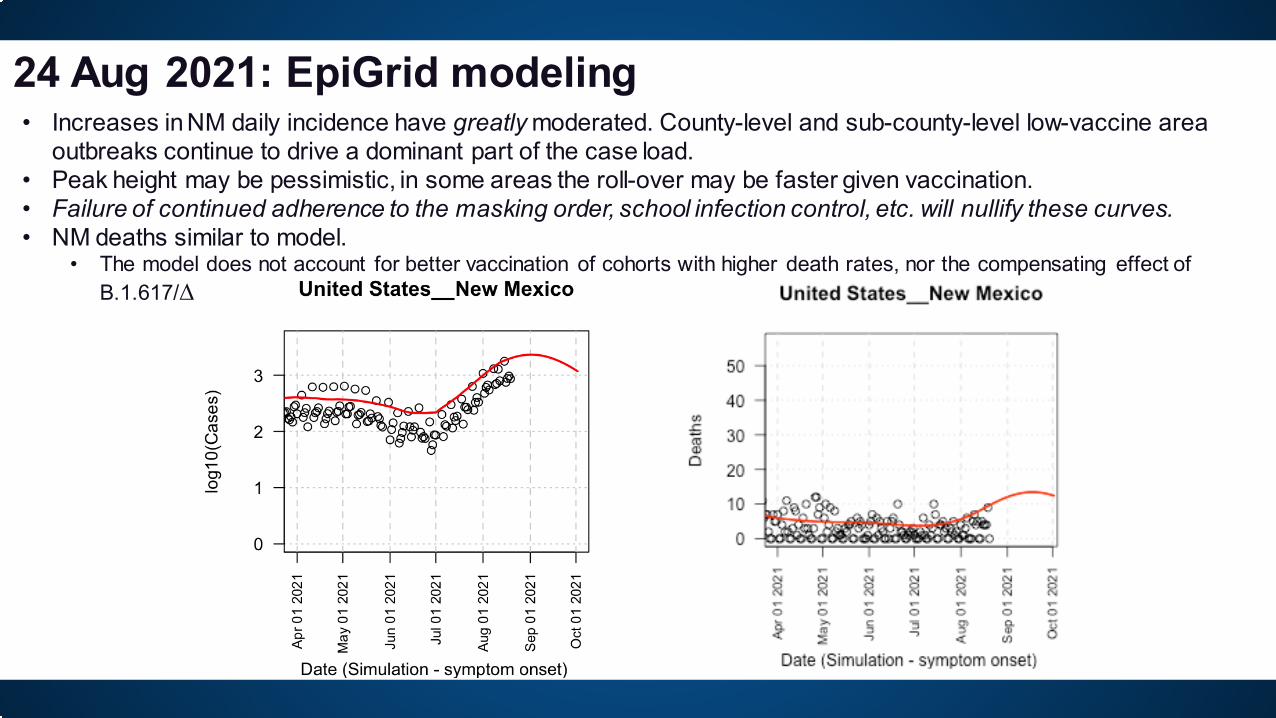
24 Aug 2021: EpiGrid modeling • Increases in NM daily incidence have greatly moderated. County-level and sub-county-level low-vaccine area
outbreaks continue to drive a dominant part of the case load.• Peak height may be pessimistic, in some areas the roll-over may be faster given vaccination.• Failure of continued adherence to the masking order, school infection control, etc. will nullify these curves.• NM deaths similar to model.
• The model does not account for better vaccination of cohorts with higher death rates, nor the compensating effect of B.1.617/∆
8/24/2021 | 2Los Alamos National Laboratory
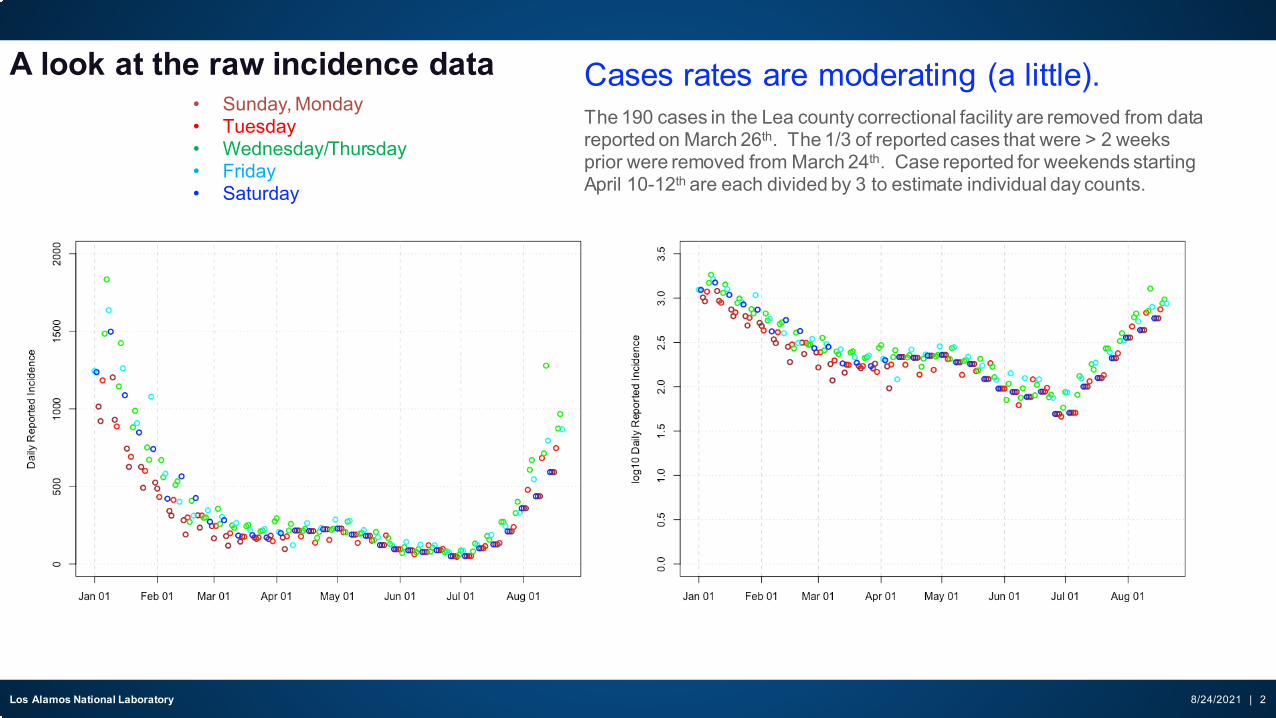
A look at the raw incidence dataThe 190 cases in the Lea county correctional facility are removed from data reported on March 26th. The 1/3 of reported cases that were > 2 weeks prior were removed from March 24th. Case reported for weekends starting April 10-12th are each divided by 3 to estimate individual day counts.
• Sunday, Monday• Tuesday• Wednesday/Thursday• Friday• Saturday
Cases rates are moderating (a little).

8/24/2021 | 3Los Alamos National Laboratory
24 August 2021 Vaccine Analysis and Summary• ~1331k first doses have been administered in NM.• ~1154k completed vaccine series in NM.• Epigrid is modeling this as 1330k first doses.• ~63.5% of all persons in New Mexico are vaccinated.
• Licensure/Approval of Pfizer creates multiple opportunities to rapidly increase the number of vaccinated persons.
• Substantially better control likely with >10% increases in vaccination uptake.
Black – vaccination for all New Mexicans
Red – First dose data used in EpiGrid.

8/24/2021 | 4Los Alamos National Laboratory
Variants: Still Delta (for now, keep watching …)B.1.617.2, “∆” is “Indian variant”B.1.1.7, “α” is “UK variant”P.1 is “Brazilian variant”
https://www.cdc.gov/coronavirus/2019-ncov/covid-data/covidview/08202021/images/variants-1_0820
New Mexico data, Delta dominant
https://www.cdc.gov/coronavirus/2019-ncov/covid-data/covidview/index.html

8/24/2021 | 5Los Alamos National Laboratory
What is happening in the rest of the U.S.? The 10 most populous states plus New Mexico
Trend over the last 3 weeks: Increasing: Georgia, Illinois, Michigan, California(?), New Mexico(?). Recent increases: Ohio. Steady: New York, Florida, Texas, Pennsylvania, North Carolina.
Daily rates per 100,000 residents averaged August 15th thru August 21st 2021.
8/24/2021 | 6Los Alamos National Laboratory
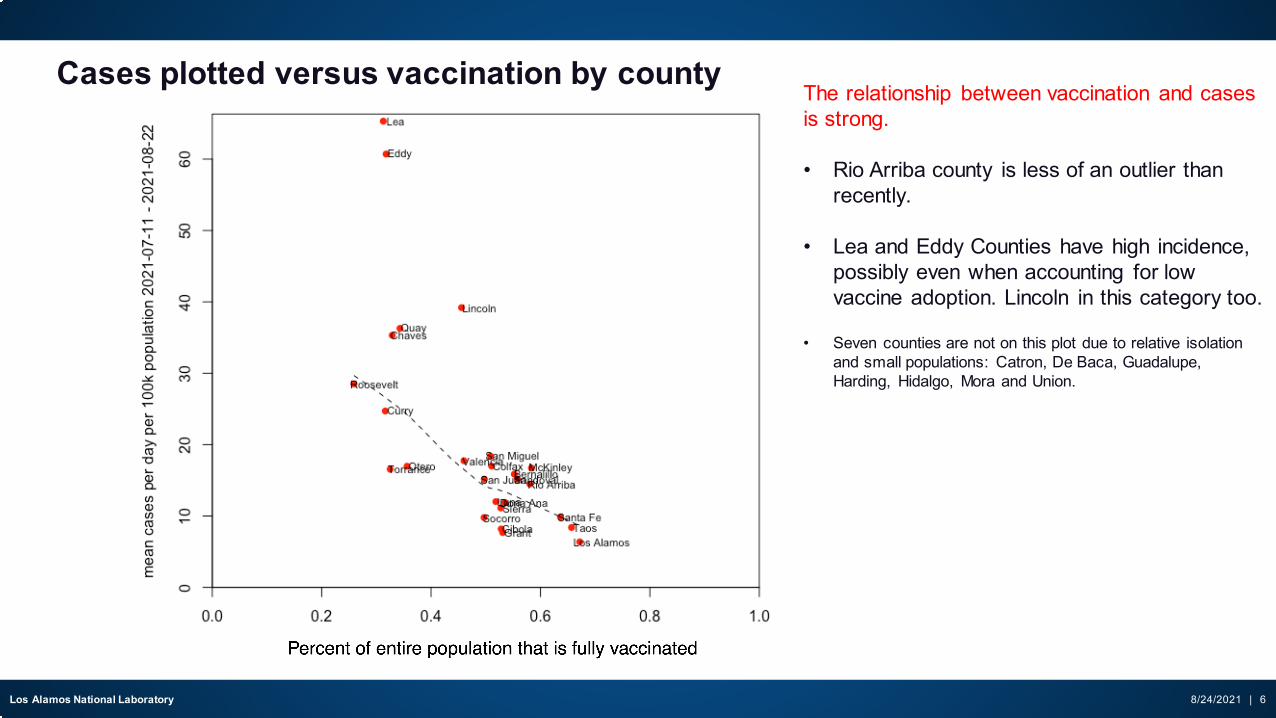
Cases plotted versus vaccination by countyThe relationship between vaccination and cases is strong.
• Rio Arriba county is less of an outlier thanrecently.
• Lea and Eddy Counties have high incidence,possibly even when accounting for lowvaccine adoption. Lincoln in this category too.
• Seven counties are not on this plot due to relative isolationand small populations: Catron, De Baca, Guadalupe,Harding, Hidalgo, Mora and Union.

8/24/2021 | 7Los Alamos National Laboratory
Cases decrease with vaccination (no matter how the vaccination data are plotted)
May 5th, average doses 1 and 2
May 5th 2nd dose
June 1, 1st dose
June 13, average of doses 1 and 2