modeling and analysis of actinide diffusion behavior in
TRANSCRIPT

University of New MexicoUNM Digital Repository
Nuclear Engineering ETDs Engineering ETDs
7-11-2013
Modeling and Analysis of Actinide DiffusionBehavior in Irradiated Metal FuelPaul Edelmann
Follow this and additional works at: https://digitalrepository.unm.edu/ne_etds
This Dissertation is brought to you for free and open access by the Engineering ETDs at UNM Digital Repository. It has been accepted for inclusion inNuclear Engineering ETDs by an authorized administrator of UNM Digital Repository. For more information, please contact [email protected].
Recommended CitationEdelmann, Paul. "Modeling and Analysis of Actinide Diffusion Behavior in Irradiated Metal Fuel." (2013).https://digitalrepository.unm.edu/ne_etds/2

i
Paul G. Edelmann Candidate
Chemical and Nuclear Engineering
Department
This dissertation is approved, and it is acceptable in quality and form for publication:
Approved by the Dissertation Committee:
Cassiano de Oliveira, Chairman
Gary W. Cooper
Andrea Alberto Mammoli
Marina Popova

ii
Modeling and Analysis of Actinide Diffusion Behavior in Irradiated
Metal Fuel
by
PAUL G. EDELMANN
B.S., Nuclear Engineering, Rensselaer Polytechnic Institute, 1992
DISSERTATION
Submitted in Partial Fulfillment of the
Requirements for the Degree of
Doctor of Philosophy
in
Engineering
The University of New Mexico
Albuquerque, New Mexico
May, 2013

iii
DEDICATION
Amorosamente dedicar esta tesis a mi esposa ya mis hijos hermosos, que me han apoyado
en cada paso del camino.

iv
ACKNOWLEDGMENTS
I would like to express my deepest gratitude to my advisor and Committee
Chairman, Dr. Cassiano Ricardo Endres de Oliveira, for his excellent guidance, caring
and patience through these years with all the changes and for never giving up on me. I
would also like to thank my other Committee Members: Dr. Gary W. Cooper, Dr. Andrea
Alberto Mammoli, and Dr. Marina Popova, all very kindly having agreed to participate in
my final defense.
I will forever be indebted to my wife Elida, and to my three wonderful children,
Katrina, Erik and Alexandra. They all helped to make this possible through their love and
support.

v
MODELING AND ANALYSIS OF ACTINIDE DIFFUSION BEHAVIOR IN
IRRADIATED METAL FUEL
by
Paul Edelmann
B.S., Nuclear Engineering, Rensselaer Polytechnic Institute, 1992
Ph.D., Engineering, University of New Mexico, 2013
ABSTRACT
There have been numerous attempts to model fast reactor fuel behavior in the last
40 years. The US currently does not have a fully reliable tool to simulate the behavior of
metal fuels in fast reactors. The experimental database necessary to validate the codes is
also very limited. The DOE-sponsored Advanced Fuels Campaign (AFC) has performed
various experiments that are ready for analysis. Current metal fuel performance codes are
either not available to the AFC or have limitations and deficiencies in predicting AFC
fuel performance. A modified version of a new fuel performance code, FEAST-Metal ,
was employed in this investigation with useful results.
This work explores the modeling and analysis of AFC metallic fuels using
FEAST-Metal, particularly in the area of constituent actinide diffusion behavior. The
FEAST-Metal code calculations for this work were conducted at Los Alamos National
Laboratory (LANL) in support of on-going activities related to sensitivity analysis of fuel
performance codes. A sensitivity analysis of FEAST-Metal was completed to identify
important macroscopic parameters of interest to modeling and simulation of metallic fuel
performance. A modification was made to the FEAST-Metal constituent redistribution
model to enable accommodation of newer AFC metal fuel compositions with verified
results. Applicability of this modified model for sodium fast reactor metal fuel design is
demonstrated.
vi
TABLE OF CONTENTS
LIST OF ACRONYMS AND ABBREVIATIONS ...................................................... vii
CHAPTER 1. INTRODUCTION .................................................................................... 1
CHAPTER 2. THE FEAST-METAL FUEL PERFORMANCE CODE ................... 11
CHAPTER 3. FEAST-METAL PARAMETER SENSITIVITY STUDY ................. 16
CHAPTER 4. FEAST-METAL CONSTITUENT REDISTRIBUTION MODEL ... 33
CHAPTER 5. RESULTS ................................................................................................ 42
CHAPTER 6. DISCUSSION AND CONCLUSIONS ................................................ 46
REFERENCES ................................................................................................................ 48

vii
LIST OF ACRONYMS AND ABBREVIATIONS
1D One-Dimensional
3D Three-Dimensional
AEC Atomic Energy Commission
AFC Advanced Fuels Campaign
AFCI Advanced Fuel Cycle Initiative
Am Americium
ANL Argonne National Laboratory
Ar Argon
BU Burnup (A measure of fuel exposure and fissile depletion)
CDF Cumulative Damage Fraction
CPU Central Processing Unit
DOE Department of Energy
EBR-II Experimental Breeder Reactor-II
EDF Electricité de France
FCCI Fuel Clad Chemical Interaction
FCMI Fuel Clad Mechanical Interaction
FE Finite Element
FEAST Fuel Engineering And Structural analysis Tool
FEAST-METAL The metal fuel version of FEAST code

viii
GRSIS Gas Release and Swelling in ISotropic fuel matrix
He Helium
INL Idaho National Laboratory
Kr Krypton
LANL Los Alamos National Laboratory
LWR Light Water Reactor
M&S Modeling and Simulation
MIT Massachusetts Institute of Technology
MOX Mixed Oxide Fuel
Na Sodium
Np Neptunium
PCI Pellet-Clad Interaction
PIE Post-Irradiation Examination
Pu Plutonium
PWR Pressurized Water Reactor
U Uranium
US United States
Xe Xenon
Zr Zirconium

1
CHAPTER 1. INTRODUCTION
Interest in sodium-cooled fast reactors for long term actinide management and
energy production [18] has been revived and renewed by the development of recent US
Department of Energy Programs such as the Advanced Fuel Cycle Initiative (AFCI).
Analyses of these complex systems require the coupling of diverse fields, such as
thermal-hydraulics, neutronics, structural mechanics and fuel behavior.
Advancing the performance of advanced nuclear fuel cycles and advanced
reactors requires enhancing our fundamental understanding of fuel and materials behavior
under irradiation. The capability to accurately model the nuclear fuel systems and
understand fuel behavior under normal and accident operating conditions is critical. The
Advanced Fuels Campaign (AFC) is implementing a goal-oriented and science based
implementation strategy. This strategy includes theory, experiment and modeling and
simulation components. The experimental program includes a small-scale experiments
program aimed at understanding isolated phenomena and measurements of material
properties while integral tests are still required for fuel qualification. Recent advances in
computer and mathematical sciences will be used to integrate the mathematical models
developed for various phenomena to predict the integral behavior of the system at various
scales. In early phases of the development, the modeling and simulation (M&S) tools will
be used to address the scaling issues when large-scale applications are considered. The
M&S tools based on the validated theory and small-scale experiments will be used to
minimize the need for large-scale experiments before deployment.
The prediction of fuel behavior under irradiation involves very complex material
behavior that is not seen in any other engineering discipline. The understanding of
fundamental mechanisms driving damage production and evolution is not at a desirable
level of maturity and, in some cases, does not exist. To make advances toward the
development of predictive tools, it is clear that we need high-performance M&S
techniques. The recent advances in computer hardware and simulation algorithms now
enable us to simulate the atomistic and meso-scale behavior of materials, including

2
radiation-induced damage at submicron scales, with the desired level of accuracy and
computational efficiency.
It is also important to recognize that the fuel-clad interactions are primarily 3D in
nature. It would be highly desirable to have advanced three-dimensional fuel performance
codes, and such M&S tools will be developed eventually. Until that happens, we have the
1D capability of current models for steady-state and some transient performance
calculations. Most material properties are affected by the microstructure characteristics of
the materials. Predictions of transient behavior and fuel compressibility and
fragmentation (especially for oxide fuels) will require microstructural-based swelling
modeling approaches to account for the micro-chemical behavior of the fuel.
Four types of fuels have been considered for fast reactor applications. They are
oxide, metal, carbide and nitride fuels. Each fuel type has advantages and disadvantages
with respect to the others. With the success of the metal and oxide fuels demonstrated
through the 1980s and early 1990s, a considerable infrastructure and knowledge base has
been accumulated to support these two fuel types, while the interest in the more
problematic carbide and nitride fuels has faded in the United States [18].
Metal fuel advantages
In a fast neutron reactor, the minor actinides produced by neutron capture of
uranium and plutonium can be used as fuel. Metal actinide fuel is typically an alloy of
zirconium, uranium, plutonium and the minor actinides. It can be made inherently safe as
thermal expansion of the metal alloy will increase neutron leakage.
The fuel/clad gap is filled with liquid sodium, which acts as a thermal bond. Metal
fuel has other attractive characteristics as well. It has high thermal conductivity, which,
combined with a highly conducting gap, maintains low fuel temperatures and reduces
stored energy, an important feature during transients, such as the unprotected loss of
primary flow and loss of heat sink. High heavy metal density and low moderating power
provide for a harder spectrum and excellent neutron economy. Low fuel clad mechanical
3
interaction (FCMI) at the upper part of the fuel pin enables achievement of high burn-up.
Metal fuel also has good compatibility with the coolant, and facilitated manufacturing
and reprocessing by electrochemical methods. Oxide fuels have none of these advantages
for fast reactor application.
Literature Review and Current/Prior Work
Current capabilities are focused on fuel pellets, although it is known that the
limiting phenomena could be associated with the behavior of the fuel assembly (assembly
bowing, etc.). It is possible to design a fuel pellet for 40% burn-up, although this design
may result in failures at much lower burn-ups because of 3D assembly distortions when it
is placed in an assembly for many reasons [13]. In addition, despite the fact that multiple
computer codes are developed by many researchers, a robust predictive capability for
quantifying fuel behavior and its uncertainty is still lacking. Large uncertainties and
scatter still exist in the predictions, mainly because:
Fuel rods are 3D structures, and large deformations may occur.
Fuel assemblies are 3D structures and can behave differently from a single fuel
pellet.
The constitutive materials laws are nonlinear as a result of creep, plasticity, and
other material data.
Material behavior is anisotropic and time dependent.
Material behavior is not fully understood.
The science of irradiation effects on materials is not mature and is not well
understood.
The fundamental data to verify materials modeling is lacking (in some cases, data
cannot be taken directly, only indirectly).
The physical process involved makes it difficult to define separate effects testing
by controlling the boundary conditions to validate materials models.
Processes under irradiation conditions occur in a wide variety of time and length
scales, each requiring different modeling techniques.
Integrated multiscale, multiphysics modeling (that covers all scales) is lacking.
4
The most desirable approach in fuel modeling is to develop predictive tools with
3D capabilities because the location of fuel-cladding contact becomes critical for fuel-
cladding chemical interactions. Some recent attempts have been made to create 3D codes
with varying degrees of sophistication [13].
Michel et al. reported on software (PLEIADES) [14] that is developed by the
Atomic Energy Commission (AEC) and Electricité de France (EDF). This software
includes a multidimensional finite element (FE) program (ALCYONE) [15], devoted to
pressurized-water-reactor (PWR) fuel rods. Pellet clad interaction (PCI) studies are
mainly undertaken with the 3D model of ALCYONE. The objectives of their work is
twofold: (1) to propose a constitutive model for the fuel pellet, which accounts for the
stress relaxation of the material resulting from cracking and creep; and (2) to estimate the
impact of the pellet cracking on PCI.
The most recent results on the 3D thermo-mechanical model of fuels are reported
by Newman [13], who developed a 3D thermo-mechanical model that is fully coupled to
an oxygen diffusion model for both steady-state and transient cases.
The Nuclear fuels are generally in two forms, excluding some special cases for
special reactors, oxide ceramic fuels, and metal fuels. LWR technology uses ceramic
uranium oxide fuels, with explorations into mixed plutonium-uranium oxide (MOX)
fuels. The oxide and metallic uranium, uranium-zirconium, and uranium-zirconium-
plutonium fuels are currently used in the fast-reactor program. Commercial nuclear
reactor fuel design employs a simple design concept, that is, cylindrical fuel pellets with
diameters in the range of 5 to 12 mm. These are inserted into a 1 to 4-m long zircalloy-
based annular tube (clad) in such a way that there is a small gap between the fuel pellets
and zircalloy cladding. The zircalloy cladding is used to contain volatile fission products
such as Xe, He, Kr, etc., within the plenum space above the fuel pellets. The gap and
plenum are initially filled with pressurized helium. The cladding is the first safety barrier,
preventing radioactive fission release into the coolant, which would contaminate the
primary loop components in the event of failure. Similar concepts are applied to fast
reactor fuels with some modifications, such as shorter fuel rod lengths and different gap

5
fillings (liquid sodium for metal fuel and helium for oxide fuel). The metal fuel in a fast
reactor is composed of a single rod, rather than a collection of several hundred individual
pellets. The fuel pins (or rods) are bound together in an assembly (or bundle) and
separated with either grid spacers or wire-wraps, which constrain the pins radially, as
well as inducing mixing and turbulence in the coolant. In some reactor concepts, these are
contained within a can of structural material for enhanced flow control.
Although their mechanical design is simple, the thermo-mechanical behavior of a
nuclear fuel pellet or rod (the fuel assembly is more complex geometrically) involves a
complex system of interacting, competing, and conflicting processes as a result of the
high thermal-power densities and irradiation. Various fuel and reactor types have
different processes that must be modeled. However, all have some common engineering
characteristics with respect to heat transfer, solid mechanics, chemical transport,
neutronics, and fluid flow – all of these are driven by the physical mechanisms taking
place at the microstructure level (i.e., at the grain, or subgrain scale). The low
conductivity of ceramic fuels, for example, yields a steep radial temperature profile in the
fuel element. As a result, the fuel element experiences thermal stresses causing pellet
cracking and redistribution. Migration of porosity and fuel constituents and fission
products cause fuel restructuring in both metal and oxide fuels. The irradiation and
fission product, as well as the chemical interaction, changes the material properties of the
fuel and cladding. The microstructural characteristics and their evolution with fuel and
cladding irradiation can also influence these properties. Fuel swelling is a result of fission
products, both gaseous and solid, and atomic displacements due to the neutron flux
influence on the dimensional changes and mechanical properties of the materials. Swelled
fuel causes a mechanical interaction between fuel and cladding that can produce stresses
and deformation in addition to the stress caused by internal pressure in the fuel. The
nuclear (heat and irradiation) source drives many of these processes, which can be greatly
variable in thermal reactors. In addition, the chemical interactions between cladding and
coolant significantly affects the heat transfer coefficient and mechanical strength of the
cladding; these interactions can be driven by both local (nucleate boiling) and global
(soluble metals) coolant flow conditions.

6
Metal fuel typically consists of a binary alloy of uranium and zirconium or a
ternary alloy of uranium, plutonium and zirconium. The addition of americium,
neptunium, and curium to the traditional metallic fuel is considered in the AFC. These
actinides add further complications to the fuel behavior. For example, it is known from
limited data that americium acts like zirconium and diffuses toward the center of the fuel
with slower rates. Neptunium is observed to act like plutonium, which does not
significantly diffuse. The weight fractions of uranium, plutonium, zirconium, americium,
and neptunium in the AFC fuels vary; minimum and maximum values of weight fractions
are given in Table 1.
Table 1. Minimum and Maximum Weight Fractions of AFC Metallic Fuels
U Pu Zr Am Np
Max. 0.70 0.6 0.6 0.12 0.1
Min. 0.3 0.2 0.1 0.03 0.01
However, various phenomena limit the in-core performance of metal fuel
assemblies, including clad thermal, irradiation creep, void swelling, fuel restructuring,
and Fuel-Clad Chemical Interaction (FCCI). It is clear that any credible attempt at
assessing the performance of metal fuel must include a model that is able to predict the
temperature, stress, and strain time-dependent distributions within the clad and fuel for
given operating and abnormal conditions. This model should include the effects of fuel
restructuring, FCCI, thermal expansion, thermal creep, irradiation creep, fuel swelling,
and fission gas release.
7
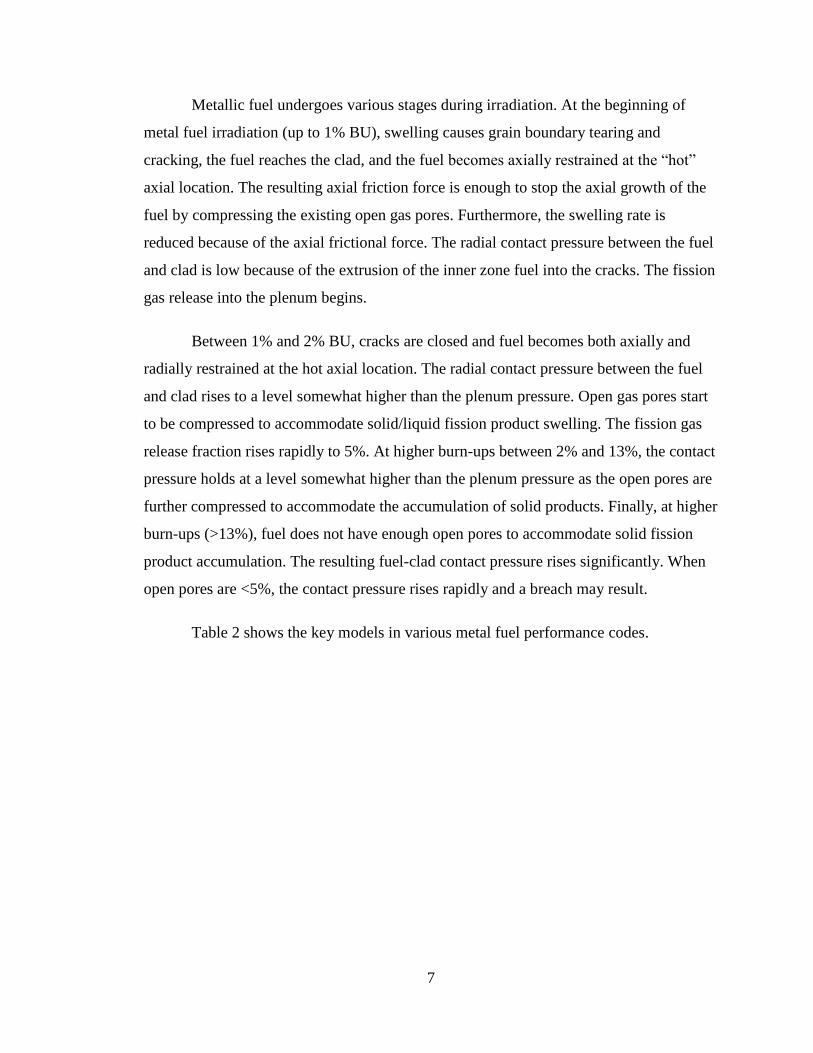
Metallic fuel undergoes various stages during irradiation. At the beginning of
metal fuel irradiation (up to 1% BU), swelling causes grain boundary tearing and
cracking, the fuel reaches the clad, and the fuel becomes axially restrained at the “hot”
axial location. The resulting axial friction force is enough to stop the axial growth of the
fuel by compressing the existing open gas pores. Furthermore, the swelling rate is
reduced because of the axial frictional force. The radial contact pressure between the fuel
and clad is low because of the extrusion of the inner zone fuel into the cracks. The fission
gas release into the plenum begins.
Between 1% and 2% BU, cracks are closed and fuel becomes both axially and
radially restrained at the hot axial location. The radial contact pressure between the fuel
and clad rises to a level somewhat higher than the plenum pressure. Open gas pores start
to be compressed to accommodate solid/liquid fission product swelling. The fission gas
release fraction rises rapidly to 5%. At higher burn-ups between 2% and 13%, the contact
pressure holds at a level somewhat higher than the plenum pressure as the open pores are
further compressed to accommodate the accumulation of solid products. Finally, at higher
burn-ups (>13%), fuel does not have enough open pores to accommodate solid fission
product accumulation. The resulting fuel-clad contact pressure rises significantly. When
open pores are <5%, the contact pressure rises rapidly and a breach may result.
Table 2 shows the key models in various metal fuel performance codes.

8
Table 2. Key Modeling in Metal Performance Codes [1]
Experimental Work
EBR-II
The EBR-II experiments emphasized testing fuels and materials for future, larger,
liquid metal reactors in the radiation environment of the EBR-II reactor core, which was
operated as the Integral Fast Reactor prototype until 1994. Results from 6 fuel pins
irradiated in some of the EBR-II experiments were used in the FEAST-Metal sensitivity
analysis as the first phase of this research. Benchmarks originally used to validate the
FEAST-metal code were used in part to verify the modified FEAST constituent
redistribution model in the second phase of this research.
AFC
The AFC rodlet assembly is designed to be a miniature fast-reactor fuel rod
having a standard diameter and reduced length. The rodlet assembly consists of the
metallic fuel column, sodium bond, stainless-steel Type 421 (HT9) cladding, and inert

9
gas plenum. A stainless-steel capsule assembly contains a vertical stack of six rodlet
assemblies. The rodlet and capsule designs and dimensions are shown in Figures 1a and
1b [16]. AFC fuel is typically composed of U-Pu-Zr with some minor actinides, as
described in Table 1. It also has a higher Zr content than EBR-II fuel did (up to 60 weight
percent), which invalidated the original FEAST model for AFC fuel. This necessitated a
modification to the constituent redistribution model in order to enable FEAST-Metal to
accommodate AFC fuel compositions.
Figure 1a. Typical AFC rodlet design and dimensions [16].
Figure 1b. Typical AFC rodlet capsule design [16].

10
Research Objectives
AFC has performed various experiments that are ready for analysis. Most current
metal fuel performance codes are either not available to AFC or have limitations and
deficiencies in predicting AFC fuel performance. Advanced codes such as BISON are
still under development and need to be adapted and tailored to AFC analysis needs.
FEAST has certain advantages which are not present in other available M&S codes. This
work implements a modification to the FEAST-Metal model for constituent redistribution
and migration. This model is assessed against AFC test results to identify the need for
any further model adjustment, and to determine its usefulness in the design of sodium-
cooled fast reactor fuels. Ultimately, 3D codes will be developed to predict AFC fuel
performance when fuel composition is varied. For the purpose of this study, the
immediate need is to determine and understand fuel constituent and actinide species
migration and redistribution under various irradiation conditions, and to establish the
ability to predict this behavior in AFC metallic fuels.
Summary of Work Performed and Expected Contributions
In the first phase of this work, a sensitivity study (Chapter 3) was performed on
the thermo-mechanical models of FEAST-Metal, producing a reduced set of calibration
parameters for possible adjustment in follow-on studies. A modification was then made
to the constituent redistribution model (described in Chapter 4) to enable the code to
properly handle metallic fuel with composition similar to that of AFC fuel. Results
obtained after running the model on EBR-II and AFC fuel input specifications are
presented in Chapter 5, and assessment and discussion are provided in Chapter 6.
It is expected that this work will result in:
Enhanced understanding of irradiated material behavior, especially diffusion
of actinides in metal fuel;
Improved capability for predicting this behavior in AFC metal fuel.

11
CHAPTER 2. THE FEAST-METAL FUEL PERFORMANCE CODE
FEAST-METAL is a fuel performance code developed for predicting steady state
and transient behavior of U-Pu-Zr metallic fuel alloys with stainless steel clad in sodium
fast reactor environments. The code currently adopts HT9 cladding properties. The code
includes several physics based mechanical and semi-empirical continuum level models to
predict various important phenomena occurring under normal and off-normal scenarios.
Details of the physical models can be found in Karahan [17]. The included models are:
Fission Gas Release and Swelling, Constituent Redistribution, Temperature Distribution,
Fuel Clad Chemical Interaction, Mechanical Analysis, and Transient Creep Fracture.
The FEAST code was developed for analysis of the steady-state and transient
irradiation behavior of U-Zr and U-Pu-Zr metal fuels. It was designed to be highly
flexible, so that constitutive models for other alloys of interest (e.g., TRU-Zr alloys) can
be easily added to the code. FEAST’s mechanical model is similar to the respective LIFE
code algorithm. Variation of material properties (fuel creep, thermal expansion, Young’s
modulus) with local fuel composition is taken into account. The fuel and cladding regions
can be divided into up to 8 radial nodes each; however, six radial nodes in the fuel region
and at least two radial nodes within the cladding region are recommended. Axial nodes
are also user specified. A maximum of twenty nodes can be assigned in the axial
direction. Axial heat conduction is neglected. The fission gas release and swelling
module implements the GRSIS algorithm [21] which was originally developed for metal
fuel. The fuel constituent redistribution model is based on thermo-transport theory.
Empirical models developed for the compressibility of open pores and anisotropic
deformation of the fuel slug in ALFUS [22] are implemented into the FEAST-METAL
code. Furthermore, an FCCI model based on precipitation kinetics was developed to
model cladding wastage. Another important model is the creep-fracture of the clad during
transients. It uses the diffusional constrained cavity growth model.
FEAST-METAL has been benchmarked against the available EBR-II database for
steady state and furnace tests (transients). The results show that the code is able to predict
important phenomena such as cladding strain, fission gas release, clad wastage, clad

12
failure time and axial fuel slug deformation, satisfactorily.
Thermo-mechanical Behavior of Metal Fuel
Table 3 lists the sequence of key physical phenomena during the irradiation of a typical
metal fuel pin, as deduced from the operating experience in the EBR-II reactor at ANL-
West in Idaho.
Table 3. Description of the burnup history (72 % smear density U-19Pu-10Zr Fuel)
Burnup
(at %)
Relevant phenomena
0.0 Irradiation begins
0.5-1.0 (1) Due to swelling, grain boundary tearing and cracking, the fuel reaches the clad
and becomes axially restrained at the ‘hot’ axial location.
(2) Resulting axial friction force is enough to stop the axial growth of the fuel by
compressing the existing open gas pores. Furthermore, swelling rate reduces due to
axial frictional force.
(3) The radial contact pressure between fuel and clad is low due to extrusion of the
inner zone fuel into the cracks.
(4) Fission gas release into the plenum begins.
1.0-2.0 (1) Cracks are closed and fuel becomes both axially and radially restrained at the hot
axial location.
(2) Radial contact pressure between fuel and clad rises to a level somewhat higher
than plenum pressure. Open gas pores start to be
compressed to accommodate for solid/liquid fission product swelling. (3) Fission gas release fraction rises rapidly to 50 %.
2.0-13.0 Contact pressure holds at a level somewhat higher than the plenum pressure as the
open pores are further compressed to accommodate
accumulation of solid products.
13-20 Fuel does not have enough open pores to accommodate solid fission product
accumulation. The resulting fuel-clad contact pressure rises significantly. When
open pores are less than 5 %, the contact pressure rises rapidly and breach may
result.
FEAST-Metal Code Structure
This section provides a detailed description of the FEAST-METAL code structure. A
parametric sensitivity study of the physical models is given in Chapter 3.

13
The FEAST-METAL code is composed of several modules in coupled form to simulate
metal fuel thermo-mechanical behavior, as listed in Table 2. The source code is written in
FORTRAN-90 computing language.
The code implements an explicit numerical algorithm. The algorithmic flow chart is
given in Figure 2. Note that the very high rate of creep strain of the fuel slug requires
short time steps, of the order of 10-20 seconds. Therefore, a typical irradiation simulation
requires use of about 106 time steps, resulting in an execution time of the order of
minutes, when run on a single CPU personal computer.
The input file for the code allows specification of the operating conditions and initial fuel
pin and coolant flow path geometry.
The code executes the following steps for each axial node at each time step:
Radial power distribution within the fuel slug is calculated based on the actinide
concentration within each radial node.
Contact pressure between the fuel and clad is calculated as a function of
displacement of fuel and cladding.
The code calculates the fuel constituent redistribution, which is a relatively slow
process, every 10000 seconds to reduce the computational time. Given the phase
diagram and thermo-chemical activity of each phase, the code calculates the
zirconium current and solves the diffusion equation by an explicit algorithm. Note
that, both explicit and semi-implicit algorithms exist for this module. The semi-
implicit algorithm could only be computationally efficient if one million second
or higher time steps area selected. However, the rapid variation of the temperature
distribution does not allow such large time steps; thus, an explicit algorithm is
used for this module.
Temperature distribution in the fuel pin is calculated as a function of radial power,
zirconium, porosity distribution and sodium infiltration. The coolant axial
temperature distribution is calculated with the Single Mass Velocity Model [19].

14
Consistently with the fuel constituent redistribution module, the calculation is
performed every 10000 seconds. The Gauss-Seidel matrix solver algorithm is
used [20].
Having calculated the radial temperature distribution, the fuel stress/strain
analysis is performed. Using the creep strains and axial strains calculated at the
previous step, the average radial displacement can be calculated for each radial
ring by using the Gauss-Jordan matrix solver algorithm [20]. After that, the axial
force balance is used to calculate either the axial strain if the gap between the fuel
and the clad is open; or, the fuel/clad friction force, if the gap between the fuel
and the clad is closed. Finally, the creep and plasticity strains and open pore
compressibility strain are calculated, which will be used in the next time step.
Given the stress, temperature and fission rate of each radial ring, the fission gas
release and swelling behavior of the fuel is calculated. Swelling due to diffusion
of gas atoms into gas bubbles, coalescence of gas bubbles due to growth and
bubble diffusion and open porosity formation have been accounted for. Moreover,
an empirical relation is adopted for solid fission product swelling. No matrix
solver is necessary in this module.
Cladding wastage is calculated using the precipitation kinetics model.
Given the contact pressure between fuel and cladding and coolant pressure
outside the cladding, the radial displacement for each radial ring in the cladding
are solved using the Gauss-Jordan matrix solver. After that, the axial force
balance is used to calculate the axial strain. Finally, cladding creep strains are
updated again and used in the next time step.
Creep fracture margin of the clad is calculated by Cumulative Damage Fraction
(CDF) and the constrained diffusional cavity growth models only for transients.
The plenum pressure calculation is performed by assuming that the perfect gas
law applies. The sum of the open porosity within the fuel slug and the plenum
region at the top of the fuel slug constitutes the volume occupied by gas.

15
Figure 2. FEAST-Metal Code Flow chart

16
CHAPTER 3. FEAST-METAL PARAMETER SENSITIVITY STUDY
Purpose and Method
Important to the modeling and analysis work conducted with FEAST-Metal was
the knowledge of, and the ability to calibrate, certain parameters within the code which
are pertinent to the phenomena being modeled. In this way, we can reduce uncertainty in
the results by benchmarking the FEAST-Metal code against known experimental data
and correct any errors. The objective in this sensitivity study is to identify important
macroscopic parameters of interest to modeling and simulation of metallic fuel
performance. This enables one to calibrate on the correct parameters for the analysis to be
performed.
In this study we applied advanced validation (sensitivity and uncertainty
quantification) methods to the FEAST-Metal fuel performance code. This work
supported later modeling and analysis which utilized some of the models adapted from
FEAST. Our ultimate objective is to improve the models for adaptation and calibration
after establishing an independent FEAST baseline.
We utilized an improved best estimate plus uncertainty methodology [4] which
was previously used to perform calibration and sensitivity analysis of the LIFEIV code,
as described in Reference 4. The sensitivity analysis provides identification of important
macroscopic parameters of interest to modeling and simulation. Initially we identified a
large number of parameters to consider in sensitivity analysis. Those parameters
belonged to three categories. First, calibration parameters; those parameters have been
identified by the code developers as the less well-defined-parameters in the fuel models
and properties, and have been adjusted within physically realistic limits or measurement
uncertainties to minimize the deviations between code results and fuel pin post-
irradiation examination (PIE) data. The second set of parameters that were considered for
the sensitivity study are input parameters to the code that include design (fabrication)
parameters, operating conditions, and cladding and fuel properties. Lastly, the fuel and
clad property models can play an important role in performance outputs. As a result of
these large varieties of parameters we considered about 100 modeling parameters.
17
Six of the metallic fuel pins that were used in EBR-II experiments were selected for the
sensitivity analysis. Fabrication and operational parameter ranges for those pins covered a
significant portion of the complete set of EBR-II pins. Those pins also covered ranges of
low and high burnups.
Our focus on the FEAST calculations was on the code calibration uncertainties,
where a full sequence of screening and design code runs to support sensitivity analysis
calculations were performed for a single metal fuel pin (T473 pin from the X425
experiment set) to test the sensitivity analysis methodology. This was followed by
screening and design calculations that included all parameters of interest, namely the
calibration, design, material properties, and operating parameters, where the calculations
were performed for the T473 pin (the only pin for which we had sufficient experimental
measured data to serve as reference output). Because of the large number of modeling
parameters that needed to be obtained we decided to employ a screening
methodology before conducting the detailed uncertainty analyses. This is because we
have often observed in similar studies that ~80-90% of the variation in output can be
accounted for by relatively few inputs, ~10-20%. Emulation of complex computer
models often becomes substantially more difficult as input dimension increases;
minimum inter-point distance increases, potentially having negative impact on covariance
estimation. We found that resources are often used more efficiently with the two-stage
procedure of screening followed by production analysis. Removal of inactive inputs
results in (perhaps substantially) fewer computer model runs required for production
analysis. Our approach in application of advanced validation to FEAST code assessment
can be summarized as follows:
Phase I – Sensitivity screening
–Reduce number of parameters
Phase II – Sensitivity analyses with reduced parameter set
–Understand deficiencies in the modeling
–Determine modeling and experimental priorities
18
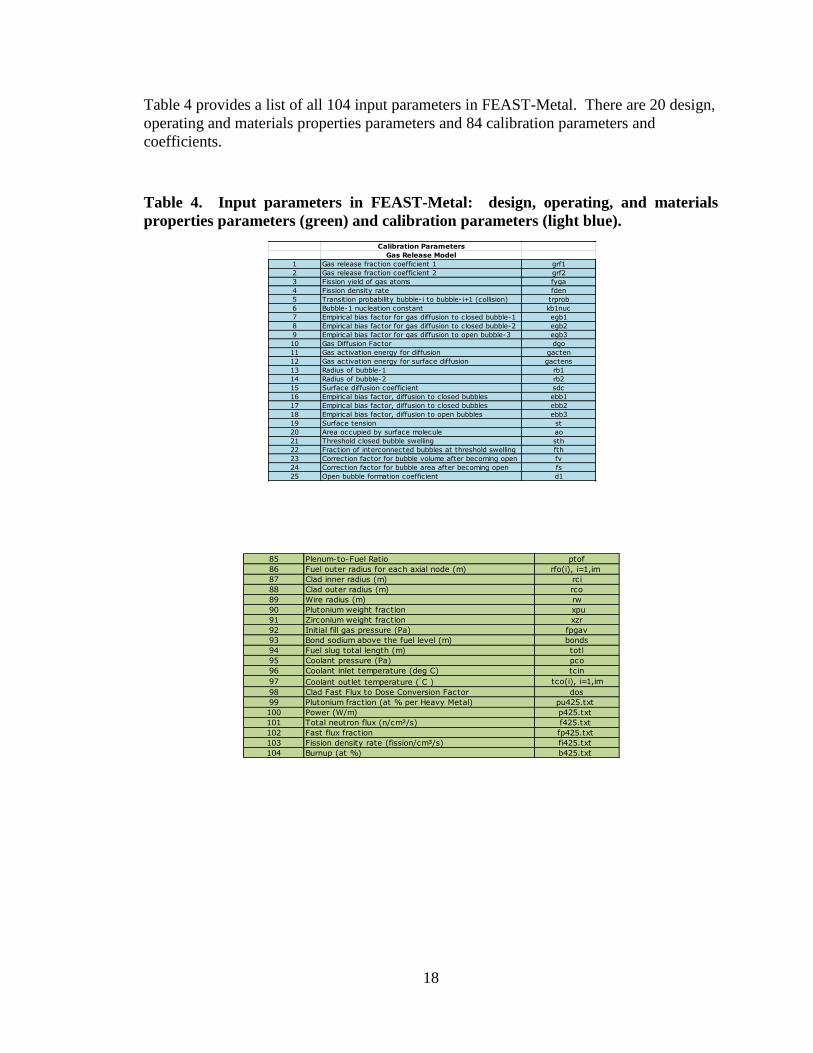
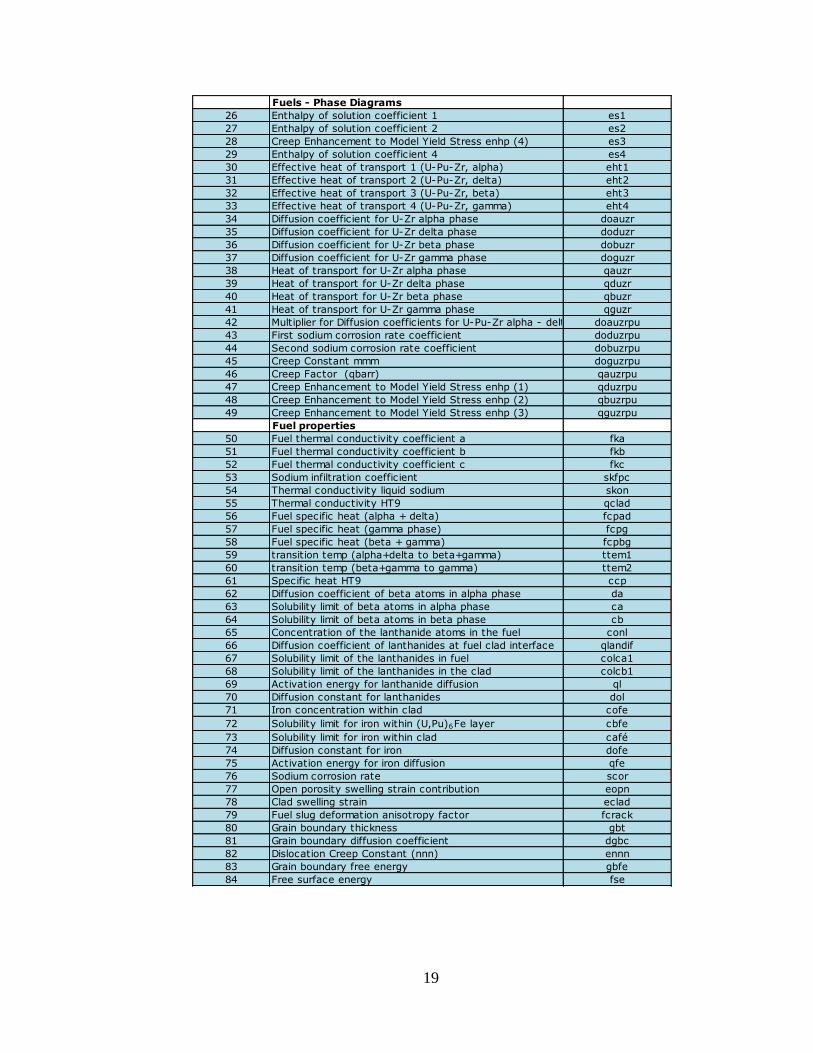
Table 4 provides a list of all 104 input parameters in FEAST-Metal. There are 20 design,
operating and materials properties parameters and 84 calibration parameters and
coefficients.
Table 4. Input parameters in FEAST-Metal: design, operating, and materials
properties parameters (green) and calibration parameters (light blue).
Calibration Parameters
Gas Release Model
1 Gas release fraction coefficient 1 grf1
2 Gas release fraction coefficient 2 grf2
3 Fission yield of gas atoms fyga
4 Fission density rate fden
5 Transition probability bubble-i to bubble-i+1 (collision) trprob
6 Bubble-1 nucleation constant kb1nuc
7 Empirical bias factor for gas diffusion to closed bubble-1 egb1
8 Empirical bias factor for gas diffusion to closed bubble-2 egb2
9 Empirical bias factor for gas diffusion to open bubble-3 egb3
10 Gas Diffusion Factor dgo
11 Gas activation energy for diffusion gacten
12 Gas activation energy for surface diffusion gactens
13 Radius of bubble-1 rb1
14 Radius of bubble-2 rb2
15 Surface diffusion coefficient sdc
16 Empirical bias factor, diffusion to closed bubbles ebb1
17 Empirical bias factor, diffusion to closed bubbles ebb2
18 Empirical bias factor, diffusion to open bubbles ebb3
19 Surface tension st
20 Area occupied by surface molecule ao
21 Threshold closed bubble swelling sth
22 Fraction of interconnected bubbles at threshold swelling fth
23 Correction factor for bubble volume after becoming open fv
24 Correction factor for bubble area after becoming open fs
25 Open bubble formation coefficient d1
85 Plenum-to-Fuel Ratio ptof
86 Fuel outer radius for each axial node (m) rfo(i), i=1,im
87 Clad inner radius (m) rci
88 Clad outer radius (m) rco
89 Wire radius (m) rw
90 Plutonium weight fraction xpu
91 Zirconium weight fraction xzr
92 Initial fill gas pressure (Pa) fpgav
93 Bond sodium above the fuel level (m) bonds
94 Fuel slug total length (m) totl
95 Coolant pressure (Pa) pco
96 Coolant inlet temperature (deg C) tcin
97 Coolant outlet temperature (C ) tco(i), i=1,im
98 Clad Fast Flux to Dose Conversion Factor dos
99 Plutonium fraction (at % per Heavy Metal) pu425.txt
100 Power (W/m) p425.txt
101 Total neutron flux (n/cm²/s) f425.txt
102 Fast flux fraction fp425.txt
103 Fission density rate (fission/cm³/s) fi425.txt
104 Burnup (at %) b425.txt
19
Fuels - Phase Diagrams
26 Enthalpy of solution coefficient 1 es1
27 Enthalpy of solution coefficient 2 es2
28 Creep Enhancement to Model Yield Stress enhp (4) es3
29 Enthalpy of solution coefficient 4 es4
30 Effective heat of transport 1 (U-Pu-Zr, alpha) eht1
31 Effective heat of transport 2 (U-Pu-Zr, delta) eht2
32 Effective heat of transport 3 (U-Pu-Zr, beta) eht3
33 Effective heat of transport 4 (U-Pu-Zr, gamma) eht4
34 Diffusion coefficient for U-Zr alpha phase doauzr
35 Diffusion coefficient for U-Zr delta phase doduzr
36 Diffusion coefficient for U-Zr beta phase dobuzr
37 Diffusion coefficient for U-Zr gamma phase doguzr
38 Heat of transport for U-Zr alpha phase qauzr
39 Heat of transport for U-Zr delta phase qduzr
40 Heat of transport for U-Zr beta phase qbuzr
41 Heat of transport for U-Zr gamma phase qguzr
42 Multiplier for Diffusion coefficients for U-Pu-Zr alpha - delta - beta phasesdoauzrpu
43 First sodium corrosion rate coefficient doduzrpu
44 Second sodium corrosion rate coefficient dobuzrpu
45 Creep Constant mmm doguzrpu
46 Creep Factor (qbarr) qauzrpu
47 Creep Enhancement to Model Yield Stress enhp (1) qduzrpu
48 Creep Enhancement to Model Yield Stress enhp (2) qbuzrpu
49 Creep Enhancement to Model Yield Stress enhp (3) qguzrpu
Fuel properties
50 Fuel thermal conductivity coefficient a fka
51 Fuel thermal conductivity coefficient b fkb
52 Fuel thermal conductivity coefficient c fkc
53 Sodium infiltration coefficient skfpc
54 Thermal conductivity liquid sodium skon
55 Thermal conductivity HT9 qclad
56 Fuel specific heat (alpha + delta) fcpad
57 Fuel specific heat (gamma phase) fcpg
58 Fuel specific heat (beta + gamma) fcpbg
59 transition temp (alpha+delta to beta+gamma) ttem1
60 transition temp (beta+gamma to gamma) ttem2
61 Specific heat HT9 ccp
62 Diffusion coefficient of beta atoms in alpha phase da
63 Solubility limit of beta atoms in alpha phase ca
64 Solubility limit of beta atoms in beta phase cb
65 Concentration of the lanthanide atoms in the fuel conl
66 Diffusion coefficient of lanthanides at fuel clad interface qlandif
67 Solubility limit of the lanthanides in fuel colca1
68 Solubility limit of the lanthanides in the clad colcb1
69 Activation energy for lanthanide diffusion ql
70 Diffusion constant for lanthanides dol
71 Iron concentration within clad cofe
72 Solubility limit for iron within (U,Pu)6Fe layer cbfe
73 Solubility limit for iron within clad café
74 Diffusion constant for iron dofe
75 Activation energy for iron diffusion qfe
76 Sodium corrosion rate scor
77 Open porosity swelling strain contribution eopn
78 Clad swelling strain eclad
79 Fuel slug deformation anisotropy factor fcrack
80 Grain boundary thickness gbt
81 Grain boundary diffusion coefficient dgbc
82 Dislocation Creep Constant (nnn) ennn
83 Grain boundary free energy gbfe
84 Free surface energy fse
20
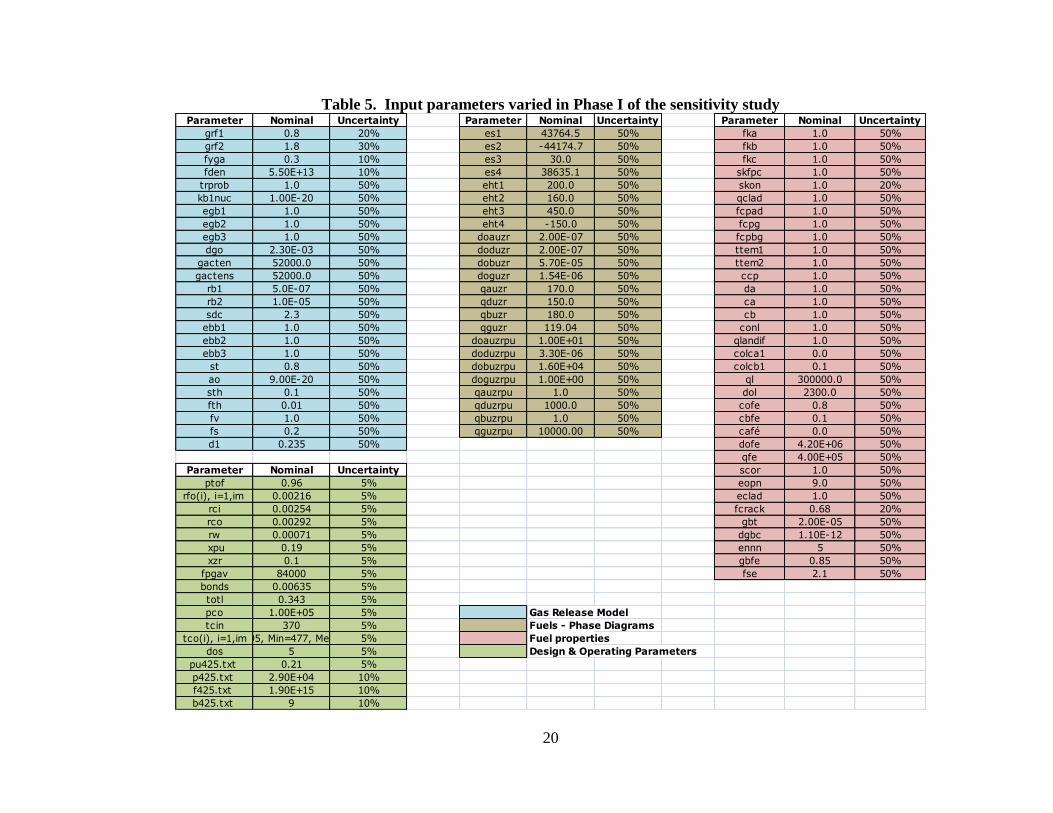
Table 5. Input parameters varied in Phase I of the sensitivity studyParameter Nominal Uncertainty Parameter Nominal Uncertainty Parameter Nominal Uncertainty
grf1 0.8 20% es1 43764.5 50% fka 1.0 50%
grf2 1.8 30% es2 -44174.7 50% fkb 1.0 50%
fyga 0.3 10% es3 30.0 50% fkc 1.0 50%
fden 5.50E+13 10% es4 38635.1 50% skfpc 1.0 50%
trprob 1.0 50% eht1 200.0 50% skon 1.0 20%
kb1nuc 1.00E-20 50% eht2 160.0 50% qclad 1.0 50%
egb1 1.0 50% eht3 450.0 50% fcpad 1.0 50%
egb2 1.0 50% eht4 -150.0 50% fcpg 1.0 50%
egb3 1.0 50% doauzr 2.00E-07 50% fcpbg 1.0 50%
dgo 2.30E-03 50% doduzr 2.00E-07 50% ttem1 1.0 50%
gacten 52000.0 50% dobuzr 5.70E-05 50% ttem2 1.0 50%
gactens 52000.0 50% doguzr 1.54E-06 50% ccp 1.0 50%
rb1 5.0E-07 50% qauzr 170.0 50% da 1.0 50%
rb2 1.0E-05 50% qduzr 150.0 50% ca 1.0 50%
sdc 2.3 50% qbuzr 180.0 50% cb 1.0 50%
ebb1 1.0 50% qguzr 119.04 50% conl 1.0 50%
ebb2 1.0 50% doauzrpu 1.00E+01 50% qlandif 1.0 50%
ebb3 1.0 50% doduzrpu 3.30E-06 50% colca1 0.0 50%
st 0.8 50% dobuzrpu 1.60E+04 50% colcb1 0.1 50%
ao 9.00E-20 50% doguzrpu 1.00E+00 50% ql 300000.0 50%
sth 0.1 50% qauzrpu 1.0 50% dol 2300.0 50%
fth 0.01 50% qduzrpu 1000.0 50% cofe 0.8 50%
fv 1.0 50% qbuzrpu 1.0 50% cbfe 0.1 50%
fs 0.2 50% qguzrpu 10000.00 50% café 0.0 50%
d1 0.235 50% dofe 4.20E+06 50%
qfe 4.00E+05 50%
Parameter Nominal Uncertainty scor 1.0 50%
ptof 0.96 5% eopn 9.0 50%
rfo(i), i=1,im 0.00216 5% eclad 1.0 50%
rci 0.00254 5% fcrack 0.68 20%
rco 0.00292 5% gbt 2.00E-05 50%
rw 0.00071 5% dgbc 1.10E-12 50%
xpu 0.19 5% ennn 5 50%
xzr 0.1 5% gbfe 0.85 50%
fpgav 84000 5% fse 2.1 50%
bonds 0.00635 5%
totl 0.343 5%
pco 1.00E+05 5% Gas Release Model
tcin 370 5% Fuels - Phase Diagrams
tco(i), i=1,imMax=495, Min=477, Mean=4835% Fuel properties
dos 5 5% Design & Operating Parameters
pu425.txt 0.21 5%
p425.txt 2.90E+04 10%
f425.txt 1.90E+15 10%
b425.txt 9 10%

21
Phase I Screening Study Results
Variance-based global sensitivity analysis [5] was performed to screen for important
parameters to include in probabilistic calibration and validation analysis with FEAST-
Metal. Such screening is critical to reducing the computational burden imposed by model
validation and assessment activities involving complex codes such as FEAST-Metal.
Main and total effect sensitivity indices for all 100 parameters varied in this study were
computed for 9 of the 11 calculated outputs considered from pin T473. Outputs CIW and
CDF were not emulated well by the statistical techniques utilized to estimate the
sensitivity indices. Results are presented in Table 6 for inputs associated with at least one
output that exceeded a minimum sensitivity index threshold of 1%, chosen as the level at
which any given input exceeds its performance under a scenario in which all inputs have
equal effects (approximated by 100 percent divided by the total number of Phase I
parameters). This threshold represents the level of sensitivity if all inputs were "equally
active" in terms of inducing output variability.
Evaluated FEAST Output Parameter Definitions
Name Description Units
TFA Fuel average temperature °C
PFC Contact pressure between fuel and clad in radial direction MPa
CIW Clad inner wastage μm
COW Clad outer wastage μm
CRS Total clad permanent hoop strain %
PCT Peak clad temperature °C
FOR Fuel outer radius for each axial node m
TCL Fuel centerline temperature °C
CDF Clad cumulative damage fraction
FGR Axial average for fission gas release %
FUEL ∆z Average fuel axial elongation %

22
Table 6. Main and total effect indices for nine outputs from pin T473. Indices
exceeding the 1% sensitivity threshold are colored green, while inputs having an
effect never exceeding 1% for any output are excluded (red).
Appendix A summarizes the technical details involved in computing main and
total effect indices. Briefly, the main effect of a particular input is defined as the amount
of output variance induced by uncertainty in that input after averaging out the
(conditional) uncertainties in all other inputs. The main effect index is given by the ratio
of this variance to the total output variance induced by the assumed uncertainties in all
the inputs. Higher order effects due to uncertainties in two or more inputs, referred to as
interaction effects, can also be estimated. The total effect variance of a particular input is
the sum of its main effect and all interaction effect variances involving that input, with
the total effect index computed by reference to the total output variance as described
above for computing main effect indices. Therefore, the difference between total and
main effects for a particular input provides an indication of the extent to which that input
interacts with other inputs, which in turn indicates the degree of complexity in the input-
output relationship.
We make the following observations:
Input main effects often dominate variation in any given output.
23
A small number of inputs are typically responsible for inducing most of the
observed variation in any given output.
This screening exercise resulted in 32 parameters selected for a second phase of
screening that involved output calculations from an additional 5 pins. Note that 15
outputs were identified in Table 6 as having significant total effects for at least one
output. Nine of these were selected for the second phase: EGB2, GACTEN, RB2,
DODUZR, QDUZR, FKB, FKC, SKFPC, and KCLAD. The additional six fuel design
dimensional and operating parameters having significant total effects were not selected
because they are viewed as being well-controlled and well-characterized with well-
defined uncertainties: RFO, RCI, RCO, BONDS, TCIN, and TCO. Finally, 23
parameters from the gas release, phase diagram, and creep models were chosen for
inclusion in the second phase due to their potential effects on diffusion coefficients and
outputs: TRPROB, KB1NUC, EGB1, DGO, GACTENS, RB1, EBB1, EBB2, EBB3,
ES1, ES2, ES3, ES4, EHT2, DOAUZRPU, DOGUZRPU, QAUZRPU, QDUZRPU,
QBUZRPU, DGBC, ENNN, GBFE, and FSE.
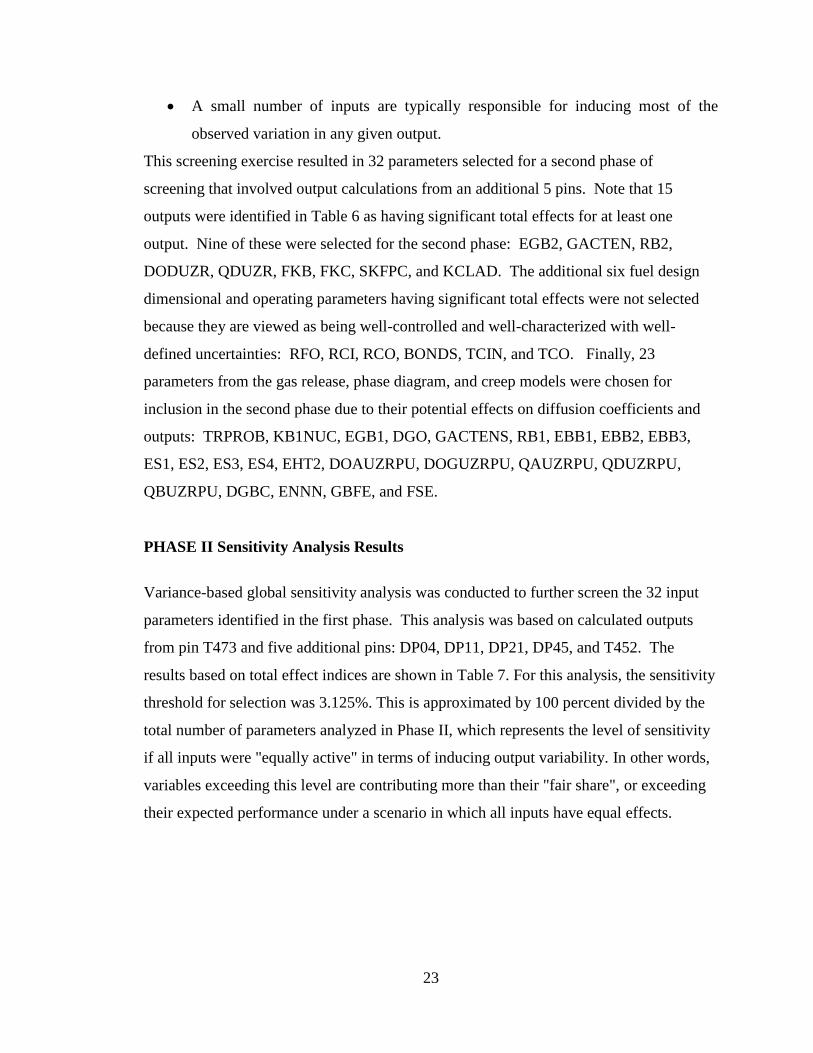
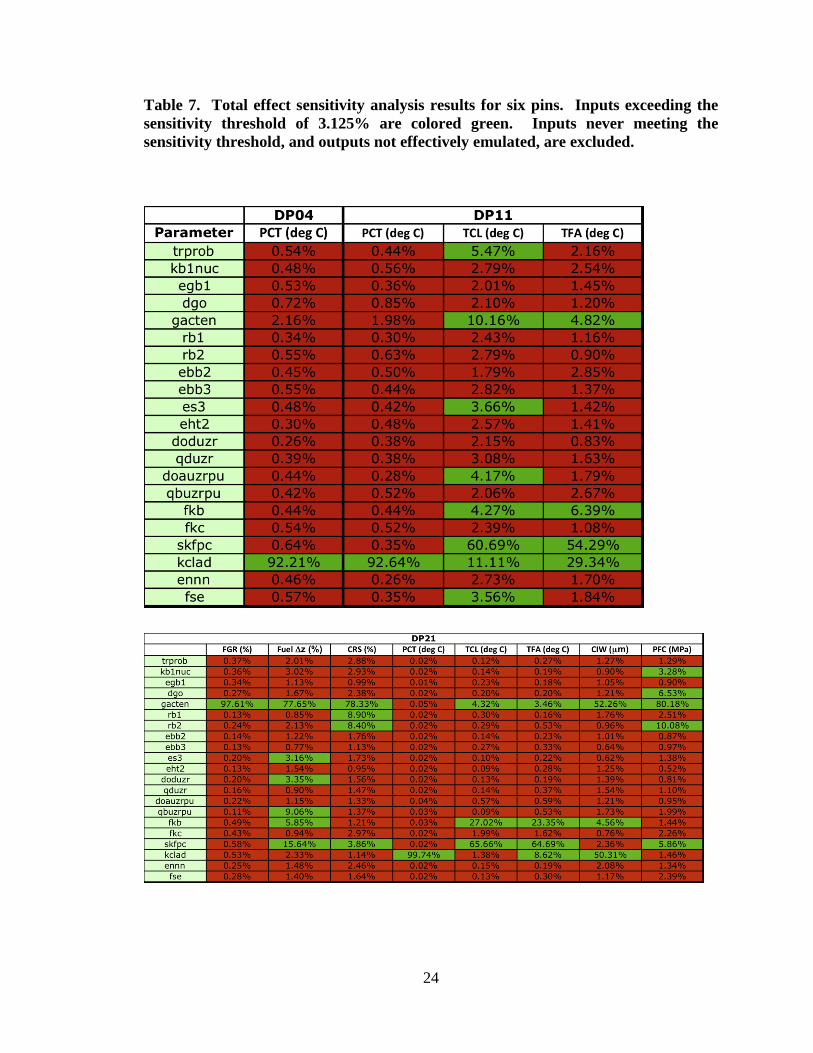
PHASE II Sensitivity Analysis Results
Variance-based global sensitivity analysis was conducted to further screen the 32 input
parameters identified in the first phase. This analysis was based on calculated outputs
from pin T473 and five additional pins: DP04, DP11, DP21, DP45, and T452. The
results based on total effect indices are shown in Table 7. For this analysis, the sensitivity
threshold for selection was 3.125%. This is approximated by 100 percent divided by the
total number of parameters analyzed in Phase II, which represents the level of sensitivity
if all inputs were "equally active" in terms of inducing output variability. In other words,
variables exceeding this level are contributing more than their "fair share", or exceeding
their expected performance under a scenario in which all inputs have equal effects.
24
Table 7. Total effect sensitivity analysis results for six pins. Inputs exceeding the
sensitivity threshold of 3.125% are colored green. Inputs never meeting the
sensitivity threshold, and outputs not effectively emulated, are excluded.
25

26
Of the 21 parameters with significant total effects, only 8 had significant main
effects (as shown in Tables 7 and 8): GACTEN, RB1, RB2, QDUZR, QBUZRPU, FKB,
SKFPC, and KCLAD. Statistical estimates of main effects are the most reliable due to
their simplicity relative to interaction effects, suggesting these 8 parameters should be
deemed significant with the highest confidence. The additional 13 parameters of Table
3 are serious contenders for retention due to their possible interaction with other
parameters: TRPROB, KB1NUC, EGB1, DGO, EBB2, EBB3, ES3, EHT2, DODUZR,
DOAUZRPU, FKC, ENNN, and FSE. Finally, 11 of the original 32 parameters
considered in this phase never met the sensitivity threshold for any of the outputs
considered across all six pins: EGB2, GACTENS, EBB1, ES1, ES2, ES4, DOGUZRPU,
QAUZRPU, QDUZRPU, DGBC, and GBFE (see Table 9).
27
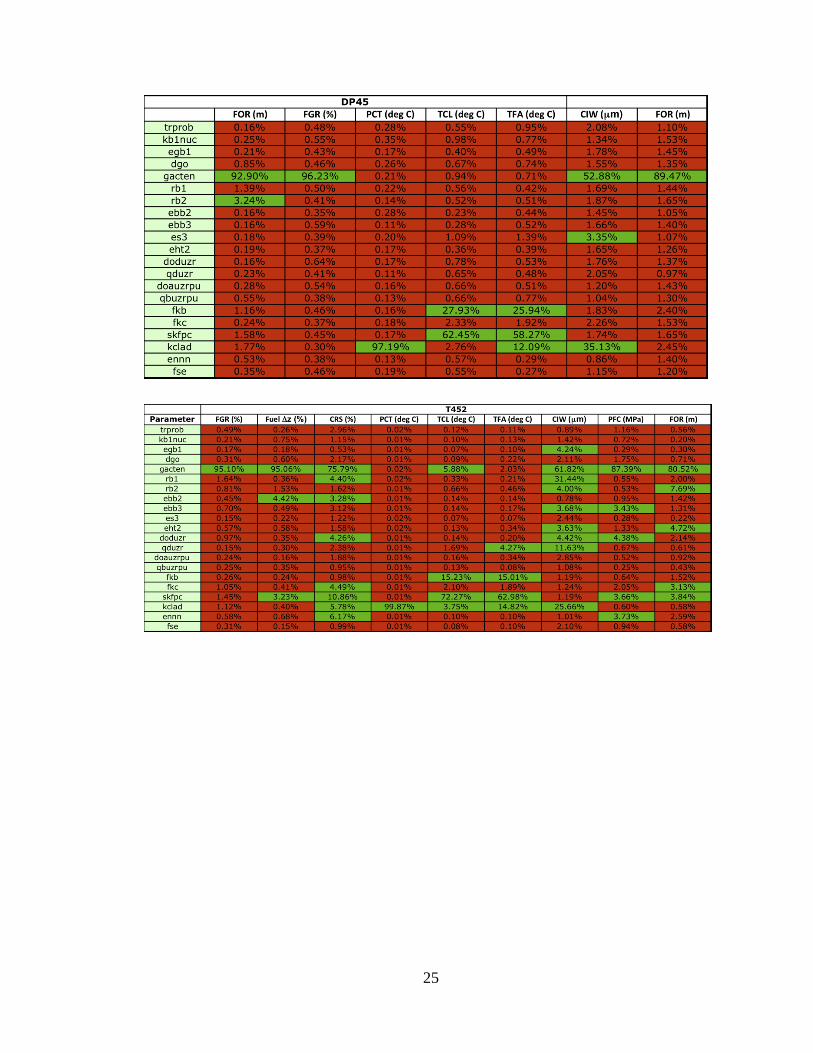
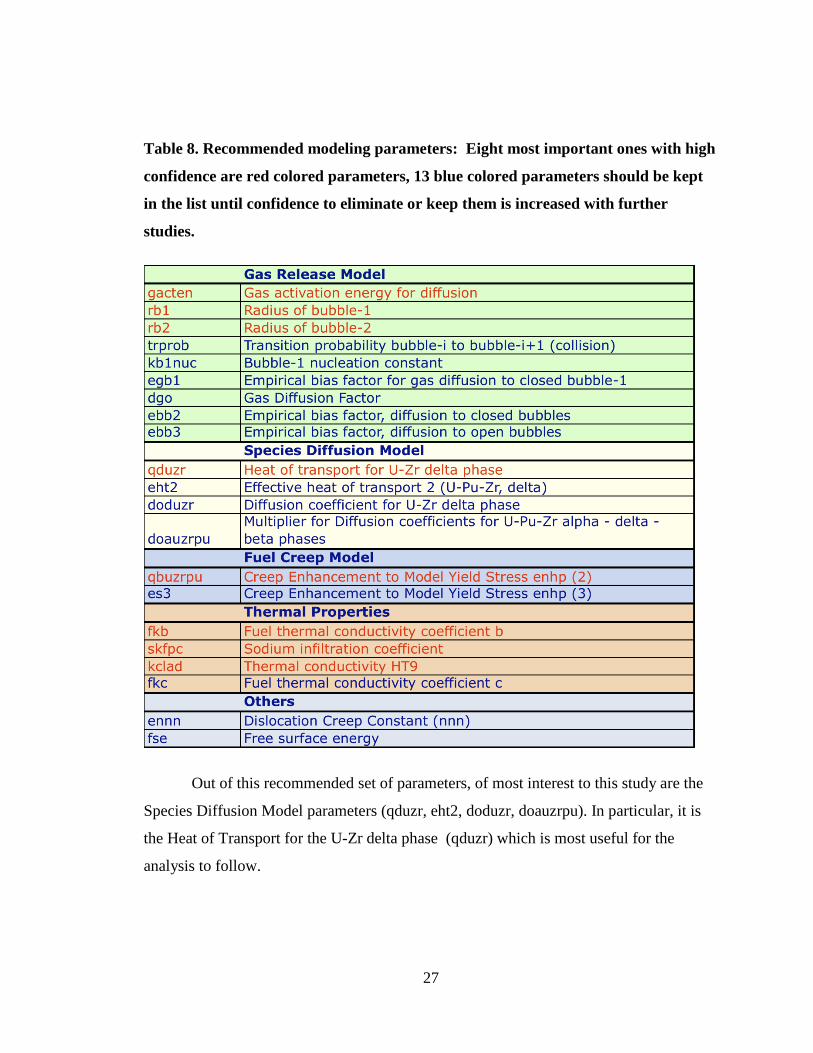
Table 8. Recommended modeling parameters: Eight most important ones with high
confidence are red colored parameters, 13 blue colored parameters should be kept
in the list until confidence to eliminate or keep them is increased with further
studies.
Out of this recommended set of parameters, of most interest to this study are the
Species Diffusion Model parameters (qduzr, eht2, doduzr, doauzrpu). In particular, it is
the Heat of Transport for the U-Zr delta phase (qduzr) which is most useful for the
analysis to follow.

28
Table 9. Parameters found not meeting sensitivity threshold; therefore they will not
be considered in future optimization.
Manual Verification of Main Effects
In Phase II, we noted some unexpected results:
• Gas release model parameters (gacten, rb1, rb2) showed a significant effect on
CIW, COW.
Steady state clad wastage is dependent only on a diffusion coefficient, and ultimately
temperature, according to [1]:

29
To explore this apparent anomaly, we performed the following study:
• We ran several cases on DP21, changing gacten by 20% to 60%. We
encountered a threshold value, somewhere around 25% increase in gacten, above
which results in all zero values for CIW on output. (We had experienced this in an
earlier stage, but we did not know where the threshold value was.)
• With 20% increase in gacten, there is virtually no change in COW. All the
change appears to be in CIW (inner wastage). There is a significant increase in
CIW with an increase in gacten.
• Examined temperature variation. While the fuel centerline temperature increases
around the axial midpoint nodes of the pin, it shows a slight decrease toward the
ends. Fuel average temperatures show a slight drop for the length of the pin.
DP21 reference:
• Last temp at highest point = 655 C
exp(-300000/(8.314 (655+273))) = 1.3e-17

30
inner wastage = 22.6
DP21 high gacten:
• Last temp at highest point = 645 C
exp(-300000/(8.314 (645+273))) = 8.5e-18
inner wastage = 25.8
High gacten reduces the temperature and diffusion coefficient. According to the equation
for clad wastage thickness growth rate, we should expect dx/dt to go down and therefore
see less wastage thickness. However, wasi1 output (last row last number) shows it is
increasing. A possible error may exist in the FEAST code models. This warrants further
investigation, outside the scope of this study.
Manual bubble radius test results are as follows:
• Rb1 large: significant increase in CIW, slight increase in COW.
• Rb1 small: run termination, but with earlier and rapid increase in CIW. Slight
increase in COW.
• Rb2 large: significant increase in CIW, slight increase in COW.
• Rb2 small: early run termination, but with earlier and rapid increase in CIW.
Slight increase in COW.
The results obtained (with varying rb1, rb2) are a larger effect on inner wastage, with
little or no effect on outer wastage. It is unclear as to why the sensitivity analysis shows
such a significant effect on clad outer wastage (COW). This is not evident in the FEAST
output.
Summary and Recommendations
We have completed an initial sensitivity study to reduce the dimensionality of the
input parameter space studied in this work. The parameters used can be classified in three
main categories: (a) design parameters such as power, fuel dimensions, etc., controlled by
other calculations or manufacturing, (b) modeling parameters such as specific heat of fuel
where there is a reasonable model with limited empiricism, and (c) calibration parameters
31
adjusted by code developers to predict experimental data (adjustable constants in key
models). Two phases of this study were conducted. First we performed a screening study
on an EBR-II metal fuel pin, to reduce the number of significant parameters from about
100 down to 32. We then ran cases on the first pin and 5 additional pins to target the
reduced parameter set, and performed a more thorough sensitivity analysis to find the
most significant parameters and most sensitive models.
The fuel thermal conductivity and gas release models were most influential in terms
of explaining overall output variability, and are therefore targets for additional calibration
to further constrain their parameters. We considered all results to recommend a ranking
of models that can be considered for further improvements. Our model ranking is as
follows:
Fission gas release and swelling,
Fuel and clad conductivity,
Species diffusion, and
Fuel creep.
We identified several input parameters in the FEAST-Metal code which have a
significant impact on key outputs.
Sensitivity analysis may generate unexpected results that require manual verification.
It remains unclear why the analysis indicates a significant effect on clad outer wastage
with varying gas activation energy (gacten). We expect the more significant effect on
inner wastage, but not on COW.
Formal methods of variable selection are difficult to apply in the FEAST-Metal setting
due to the computational burden.
We will consider analyzing false positive/negative rates of the simple method applied in
this study.
The final list of parameters for follow-on calibration studies is as follows:
- gacten, rb1, rb2, fkb, skfpc, kclad.

32
Our ultimate goal is to validate calibrated parameter distributions for use in
implementing improvements to the fission gas release, fuel conductivity, and species
diffusion models from FEAST-Metal. To that end, we recommend performing parameter
calibration and validation on the models of interest, using additional validation data.
Improved models can then be implemented in Bison-Metal in the future, when that tool is
fully developed.
We have identified the calibration parameters of most interest to this study;
namely, the Species Diffusion Model parameters (qduzr, eht2, doduzr, doauzrpu). In
particular, it is the Heat of Transport for the U-Zr delta phase (qduzr) which is most
useful for the analysis to follow.

33
CHAPTER 4. FEAST-METAL CONSTITUENT REDISTRIBUTION
MODEL
Modeling of Constituent Redistribution in U-Zr and U-Pu-Zr fuel
Fuel constituent migration, which has been observed in irradiated metallic fuel,
affects the fuel slug material properties such as solidus and liquidus temperatures,
thermal conductivity, mechanical properties such as modulus of elasticity, fuel cladding
eutectic reaction rate, and radial power density profile, particularly in enriched uranium
alloy fuels. Thus, modeling of constituent redistribution is essential when developing a
metallic fuel performance code. Upon constituent redistribution the microstructure of
irradiated metal fuel exhibits three distinct concentric zones: a zirconium-enriched central
zone, a zirconium-depleted and uranium-enriched intermediate zone, and a zirconium-
enriched zone on the outer periphery. The migration of zirconium atoms is driven by the
chemical activity gradients that develop within the fuel when the radial temperature
distribution creates multiple crystalline phases of the fuel alloy.
Major Assumptions
The model given by Kim in [8] is implemented in the FEAST-METAL code. It is based
on thermo-transport theory. The following assumptions are adopted from [8] and [9].
1. Local equilibrium assumption. Phase changes (determined by a change in local
concentration and/or temperature) are assumed to occur very rapidly compared
with the migration of alloy constituents.
2. Pu does not migrate; hence, the U and Zr concentration profiles are proportionally
opposite each other.
3. The equilibrium phases of the ternary U-Zr-Pu system are described by using a
quasi-binary U-Zr phase diagram (with constant Plutonium content), which is
produced from ternary phase diagrams, assuming uniformity of Plutonium in each
phase of the multiphase zones.
4. The minimum allowed Zirconium concentration in the Zirconium depleted middle
region is 5 at % due to the solubility limit. When the concentration of a radial
node drops below 5 at%, further diffusion from this node to the adjacent nodes is

34
not allowed. This limit corresponds to depletion of the matrix phase in the middle
region.
5. The cross-terms, relating the flux of one species to the chemical potential gradient
of another species, in the constitutive equations are negligible.
6. The presence of plutonium in the alloy at levels greater than 8 wt% enhances
uranium and zirconium migration by an order of magnitude.
7. Only radial migration of zirconium is considered. Axial temperature gradients are
relatively small and axial zirconium redistribution has not been observed
experimentally.
8. The radial power distribution in the fuel slug is assumed to be directly
proportional to the actinide concentration distribution.
The plutonium uniformity assumption is partly justified on the basis of the following
observations from Ref. [9]:
1. Plutonium shows relatively large miscibility in various phases of the system in
the operating temperature range.
2. Irradiation data of the ternary system show that redistribution of plutonium is
minimal.
3. Theoretical calculations show that the equilibrium tie lines in the vicinity of the
ternary fuel compositions of interest run approximately parallel to the constant
plutonium line in the isothermal sections of the U-Pu-Zr ternary phase diagram
for the operating temperature range.
Fundamental Data
The phase diagrams, diffusion coefficients and effective heats of transport of zirconium
and uranium in the ternary alloy are the fundamental data required in this model.
Phase Diagrams:
The thermochemical driving force for constituent migration is determined by the
various phases present in the fuel at the operating temperatures, an accurate estimate of
the phase diagram is essential to the development of the fuel restructuring model.
Assuming a fixed Pu concentration of 19 wt %, a simplified pseudo-binary phase diagram
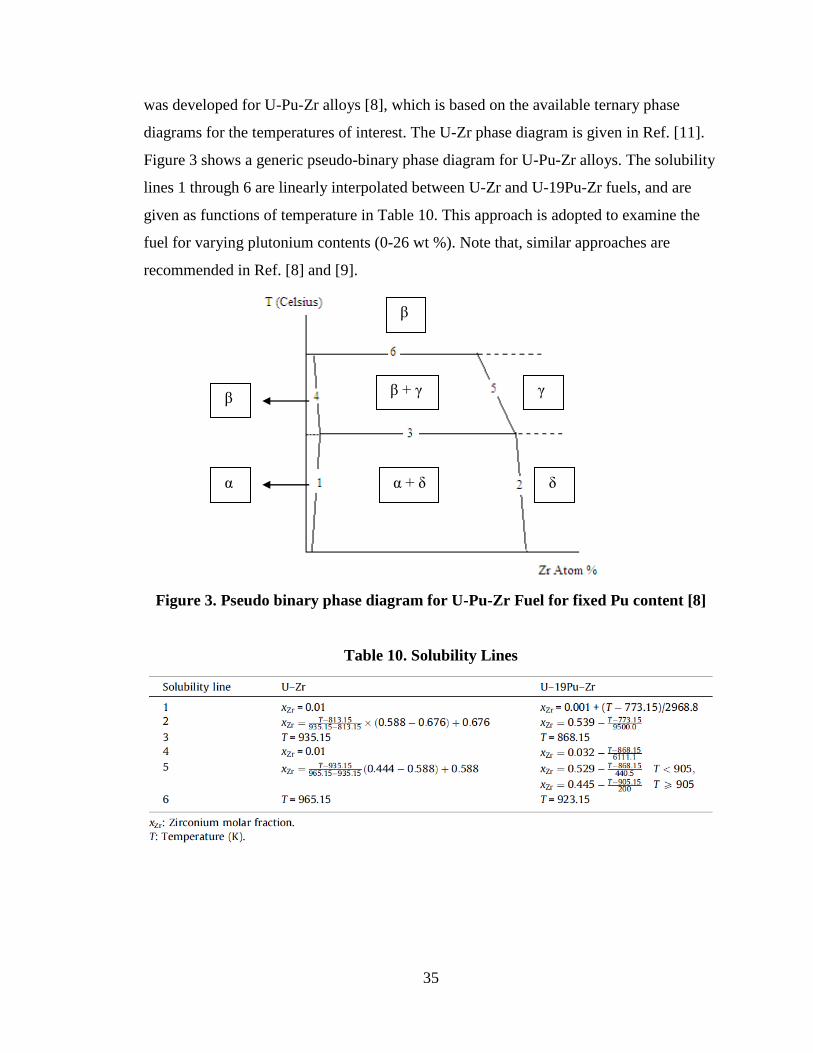
35
was developed for U-Pu-Zr alloys [8], which is based on the available ternary phase
diagrams for the temperatures of interest. The U-Zr phase diagram is given in Ref. [11].
Figure 3 shows a generic pseudo-binary phase diagram for U-Pu-Zr alloys. The solubility
lines 1 through 6 are linearly interpolated between U-Zr and U-19Pu-Zr fuels, and are
given as functions of temperature in Table 10. This approach is adopted to examine the
fuel for varying plutonium contents (0-26 wt %). Note that, similar approaches are
recommended in Ref. [8] and [9].
Figure 3. Pseudo binary phase diagram for U-Pu-Zr Fuel for fixed Pu content [8]
Table 10. Solubility Lines
β
α
β
β + γ
α + δ
γ
δ

36
Enthalpy of Solution:
The enthalpy of solution of Zirconium in α and β phases is negligible [11]. On the other
hand, the enthalpy of solution of the γ and δ matrix phases are given in [8] as follows:
Effective Heat of Transport:
The heats of transport for each phase field were obtained by a best fit in Ref. [8] and Ref.
[12] to reproduce the measured redistribution profile of U-Pu-Zr and U-Zr fuels,
respectively. The results are given in Table 11.
Table 11. Effective heat of transport (kJ/mol)
Note that the effective heat of transport values are linearly interpolated between their
values for the U-Zr and U-8Pu-Zr alloys. For plutonium concentrations above 8 wt %, it
is assumed that the effective heat of transport values stay constant.
The negative heat of transport in the γ phase generates the driving force for zirconium to

37
migrate towards the center (hotter) region of the fuel slug, even after zirconium
accumulation in the center region creates an opposing concentration gradient. The
positive heats of transport for the α, β and δ phases let zirconium migrate toward the fuel
surface.
Effective Interdiffusion Coefficients:
The interdiffusion coefficient of Zirconium for U-Pu-Zr is not available. Therefore it was
estimated to best fit the experimental data in Ref. [8].
The influence of plutonium addition and irradiation on the zirconium migration
kinetics is handled by some enhancement factors. The existence of plutonium in a ternary
fuel has been assumed to increase the interdiffusion coefficient [8], and the diffusion
coefficients for each phase have been found by matching the experimental data for the T-
179 fuel rod [8]. The results are given in Table 12 for the U-Zr alloy [11] and Table 13
for the U-Pu-Zr alloy with Plutonium weight fraction greater than 0.08. The gamma
phase diffusion coefficient given in Ref. [11] depends on the zirconium molar fraction.
Note that the quadratic dependency of the diffusion coefficient on the zirconium mole
fraction is preserved for both U-Zr and U-Pu-Zr fuels.
Table 12. Diffusion coefficients for U-Zr alloy phases
Table 13. Diffusion coefficients for U-Pu-Zr alloy phases (Pu is > 8 wt %)

38
The Zr diffusion coefficient for the dual phase β + γ is calculated by the diffusion
coefficient of the β and γ phases from Table 13 multiplied by a factor of 10 depending on
whether the β or γ phases exceed 50 %, respectively.
Model Development:
The one dimensional continuity equation for zirconium can be expressed in cylindrical
coordinates as follows:
When the concentration gradient becomes equal to the chemical potential gradient, the
diffusion in the γ phase inherently stops.
Within a dual phase field such as α + δ and β + γ, the driving force for diffusion is
affected by the solubility of zirconium in the precipitation phases.

39
The equation for zirconium interdiffusion flux is solved explicitly for each fuel axial
node.
Boundary Conditions
The boundary conditions are that the negative current at the origin of the fuel slug as well
as the positive current at the surface of the fuel slug are zero, as follows:
Modification for AFC Fuels with Higher Zr and Pu Content
In the following chapter, we will focus on the constituent and actinide migration
modeling and analysis results. In order to perform this modeling and analysis using

40
FEAST-Metal, it was necessary to modify the source code and re-compile it with
recalculated parameters to obtain the output data required for this study. The data of
interest are not included as output in the released version of the code. Additionally, the
first release of the code was unable to successfully calculate the outputs of interest for
high-zirconium or high-plutonium content fuels. Thermal conductivity of high zirconium
and high plutonium content fuels are not available. Instead, it was necessary to employ
approximate relations. The following thermal conductivity relations for U–Zr and Pu–Zr
binary alloys were adopted as described in Ref. [23]:
Here, kU–Zr is the uranium zirconium mixture thermal conductivity (W/m/K), kPu–
Zr is plutonium zirconium mixture thermal conductivity (W/m/K), kU is uranium thermal
conductivity (W/m/K), kPu is phase plutonium thermal conductivity (W/m/K), kc,U is
the thermal conductivity correction due to alloying effect for U–Zr, kc,Zr is the thermal
conductivity correction due to the alloying effect for Pu–Zr, xZr is zirconium weight
fraction, xPu is plutonium weight fraction, and T is the temperature (K).
Because the AFC fuel operates around the and solubility limits (see Fig. 3),
complete miscibility of the fuel constituents is assumed in order to approximate the

41
thermal conductivity of the U–Pu–Zr ternary alloy. For a given alloy of aU–bPu–cZr,
where a, b, and c are weight fractions, the thermal conductivity of aU–cZr and bPu–cZr
binary alloys are calculated (after doing the normalization) using the first two equations
from [23]. Then, average thermal conductivity of the aU–bPu–cZr ternary alloy is
calculated by weight averaging the binary alloy thermal conductivities as follows:
Note that the U–Zr and Pu–Zr thermal conductivities in the two first equations are close
to each other for a wide range. Therefore, sensitivity of overall results on the weight
averaging procedure is low. Higher fidelity approaches to assess thermal conductivity of
the ternary system can be adopted.
This re-calculation of thermal conductivity was necessitated by the fact that the
unmodified FEAST-Metal code would fail on “temperature out of range” with inputs for
high-Zr or high-Pu fuel.
Limitations and Restrictions on This Work
The challenges posed by the relative scarcity and lack of availability of
experimental data cannot be denied when evaluating the results obtained. The PIE data
from AFC fuels is unpublished as of this writing and may not be shared here explicitly.
EBR-II data from 20 to 30 years ago is still difficult to extract from ANL. Nonetheless,
the results of this study (as presented in the following chapter) agree quite well with the
experimental results that could be collected.
42
CHAPTER 5. RESULTS
Constituent redistribution in two of the EBR-II fuel pins was modeled and
observed, in order to confirm the results previously obtained by Karahan [1]. Two of the
AFC rodlets from the AFC-1D test assembly (1DR1) and AFC-1F were also modeled for
comparison of the experimental results with FEAST-Metal results.
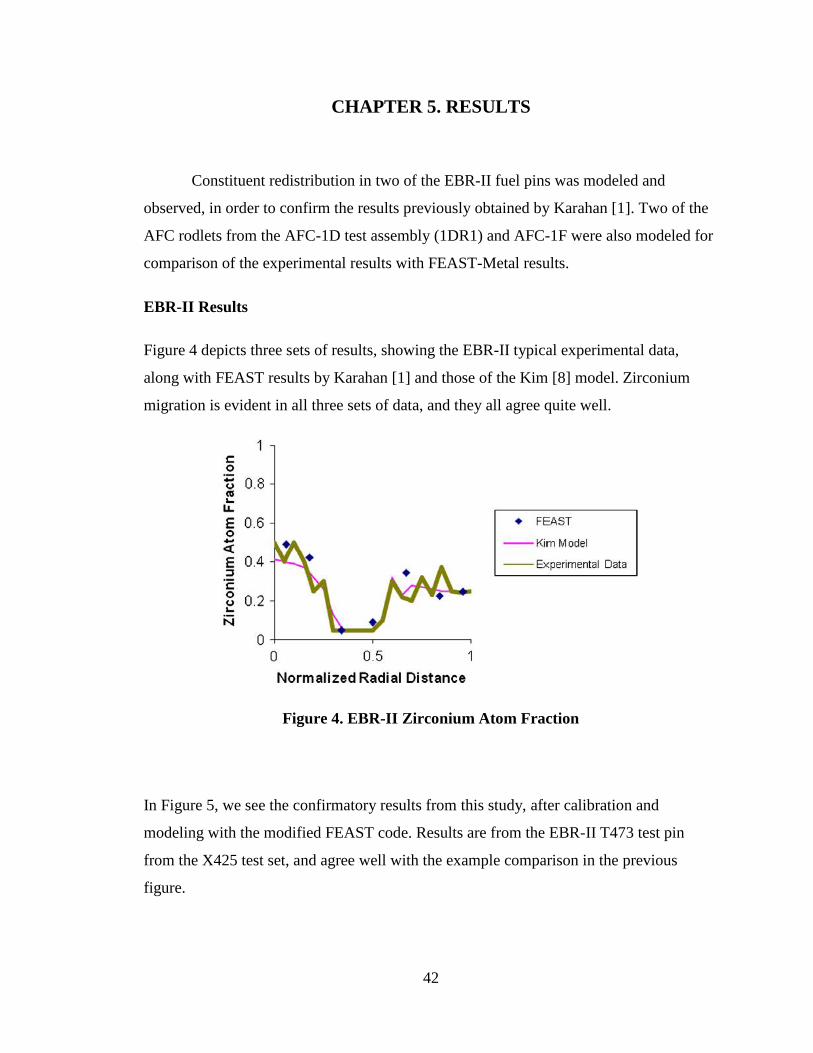
EBR-II Results
Figure 4 depicts three sets of results, showing the EBR-II typical experimental data,
along with FEAST results by Karahan [1] and those of the Kim [8] model. Zirconium
migration is evident in all three sets of data, and they all agree quite well.
Figure 4. EBR-II Zirconium Atom Fraction
In Figure 5, we see the confirmatory results from this study, after calibration and
modeling with the modified FEAST code. Results are from the EBR-II T473 test pin
from the X425 test set, and agree well with the example comparison in the previous
figure.

43
Figure 5. EBR-II Fuel Pin T473 Zr Atom Fraction
In Figure 6, another EBR II fuel pin, the T179 pin, is the same one depicted in the earlier
Figure 5. Here we demonstrate that our calibration is good, because the zirconium
redistribution is very much aligned with the experimental and other analytical results.
Figure 6. EBR-II T179 Zr Atom Fraction
0
0.1
0.2
0.3
0.4
0.5
0.1 0.3 0.4 0.6 0.7 0.9 1.0
Normalized Radial Distance
EBR-II Fuel Pin T473 - Zr Atom
Fraction
Zr Atom
Concentration
0
0.05
0.1
0.15
0.2
0.25
0.3
0.35
0.4
0.45
0.5
0.1 0.3 0.4 0.6 0.7 0.9 1.0
Normalized Radial Distance
EBR-II T179 Radial
Zr Atom Fraction
Zr Atom Concentration
44
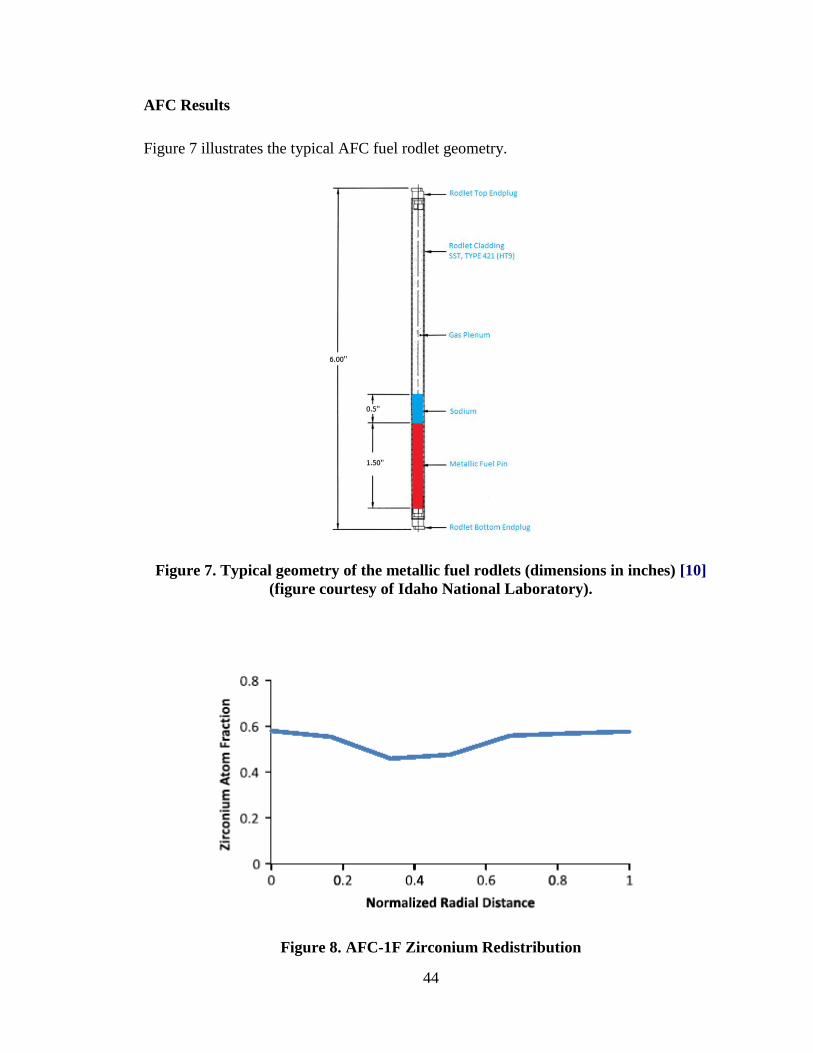
AFC Results
Figure 7 illustrates the typical AFC fuel rodlet geometry.
Figure 7. Typical geometry of the metallic fuel rodlets (dimensions in inches) [10]
(figure courtesy of Idaho National Laboratory).
Figure 8. AFC-1F Zirconium Redistribution

45
Figure 8 represents the radial zirconium atom fraction results obtained experimentally. In
this study (Figure 9), we have modeled the zirconium migration in another AFC rodlet,
the AFC-1D rodlet 1. It has a similar composition to the 1F rodlet in Figure 8. Note that
the result is again in good agreement. This 1D fuel contains approximately 40 wt% Zr.
Figure 9. AFC 1DR1 Zr Atom Fraction
In Figure 10, radial heat generation rate (volumetric power) is plotted for the T473 EBR-
II pin. It is useful to note that the curve is virtually the inverse of the zirconium atom
fraction curve for the same pin.
Figure 10. T473 Radial (Volumetric) HGR
0
0.1
0.2
0.3
0.4
0.5
0.6
0.7
0.1 0.3 0.4 0.6 0.7 0.9 1.0
Normalized Radial Distance
AFC 1DR1 Zr Atom Fraction
Zr Atom Concentration
1.00E+09
1.20E+09
1.40E+09
1.60E+09
1.80E+09
0.2 0.3 0.5 0.7 0.8 1.0
Normalized Radial Distance
T473 Radial HGR (W/m^3)
HGR (W/m^3)

46
CHAPTER 6. DISCUSSION AND CONCLUSIONS
The results presented in the previous chapter confirm several assumed characteristics of
actinide and constituent diffusion/redistribution in metal fuels:
1. Pu does not migrate; hence, the U and Zr concentration profiles are proportionally
opposite each other.
2. The equilibrium phases of the ternary U-Zr-Pu system are described by using a
quasi-binary U-Zr phase diagram (with constant Plutonium content), which is
produced from ternary phase diagrams, assuming uniformity of Plutonium in each
phase of the multiphase zones.
3. The minimum allowed Zirconium concentration in the Zirconium depleted middle
region is 5 atom % due to the solubility limit. When the concentration of a radial
node drops below 5 atom %, further diffusion from this node to the adjacent
nodes is not allowed. This limit corresponds to depletion of the matrix phase in
the middle region.
4. The presence of plutonium in the alloy at levels greater than 8 wt% enhances
uranium and zirconium migration by an order of magnitude.
5. Only radial migration of zirconium is considered. Axial temperature gradients are
relatively small and axial zirconium redistribution has not been observed
experimentally.
6. The radial power distribution in the fuel slug is demonstrated to be directly
proportional to the actinide concentration distribution, and inversely proportional
to the zirconium concentration distribution.
In the first phase of this work, a sensitivity study was performed on the thermo-
mechanical models of FEAST-Metal, producing a reduced set of calibration parameters
for possible adjustment in follow-on studies. A modification was then made to the
constituent redistribution model to enable the code to properly handle metallic fuel with
composition similar to that of AFC fuel.
47
Constitutive models in the FEAST-METAL fuel performance code have been
extended to simulate high zirconium and low content minor actinide bearing, high fissile
density metallic fuels. Approximate correlations have been adopted for constituent heats
of transport, fuel thermal conductivity, modulus of elasticity, and thermal expansion
coefficient. Experimental and theoretical observations support that the new fuel is stiffer
than the low Zr bearing reference fuel. In other words, in high-Zr content fuel, the
zirconium does not migrate nearly as much as in the low-Zr fuels. Also, once fuel
becomes restricted by the cladding (due to swelling at higher porosity), pore sintering to
accommodate solid fission product swelling occurs at a much higher level than low Zr
fuel. This could potentially be resulting in excessive straining of the cladding and
resulting fuel failures which have been observed [16]. The resulting FEAST-Metal fuel
performance code could be used for design of transmutation reactor fuels for sodium fast
reactor applications.
The addition of americium, neptunium, and curium to the traditional metallic fuel is
considered in the Advanced Fuels Campaign. These actinides add further complications
to the fuel behavior. For example, it is known from limited data that americium acts like
zirconium and diffuses toward the center of the fuel with slower rates. Neptunium is
observed to act like plutonium, which does not significantly diffuse. The weight fractions
of uranium, plutonium, zirconium, americium, and neptunium in the AFC fuels vary.
Proposed/Future Work
It is highly desirable to develop a robust and reliable 3D predictive M&S tool set
for metallic fast reactor fuel. To that end, it is recommended that development of INL’s
BISON-Metal code be taken to completion.

48
REFERENCES
1. A. Karahan, J. Buongiorno; “Modeling of Thermo-Mechanical and Irradiation
Behavior of Metallic and Oxide Fuels for Sodium Fast Reactors.” MIT Center for
Advanced Nuclear Energy Systems, August 2009.
2. P. Edelmann, B. Williams, A. Yacout, C. Unal; “Sensitivity Analysis of FEAST-
Metal Fuel Performance Code: Initial Results.” Los Alamos National Laboratory,
June 2012.
3. A. Karahan, J. Buongiorno; “Extending FEAST-METAL for Analysis of Low
Content Minor Actinide Bearing and Zirconium Rich Metallic Fuels for Sodium
Fast Reactors.” MIT Center for Advanced Energy Studies, October 2010.
4. A. Yacout, B. Williams, C. Unal, "Sensitivity Analysis Using LIFE-4 Fuel
Performance Code," Los Alamos National Laboratory report, LA-UR-10-06575,
September 2010.
5. A. Saltelli, K. Chan, and E. M. Scott, Sensitivity Analysis, John Wiley & Sons,
2000.
6. I. M. Sobol', "Sensitivity Analysis for Non-linear Mathematical Models,"
Mathematical Model. Comput. Exp., 1, 1993, pp. 407-414.
7. M. Lamboni, H. Monod, and D. Makowski, "Multivariate Sensitivity Analysis to
Measure Global Contribution of Input Factors in Dynamic Models," Reliability
Engineering and System Safety, 96, 2011, pp. 450-459.
8. Y. S. Kim et al., “Modeling of Constituent Redistribution in U-Pu-Zr metallic
Fuel,” Journal of Nuclear Materials, Vol. 359, pp. 17-28, (2006).
9. T. Ogata et al., “Constituent Migration Model For U-Pu-Zr Metallic Fast Reactor
Fuel,” Vol. 104, pp. 37-51, (1993).
10. B.A. Hilton, D.L. Porter, S.L. Hayes, AFC-1 Transmutation Fuels Post-Irradiation
Hot Cell Examination 4 to 8 at.% Final Report, INL/EXT-05-00785, Rev. 1,
2006.
11. G. L. Hofman et al., “Temperature Gradient Driven Constituent Redistribution in
U-Zr Alloys,” Journal of Nuclear Materials, Vol. 227, pp. 277-286, (1995).

49
12. W. Hwang et al., “Recent Improvements in Modeling Fission Gas Release and
Rod Deformation on Metallic Fuel in LMR,” Vol. 27, pp. 1057-1069, (2000).
13. C. Newman, G. Hansen, and D. Gaston, “Three Dimensional Coupled Simulation
of Thermodynamics, Heat, and Oxygen Diffusion in UO2 Nuclear Fuel Rods,”
Journal of Nuclear Materials 392, 6–15 (2009).
14. B. Michel, J. Sercombea, G. Thouvenina, and R. Chateleta, “Local Approach to
Fractures,” Engineering Fracture Mechanics 75:11, 3581–3598 (July 2008).
15. J. Sercombe, B. Michel, G. Thouvenina, B. Petitprez, R. Chatelet, D. Leboulch,
and C. Nonon, “Multi-Dimensional Modeling of PCMI during Base Irradiation
and Ramp Testing with ALCYONE V1.1,” Proceedings of Top Fuel 2009, Paris,
France, September 6–10, 2009, Paper 2096.
16. H. J. MacLean Chichester, D. L. Porter, B. A. Hilton, "Post-irradiation
Examination of AFC-1D, 1G, 1H, and 2A Experiments," Idaho National
Laboratory, September 2011.
17. A. Karahan, “Modeling of Thermo-mechanical and Irradiation Behavior of
Metallic and Oxide Fuels for Sodium Fast Reactors,” Ph. D. Thesis, Nuclear
Science and Engineering Department, Massachusetts Institute of Technology,
Cambridge, MA, (2009).
18. D. C. Crawford et al., “Fuels for Sodium-Cooled Fast Reactors: US Perspective,”
Journal of Nuclear Materials, Vol. 371, pp. 202-231, (2007).
19. N. E. Todreas et al., “Nuclear Systems-II, Elements of Thermal-hydraulic
Design,” Taylor & Francis, (1990).
20. G. Strang, “Linear Algebra and its Applications,” Brooks/Cole Pub. Co., (1988).
21. C. B. Lee et al., “Fission Gas Release and Swelling Model of Metallic Fast
Reactor Fuel,” Journal of Nuclear Materials, Vol. 288, pp.29-42, (2001).
22. T. Ogata et al., “Development and Validation of ALFUS: An irradiation Behavior
Analysis Code for Metallic Fast Reactor Fuels,” Nuclear Technology, Vol. 128,
pp. 113-123, (1999).
23. Y.S. Kim, G.L. Hofman, AAA Fuels Handbook, ANL-AAA-068, Argonne
National Laboratory, 2003.
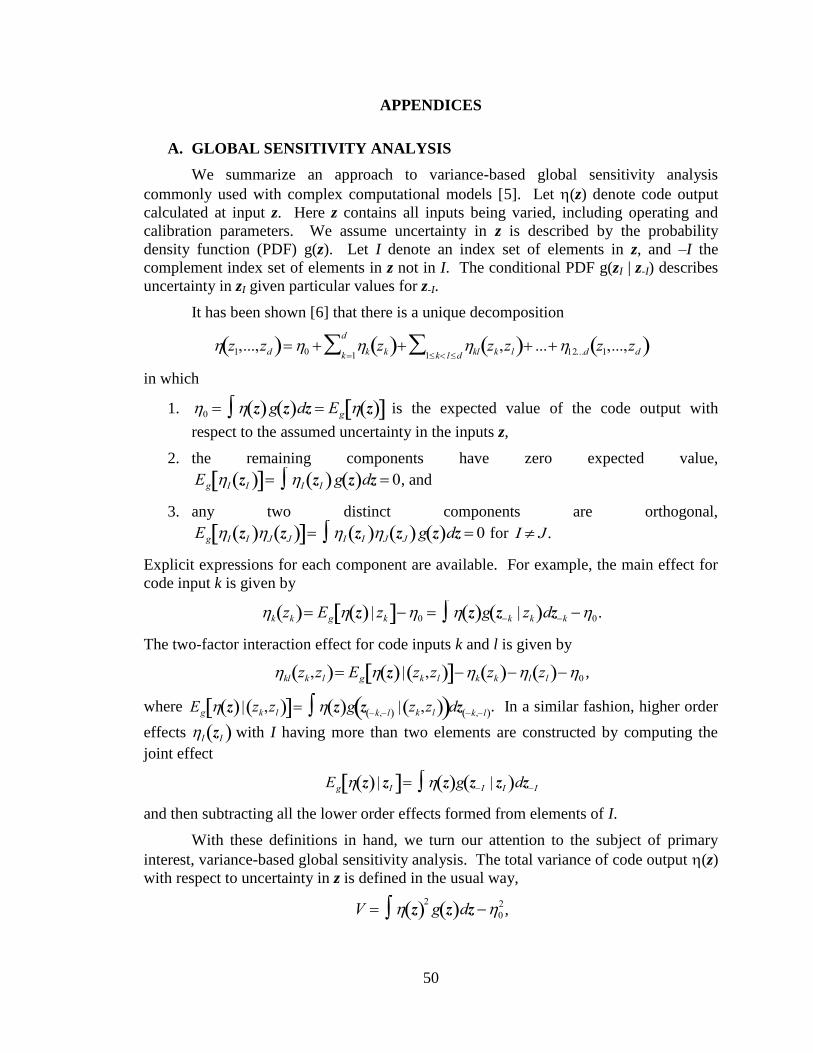
50
APPENDICES
A. GLOBAL SENSITIVITY ANALYSIS
We summarize an approach to variance-based global sensitivity analysis
commonly used with complex computational models [5]. Let (z) denote code output
calculated at input z. Here z contains all inputs being varied, including operating and
calibration parameters. We assume uncertainty in z is described by the probability
density function (PDF) g(z). Let I denote an index set of elements in z, and –I the
complement index set of elements in z not in I. The conditional PDF g(zI | z-I) describes
uncertainty in zI given particular values for z-I.
It has been shown [6] that there is a unique decomposition
z1,...,zd 0 k zk k1
d
kl zk,zl 1k ld
...12...d z1,...,zd
in which
1.
0 z g z dz Eg z is the expected value of the code output with
respect to the assumed uncertainty in the inputs z,
2. the remaining components have zero expected value,
Eg I zI I zI g z dz 0, and
3. any two distinct components are orthogonal,
Eg I zI J zJ I zI J zJ g z dz 0 for
I J.
Explicit expressions for each component are available. For example, the main effect for
code input k is given by
k zk Eg z | zk 0 z g zk | zk d zk 0.
The two-factor interaction effect for code inputs k and l is given by
kl zk,zl Eg z | zk,zl k zk l zl 0 ,
where
Eg z | zk,zl z g z k,l | zk,zl d zk,l . In a similar fashion, higher order
effects
I zI with I having more than two elements are constructed by computing the
joint effect
Eg z | zI z g zI | zI d zI
and then subtracting all the lower order effects formed from elements of I.
With these definitions in hand, we turn our attention to the subject of primary
interest, variance-based global sensitivity analysis. The total variance of code output (z)
with respect to uncertainty in z is defined in the usual way,
V z 2g z dz 0
2,

51
while the variance of individual components
I zI in the Sobol’ decomposition are
computed as follows,
VI I2zI g zI dzI .
The sensitivity index corresponding to the effect
I zI is defined to be the variance ratio
SI VI V . If the inputs are taken to be independently distributed, then the total output
variance decomposes into a sum of the component variances,
V Vkk1
d
Vkl1k ld ...V12...d ,
referred to as the analysis of variance (ANOVA) decomposition. The total effect of input
k is defined as follows,
VTk V Vk ,
that is, the total output variance minus the joint effect variance of all inputs except k.
When the ANOVA decomposition holds, this simplifies to
VTk Vk Vkllk ...V12...d ,
which is the sum of input k main effect variance
Vk and all interaction effect variances
involving input k.
The calculated outputs from FEAST-Metal are functional, in that each input
setting results in an output curve in time. Global sensitivity analysis for functional
outputs is conducted in a straightforward fashion by converting the functional output into
an equivalent (with respect to sensitivity analysis) scalar output using principal
component analysis. The steps are as follows:
1. If necessary, interpolate the output from each input setting onto a common time
grid.
2. Compute the output correlation matrix P.
3. Orthogonalize P to obtain P = VV’, where V is the matirix of (column)
eigenvectors and is the diagonal matrix of associated eigenvalues.
4. Obtain the matrix of principal component scores, H(X), as H(X) = V’(X), where
X is the matrix of input settings in the experiment design and (X) denotes the
matrix of corresponding mean-centered and standard deviation-scaled outputs.
5. Construct the scalar output h(X) by summing across the columns of H(X), and
conduct global sensitivity analysis on h(X).
It can be shown [7] that the variance components computed from scalar h(X) are
equivalent to the generalized variance components computed from the full functional data
(X).

52
B. DESCRIPTION OF TEST FUEL
EBR-II Fuel
X425 Test Array (T179, T473):
Parameter Value
Fuel Composition U-19-Pu-10Zr
Clad Material HT-9
Fuel slug radius (mm) 2.16
Clad inner radius (mm) 2.54
Clad outer radius (mm) 2.92
Fuel Smear Density (%) 72.4
Fuel Active Length (cm) 34.3
Plenum to Fuel Ratio 1.0
Peak Linear Heat Rate (kW/m) 40
Peak Clad Temperature (deg C ) 590
AFC Fuel
1D-Rodlet 1
Rodlet Length (in.) 5.997
Rodlet OD (in.) 0.230
Rodlet Mass (g) 16.403
Fuel Column Length (in.) 1.490
Fuel OD (in.) 0.152
Fuel Mass (g) 4.443
Fuel Density (g/cm3) 9.917
Fuel Nominal Composition 48Pu-12Am-40Zr
Pu (wt%) 48.36
239Pu (%) 82.57
240Pu (%) 16.51
241Pu (%) 0.57
Np (wt%) 0.25
Am (wt%) 11.90
Zr (wt%) 40.00
Na Mass (g)
0.49