modeling and testing of digital protection realy for … · modeling and testing of digital...
TRANSCRIPT

MODELING AND TESTING OF DIGITAL PROTECTION REALY FOR AN
INDUCTION MOTOR
by
Sungmin Cho

Executive Summary The project details the modelling of the induction motor SEL701 Relay in PowerFactory. In
order to prove operational reliability, both off-line and on-line testing were implemented to
verify the characteristic curve of the relay by measuring trip times. Prior to modelling the
relay, the thermal limit curves of the motor were studied to scheme the motor protection
relay.
In addition, the requirement of motor protection is discussed and the elements of a
protection relay corresponding to the requirements are presented.
The results indicate that the off-line (simulation) and on-line test have consistent outcomes.

Acknowledgements
First and foremost I would like to thank my supervisor, Professor Gregory Crebbin, who has
supported me throughout my thesis with his patience and invaluable advice.
I gratefully acknowledge Peter Willis and staff of DIgSILENT for their constructive comments
on this thesis.
I also would like to extend my gratitude to Professor Parisa Arabzadeh Bahri and the School
of Engineering and Energy for the support and equipment I have needed to complete my
thesis.
Words cannot express my appreciation to my parents for their sympathetic ear and
incomparable support.
Table of Contents
Executive Summary ................................................................................................................................ 1
Acknowledgements ................................................................................................................................. 3
1 Introduction ......................................................................................................................................... 1
1.1 Problem scope ....................................................................................................................................... 1
1.2 Technical Review ................................................................................................................................... 1
1.3 The plan of the project ........................................................................................................................... 2
2 Induction motor ................................................................................................................................... 4
2.1 Principle of the Induction Motor ............................................................................................................... 4
2.2 Induction Motor System .......................................................................................................................... 5 2.2.1 The Electrical Model........................................................................................................................... 6 2.2.2 The Mechanical Model........................................................................................................................ 7 2.2.3 The Thermal Model ........................................................................................................................... 8
2.3 Characteristic Curve of Induction motor ................................................................................................. 10 2.3.1 Plotting the characteristic curve in the MATLAB .................................................................................. 12
2.4 Commercial Induction Motor Data Analysis ............................................................................................. 13 2.4.1 Estimating the Induction Motor Data ................................................................................................. 13 2.4.2 Motor Thermal Limit Curve ............................................................................................................... 15 2.4.3 The Scheme of the Motor Protection ................................................................................................. 18
2.5 Modelling Induction motor in PowerFactory ............................................................................................ 19 2.5.1 LV Induction Motor .......................................................................................................................... 19 2.5.2 MV Induction Motor ......................................................................................................................... 21
3 Induction Motor Protection ............................................................................................................... 22
3.1 Motor Protection Requirements and Solutions with Protection relay .......................................................... 22 3.1.1 Pullout (Starting and Stalling) Protection ........................................................................................... 22 3.1.2 Stator Winding Protection ................................................................................................................ 22 3.1.3 Rotor Thermal Protection ................................................................................................................. 23 3.1.4 Overload Protection ......................................................................................................................... 23 3.1.5 Stator Fault Protection ..................................................................................................................... 23 3.1.6 Abnormal Voltage Protection ............................................................................................................ 24
3.2 Protection Devices for Induction motors ................................................................................................. 25
3.3 Motor Protection Consideration .............................................................................................................. 26
4 Off-line Testing of the SEL701 with PowerFactory ........................................................................... 28
4.1 Assumptions for modelling the motor protection relay ............................................................................. 28
4.2 Reasons for protection relay modelling and simulation ............................................................................. 28
4.3 Introduction and Application of SEL 701 Relay ........................................................................................ 29
4.4 Modelling and Setting Setpoints of SEL 701 Relay ................................................................................... 30 4.4.1 Current and Voltage Transformers (CT, GT and VT) ............................................................................ 30 4.4.2 Thermal Protection Element (49) ...................................................................................................... 32 4.4.3 Instantaneous Protection Element (50P, 50N and 50Q) ....................................................................... 36 4.4.4 Overvoltage (59) and Undervoltage (27) Protection Element ............................................................... 38
4.5 Testing the relay with events ................................................................................................................ 39 4.5.1 Information Prior to the Testing ........................................................................................................ 39 4.5.2 Balance and Unbalanced Thermal Overload ....................................................................................... 41 4.5.3 Instantaneous Protection Element (50P and 50N) ............................................................................... 42 4.5.4 Negative sequence current relay test ................................................................................................ 44
4.6 Case Study .......................................................................................................................................... 45
5 On-Line Testing of SEL701 Relay with Omicron ............................................................................... 47
5.1 Advantage and Method of testing relay .................................................................................................. 47
5.2 Algorithm of Protection Relay ................................................................................................................ 48 5.2.1 Hardware Implementation ................................................................................................................ 48 5.2.2 Software Implementation ................................................................................................................. 50
5.3 Preparation for Testing the Relay ........................................................................................................... 51 5.3.1 Setup for testing the relay ................................................................................................................ 51
5.4 Steady State Test ................................................................................................................................. 53 5.4.1 Thermal Protection Element (49) ...................................................................................................... 53 5.4.2 Instantaneous Protection Element (50P and 50N) ............................................................................... 55 5.4.3 Overvoltage(59) and Undervoltage(27) Protection Element ................................................................ 56
5.5 Dynamic Test ....................................................................................................................................... 58 5.5.1 Instantaneous Protection Element (50P, 50N and 50Q) ....................................................................... 58
5.6 General Check List for Incorrect Test Results or Malfunctioning of Relay ................................................ 60
6 Conclusion .......................................................................................................................................... 61
6.1 Further work ........................................................................................................................................ 62
7 Reference ........................................................................................................................................... 63
8 APPENDIX .......................................................................................................................................... 64

Table of Figures
Figure 1-1.The flow chart of the tasks of the project ....................................................................................... 3
Figure 2-1. LV motor Equivalent circuit .......................................................................................................... 6
Figure 2-2. A induction motor current, torque vs. speed characteristic curve. .................................................... 7
Figure 2-3. Motor Damage (thermal limit) Curve[5] ......................................................................................... 9
Figure 2-4. (a) The magnetic behaviour with light loads. (b) The magnetic behaviour with heavy loads[3] ........ 11
Figure 2-5. Electromechanical Torque vs. Speed for the Rotor Resistance. ...................................................... 13
Figure 2-6. Current-Speed (Slip) Curve ........................................................................................................ 16
Figure 2-7. The MV motor thermal limit curve[8]. ......................................................................................... 18
Figure 2-8 LV Motor Time-current Curve (TCC) ............................................................................................. 20
Figure 2-9. MV Motor Time-current Curve (TCC) ........................................................................................... 21
Figure 4-1. SEL-701 Relay Functional Graphical Description[12] ..................................................................... 29
Figure 4-2. CT Setting for Phase and Ground ................................................................................................ 31
Figure 4-3. The AC Wiring Diagram, four-wire Wye Voltage and Ground CT .................................................... 31
Figure 4-4. Curves 1, 10, 20, 30 and 40 in PowerFactory .............................................................................. 33
Figure 4-5. Time-overcurrent plot of MV motor protection ............................................................................. 34
Figure 4-6. Generic Thermal Limit Curves, Cold Motor (SF=1.01) ................................................................... 35
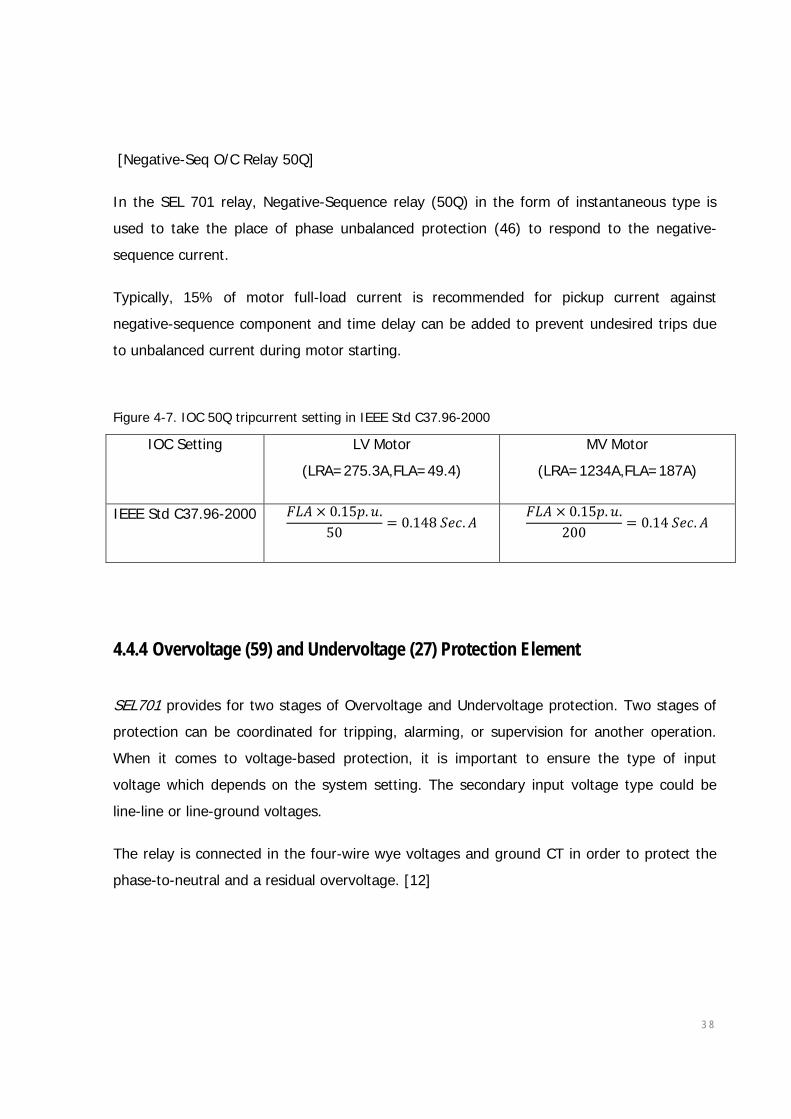
Figure 4-7. IOC 50Q tripcurrent setting in IEEE Std C37.96-2000 ................................................................... 38
Figure 4-8. Current vs. Time regarding to loading condition ........................................................................... 41
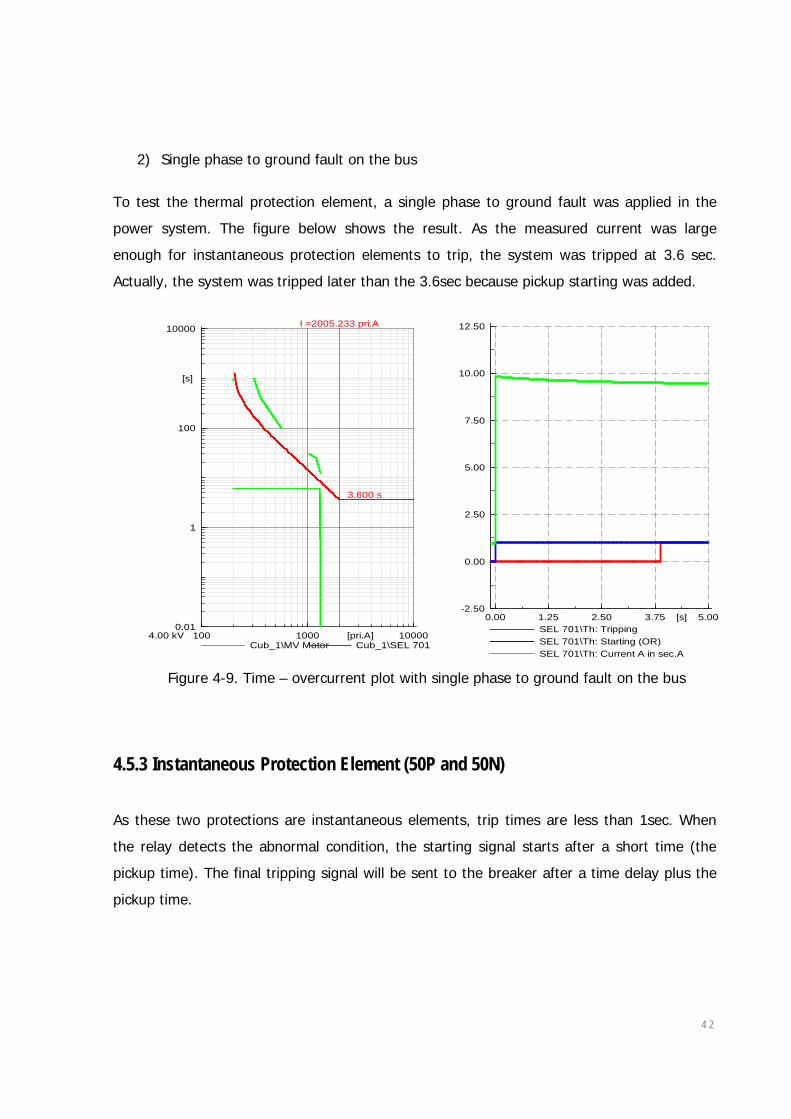
Figure 4-9. Time – overcurrent plot with single phase to ground fault on the bus ............................................ 42
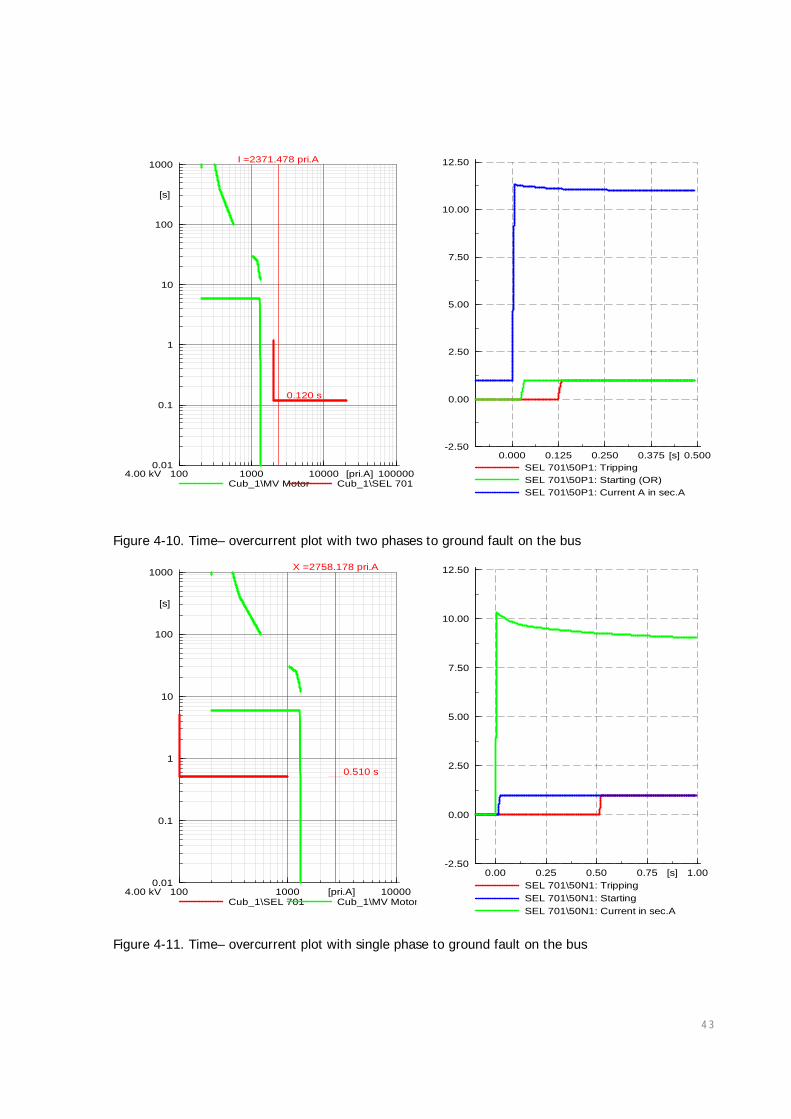
Figure 4-10. Time– overcurrent plot with two phases to ground fault on the bus ............................................. 43
Figure 4-11. Time– overcurrent plot with single phase to ground fault on the bus ........................................... 43
Figure 4-12. 2-Ph Fault Trip time in Time-overcurrent Plot ............................................................................. 44
Figure 4-13. Time-Overcurrent Plot of Single Phase to Ground Fault on 4kV with Relay in LV motor .................. 45
Figure 4-14. Time-Overcurrent Plot of Single Phase to Ground Fault on 4kV with Relay in MV motor ................. 46
Figure 5-1. On-line relay testing algorithm. .................................................................................................. 48
Figure 5-2. The connection of the protection relay to the induction motor[2]. ................................................. 49
Figure 5-3. Block diagram of the digital protection relay hardware[2]. ............................................................ 49
Figure 5-4. Flow chart of the digital protection relay software[2]. ................................................................... 51
Figure 5-5. Set up between relay, computer and test equipment. ................................................................... 52
Figure 5-6. Plot of trip time versus multiples of full load current (curve 4 for MV motor). .................................. 54
Figure 5-7. Test result of instantaneous phase element (50P) with two phases to ground fault ......................... 59
Figure 5-8. Test result of instantaneous phase element (50G) with single phases to ground fault ...................... 59
Figure 5-9. Test result of instantaneous phase element (50Q) with two phases to ground fault ......................... 59

Table of Tables Table 2-1. The LV motor data ....................................................................................................................... 6
Table 2-2. LV Induction Motor Data Sheet .................................................................................................... 14
Table 2-3. MV Induction Motor Data Sheet 1 ................................................................................................ 14
Table 2-4. MV Induction Motor Data Sheet (cont’) ........................................................................................ 15
Table 3-1. Items to consider in protection of motors[9]. ................................................................................ 26
Table 4-1. CT ratio and VT ratio .................................................................................................................. 31
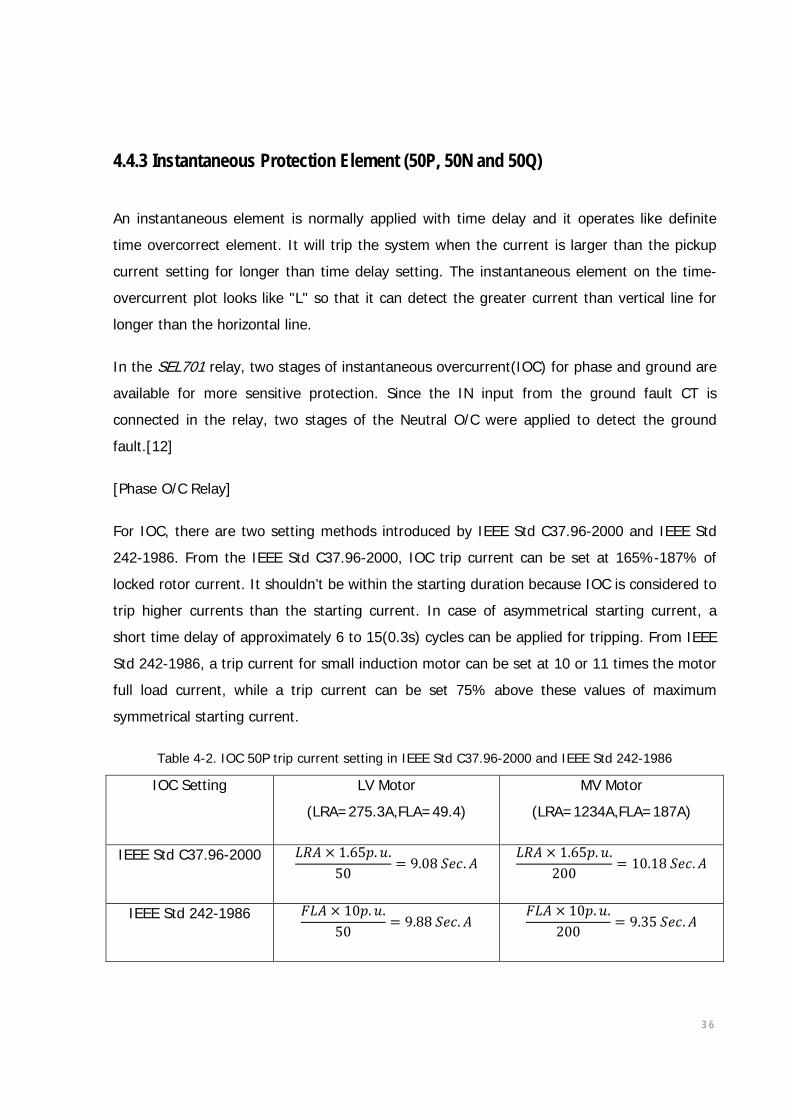
Table 4-2. IOC 50P trip current setting in IEEE Std C37.96-2000 and IEEE Std 242-1986 ................................. 36
Table 4-3. Overcurrent Element Settings[12] ................................................................................................ 37
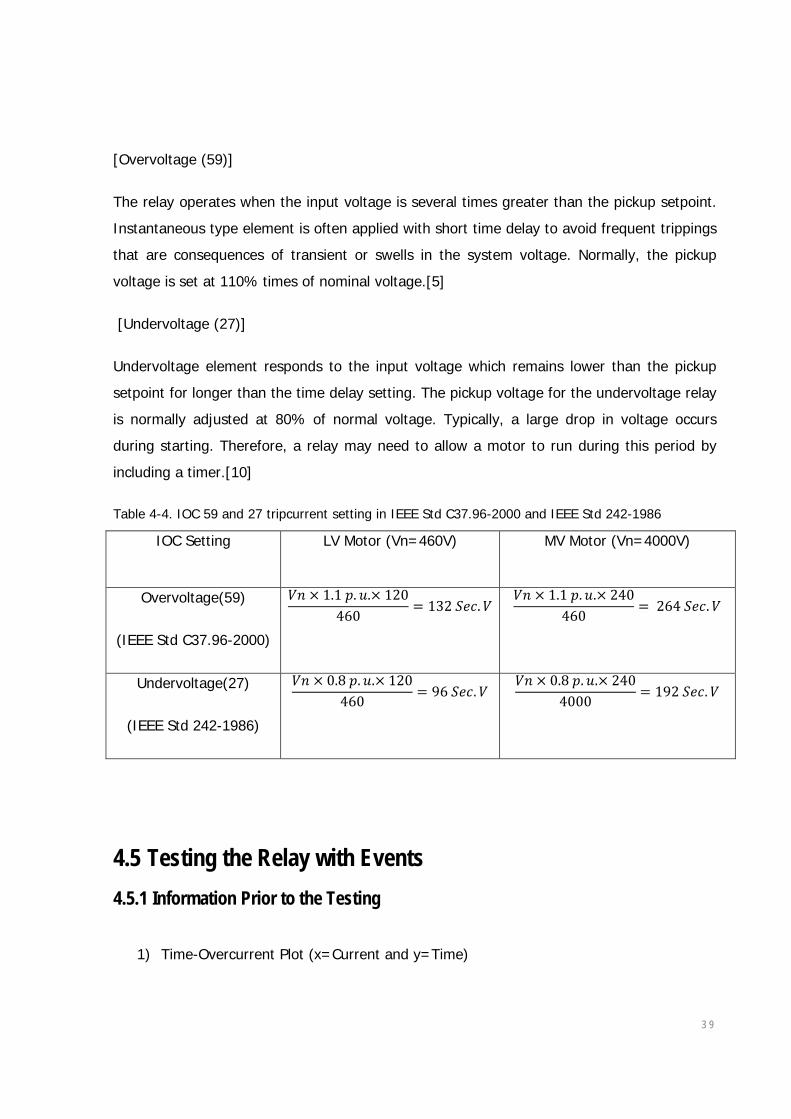
Table 4-4. IOC 59 and 27 tripcurrent setting in IEEE Std C37.96-2000 and IEEE Std 242-1986 ......................... 39
Table 5-1. Test sheet of the thermal curve 4 for MV motor ............................................................................ 54
Table 5-2. Test sheet of the instantaneous phase protection (50P) for MV motor ............................................. 56
Table 5-3. Test sheet of the instantaneous E/F protection (50N) for MV motor ................................................ 56
Table 5-4 Test sheet of the voltage protection (27/59) for MV motor .............................................................. 57
Table 5-5. Comparison of instantaneous tests .............................................................................................. 60

8
1
1 Introduction
1.1 Problem scope The investigations that will be carried out in this project are motivated by the following
scenario:
A plant process shuts down every two years for maintenance and upgrades. On this
occasion, a protection engineer is asked to replace an existing motor protection relay with a
new SEL701 motor protection relay as part of an upgrade to the power system [1].
This project will define and carry out the steps that need to be carried out in order to
complete this protection upgrade. In particular, the key objectives that will be addressed in
this thesis are:
• to analyse an induction motor in order to model all pertinent features that impact on
its safe and reliable operation;
• to develop a clear understanding of the requirements of a protection relay for an
induction motor;
• to model both the induction motor and the motor protection relay in DIgSILENT’s
PowerFactory;
• to test the motor protection relay in both on-line and off-line modes of operation.
1.2 Technical Review In industry, three phase induction motors are regarded as the most applicable industrial
motor due to their rigidity and speed–control flexibility. They are widely used for size
reduction and other numerous purposes with economical operating cost. Normally, an
industrial induction motor operates close to its operating capacity, hence there is a high
possibility that it will face abnormal operating conditions such as overload and overcurrent.
Consequently, there have been many research studies into the problem of reliable induction
motor operation[1]. Especially, motor protection has been used for about 35 years, and it
has helped to prolong the service life of motors. It is known that the possibility of failure of
motor protection is low; outage from a motor failure, however, brings extremely high

2
financial consequences that are related in the purchase of new equipment and loss of profit
from disturbing a process. These are the reasons why it is important to understand and
improve upon the technique of motor protection.
In recent years, digital relays based on microprocessors have been introduced to solve
reliability problems in induction motor protection. The digital relay is highlighted in terms of
providing more available protection functions and giving higher accuracy of performance
than traditional electromechanical and solid-state relays[2]. Typically, the microprocessor-
based protection relay is equipped with timers and AD converters and with digital I/O units
that are controlled by central processing units so that they can provide accurate rapid
protection in real time[1].
The digital relay must be able to detect the abnormal conditions so it can protect the motor
from failures during operation. A special feature of a motor protection relay is thermal
protection. Most of problems associated with motor operation lead to a similar mechanism
for damaging the motor. These abnormal operation conditions cause an increase in current
which produce heat in the conductors, and the failure will be a consequences of the thermal
damage to the insulation in the induction motor. Therefore, the digital relay will incorporate
programmable thermal damaging current versus time curves so it can predict the thermal
behaviour for a wide range of industrial induction motors[1].
1.3 The Plan of the project Figure 1-1 illustrates the flow of the tasks to be undertaken in this project. The tasks will be
performed step by step starting from chapter two. Each chapter describes the goal of the
task, the procedures to be followed and the results.
In the Chapter 2, the characteristic of induction motors will be investigated because the
proper protection to motors can only be attained by fully understanding motor
characteristics. The principles the induction motor behaviour will be explained and modelled
from the three points of views - electrical, mechanical and thermal. Commercial motor data
sheets will be used to analyse the thermal characteristic curve and to model the LV and MV
motors in the PowerFactory.

3
Chapter 3 will clarify the types of motor failures from the basis of the motor protection
requirements. To prepare for the next chapter involving modelling the relay, the motor
protection considerations and the protection relay element are presented.
In Chapter 4, with the knowledge from chapter 3, the SEL701 motor protection relay will
be modelled with the selected functions including thermal protection. Before modelling the
relay, the assumptions of modelling the relay and significance of the simulation will be
presented. Once the relay is ready, the relay setting parameters will be calculated based on
the standards and then fault events will be forced into the system to verify the operation of
the relay, with reference to the manufacturer’s data.
Finally, in Chapter 5, a real SEL701 motor relay will be tested in on-line mode by using
relay testing equipment from OMICRON, sponsored by DIgSILENT in Perth. The tests were
performed under two conditions, steady state and dynamic, which differed by input signal
type.
Figure 1-1. The flow chart of the tasks of the project
Simulate the power system protected by the SEL701 relay
Analyse the induction motor data
Design and simulate the power System with the motor
Model the SEL701 motor protection relay
Set the parameters
Check and modify the
settings
Is setting correct?
4
2 Induction motor
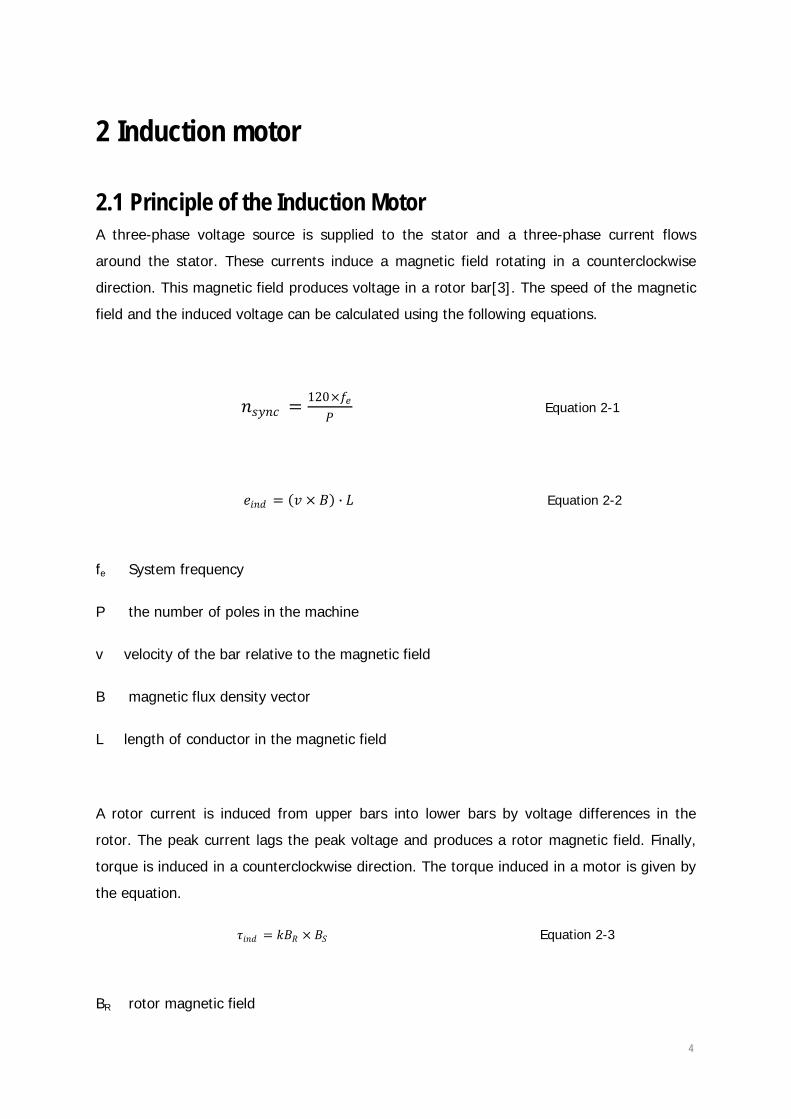
2.1 Principle of the Induction Motor A three-phase voltage source is supplied to the stator and a three-phase current flows
around the stator. These currents induce a magnetic field rotating in a counterclockwise
direction. This magnetic field produces voltage in a rotor bar[3]. The speed of the magnetic
field and the induced voltage can be calculated using the following equations.
𝑛𝑛𝑠𝑠𝑠𝑠𝑛𝑛𝑠𝑠 = 120×𝑓𝑓𝑒𝑒𝑃𝑃
Equation 2-1
𝑒𝑒𝑖𝑖𝑛𝑛𝑖𝑖 = (𝑣𝑣 × 𝐵𝐵) ∙ 𝐿𝐿 Equation 2-2
fe System frequency
P the number of poles in the machine
v velocity of the bar relative to the magnetic field
B magnetic flux density vector
L length of conductor in the magnetic field
A rotor current is induced from upper bars into lower bars by voltage differences in the
rotor. The peak current lags the peak voltage and produces a rotor magnetic field. Finally,
torque is induced in a counterclockwise direction. The torque induced in a motor is given by
the equation.
𝜏𝜏𝑖𝑖𝑛𝑛𝑖𝑖 = 𝑘𝑘𝐵𝐵𝑅𝑅 × 𝐵𝐵𝑆𝑆 Equation 2-3
BR rotor magnetic field
5
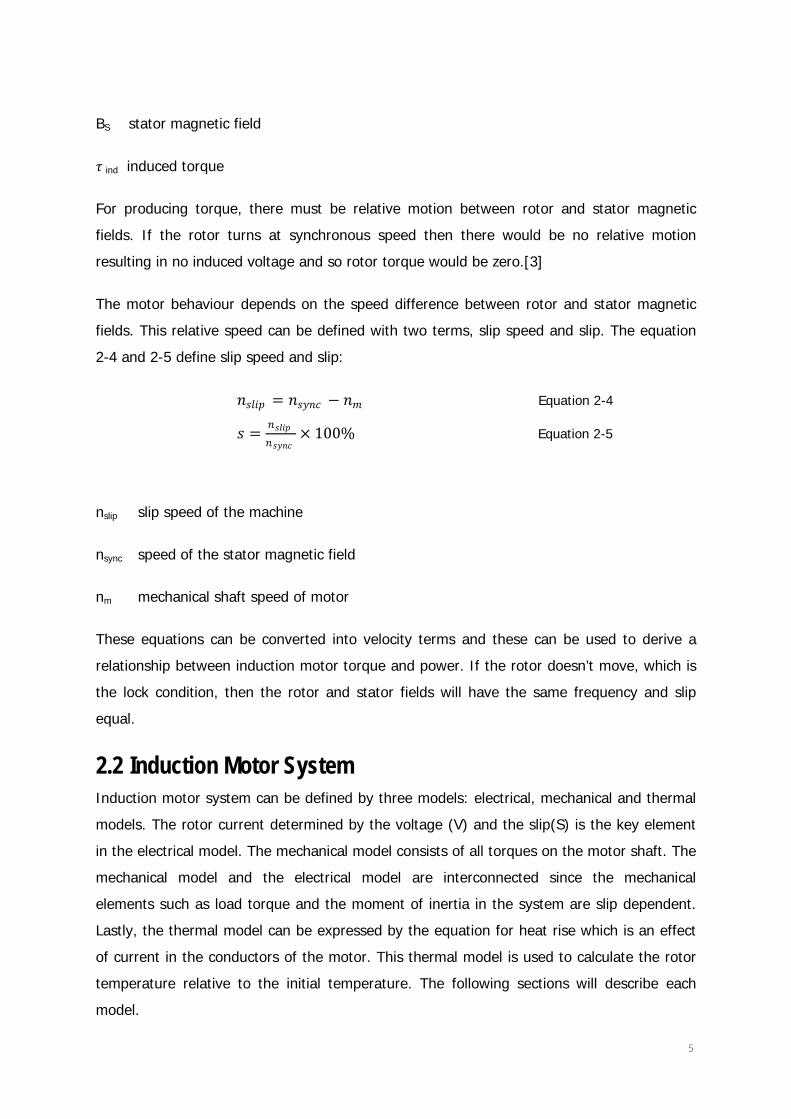
BS stator magnetic field
𝜏𝜏 ind induced torque
For producing torque, there must be relative motion between rotor and stator magnetic
fields. If the rotor turns at synchronous speed then there would be no relative motion
resulting in no induced voltage and so rotor torque would be zero.[3]
The motor behaviour depends on the speed difference between rotor and stator magnetic
fields. This relative speed can be defined with two terms, slip speed and slip. The equation
2-4 and 2-5 define slip speed and slip:
𝑛𝑛𝑠𝑠𝑠𝑠𝑖𝑖𝑠𝑠 = 𝑛𝑛𝑠𝑠𝑠𝑠𝑛𝑛𝑠𝑠 − 𝑛𝑛𝑚𝑚 Equation 2-4
𝑠𝑠 = 𝑛𝑛𝑠𝑠𝑠𝑠𝑖𝑖𝑠𝑠𝑛𝑛𝑠𝑠𝑠𝑠𝑛𝑛𝑠𝑠
× 100% Equation 2-5
nslip slip speed of the machine
nsync speed of the stator magnetic field
nm mechanical shaft speed of motor
These equations can be converted into velocity terms and these can be used to derive a
relationship between induction motor torque and power. If the rotor doesn’t move, which is
the lock condition, then the rotor and stator fields will have the same frequency and slip
equal.
2.2 Induction Motor System Induction motor system can be defined by three models: electrical, mechanical and thermal
models. The rotor current determined by the voltage (V) and the slip(S) is the key element
in the electrical model. The mechanical model consists of all torques on the motor shaft. The
mechanical model and the electrical model are interconnected since the mechanical
elements such as load torque and the moment of inertia in the system are slip dependent.
Lastly, the thermal model can be expressed by the equation for heat rise which is an effect
of current in the conductors of the motor. This thermal model is used to calculate the rotor
temperature relative to the initial temperature. The following sections will describe each
model.
6
2.2.1 The Electrical Model
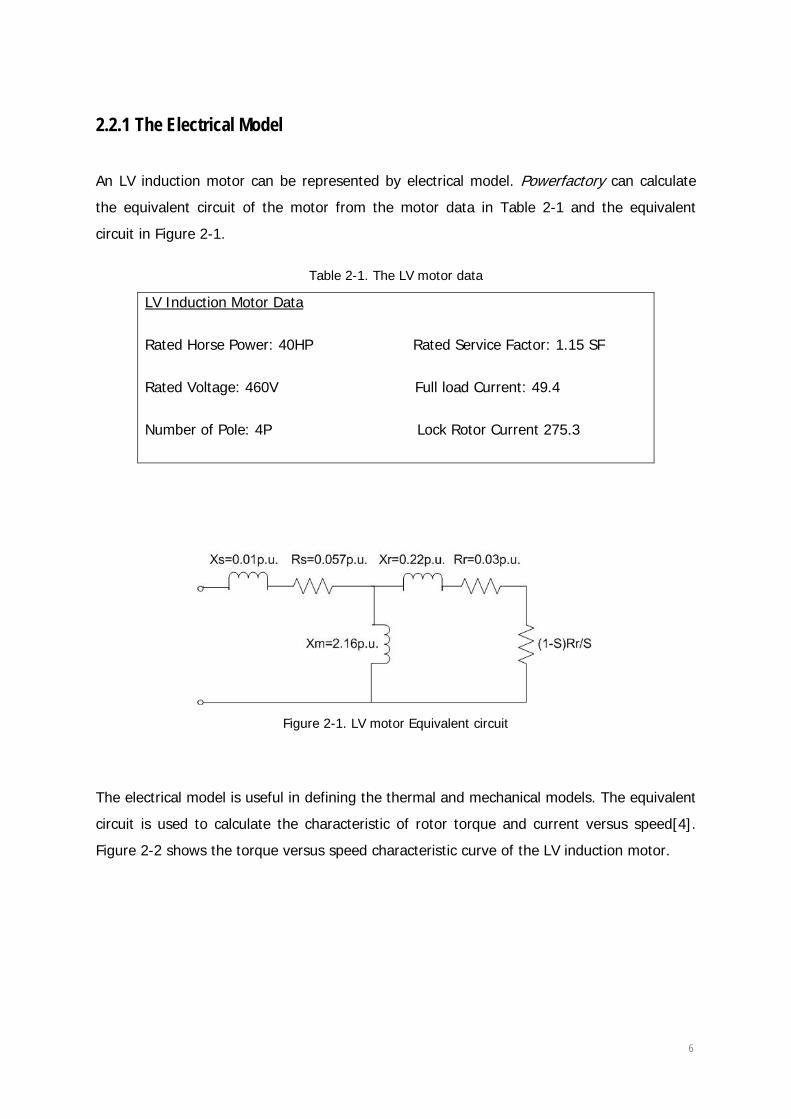
An LV induction motor can be represented by electrical model. Powerfactory can calculate
the equivalent circuit of the motor from the motor data in Table 2-1 and the equivalent
circuit in Figure 2-1.
Table 2-1. The LV motor data
LV Induction Motor Data
Rated Horse Power: 40HP Rated Service Factor: 1.15 SF
Rated Voltage: 460V Full load Current: 49.4
Number of Pole: 4P Lock Rotor Current 275.3
Figure 2-1. LV motor Equivalent circuit
The electrical model is useful in defining the thermal and mechanical models. The equivalent
circuit is used to calculate the characteristic of rotor torque and current versus speed[4].
Figure 2-2 shows the torque versus speed characteristic curve of the LV induction motor.

7
Figure 2-2. A induction motor current, torque vs. speed characteristic curve.
2.2.2 The Mechanical Model
The mechanical model can be defined by the equation about the summation of torques on
the shaft[4].
(𝑄𝑄𝑀𝑀 − 𝑄𝑄𝐿𝐿) = 𝑀𝑀𝑖𝑖𝑑𝑑𝑖𝑖𝑑𝑑
Equation 2-6
where:
QM Motor torque
QL Load torque
M Combined moment of inertia of the motor and the drive
W Velocity
The torque difference (QM-QL) expresses the accelerating power which affects the time
taken for the motor to reach the peak torque and rated speed.
8
2.2.3 The Thermal Model
In the induction motor, the stator windings and the squirrel cage bars on the rotor are the
major heat sources for raising motor temperature. Besides these components, there are
numerous other heat sources which produce heat via thermal resistance, therefore a heat
sink is added to limit the steady state value in temperature by flowing cooling air through
the air gap[5]. The equation calculating the temperature of a motor beyond steady state
value is given by
𝑇𝑇−𝑇𝑇𝑎𝑎𝑚𝑚𝑎𝑎𝑖𝑖𝑒𝑒𝑛𝑛𝑑𝑑𝑇𝑇𝑖𝑖𝑛𝑛𝑖𝑖𝑑𝑑𝑖𝑖𝑎𝑎𝑠𝑠 −𝑇𝑇𝑎𝑎𝑚𝑚𝑎𝑎𝑖𝑖𝑒𝑒𝑛𝑛𝑑𝑑
= 𝑒𝑒−𝑑𝑑𝜏𝜏 Equation 2-7
hence
𝑇𝑇 = 𝑇𝑇𝑎𝑎𝑚𝑚𝑎𝑎𝑖𝑖𝑒𝑒𝑛𝑛𝑑𝑑 + �(𝑇𝑇𝑖𝑖𝑛𝑛𝑖𝑖𝑑𝑑𝑖𝑖𝑎𝑎𝑠𝑠 − 𝑇𝑇𝑎𝑎𝑚𝑚𝑎𝑎𝑖𝑖𝑒𝑒𝑛𝑛𝑑𝑑 )𝑒𝑒−𝑑𝑑 𝜏𝜏� � Equation 2-8
where
T The present temperature
Tinitial Initial temperature of the motor
Tambient Ambient temperature of the cooling air
T Time in seconds
τ Thermal time constant based on machine construction
Normally, the motor experiences the largest amount of heat generation during start-up. This
heat is produced from the resistance of the rotor bars and can result in damage due to bar
expansion and deformation. The heat is also generated during motor running, which can
lead to electrical faults in the motor by exceeding the thermal limit of the stator windings.
The unbalanced and negative sequence currents with overload could be other sources
causing an increase in the temperature[5]. The thermal model is given by
∫𝑞𝑞 𝑖𝑖𝑑𝑑 = 𝑅𝑅 ∫ 𝐼𝐼𝑒𝑒𝑞𝑞2 𝑖𝑖𝑑𝑑 = 𝑠𝑠𝑑𝑑𝑇𝑇 Equation 2-9
hence
𝑇𝑇 = 𝑅𝑅𝑠𝑠𝑑𝑑𝑘𝑘 ∫ 𝑖𝑖𝑒𝑒𝑞𝑞
2 𝑖𝑖𝑑𝑑 = 𝑠𝑠𝑑𝑑𝑇𝑇 Equation 2-10
9
𝐼𝐼𝑒𝑒𝑞𝑞2 𝑘𝑘 = 𝐶𝐶𝐶𝐶𝑛𝑛𝑠𝑠𝑑𝑑𝑎𝑎𝑛𝑛𝑑𝑑 Equation 2-11
c Specific heat of the motor winding
w Weight of the motor winding metal
T Temperature of the winding
R Electrical resistance of the winding
Ieq Stator current adjusted for negative sequence
q Heat flow
k Damage time
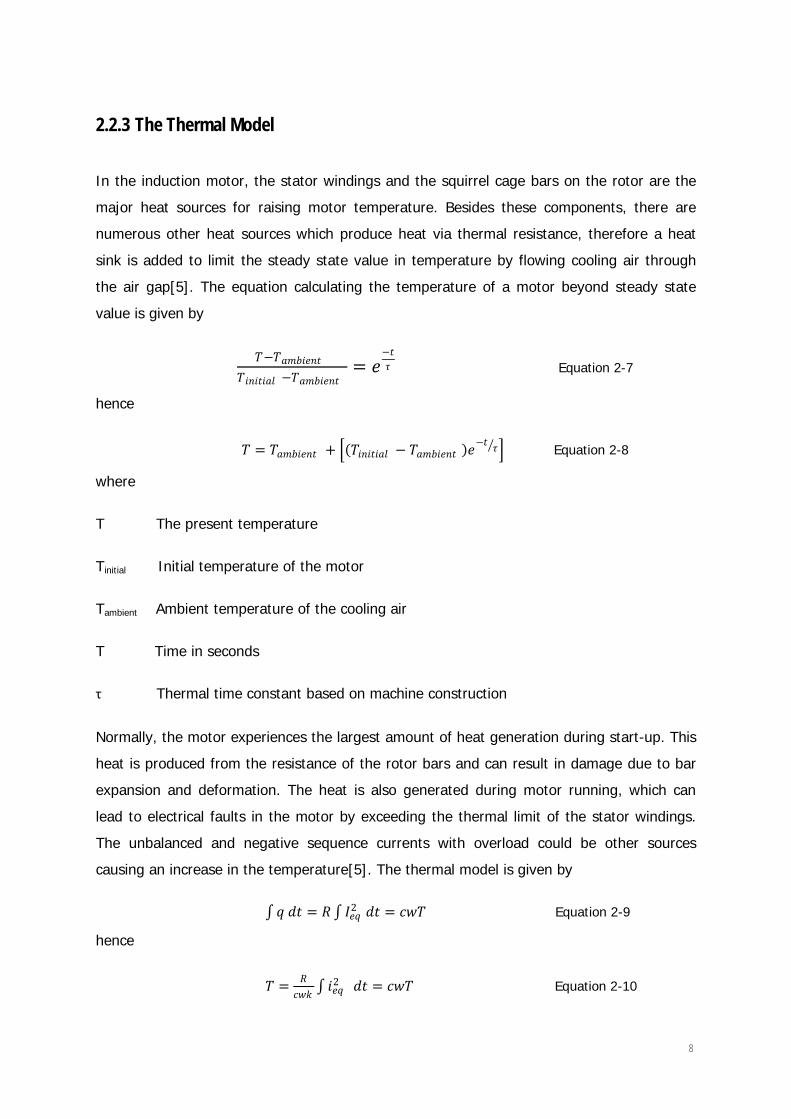
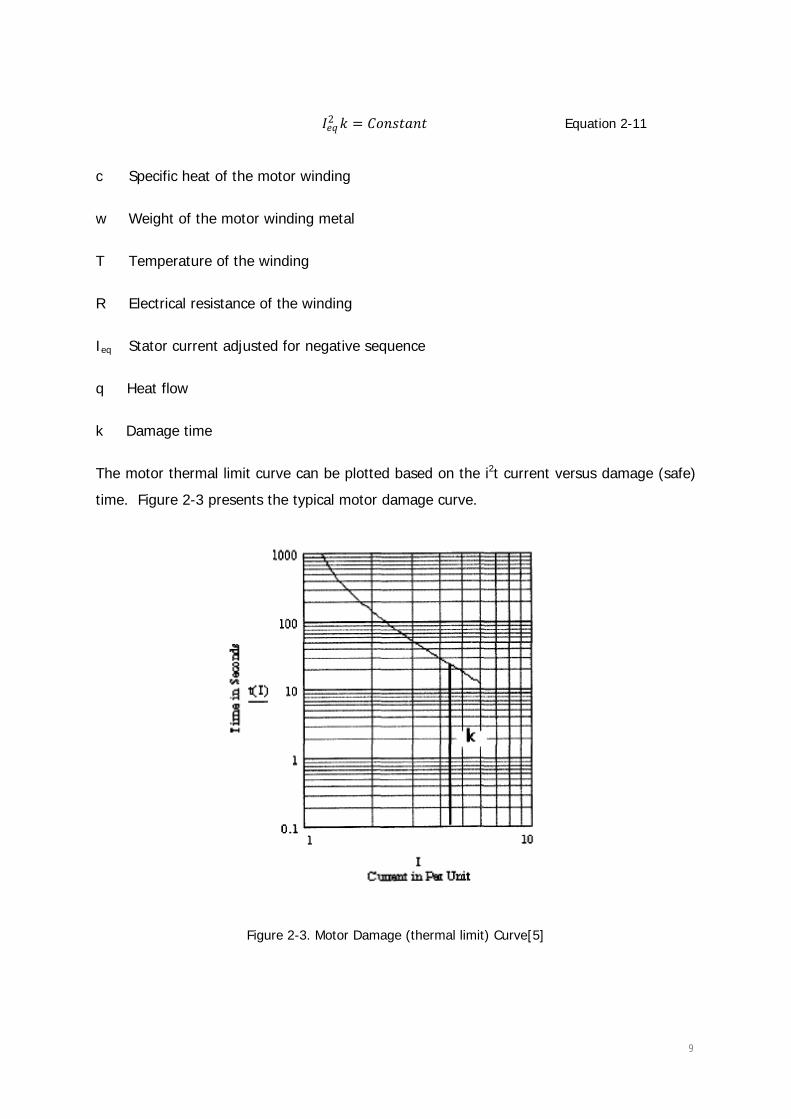
The motor thermal limit curve can be plotted based on the i2t current versus damage (safe)
time. Figure 2-3 presents the typical motor damage curve.
Figure 2-3. Motor Damage (thermal limit) Curve[5]

1 0
2.3 Characteristic Curve of Induction motor The speed-torque characteristic curve is used to express the relation between torque and
the speed that varies from zero to synchronous speed for the motor. In this plot,
breakdown, pull up and locked-rotor torques are indicated[6].
To draw the relationship between torque and speed, an examination of the motor’s
magnetic field behaviour is the first step. The equation for the induced torque will be
defined with the magnetic fields in an induction motor[3].
Bnet Net magnetic field
IM Magnetization current
E1 Voltage
ER Voltage induced in the bars of the rotor
IR Current
BR Magnetic field in the rotor
Bs Magnetic field in the stator
τind induced torque
ER IR
Bs Bnet
Rotor
IR ER
Rotor
Bs Bnet
BR
θ

1 1
Figure 2-4. (a) The magnetic behaviour with light loads. (b) The magnetic behaviour with heavy loads[3]
At no load, an induction motor is operating at synchronous speed and the rotor slip and the
frequency are both very small. Hence, there would be small relative motion between the
rotor and the magnetic field. This causes not only a small voltage ER induced in the bars of
the rotor but also a small current flow IR. Since the frequency is small, the rotor current and
the voltage will be almost in the same phase. Thus, the rotor current will result in a small
magnetic field BR slightly over 90o from net magnetic field Bnet. Figure 2-4 (a) shows the
reason that the induction motor has no-currents under no loads. Now, the induction motor
under heavy loads is considered. Obviously, the rotor speed decreases and slip goes up.
Since the relative motion between the rotor and the stator magnetic fields increases, it
induces large rotor voltage ER which results a large rotor current IR. With the large reactance
from large rotor frequency, the rotor voltage ER leads to a rotor current with large angle.
Hence, the rotor magnetic field BR will move back with the rotor current IR (BR ⊥IR).
Although the rising BR induces a large torque, an angle δ over 90o results in a decrease in
torque. Figure 2-4 (b) shows the magnetic fields under heavy loads. This explains why the
motor stops when an induction motor reaches pullout torque where the Sinδ falls more than
the increase in the BR. With the magnetic field’s behaviour in the induction motor under
various loads, the equation for the induced torque and the torque-speed characteristic curve
can be derived as follow[3].
𝝉𝝉𝒊𝒊𝒊𝒊𝒊𝒊 = 𝒌𝒌𝑩𝑩𝑹𝑹𝑩𝑩𝒊𝒊𝒏𝒏𝒏𝒏 𝒔𝒔𝒊𝒊𝒊𝒊 𝜹𝜹 Equation 2-12
The torque-speed curve can be separated into three parts. The first part is the high speed
(low slip) part. This part includes the range between no load and full load speed where the
torque linearly rises with increase in slip, and speed falls linearly with increase in load. In this
high speed region, power factor Cosθ is almost unity. For this reason, this region is known
1 2
as normal steady-state operating range of an induction motor. The second part is the
moderate speed part. In this part, the rotor reactance can not be neglected due to the
increasing frequency and power factor is decreasing (Cosθ<1). The last part is the low
speed part. The torque starts decreasing as load increases.
Normally, the starting torque is 150% of the full load torque and the pullout torque is 200%-
250% of the full load torque of the induction motor[3] .
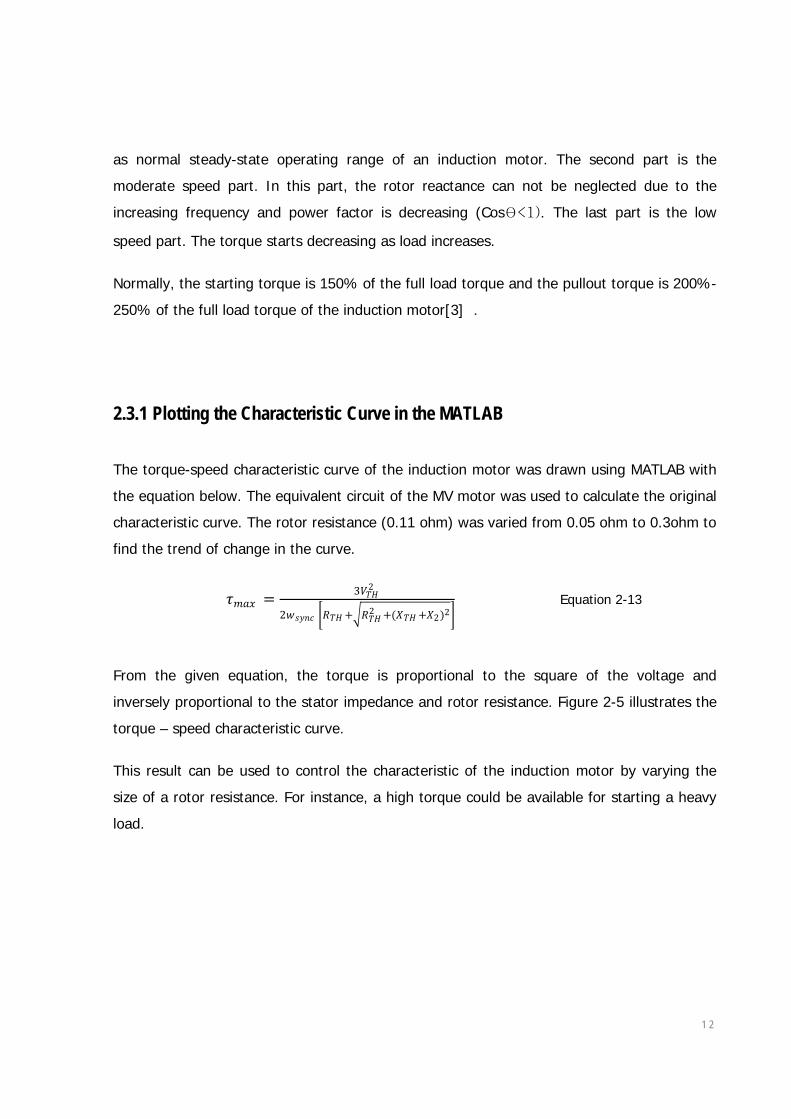
2.3.1 Plotting the Characteristic Curve in the MATLAB
The torque-speed characteristic curve of the induction motor was drawn using MATLAB with
the equation below. The equivalent circuit of the MV motor was used to calculate the original
characteristic curve. The rotor resistance (0.11 ohm) was varied from 0.05 ohm to 0.3ohm to
find the trend of change in the curve.
𝜏𝜏𝑚𝑚𝑎𝑎𝑚𝑚 = 3𝑉𝑉𝑇𝑇𝑇𝑇2
2𝑑𝑑𝑠𝑠𝑠𝑠𝑛𝑛𝑠𝑠 �𝑅𝑅𝑇𝑇𝑇𝑇 +�𝑅𝑅𝑇𝑇𝑇𝑇2 +(𝑋𝑋𝑇𝑇𝑇𝑇 +𝑋𝑋2)2�
Equation 2-13
From the given equation, the torque is proportional to the square of the voltage and
inversely proportional to the stator impedance and rotor resistance. Figure 2-5 illustrates the
torque – speed characteristic curve.
This result can be used to control the characteristic of the induction motor by varying the
size of a rotor resistance. For instance, a high torque could be available for starting a heavy
load.

1 3
Figure 2-5. Electromechanical Torque vs. Speed for the Rotor Resistance.
2.4 Commercial Induction Motor Data Analysis This section will discuss and analyse the induction motor data provided by a manufacturer. It
is one of the crucial steps for motor protection, since protection strategies completely rely on
the specific motor. For instance, selection of a protection relay depends on the type of the
induction motor, and setting the parameters for the protection relay are based on the motor
data. For the further steps, the commercial induction motors which will be used in this thesis
are taken as examples.
2.4.1 Estimating the Induction Motor Data
For the motor and generator manufacture industry, NEMA (The National Electrical
Manufacturers Association) is well known for as standards and guideline publications. The
Condensed MG 1-2007 (NEMA) consists of condensed information for the AC induction

1 4
motor. Under this standard, the manufacturer provides a motor data sheet including
sufficient information for the protection engineer. It is very important to have exact and
sufficient information about the motor, because this will affect the accuracy of the motor
protection. For instance, the thermal limit curve, which determines the protection scheme, is
drawn from motor data information.
In this thesis, the LV TEFC and MV WIIP induction motor are modelled and protected. Table
2-2, Table 2-3 and Table 2-4 list the information necessary for complete a motor protection.
LV induction motor: NEMA 460HP, 400V, 49.4A, 4P, 1.15 SF induction motor
MV induction motor: NEMA 1500HP, 4000V, 2P, 187A induction motor
Table 2-2. LV Induction Motor Data Sheet
Low Voltage Induction Motor Data Rated Horse Power HP 40 HP
Rated Voltage nV 460 V Number of Pole #P 4 P
Full Load Current FLA 49.4 amps Locked Rotor Current LRA 275.3 amps Rate Service Factor SF 1.15 SF
Hot Safe Stall Time at 100% volts 44 s
Table 2-3. MV Induction Motor Data Sheet 1
Medium Voltage Induction Motor Data Rated Horse Power HP 1500 HP
Rated Voltage nV 4000 V Rated Current nA 187 amps
Number of Pole #P 2

1 5
Table 2-4. MV Induction Motor Data Sheet (cont’)
Starting and Thermal Limit Characteristics for MV Induction motor Stator Damage Point Current (A p.u) Time(sec.)
1.55 1000 1.8 400 2.82 100
Rotor Damage Points at 100% Voltage 5.2 30 6 25 6.6 12
Rotor Damage Points at 90% Voltage 3.9 50 5.2 30 5.6 15
Rotor Damage Points at 80% Voltage 3 85 3.9 50 4.2 25
Accelerating Time Voltage (%) Time(sec.) 100 6 90 8.4 80 14
2.4.2 Motor Thermal Limit Curve
The thermal limit curve provides the safe operating time of the machine without damage
from over-temperature in the machine. It could be a continuous curve or a set of
discontinuous curves in safe time versus current in the windings (rotor or stator). The
temperatures in the rotor and stator can be exceeded for several reasons. The major
reasons are as follows[7]:
1. Under locked rotor condition, it could happen when motor has low starting voltage.
2. Under fail to start or accelerate.
3. Under continuous overloaded condition at operating speed.
Under these conditions, the current can rise from 4 to 8 times the rated full-load current.
This causes power loss from 16 to 64 times the rated power loss (p=I2r).
1 6
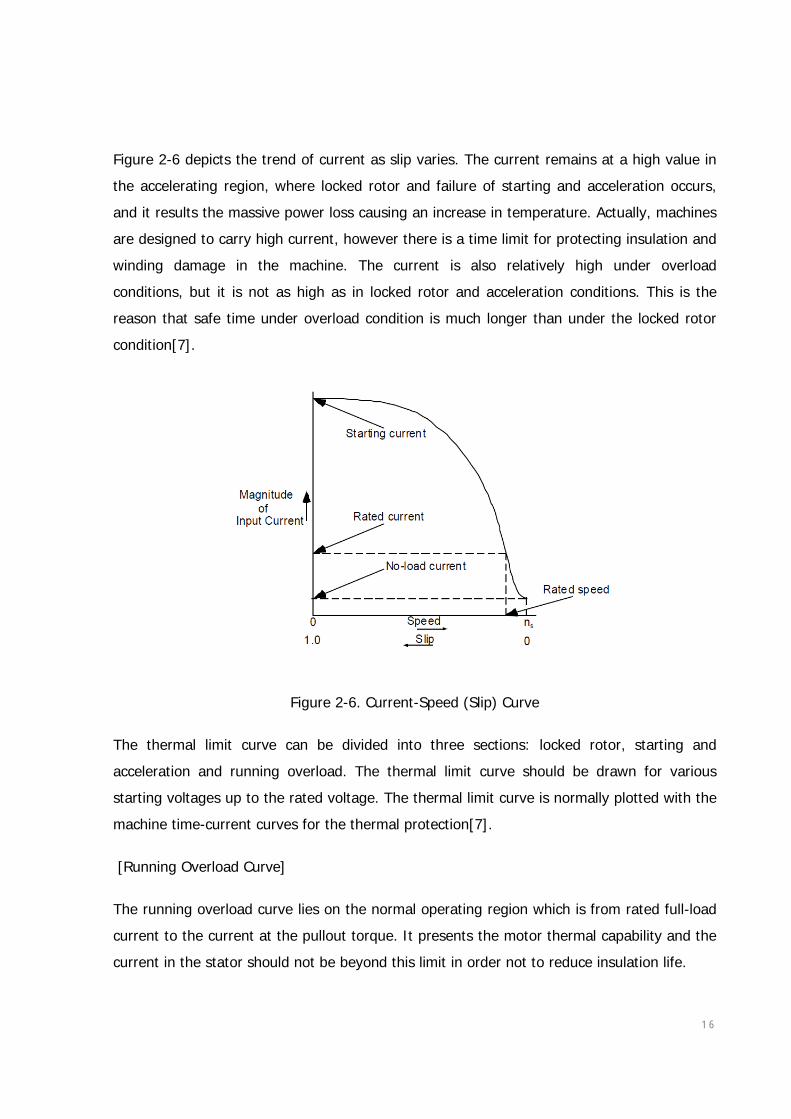
Figure 2-6 depicts the trend of current as slip varies. The current remains at a high value in
the accelerating region, where locked rotor and failure of starting and acceleration occurs,
and it results the massive power loss causing an increase in temperature. Actually, machines
are designed to carry high current, however there is a time limit for protecting insulation and
winding damage in the machine. The current is also relatively high under overload
conditions, but it is not as high as in locked rotor and acceleration conditions. This is the
reason that safe time under overload condition is much longer than under the locked rotor
condition[7].
Figure 2-6. Current-Speed (Slip) Curve
The thermal limit curve can be divided into three sections: locked rotor, starting and
acceleration and running overload. The thermal limit curve should be drawn for various
starting voltages up to the rated voltage. The thermal limit curve is normally plotted with the
machine time-current curves for the thermal protection[7].
[Running Overload Curve]
The running overload curve lies on the normal operating region which is from rated full-load
current to the current at the pullout torque. It presents the motor thermal capability and the
current in the stator should not be beyond this limit in order not to reduce insulation life.

1 7
[Accelerating Curve (Time-Current Curve in the Figure)]
The accelerating curve presents the characteristic curve of a motor on current versus time
axis. The curve lies from the starting current to the current at the pullout torque. The
accelerating curve can be specified depending on voltage level. Therefore, the corresponding
curve must be used.
[Accelerating Thermal Limit Curve]
The accelerating thermal limit curve lies from the current at pullout torque to the locked
rotor current. Normally it is provided for medium-voltage motors.
[Locked Rotor Thermal limit Curve]
The locked rotor thermal limit presents the thermal capability of the motor while the machine
can remain in locked rotor condition without damage. This curve can be draw by connecting
the safe stall points given for various voltage levels. It is also provided for medium-voltage
motors.
[Safe Stall Point]
The safe stall points are the maximum times the motor can stay in locked rotor condition
without damage. It is normally provided for low-voltage motors[7].
It must be stated that the thermal limit curve should never be used as a base for thermal
motor protection. The span of motor life will decrease as operating conditions beyond the
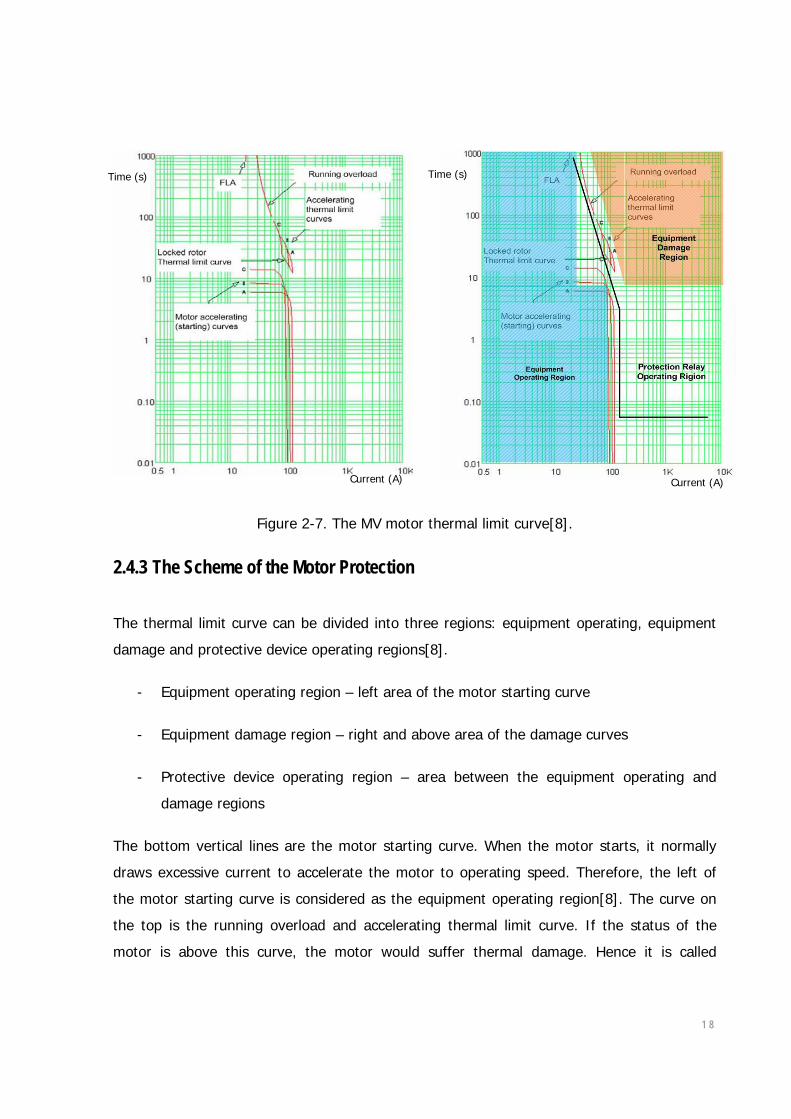
thermal limit are repeated. Figure 2-7 illustrates the thermal limit curve for the MV motor.
1 8
Figure 2-7. The MV motor thermal limit curve[8].
2.4.3 The Scheme of the Motor Protection
The thermal limit curve can be divided into three regions: equipment operating, equipment
damage and protective device operating regions[8].
- Equipment operating region – left area of the motor starting curve
- Equipment damage region – right and above area of the damage curves
- Protective device operating region – area between the equipment operating and
damage regions
The bottom vertical lines are the motor starting curve. When the motor starts, it normally
draws excessive current to accelerate the motor to operating speed. Therefore, the left of
the motor starting curve is considered as the equipment operating region[8]. The curve on
the top is the running overload and accelerating thermal limit curve. If the status of the
motor is above this curve, the motor would suffer thermal damage. Hence it is called
Time (s) Time (s)
Current (A) Current (A)

1 9
equipment (motor) damage region. On the basis of this knowledge, the characteristic curve
of the relay is suggested to be set above the motor starting curve and below the damage
curve[8]. This protection scheme allows the motor to start and it will protect the motor from
thermal damage by letting the relay trip the circuit breaker.
2.5 Modelling Induction motor in PowerFactory In PowerFactory, motors can be modelled in two ways: (1) by entering the resistances and
reactances of the motor’s equivalent circuit or (2) by drawing characteristic curves (the slip-
torque and slip-current) with the value of the torque at stalling point and stator reactance.
The latter method was used due to the lack of detailed information on the motors. When the
values are entered, PowerFactory automatically calculates the parameters of the equivalent
circuit diagram. The motor characteristic curves, including starting and locked rotor curves,
can be drawn based on the modelled motors. The motor characteristic curves provided by
the manufacturers will be drawn on the same graph to ensure the accuracy of the motor in
PowerFactory. This is because modelling the accurate motor with sufficient information is
crucial for motor protection.
2.5.1 LV Induction Motor
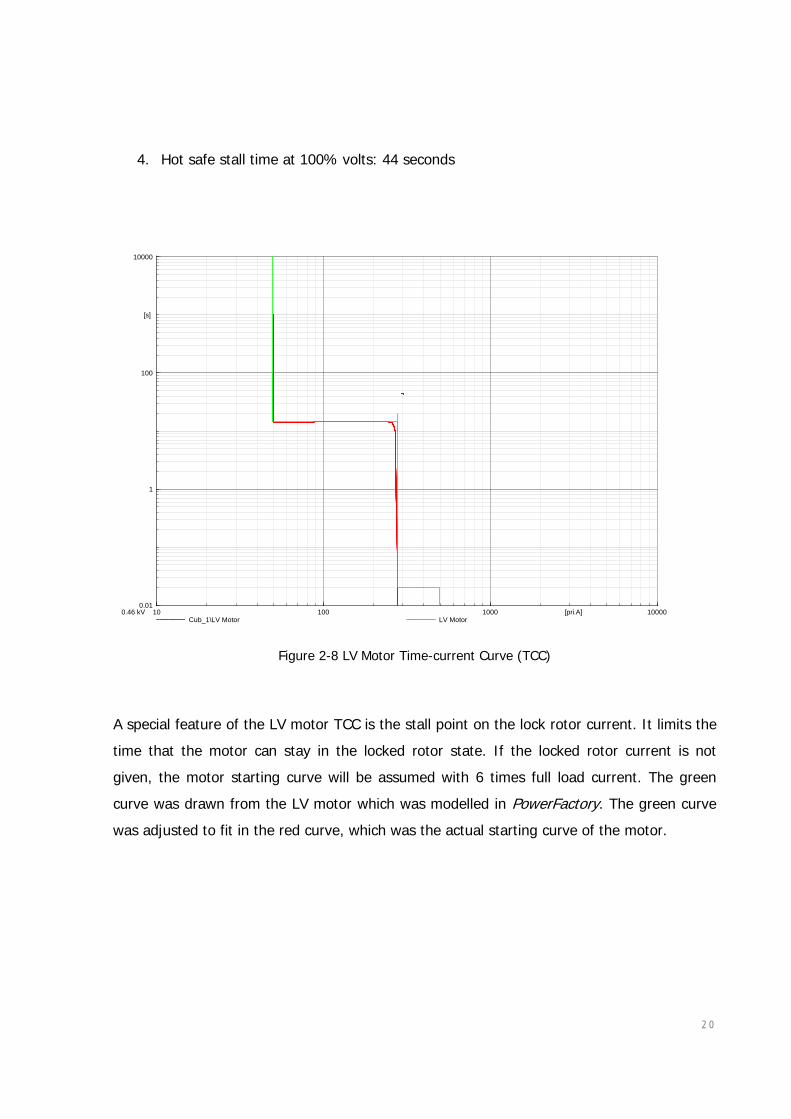
Typically, the thermal curve of the LV induction motor consists of the starting curve and the
rotor safe stall time. The thermal curve was drawn with the four points taken from the
Figure 2-8.
1. Full load amp: 49.4A
2. Lock rotor amp:275.3A
3. Acceleration time with maximum load inertia at 100% volts: 14 seconds
2 0
4. Hot safe stall time at 100% volts: 44 seconds
Figure 2-8 LV Motor Time-current Curve (TCC)
A special feature of the LV motor TCC is the stall point on the lock rotor current. It limits the
time that the motor can stay in the locked rotor state. If the locked rotor current is not
given, the motor starting curve will be assumed with 6 times full load current. The green
curve was drawn from the LV motor which was modelled in PowerFactory. The green curve
was adjusted to fit in the red curve, which was the actual starting curve of the motor.
10 100 1000 10000[pri.A]0.01
1
100
10000
[s]
0.46 kV Cub_1\LV Motor LV Motor
2 1
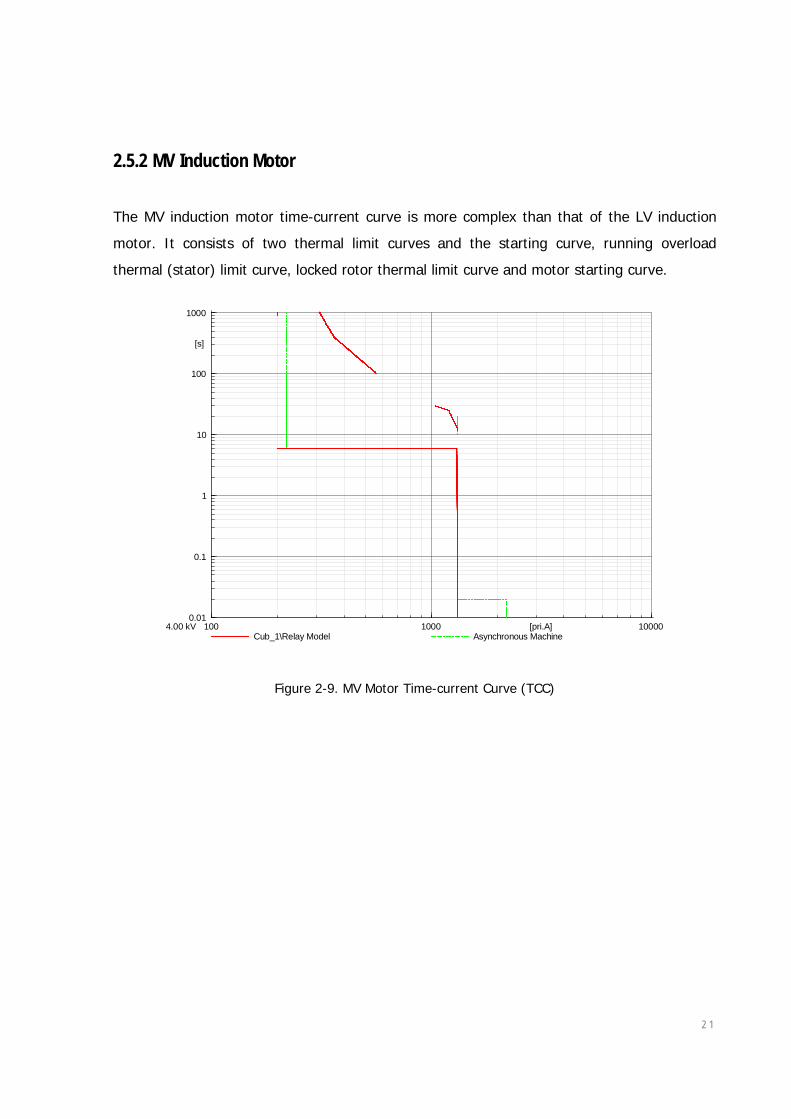
2.5.2 MV Induction Motor
The MV induction motor time-current curve is more complex than that of the LV induction
motor. It consists of two thermal limit curves and the starting curve, running overload
thermal (stator) limit curve, locked rotor thermal limit curve and motor starting curve.
Figure 2-9. MV Motor Time-current Curve (TCC)
100 1000 10000[pri.A]0.01
0.1
1
10
100
1000
[s]
4.00 kV Cub_1\Relay Model Asynchronous Machine

2 2
3 Induction Motor Protection
3.1 Motor Protection Requirements and Solutions with Protection relay 3.1.1 Pullout (Starting and Stalling) Protection
When an induction motor stalls its speed falls to zero, or stays below the rated speed, and
the input motor current quickly increases up to locked rotor current. This occurs when the
load torque is higher than the pullout torque. Relays can be used to protect the induction
motor from stalling by installing an instantaneous relay connected in the secondary winding
of a current transformer.[9]
3.1.2 Stator Winding Protection
A motor’s life may depend on the condition of the electrical insulating system of the stator
winding. The deterioration of the winding is caused by many factors including moisture,
excessive current and mechanical or thermal damage. From tests results, it is known that
each 10oC increase over the winding thermal limit temperature halves its life and a 10oC
decrease doubles its life. Hence, the plan for stator winding protection is to remove the
causes which increase the temperature above the thermal limit[9]. The factors which cause
rise in stator temperature are listed below:
1. Motor overloading
2. Inadequate ventilation
3. Unusual ambient conditions
4. High and low voltage and frequency
5. Locked rotor or failure to accelerate.
2 3
6. Frequent starting or intermittent operation
3.1.3 Rotor Thermal Protection
The damper winding of an induction motor is in responsible for starting the load. When it is
damaged by thermal stress the physical characteristics of the motor will be changed.
Frequently, the rotor has thermal damage due to the negative sequence current while it
runs. The negative sequence is caused by the high temperature in the rotor and it results in
long accelerating time because of the lack of starting torque[10].
3.1.4 Overload Protection
For the various duties required by industry, a motor may not meet the requirements with the
given motor characteristics. Frequently, a motor will experience overload conditions. Under
overload, there would be damage to the motors, the motor-control apparatus and the
conductor due to the excessive heat. Overload protection types can be classified according to
load types. For a motor used for a fluctuating load, the relay should not be too sensitive and
should leave the motor running. Hence the relay is designed to allow the motor to run as
long as possible. In contrast, in motors used for steady loads, relays must be able to trip the
motor as quickly as possible[10].
3.1.5 Stator Fault Protection
The stator fault protection device is chosen based on the type and location of the fault in the
motor winding. The relay has to be able to distinguish faults from the motor starting and
load current in a low impedance system.

2 4
3.1.6 Abnormal Voltage Protection
A motor is normally allowed to operate with a ±10% variation from normal voltage. If the
operating voltage is beyond the limit of the operation range it will result in the increase in
the magnetising current and a drop in the power factor. Major effects of abnormal voltage
condition are decreases in the current and torque in the motor, since these effects result in
heat generation, causing damage to the motor[4].
Voltage protection can be categorised on the basis of the types of abnormal input voltage
condition: undervoltage, overvoltage and unbalanced voltage[10] .
For undervoltage, the motor may fail to reach the rated speed. Low input voltage draws a
higher current than rated operating current and results in excessive heat in the stator
windings and the rotor. However, voltage dips over a short time are usually permissible in
the motor. Hence the protection relay must allow these dips in order to prevent the
interruption of the process[10].
Overvoltage in the motor results in heat generation due to losses in the conductors of the
motor. For overvoltage protection, a sensor for measuring the winding temperature is
necessary[10].
The major cause of unbalanced voltages is an open circuit in any phase. Under an
unbalanced condition, a negative sequence current is produced while the positive current
remains, and the total current increases about 1.7 times over the previous load current.

2 5
3.2 Protection Devices for Induction motors
A number of protection devices are available for induction motors. They are described in the
following section.
Device 50G – Ground Instantaneous Overcurrent
Device 50G provides detection of the ground faults with fast operation. It is connected in the
transformer around the three phase line to the motor so that it only operates for the ground
fault due to cancellation of other current sources[10].
Device 50 – Phase Instantaneous Overcurrent (IOC)
The Phase Instantaneous Overcurrent provides protection for faults not only on the supply
conductor but also in the stator. However, it may not be available when the starting peak
current exceeds the pickup current. In this case it can be used to alarm the system[10].
Device 51 – Phase Time Overcurrent (TOC)
The Phase Time Overcurrent device can provide more sensitive protection by coordinating
with motor starting and thermal limit curves so that the protection relay can overcome the
limit of IOC. For advanced protection, TOC is applied under monitoring from IOC in which if
a large magnitude fault occurs, TOC can screen undesired trips due to accelerating in a
motor[10].
Device 27 – undervoltage
In case of an instantaneous relay type, the relay will have options for adjustable time delay
and drop-out. When the relay detects a voltage under drop-out voltage by about 80% of the
normal voltage, the relay trips the motor after a short time delay of about 2-3s to allow for
momentary dips[10].
2 6
Device 46 – Phase balance relay and negative-sequence current relay
The phase balance relay operates when a phase current is larger than a setpoint of the
current in the relay. It may have a short time delay to prevent frequent tripping due to
disturbances which can be removed during short clearing time. The best relay for the
unbalanced circuit is a negative-sequence current relay since it directly measures the
negative-sequence current due to an unbalanced circuit. It must work with time delay due to
its high sensitivity[10].
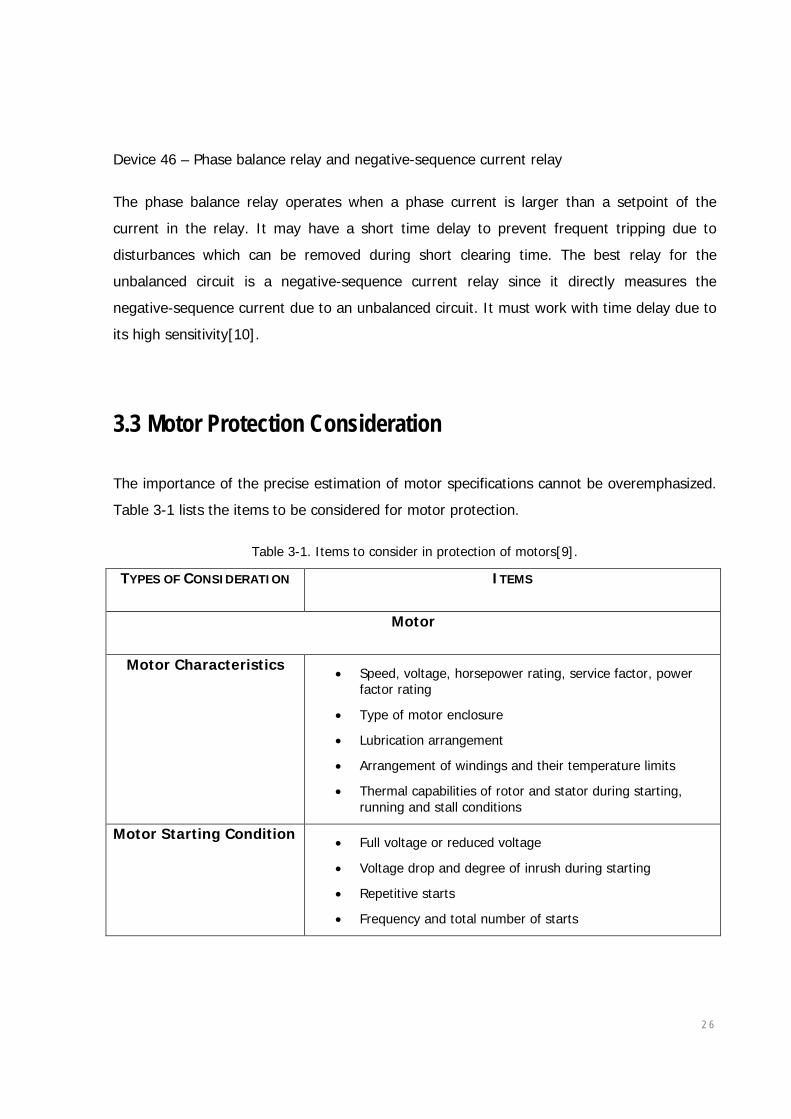
3.3 Motor Protection Consideration The importance of the precise estimation of motor specifications cannot be overemphasized.
Table 3-1 lists the items to be considered for motor protection.
Table 3-1. Items to consider in protection of motors[9].
TYPES OF CONSIDERATION ITEMS
Motor
Motor Characteristics • Speed, voltage, horsepower rating, service factor, power
factor rating
• Type of motor enclosure
• Lubrication arrangement
• Arrangement of windings and their temperature limits
• Thermal capabilities of rotor and stator during starting, running and stall conditions
Motor Starting Condition • Full voltage or reduced voltage
• Voltage drop and degree of inrush during starting
• Repetitive starts
• Frequency and total number of starts

2 7
TYPES OF CONSIDERATION ITEMS
MOTOR IMPORTANCE • Motor cost
• cost of unplanned down time
• amount of maintenance and operating supervision to be provided to motor
• ease and cost of repair
Ambient Conditions
• Temperature maxima and minima
• Elevation
• adjacent heat sources
• ventilation arrangements
• exposure to water and chemicals
• exposure to rodents and various weather and flood conditions
Power System
• Types of system grounding
• exposure to lightning and switching surges
• fault capacity
• exposure to automatic reclosing or transfer
• possibilities of single-phasing supply
• other loads that can cause voltage unbalance
2 8
4 Off-line Testing of the SEL701 with PowerFactory
4.1 Assumptions for modelling the motor protection relay Most of the induction motors in industry do not run under the full complement of protection
requirements in the relay. This is because relays with only selected protection elements are
adequate to run many motors in use today.
• It is assumed that a timer is used to avoid the relay tripping during starting. Hence
the initial condition is steady state.
• The RTD function is not considered here.
• Frequency protection is not considered here.
4.2 Reasons for protection relay modelling and simulation Modelling and simulation of relays have an important place in the proper operation of power
networks as protection relays are operating in entire power systems to ensure safe and
efficient power networks. For the proper operation of relays, the calculation of relay settings
and configurations must be carried out properly, or relays with wrong settings could disturb
power systems under normal operating conditions.[11]
For this reason, simulation can be used to ensure the proper settings of relays before their
application in real systems. Simulation is also used to analyse relays which mis-operate. The
abilities of relay can be obtained by plotting time over-current and dynamic transient graphs
which show protection scheme and relay response in the time domain. Simulation must
reflect the real system with the same features of devices, otherwise it would be meaningless.
In Chapter 2, the single line diagram for a protection network was modelled. This chapter
presents the procedure for modelling the relay and simulating the protection network with
events.

2 9
4.3 Introduction and Application of SEL 701 Relay
According to the catalogue provided from Schweitzer Engineering
Laboratories.
“The SEL-701 Motor Protection Relay is designed to protect three-phase,
medium voltage motors. The basic relay provides locked rotor, overload,
unbalance, and short-circuit protection functions. You can select options that
add voltage-based and RTD-based protection and monitoring capabilities[12]. ”
Figure 4-1. SEL-701 Relay Functional Graphical Description[12]
The SEL-701 Relay offers a full range of elements for motor protection, including:
• Three options of the setting for motor thermal elements (49) are provided for locked
rotor, running overload, unbalanced current/negative-sequence current heating, and
repeated or frequent starts.
• The instantaneous protection elements (50) of phase, neutral, residual, and negative-
sequence are offered for tripping due to motor or cable short circuits.
• Load-loss and load-jam protection
3 0
• Unbalanced current (46) element and phase reversal (47) element protection
• Flexible voltage inputs are available to provide voltage-based protection and metering
functions including under/over voltage elements, loss-of-potential (LOP) elements,
underfrequency elements, underpower elements, reactive power elements, power
factor elements, plus power and energy metering.
4.4 Modelling and Setting Setpoints of SEL 701 Relay The technical reference for modelling the relay in PowerFactory is presented in the Appendix.
4.4.1 Current and Voltage Transformers (CT, GT and VT)
The CT Ratio settings are used for scale-measured values and report the primary quantities
to relays. Typically, phase CT ratio is chosen equal to the motor full load current or about
two-thirds greater among the given standard setting range from the CT. For accurate relay
performance, the CT should not saturate when the induction motor is under the worst
conditions such as motor starting or locked rotor.
There are two ways that IN, neutral current, input can enter the relay. The IN can enter the
relay residually. The other method is using separate ground CT, which provides high
sensitivity to the faults. Typically the latter method is preferred because the first method
may have different saturation of the CT and have undesired tripping due to the wrong
residual current[9]. In this thesis, the latter method was applied by using similar setting
calculations with the phase CT setting. Figure 4-3 presents the wiring diagram for CT for
phase and ground.
A voltage transformer provides the same function with CT as it steps down the voltage to
make it available for a relay. The primary voltage is normally set to the voltage of the system
and the secondary voltage is most often set to 120V/240V. [5]

3 1
Table 4-1. CT ratio and VT ratio
Type of Motor LV MV
Phase CT 50/1 200/1
Ground CT 50/1 200/1
Phase VT 460/120 4000/240
Figure 4-2. CT Setting for Phase and Ground
Figure 4-3. The AC Wiring Diagram, four-wire Wye Voltage and Ground CT
3 2
4.4.2 Thermal Protection Element (49)
The thermal protection in the SEL-701 Relay motor can be used to protect the following
motor operating condition:.
• Locked Rotor Starts
• Running Overload
• Unbalance Current/Negative-Sequence Current Heating
• Repeated or frequent Starting
The SEL-701 relay motor thermal element can be set using four methods: rating setting
method, generic setting method, user setting method and off. Each method works with a trip
value defined by the relay settings and calculates a present heat according to changing
motor current versus time. In this thesis, the generic setting method was applied.
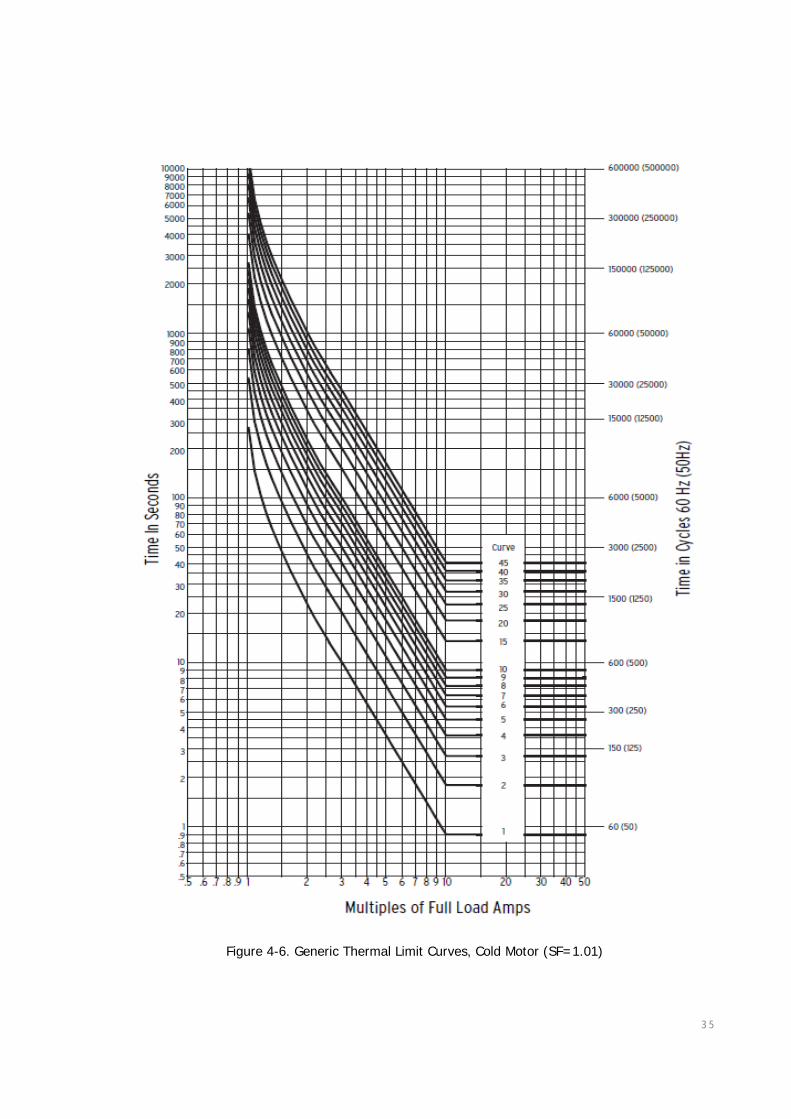
The generic setting method provides the 1-45 standard motor overload curves. Figure 4-6
shows the cold standard curves thermal limit time versus multiples of full load current. For
the hot motor curve, all curves shift by 2.1 seconds at each six times full load current. The
first step in modelling the thermal relay was designing 1-45 curves in PowerFactory and
testing them to ensure matching to the given standard curves.

3 3
Figure 4-4. Curves 1, 10, 20, 30 and 40 in PowerFactory
Figure 4-4 above shows the designed Curves in Powerfactory. Curves 1-45 were designed
from the trip time table provided by the manufacturer (see Appendix).
The appropriate curve number among curves 1-45 was set based on hot initial temperature.
The thermal relay is designed to allow the motor to carry overload at a certain amount and
duration that will not damage the motor[10]. Therefore, the pickup current is normally set at
115%-125% of FLA in relays that have adjustable pickup current. In the case of the SEL701
relay, the minimum relay trip value is fixed. Hence the curve which is closest to the motor
running thermal curve was selected.
For the LV motor, the thermal curve number was determined with the given motor data
sheet by applying the equation below. The number of curves under hot conditions will be
approximately half of the number under cold conditions[12].
𝐶𝐶𝐶𝐶𝐶𝐶𝑣𝑣𝑒𝑒 = 𝑆𝑆𝑎𝑎𝑓𝑓𝑒𝑒 𝑆𝑆𝑑𝑑𝑎𝑎𝑠𝑠𝑠𝑠 𝑇𝑇𝑖𝑖𝑚𝑚𝑒𝑒 ,𝑇𝑇𝐶𝐶𝑑𝑑 (𝑠𝑠𝑒𝑒𝑠𝑠𝐶𝐶𝑛𝑛𝑖𝑖𝑠𝑠 )2.1 𝑠𝑠𝑒𝑒𝑠𝑠𝐶𝐶𝑛𝑛𝑖𝑖𝑠𝑠
Equation 4-1
3 4
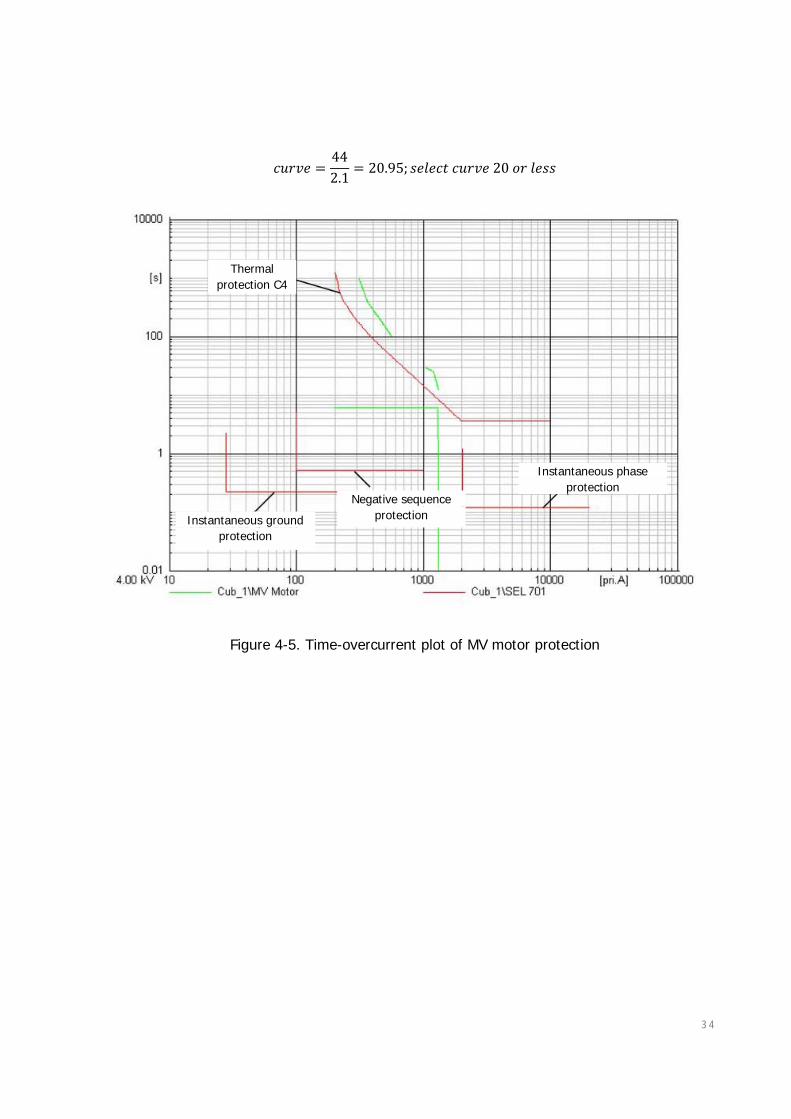
𝑠𝑠𝐶𝐶𝐶𝐶𝑣𝑣𝑒𝑒 =442.1
= 20.95; 𝑠𝑠𝑒𝑒𝑠𝑠𝑒𝑒𝑠𝑠𝑑𝑑 𝑠𝑠𝐶𝐶𝐶𝐶𝑣𝑣𝑒𝑒 20 𝐶𝐶𝐶𝐶 𝑠𝑠𝑒𝑒𝑠𝑠𝑠𝑠
Figure 4-5. Time-overcurrent plot of MV motor protection
Instantaneous phase protection
Instantaneous ground protection
Negative sequence protection
Thermal protection C4
3 5
Figure 4-6. Generic Thermal Limit Curves, Cold Motor (SF=1.01)
3 6
4.4.3 Instantaneous Protection Element (50P, 50N and 50Q)
An instantaneous element is normally applied with time delay and it operates like definite
time overcorrect element. It will trip the system when the current is larger than the pickup
current setting for longer than time delay setting. The instantaneous element on the time-
overcurrent plot looks like "L" so that it can detect the greater current than vertical line for
longer than the horizontal line.
In the SEL701 relay, two stages of instantaneous overcurrent(IOC) for phase and ground are
available for more sensitive protection. Since the IN input from the ground fault CT is
connected in the relay, two stages of the Neutral O/C were applied to detect the ground
fault.[12]
[Phase O/C Relay]
For IOC, there are two setting methods introduced by IEEE Std C37.96-2000 and IEEE Std
242-1986. From the IEEE Std C37.96-2000, IOC trip current can be set at 165%-187% of
locked rotor current. It shouldn’t be within the starting duration because IOC is considered to
trip higher currents than the starting current. In case of asymmetrical starting current, a
short time delay of approximately 6 to 15(0.3s) cycles can be applied for tripping. From IEEE
Std 242-1986, a trip current for small induction motor can be set at 10 or 11 times the motor
full load current, while a trip current can be set 75% above these values of maximum
symmetrical starting current.
Table 4-2. IOC 50P trip current setting in IEEE Std C37.96-2000 and IEEE Std 242-1986
IOC Setting LV Motor
(LRA=275.3A,FLA=49.4)
MV Motor
(LRA=1234A,FLA=187A)
IEEE Std C37.96-2000 𝐿𝐿𝑅𝑅𝐿𝐿 × 1.65𝑠𝑠.𝐶𝐶.50
= 9.08 𝑆𝑆𝑒𝑒𝑠𝑠.𝐿𝐿 𝐿𝐿𝑅𝑅𝐿𝐿 × 1.65𝑠𝑠.𝐶𝐶.
200= 10.18 𝑆𝑆𝑒𝑒𝑠𝑠.𝐿𝐿
IEEE Std 242-1986 𝐹𝐹𝐿𝐿𝐿𝐿 × 10𝑠𝑠.𝐶𝐶.50
= 9.88 𝑆𝑆𝑒𝑒𝑠𝑠.𝐿𝐿 𝐹𝐹𝐿𝐿𝐿𝐿 × 10𝑠𝑠.𝐶𝐶.
200= 9.35 𝑆𝑆𝑒𝑒𝑠𝑠.𝐿𝐿

3 7
It was found that the trip current calculated by the two methods were similar. IEEE Std
C37.96-2000 was applied with short time delay 0.1 to LV and MV motors.
Table 4-3. Overcurrent Element Settings[12]
[Neutral O/C Relay 50N]
The toroidal CT enveloping the three phase lines is used to detect the earth-fault current in
the system. The current through the toroidal CT is very small, hence a sensitive CT is
required to pick the lowest primary current. With the level 2 Neutral O/C relay, Long time
delay can be equipped to pick up the ground current[10].
3 8
[Negative-Seq O/C Relay 50Q]
In the SEL 701 relay, Negative-Sequence relay (50Q) in the form of instantaneous type is
used to take the place of phase unbalanced protection (46) to respond to the negative-
sequence current.
Typically, 15% of motor full-load current is recommended for pickup current against
negative-sequence component and time delay can be added to prevent undesired trips due
to unbalanced current during motor starting.
Figure 4-7. IOC 50Q tripcurrent setting in IEEE Std C37.96-2000
IOC Setting LV Motor
(LRA=275.3A,FLA=49.4)
MV Motor
(LRA=1234A,FLA=187A)
IEEE Std C37.96-2000 𝐹𝐹𝐿𝐿𝐿𝐿 × 0.15𝑠𝑠.𝐶𝐶.50
= 0.148 𝑆𝑆𝑒𝑒𝑠𝑠.𝐿𝐿 𝐹𝐹𝐿𝐿𝐿𝐿 × 0.15𝑠𝑠.𝐶𝐶.
200= 0.14 𝑆𝑆𝑒𝑒𝑠𝑠.𝐿𝐿
4.4.4 Overvoltage (59) and Undervoltage (27) Protection Element
SEL701 provides for two stages of Overvoltage and Undervoltage protection. Two stages of
protection can be coordinated for tripping, alarming, or supervision for another operation.
When it comes to voltage-based protection, it is important to ensure the type of input
voltage which depends on the system setting. The secondary input voltage type could be
line-line or line-ground voltages.
The relay is connected in the four-wire wye voltages and ground CT in order to protect the
phase-to-neutral and a residual overvoltage. [12]
3 9
[Overvoltage (59)]
The relay operates when the input voltage is several times greater than the pickup setpoint.
Instantaneous type element is often applied with short time delay to avoid frequent trippings
that are consequences of transient or swells in the system voltage. Normally, the pickup
voltage is set at 110% times of nominal voltage.[5]
[Undervoltage (27)]
Undervoltage element responds to the input voltage which remains lower than the pickup
setpoint for longer than the time delay setting. The pickup voltage for the undervoltage relay
is normally adjusted at 80% of normal voltage. Typically, a large drop in voltage occurs
during starting. Therefore, a relay may need to allow a motor to run during this period by
including a timer.[10]
Table 4-4. IOC 59 and 27 tripcurrent setting in IEEE Std C37.96-2000 and IEEE Std 242-1986
IOC Setting LV Motor (Vn=460V) MV Motor (Vn=4000V)
Overvoltage(59)
(IEEE Std C37.96-2000)
𝑉𝑉𝑛𝑛 × 1.1 𝑠𝑠. 𝐶𝐶.× 120460
= 132 𝑆𝑆𝑒𝑒𝑠𝑠.𝑉𝑉 𝑉𝑉𝑛𝑛 × 1.1 𝑠𝑠.𝐶𝐶.× 240
460= 264 𝑆𝑆𝑒𝑒𝑠𝑠.𝑉𝑉
Undervoltage(27)
(IEEE Std 242-1986)
𝑉𝑉𝑛𝑛 × 0.8 𝑠𝑠.𝐶𝐶.× 120460
= 96 𝑆𝑆𝑒𝑒𝑠𝑠.𝑉𝑉 𝑉𝑉𝑛𝑛 × 0.8 𝑠𝑠.𝐶𝐶.× 240
4000= 192 𝑆𝑆𝑒𝑒𝑠𝑠.𝑉𝑉
4.5 Testing the Relay with Events 4.5.1 Information Prior to the Testing
1) Time-Overcurrent Plot (x=Current and y=Time)

4 0
In the Time-Overcurrent plot, many features involved in protection relay analysis are drawn
together. The lists of the features are:
• The time-overcurrent characteristics of relays
• The damage curves of motor (Thermal limit curve)
• The motor starting curves
• The currents calculated by a short-circuit or load-flow analysis and the resulting
tripping times of the relays
• The trip time calculated by the protection relay algorithm
2) Transient Plot (x= Time and y=Output value)
• Starting signal (Pickup time): Starting signal starts at the time which is set in the
relay as pick up time when the input value to the relay is under the trip condition.
• Tripping signal (Time delay): Tripping signal starts with the amount of time after
starting signal starts.
• Measured value from CT or VT secondary part
EX) Input current > Setpoint then Trip time = Pickup time + Time delay
3) Guidelines of testing
• Ensuring that desired relay elements respond to faults
• Detect mis-operation of relay and change the settings

4 1
4.5.2 Balance and Unbalanced Thermal Overload
A thermal relay of the motor is used to detect the events which contribute to the increase in
temperature of the motor. Overload and unbalanced fault event are considered as the main
causes for thermal damage to the motor, hence the thermal relay was tested from events
that result in overload and unbalance faults. Overload can be induced by increasing the load
torque or decreasing the motor torque.
1) Overload
In PowerFactory, the active power was increased from 1.1185MW to 1.4MW, which caused a
increase in the loading from 94% to 135%. Under the overloaded system, a phase current
294.6 Pri.A was flowing in the system. The trip signal was sent to the breaker at 196.1 sec
because the measured current is greater than the pickup current of thermal protection.
These results are shown in Figure 4-8 below.
Figure 4-8. Current vs. Time regarding to loading condition
100 1000 10000[pri.A]0.01
1
100
10000
[s]
4.00 kV Cub_1\SEL 701 Cub_1\MV Motor
I =294.616 pri.A
196.159 s
4 2
2) Single phase to ground fault on the bus
To test the thermal protection element, a single phase to ground fault was applied in the
power system. The figure below shows the result. As the measured current was large
enough for instantaneous protection elements to trip, the system was tripped at 3.6 sec.
Actually, the system was tripped later than the 3.6sec because pickup starting was added.
Figure 4-9. Time – overcurrent plot with single phase to ground fault on the bus
4.5.3 Instantaneous Protection Element (50P and 50N)
As these two protections are instantaneous elements, trip times are less than 1sec. When
the relay detects the abnormal condition, the starting signal starts after a short time (the
pickup time). The final tripping signal will be sent to the breaker after a time delay plus the
pickup time.
100 1000 10000[pri.A]0.01
1
100
10000
[s]
4.00 kV Cub_1\MV Motor Cub_1\SEL 701
I =2005.233 pri.A
3.600 s
5.003.752.501.250.00 [s]
12.50
10.00
7.50
5.00
2.50
0.00
-2.50
SEL 701\Th: TrippingSEL 701\Th: Starting (OR)SEL 701\Th: Current A in sec.A
4 3
Figure 4-10. Time– overcurrent plot with two phases to ground fault on the bus
Figure 4-11. Time– overcurrent plot with single phase to ground fault on the bus
100 1000 10000 100000[pri.A]0.01
0.1
1
10
100
1000
[s]
4.00 kV Cub_1\MV Motor Cub_1\SEL 701
I =2371.478 pri.A
0.120 s
0.5000.3750.2500.1250.000 [s]
12.50
10.00
7.50
5.00
2.50
0.00
-2.50
SEL 701\50P1: TrippingSEL 701\50P1: Starting (OR)SEL 701\50P1: Current A in sec.A
100 1000 10000[pri.A]0.01
0.1
1
10
100
1000
[s]
4.00 kV Cub_1\SEL 701 Cub_1\MV Motor
X =2758.178 pri.A
0.510 s
1.000.750.500.250.00 [s]
12.50
10.00
7.50
5.00
2.50
0.00
-2.50
SEL 701\50N1: TrippingSEL 701\50N1: StartingSEL 701\50N1: Current in sec.A

4 4
10 100 1000 10000[pri.A]0.01
0.1
1
10
100
1000
[s]
4.00 kV Cub_1\MV Motor Cub_1\SEL 701
X =3071.484 pri.A
0.220 s
1.000.750.500.250.00 [s]
1.25
1.00
0.75
0.50
0.25
0.00
-0.25
SEL 701\50Q: TrippingSEL 701\50Q: Starting
DI
SIL
EN
4.5.4 Negative Sequence Current Relay Test
An unbalance relay should be able to detect and remove an unbalanced network caused by a
disconnection in one phase. The negative sequence current relay was used instead of
unbalance relay since negative sequence is produced in the event of unbalanced fault. The
negative sequence current relay was tested by implementing the fault on the two phases.
Figure 4-12. 2-Ph Fault Trip time in Time-overcurrent Plot

4 5
4.6 Case Study
1) Single Phase to Ground Fault on the LV motor
In the preceding section, only one protection element was tested at a time. In this section,
two case studies were implemented using a complete relay. Figure 4-13 shows the results of
single phase to ground fault on the LV motor. The complete relay can be depicted with the
two lines by linking the same type of relay. For instance, the upper line was attained by
connecting the thermal protection and instantaneous protection elements. From the test, two
currents constant lines were plotted to present the phase and ground current values.
Figure 4-13. Time-Overcurrent Plot of Single Phase to Ground Fault on 4kV with Relay in LV motor
10 100 1000 10000[pri.A]0.01
1
100
10000
[s]
0.46 kV Cub_1\LV Motor Cub_1\SEL 701
3*I0 =600.425 pri.A
0.040 s
I =316.907 pri.A
33.627 s

4 6
The phase current and ground current were calculated at I=316.9 Pri.A and Io=600.4 Pri.A
respectively. As phase current was greater than the pickup setting of thermal protection
element(49) and smaller than phase instantaneous element(50P), the trip time was
calculated from the thermal protection element. Trip signal was also sent to the breaker at
0.51sec which was calculated from the ground protection element.
2) Single Phase to Ground Fault on the MV motor
Figure 4-14. Time-Overcurrent Plot of Single Phase to Ground Fault on 4kV with Relay in MV motor
The phase current and ground current were calculated I=1415 Pri.A and Io=2327.5 Pri.A
respectively. The two trip signals were sent to the breaker at 7.229sec and 0.5sec.
Eventually, the system was tripped at 0.5sec by the ground protection element.
100 1000 10000 100000[pri.A]0.01
1
100
10000
[s]
4.00 kV Cub_1\MV Motor Cub_1\SEL 701
X =2327.502 pri.A
0.510 s
I =1415.731 pri.A
7.229 s

4 7
5 On-Line Testing of SEL701 Relay with Omicron
5.1 Advantage and Method of Testing Relay After verifying the relay off-line, on-line testing of the actual protection relay is required to
analyse the relay’s performance prior to applying the relay in a real power system. On-line
testing has several advantages. It is implemented to verify the relay developed in the
simulation environment, so that mis-operation of relay can be avoided by testing the relay
parameters[13]. The test is also implemented to check the accuracy of performance by
comparing the trip time from the expected time.
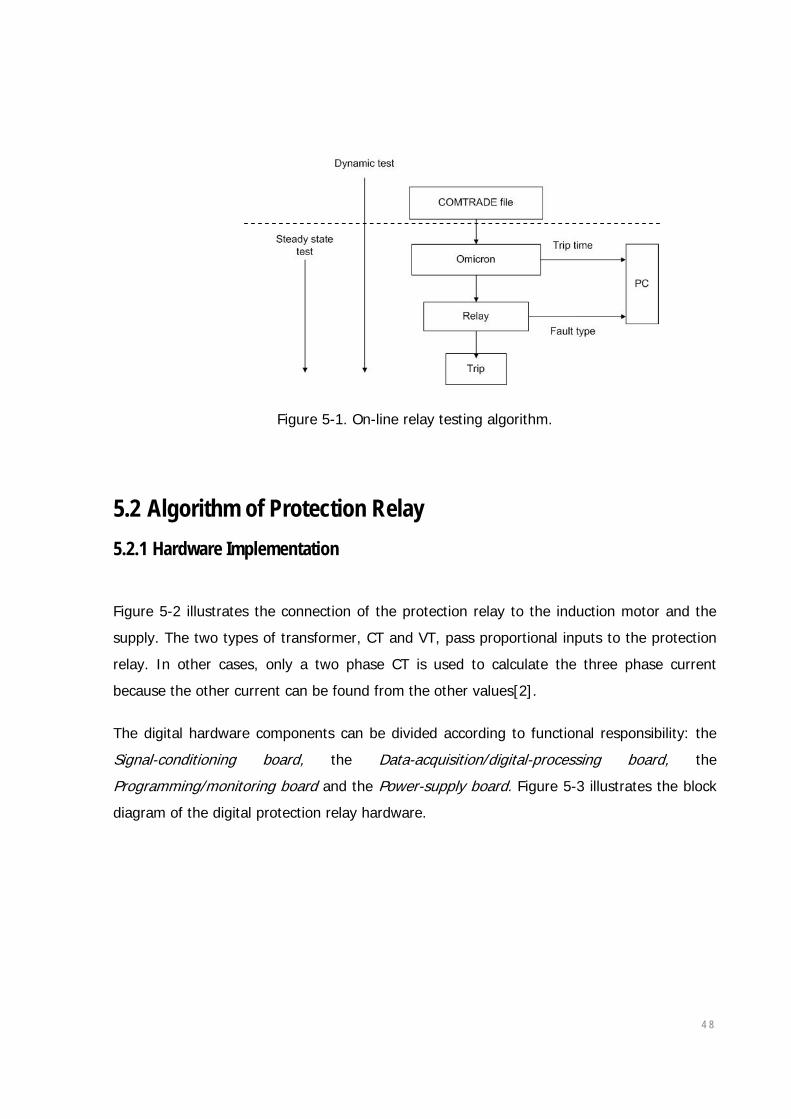
There are two types of on-line methods for testing the relay: steady state and dynamic tests.
1. Steady state test: This test result is less realistic than dynamic test since the input
does not include transient changes due to the fault condition. This method is useful
for testing the accuracy of measurement in the relay, such as Calibration and
Input/Output functionality.
2. Dynamic test: This test uses an input with transient changes based on real operating
conditions. It enables the engineer to prove relay operations based on true system
fault conditions. It is useful to test the transient performance of the relay. Recently,
test equipment has advanced a function which performs playbacks of transient data
using a test set[14]. The input signal, as a file in COMTRADE format, is injected into
the test equipment so that the fault input can be re-created exactly, with accurate
analogue signals sent to the relay[15]. From the Off-line test, the each type of fault
was recorded as a COMTRADE file in form of DAT.file.
4 8
Figure 5-1. On-line relay testing algorithm.
5.2 Algorithm of Protection Relay 5.2.1 Hardware Implementation
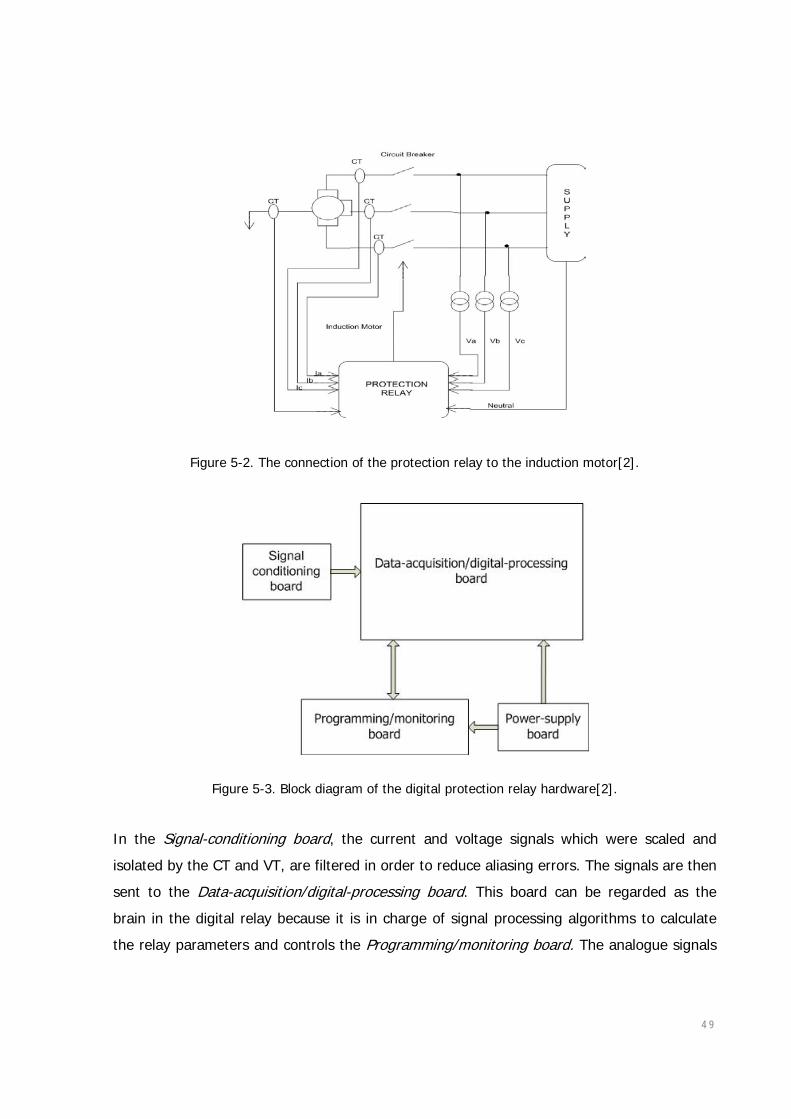
Figure 5-2 illustrates the connection of the protection relay to the induction motor and the
supply. The two types of transformer, CT and VT, pass proportional inputs to the protection
relay. In other cases, only a two phase CT is used to calculate the three phase current
because the other current can be found from the other values[2].
The digital hardware components can be divided according to functional responsibility: the
Signal-conditioning board, the Data-acquisition/digital-processing board, the
Programming/monitoring board and the Power-supply board. Figure 5-3 illustrates the block
diagram of the digital protection relay hardware.
4 9
Figure 5-2. The connection of the protection relay to the induction motor[2].
Figure 5-3. Block diagram of the digital protection relay hardware[2].
In the Signal-conditioning board, the current and voltage signals which were scaled and
isolated by the CT and VT, are filtered in order to reduce aliasing errors. The signals are then
sent to the Data-acquisition/digital-processing board. This board can be regarded as the
brain in the digital relay because it is in charge of signal processing algorithms to calculate
the relay parameters and controls the Programming/monitoring board. The analogue signals

5 0
are sampled by a sample/hold unit then digitalization of sampled signals is implemented by
using a A/D converter in the digital-processing board. The Programmer/ monitor board
provides a user interface with a keypad and display unit such as LEDs so that the user can
set the relay parameter and monitor the state of the relay. The power-supply board provides
appropriate supply voltages to the relay for proper operation[2].
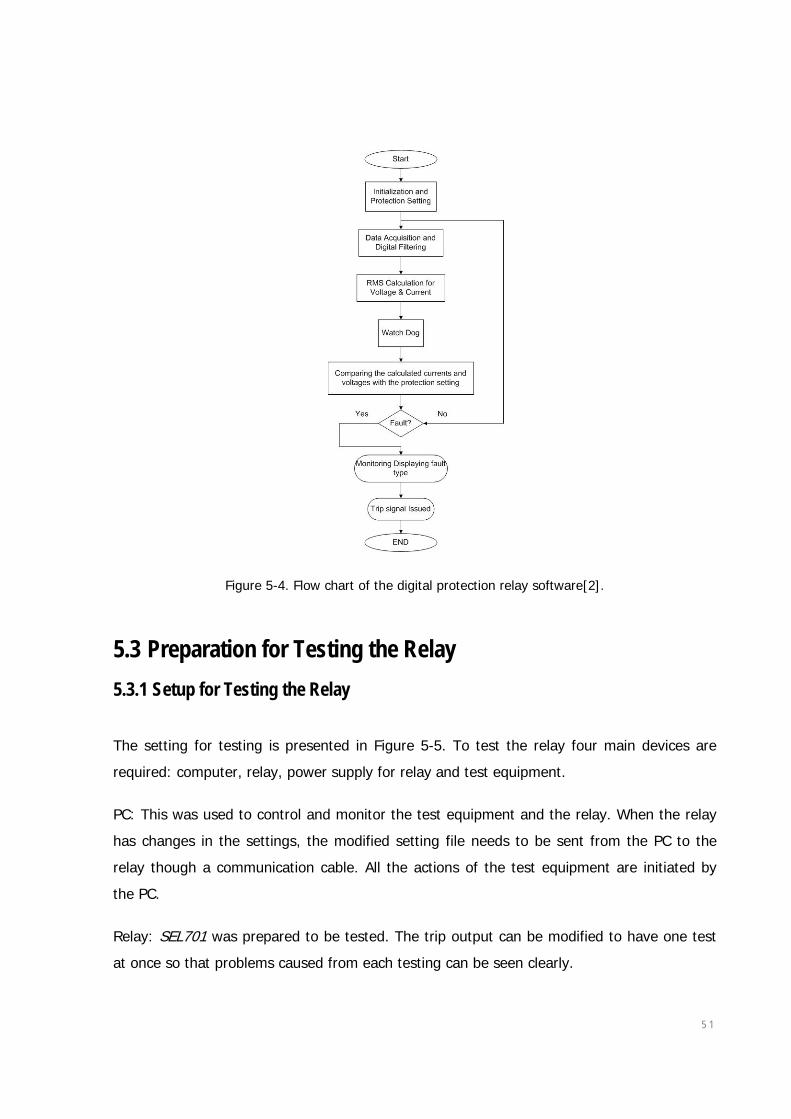
5.2.2 Software Implementation
The software in the relay implements the algorithms to control the hardware to enable the
relay to perform the various protection functions for the motor. The components of the relay
software can be divided into main three modules: the Initialization module, the Processing
module and the Monitoring module[2].
In the initialization module, the relay parameters and other variables are initialized with
initialization routines when the relay starts. The processing module contains three sub parts.
• Data-acquisition and computation: this part collects the analogue signal and
digitalizes them. The RMS value of the current and voltage signals are also calculated
here.
• Fault detection: abnormal operation conditions are detected here from the algorithms
which are designed to distinguish various fault types such as overload.
• Watch-dog: there may be disturbances in the computation. This part allows the relay
to compute the results with minimum errors by reducing the effect of disturbances.
Lastly, the monitor module is responsible for the keypad, the display unit and the setting of
parameters[2]. The flow chart of the digital relay software is shown in Figure 5-4.
5 1
Figure 5-4. Flow chart of the digital protection relay software[2].
5.3 Preparation for Testing the Relay 5.3.1 Setup for Testing the Relay
The setting for testing is presented in Figure 5-5. To test the relay four main devices are
required: computer, relay, power supply for relay and test equipment.
PC: This was used to control and monitor the test equipment and the relay. When the relay
has changes in the settings, the modified setting file needs to be sent from the PC to the
relay though a communication cable. All the actions of the test equipment are initiated by
the PC.
Relay: SEL701 was prepared to be tested. The trip output can be modified to have one test
at once so that problems caused from each testing can be seen clearly.
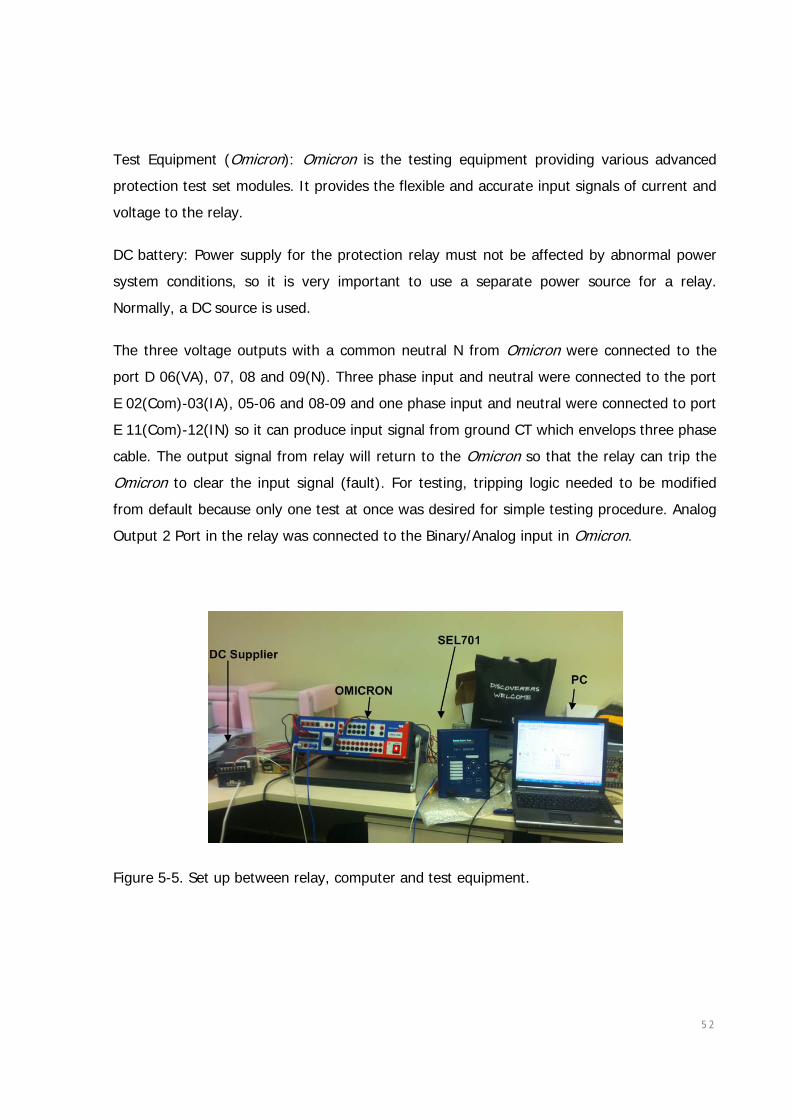
5 2
Test Equipment (Omicron): Omicron is the testing equipment providing various advanced
protection test set modules. It provides the flexible and accurate input signals of current and
voltage to the relay.
DC battery: Power supply for the protection relay must not be affected by abnormal power
system conditions, so it is very important to use a separate power source for a relay.
Normally, a DC source is used.
The three voltage outputs with a common neutral N from Omicron were connected to the
port D 06(VA), 07, 08 and 09(N). Three phase input and neutral were connected to the port
E 02(Com)-03(IA), 05-06 and 08-09 and one phase input and neutral were connected to port
E 11(Com)-12(IN) so it can produce input signal from ground CT which envelops three phase
cable. The output signal from relay will return to the Omicron so that the relay can trip the
Omicron to clear the input signal (fault). For testing, tripping logic needed to be modified
from default because only one test at once was desired for simple testing procedure. Analog
Output 2 Port in the relay was connected to the Binary/Analog input in Omicron.
Figure 5-5. Set up between relay, computer and test equipment.

5 3
5.4 Steady State Test 5.4.1 Thermal Protection Element (49)
The goal of test for thermal element is checking the trip time value at fault current compared
to the values from manufacture data sheet. It is difficult to check all tripping time values
through minimum to maximum input current as the thermal characteristic curve is time-
overcurrent. Several input currents were injected to test the characteristic of thermal curve
4(MV motor) and curve 15(LV motor).
<Testing steps>
1) In the relay setting file, the pickup current was set at 1p.u. (1Sec.A) and curve 4 was
chosen to be tested. After changing the setting parameter, the setting parameter was
sent from the PC to the relay.
2) Firstly, fault current 5% lower than the pickup current was injected by OMICRON.
3) The input current was slowly increased.
4) The fault current values calculated in PowerFactory were applied to the relay in order
to compare off-line and on-line tests.
5) The tripping time was recorded for every test.

5 4
Figure 5-6. Plot of trip time versus multiples of full load current (curve 4 for MV motor).
Table 5-1. Test sheet of the thermal curve 4 for MV motor
Multiples of Full Load Amps
Expected tripping time(s) from data sheet
Tested Trip Value(s)
Error (%)
0.95 (step 2) Non Non 0% 1.2 376 351 -7% 2 91.2 83.65 -8% 4 22.5 21.31 -5% 6 10 9.622 -4% 8 5.6 5.655 1%
10 (step 4) 3.6 3.717 3% 20 3.6 3.703 3% Total 4%
Figure 5-6 and Error! Reference source not found. show the result from the test. The
relay did not trip when the input current was 5% smaller than pickup current, which was
expected. More input currents were set from 1.2 - 20 in steps of 2p.u. The tests resulted in
trip time values with an average error of 4%. The 4% error is small enough to ignore so the
characteristic of curve 4 corresponds the manufacture datasheet (Appendix C).
0
50
100
150
200
250
300
350
400
1 2 3 4 5 6 7 8 9 10 11 12 13
Tim
e (s
ec)
Multiples of full load current
Expected trip time
Tested trip time

5 5
5.4.2 Instantaneous Protection Element (50P and 50N)
Testing the Instantaneous element is not complex. A reasonable current input will be applied
to the system and the tripping time will be observed. Since the instantaneous element is
used to detect high currents, testing could have a risk of damage to the relay and the test
equipment. For this reason, the range of input currents was limited to approximately 20p.u.
to avoid any damage to the devices. The actual tripping time from on-line testing could be a
bit longer than expected values because it takes time to detect the fault and respond.
Although it is a very small delay, it could be significant due to the fast trip value of the
instantaneous element[16].
<Testing steps>
1) In the relay setting file, the pickup currents and the time delay of 50P and 50N
were set at 10.18p.u. with 0.1s and 0.5p.u. with 0.5s respectively. After changing
the setting parameter, the setting parameter was sent from the PC to the relay.
2) The fault current was injected 5% higher than the pickup current.
3) The current was slowly decreased until it did not trip.
4) The current was increased until it tripped again.
5) The fault current values calculated in PowerFactory were applied to the relay in
order to compare off-line and on-line tests.
6) The tripping time was recorded for every test.
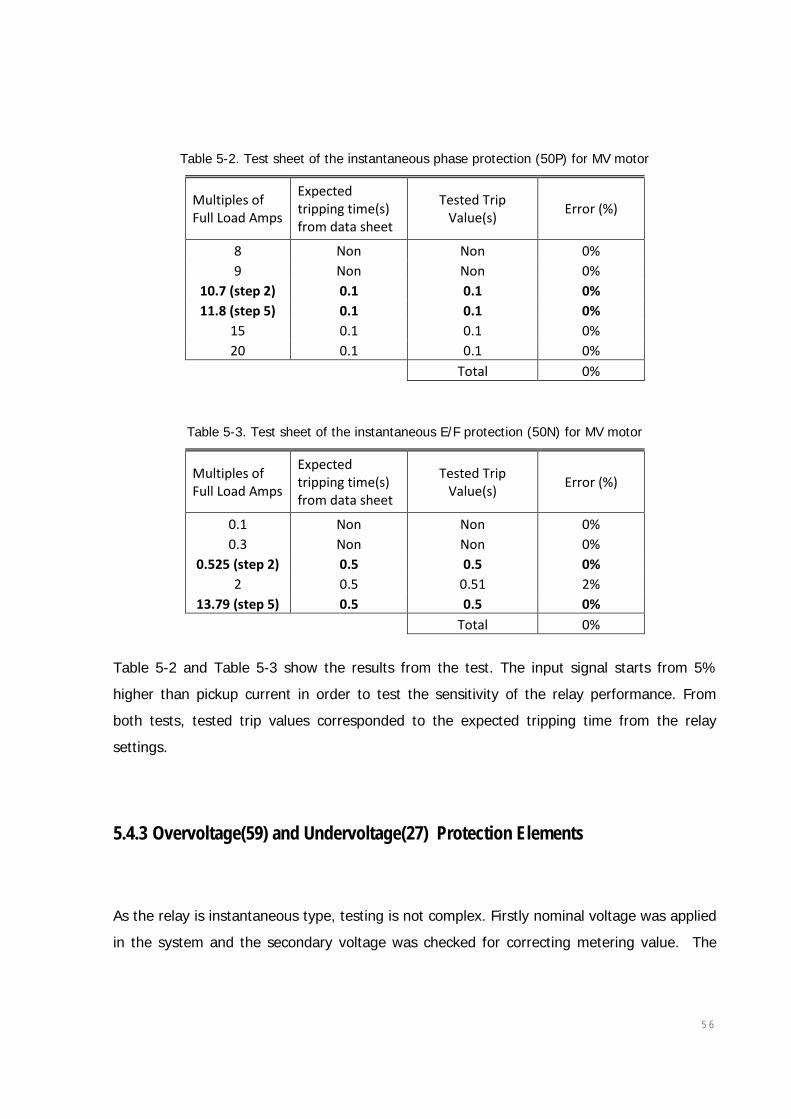
5 6
Table 5-2. Test sheet of the instantaneous phase protection (50P) for MV motor
Multiples of Full Load Amps
Expected tripping time(s) from data sheet
Tested Trip Value(s)
Error (%)
8 Non Non 0% 9 Non Non 0%
10.7 (step 2) 0.1 0.1 0% 11.8 (step 5) 0.1 0.1 0%
15 0.1 0.1 0% 20 0.1 0.1 0%
Total 0%
Table 5-3. Test sheet of the instantaneous E/F protection (50N) for MV motor
Multiples of Full Load Amps
Expected tripping time(s) from data sheet
Tested Trip Value(s)
Error (%)
0.1 Non Non 0% 0.3 Non Non 0%
0.525 (step 2) 0.5 0.5 0% 2 0.5 0.51 2%
13.79 (step 5) 0.5 0.5 0%
Total 0%
Table 5-2 and Table 5-3 show the results from the test. The input signal starts from 5%
higher than pickup current in order to test the sensitivity of the relay performance. From
both tests, tested trip values corresponded to the expected tripping time from the relay
settings.
5.4.3 Overvoltage(59) and Undervoltage(27) Protection Elements
As the relay is instantaneous type, testing is not complex. Firstly nominal voltage was applied
in the system and the secondary voltage was checked for correcting metering value. The

5 7
trip time test is also very simple. The pickup voltage was applied and the trip time was
compared with the expected value[16].
<Testing steps>
1) Firstly, A-N was selected for the test target phase as the required phase setting is
any one phase.
2) The nominal voltage was applied to check the secondary voltage measurement.
3) The fault voltage ±10% of the pickup voltage was applied and the tripping time was
recorded on the test sheet to be compared with the expected value.
4) Repeat the above steps for B-N and C-N phases.
Table 5-4 Test sheet of the voltage protection (27/59) for MV motor
Multiples of Voltage
Expected tripping time(s) from data sheet
Tested Trip Value(s)
Error (%)
Over Voltage
0.9 Non Non 0% 1.1 2 2.01 0% 1.2 2 2 0%
Under Voltage
0.8 2 2 0% 0.9 2 2 0% 1.1 Non Non 0%
Total 0%
The test results given in Table 5-4 are consistent with the expected tripping value.
5 8
5.5 Dynamic Test PowerFactory can export data in either Comtrade file or Text file. Comtrade is a common
format file for transient data exchange for power systems. The secondary current and
voltage signal in the phase CT and ground CT were extracted and saved in Comtrade format
file. The oscilloscope data can be used to simulate the fault event by injecting in the test
equipment. The Advanced Transplay is the test module providing playbacks of transient data
so it can simulate the true fault event. Each secondary current from fault event was recorded
from 0sec to time which is long enough to check the trip time and short enough to reduce
the burden of load in the PC and test equipment.
In the next section, test results of instantaneous protection elements will be presented while
thermal and voltage protection were not to be tested. Thermal protection could not be
implemented with OMICRON because the size of Comtrade file was too large for OMCRON to
be tested. The solution could be to increase the sampling time so that the number of data
points could be reduced. Voltage testing also faced the problem with the magnitude of the
input voltage in OMICRON, since OMICRON can only test signals up to 30p.u. As OMICRON
provides a scaling function, this problem can be solved.
5.5.1 Instantaneous Protection Element (50P, 50N and 50Q)
Table 5-5 presents the results from all tests (off-line, steady state and dynamic mode) to be
compared. Off line testing and the steady state shows the same results while dynamic test
result is slower, approximately 0.02-0.03second than the others. It is assumed that this short
time is used to import the Comtrade data in to the system.

5 9
Figure 5-7. Test result of instantaneous phase element (50P) with two phases to ground fault
Figure 5-8. Test result of instantaneous phase element (50G) with single phases to ground fault
Figure 5-9. Test result of instantaneous phase element (50Q) with two phases to ground fault
Time (s)
Time (s)
Time (s)

6 0
Table 5-5. Comparison of instantaneous tests
5.6 General Check List for Incorrect Test Results or Malfunctioning of Relay
1) The connection and produced signals between the relay and Omicron can be checked
by applying small input signal and reviewing the measured value in the relay.
2) In case of incorrect results, make sure settings are correct.
3) Check the wiring and leads between the devices.
4) Make sure that trip output for the test is assigned for correct output port.
5) Make sure other protection elements are turned off in order to have right output from
tested element.
Off-line test (sec) Steady state test(sec) Dynamic Test(sec)
50P 0.1 0.1 0.12
50G 0.5 0.5 0.53
50Q 0.2 - 0.22
6 1
6 Conclusion
The aim of the project was to model the motor protection relay in PowerFactory and to verify
the performance of the relay through off-line and on-line tests by using OMICRON. For the
off-line testing, SEL701 was modelled in PowerFactory based on the data sheet in the
manufacturer’s manual. Various fault events were implemented to test the relay by
measuring the trip time. For the on-line test, steady state and dynamic tests were
demonstrated with OMICRON. The dynamic test allows the user to simulate real fault
conditions in the relay. The protection relay elements tested are presented below.
- Thermal Overload Protection Element 49
- Instantaneous Phase Protection Element 50P
- Instantaneous Ground Protection Element 50G
- Instantaneous Negative Sequence Protection Element 50Q
- Instantaneous Under/Over Voltage Protection Element 27/59
Both sets of tests were successful and the relay showed accurate performance in detecting
the faults. The relay responds to the faults at the trip time, which is calculated with the time-
overcurrent characteristics according to the type of the fault.
In summary, the digital motor protection relay provides multi-functions to the user. The
advantages of the numerous functions are only available when detailed study of the
protected motor and the relay takes place to calculate the appropriate setting parameters in
the relay. Relay testing would be the final step to prepare the motor protection relay for use
in a real system.

6 2
6.1 Further Work
The following studies are proposed in the future:
1. The fault location could be varied depending on the length of the transmission line
from the relay location.
2. The temperature change in the motor could be considered in the algorithm of the
protection relay. ( Cooling from the motor surface)
3. On-line dynamic testing could be repeated with the stated solutions.

6 3
7 Reference
[1] K. Pandurangavittal, D. B. Fakruddin, I. R. Rao, and K. Parthasarathy, "MICROCONTROLLER BASED THREE-PHASE INDUCTION MOTOR PROTECTION RELAY WITH OPERATOR SELECTABLE THERMAL IT CURVE FEATURE," Electric Machines & Power Systems, vol. 26, pp. 13 - 26, 1998.
[2] W. A. Farag and M. I. Kamel, "Microprocessor-Based Protection System for Three-Phase Induction Motors," Electric Machines & Power Systems, vol. 27, pp. 453-464, 1999.
[3] S. Chapman, ELECTRIC MACHINERY FUNDAMENTALS vol. 1: Elizabeth A.Jones, 2005.
[4] S. E. Zocholl, AC Motor Protection. Pullman: SEL, 2003.
[5] "IEEE Recommended Practice for Protection and Coordination of Industrial and Commercial Power Systems," IEEE Std 242-2001 (Revision of IEEE Std 242-1986) [IEEE Buff Book], pp. i-740, 2001.
[6] "IEEE Standard Test Procedure for Polyphase Induction Motors and Generators," IEEE Std 112-1996, p. i, 1997.
[7] "IEEE Guide for the Presentation of Thermal Limit Curves for Squirrel Cage Induction Machines," IEEE Std 620-1996, p. i, 1996.
[8] SKM, "Equipment Damage Curves Motors." vol. 2010: SKM, 2010.
[9] "IEEE Recommended Practice for Protection and Coordination of Industrial and Commercial Power Systems," ANSI/IEEE Std 242-1986, p. 0_1, 1986.
[10] "IEEE Guide for AC Motor Protection," IEEE Std C37.96-2000, p. i, 2000.
[11] M. S. Thomas, A. Prakash, and Nizamuddin, "Modeling and Testing of Protection Relay IED," in Power System Technology and IEEE Power India Conference, 2008. POWERCON 2008. Joint International Conference on, 2008, pp. 1-5.
[12] Schweitzer Engineering Laboratories Inc, "SEL-701 Motor Protection Relay," Schweitzer Engineering Laboratories, Inc, 2009.
[13] J. J. KUMM, "PHILOSOPHIES FOR TESTING PROTECTIVE RELAYS," Washington: SEL 1994.
[14] OMICRON, "Protection Package - User Manual," O. electronics, Ed. GmbH, 2007.
[15] J. White, "ADVANCED RELAY TESTING," Institution of Electrical Engineers, 1993.
[16] c. Werstiuk, "THE RELAY TESTING HANDBOOK", O.-o. B. Production, Ed. CA: Valence Electrcal Training Service 2010.

6 4
8 APPENDIX