modeling and visualization of forest cover transition in...
TRANSCRIPT


Citation: Ramachandra T.V, Setturu Bharath, Nimish Guptha, Bhargavi R Sharma 2017, Modeling and
Visualization of Forest Cover Transition in Protected Areas, Sahyadri E-news, 2017 (58) : 3-45,
http://wgbis.ces.iisc.ernet.in/biodiversity/sahyadri_enews/newsletter/Issue58/index.htm.
Modeling and Visualization of forest cover transition in protected areas
Forests are complex ecosystems, requires efficient forestry management. This involves
consideration of current and future management issues including the richness of living organisms
in forests, the uniqueness of forest dependent people. Monitoring and mediating the negative
consequences LULC (land use land cover) change will help in sustainable planning, decreasing
environmental consequences such as climate change, biodiversity loss, land degradation, soil
erosion and pollution of water, air. Modeling and visualization techniques have been widely
applied to account and forecast changes in forests across the world. Modeling and visualization
allows to quantify spatial and temporal variability in landscape at a finer scale, where similar
studies on the ground would be logistically impossible (Amato et al., 2011). LULC modeling for
forested landscape is often used for predicting trajectories of future, analyzing the fundamental
socio-political, economic, cultural and biophysical forces acting. Modeling approach focuses on
two disparate parts acting at a landscape i.e. processes, and spatial patterns. The two parts have
included in dynamic models by presuppose homogeneity and immediate information transfer at
various spatial extensions (Ramachandra et al., 2017). In general models are developed based on
defensible empirical data, which bring findings back from abstraction to some real world
understanding. The two basic modeling approaches are theoretical and simulation modeling.
Theoretical models are built on mathematical principles and applying them to natural systems
(Clark, 1991), which adds complexity in understanding pattern and process. Simulation models
incorporate simple complexity, but reflect actual ecological accurately with better readability.
Due to continuous improvement in technology, many models are developed for accounting
patterns and processes effectively which connect biophysical and human related factors, explicit
inclusion of human nature interaction mechanisms. The development of various models has
considered biophysical and human interactions on land use at varied scales rather than land
systems as a whole (Rounsevell et al., 2012). Numerous models have been advanced such as
Markov cellular automata models (MCA), AHP (Analytical Hierarchical Processes), logistic
regression models, ANN system (Artificial Neural Network), SWAM optimization (Ballestores et
al., 2012; Bharath et al., 2016; Hyandye and Martz, 2017; Satty, 2008; Bharath et al., 2017;

Citation: Ramachandra T.V, Setturu Bharath, Nimish Guptha, Bhargavi R Sharma 2017, Modeling and
Visualization of Forest Cover Transition in Protected Areas, Sahyadri E-news, 2017 (58) : 3-45,
http://wgbis.ces.iisc.ernet.in/biodiversity/sahyadri_enews/newsletter/Issue58/index.htm.
Tayyebi et al., 2014; Yuan et al., 2009; Liu et al., 2013) for better understanding land use pattern
and processes. Markov chain approach is a stochastic widely implemented to study the dynamics
of land use change at different scales under the assumptions of probability of a system being in a
certain state at certain time can be determined if its state at an earlier time is known (Halmy et al.,
2015). Markov chain analysis does not assume statistical independence of data as required by
logistic regression, which makes it suitable for the spatially dependent land use data to predict all
multi directional land use changes (Overmars et al., 2003; Pontius and Malanson, 2005).
The stationary transitions are assumed by the Markov models is one of the issues and not spatially
explicit which makes it more suitable for short-term projections (Sinha and Kimar, 2013). This
shortcoming of the technique can be overcome through the integration with other different
dynamic and empirical models (Bharath et al., 2014). Integrated modeling approaches are
considered more suitable for modeling land use change processes (Guan et al., 2011). Markov
models can be integrated with cellular automata models (MCA) to model and predict land use
change at different scales. Forest land use changes are most non-linear process, MCA considered
as effective compare to other techniques. MCA model is simple and provides better understanding
of how nonlinear process can aptly simulated by less complexity. MCA has the ability to predict
any transition among any number of categories, as compared to many techniques. Many models
transitions can be only a one way as from one category to one alternative category (Pontius and
Malanson, 2005). Due to MCA’s advantages of multiple LU classes transition, that integrate the
aspatial Markov with the spatial CA model outperformed regression based models in prediction,
accuracy at multiple resolutions stands out as an effective modeling tool.
The modeling of spatiotemporal changes across the protected areas are evaluated using MCA
analysis. A cellular automaton has capable of modeling surprisingly complex behavior, defined as
a large lattice of identical finite state automata (cells) (Von Neumann, 1966). Each state or move
is defined as a triplet:
< 𝐼, 𝑆, 𝑊 >
where I is the set of inputs, S is a set of states (both sets being finite), and W is the next-state
function, defined on input-state pairs. The set of inputs is defined as ordered (or non-ordered) n-
tuples of the states of a finite set of “neighboring” cells. In a two dimensional CA typically
Citation: Ramachandra T.V, Setturu Bharath, Nimish Guptha, Bhargavi R Sharma 2017, Modeling and
Visualization of Forest Cover Transition in Protected Areas, Sahyadri E-news, 2017 (58) : 3-45,
http://wgbis.ces.iisc.ernet.in/biodiversity/sahyadri_enews/newsletter/Issue58/index.htm.
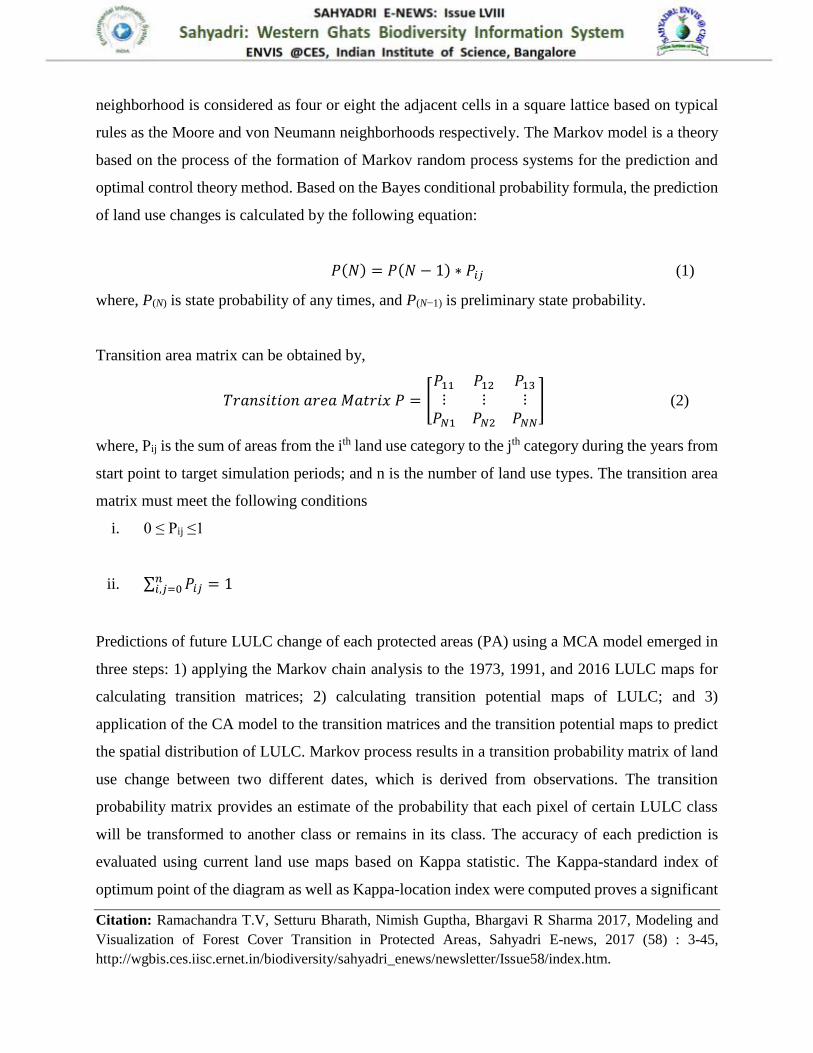
neighborhood is considered as four or eight the adjacent cells in a square lattice based on typical
rules as the Moore and von Neumann neighborhoods respectively. The Markov model is a theory
based on the process of the formation of Markov random process systems for the prediction and
optimal control theory method. Based on the Bayes conditional probability formula, the prediction
of land use changes is calculated by the following equation:
𝑃(𝑁) = 𝑃(𝑁 − 1) ∗ 𝑃𝑖𝑗 (1)
where, P(N) is state probability of any times, and P(N−1) is preliminary state probability.
Transition area matrix can be obtained by,
𝑇𝑟𝑎𝑛𝑠𝑖𝑡𝑖𝑜𝑛 𝑎𝑟𝑒𝑎 𝑀𝑎𝑡𝑟𝑖𝑥 𝑃 = [𝑃11 𝑃12 𝑃13
⋮ ⋮ ⋮𝑃𝑁1 𝑃𝑁2 𝑃𝑁𝑁
] (2)
where, Pij is the sum of areas from the ith land use category to the jth category during the years from
start point to target simulation periods; and n is the number of land use types. The transition area
matrix must meet the following conditions
i. 0 ≤ Pij ≤1
ii. ∑ 𝑃𝑖𝑗 = 1𝑛𝑖,𝑗=0
Predictions of future LULC change of each protected areas (PA) using a MCA model emerged in
three steps: 1) applying the Markov chain analysis to the 1973, 1991, and 2016 LULC maps for
calculating transition matrices; 2) calculating transition potential maps of LULC; and 3)
application of the CA model to the transition matrices and the transition potential maps to predict
the spatial distribution of LULC. Markov process results in a transition probability matrix of land
use change between two different dates, which is derived from observations. The transition
probability matrix provides an estimate of the probability that each pixel of certain LULC class
will be transformed to another class or remains in its class. The accuracy of each prediction is
evaluated using current land use maps based on Kappa statistic. The Kappa-standard index of
optimum point of the diagram as well as Kappa-location index were computed proves a significant

Citation: Ramachandra T.V, Setturu Bharath, Nimish Guptha, Bhargavi R Sharma 2017, Modeling and
Visualization of Forest Cover Transition in Protected Areas, Sahyadri E-news, 2017 (58) : 3-45,
http://wgbis.ces.iisc.ernet.in/biodiversity/sahyadri_enews/newsletter/Issue58/index.htm.
correlation between the simulated and the actual maps Table 1 shows the transition matrix of
ADTR region based on land use maps of 1973-1992; 1992-2016. The transition probability and
transition areas were computed for all protected areas to account category wise changes.
Table 1: Transition probability matrix of ADTR based on 1973-1992.
Sno Category 1 2 3 4 5 6 7 8 9
1 Ever green to
semi evergreen 0.823 0.076 0.020 0.004 0.043 0.008 0.000 0.000 0.026
2 Deciduous
forest 0.221 0.561 0.023 0.113 0.004 0.006 0.008 0.035 0.026
3 Scrub_Grass 0.045 0.101 0.436 0.077 0.006 0.064 0.022 0.048 0.196
4 Forest
Plantations 0.168 0.118 0.033 0.511 0.003 0.019 0.016 0.033 0.100
5 Horticulture 0.058 0.139 0.055 0.045 0.562 0.048 0.018 0.045 0.025
6 Agriculture 0.024 0.040 0.050 0.090 0.196 0.37 0.018 0.097 0.116
7 Water 0.027 0.064 0.031 0.078 0.013 0.020 0.53 0.017 0.221
8 Built-up area 0.011 0.031 0.045 0.041 0.004 0.087 0.026 0.563 0.188
9 Open area 0.000 0.004 0.132 0.019 0.244 0.061 0.003 0.004 0.534
Table 2: Transition probability matrix of ADTR based on 1992-2016.
Sno Category 1 2 3 4 5 6 7 8 9
1 Ever green to
semi evergreen 0.867 0.008 0.013 0.000 0.096 0.008 0.000 0.000 0.009
2 Deciduous
forest 0.007 0.714 0.087 0.000 0.073 0.014 0.000 0.004 0.102
3 Scrub_Grass 0.000 0.163 0.540 0.096 0.110 0.003 0.000 0.001 0.088
4 Forest
Plantations 0.089 0.019 0.099 0.400 0.180 0.033 0.001 0.013 0.166
Citation: Ramachandra T.V, Setturu Bharath, Nimish Guptha, Bhargavi R Sharma 2017, Modeling and
Visualization of Forest Cover Transition in Protected Areas, Sahyadri E-news, 2017 (58) : 3-45,
http://wgbis.ces.iisc.ernet.in/biodiversity/sahyadri_enews/newsletter/Issue58/index.htm.
5 Horticulture 0.091 0.000 0.080 0.000 0.692 0.112 0.000 0.001 0.025
6 Agriculture 0.049 0.001 0.066 0.000 0.195 0.523 0.000 0.028 0.137
7 Water 0.079 0.000 0.049 0.001 0.067 0.022 0.575 0.081 0.126
8 Built-up area 0.004 0.000 0.022 0.000 0.077 0.085 0.001 0.619 0.192
9 Open area 0.014 0.070 0.036 0.000 0.117 0.119 0.000 0.005 0.639
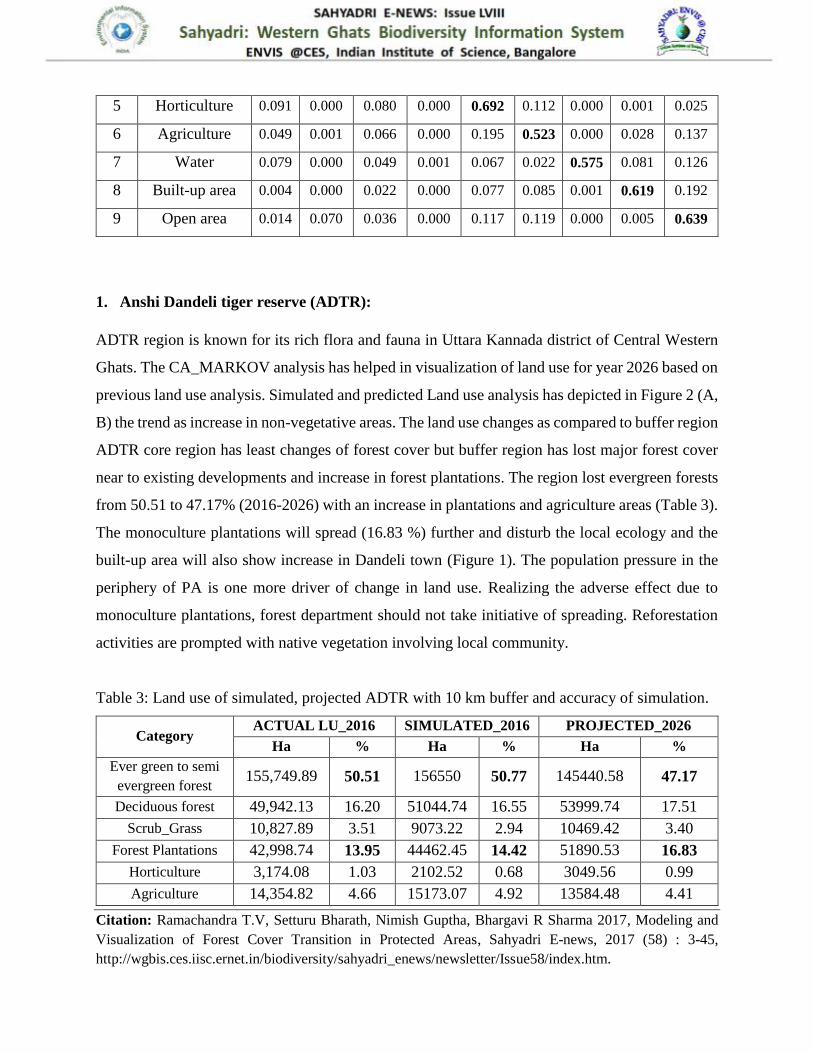
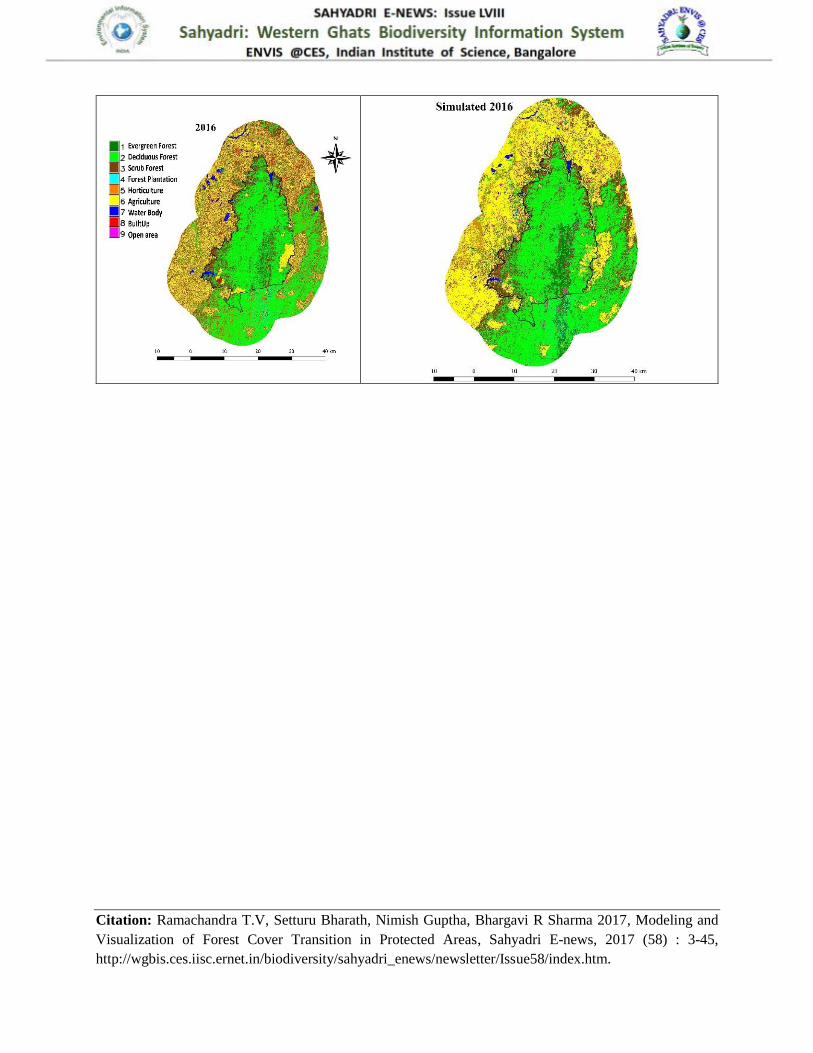
1. Anshi Dandeli tiger reserve (ADTR):
ADTR region is known for its rich flora and fauna in Uttara Kannada district of Central Western
Ghats. The CA_MARKOV analysis has helped in visualization of land use for year 2026 based on
previous land use analysis. Simulated and predicted Land use analysis has depicted in Figure 2 (A,
B) the trend as increase in non-vegetative areas. The land use changes as compared to buffer region
ADTR core region has least changes of forest cover but buffer region has lost major forest cover
near to existing developments and increase in forest plantations. The region lost evergreen forests
from 50.51 to 47.17% (2016-2026) with an increase in plantations and agriculture areas (Table 3).
The monoculture plantations will spread (16.83 %) further and disturb the local ecology and the
built-up area will also show increase in Dandeli town (Figure 1). The population pressure in the
periphery of PA is one more driver of change in land use. Realizing the adverse effect due to
monoculture plantations, forest department should not take initiative of spreading. Reforestation
activities are prompted with native vegetation involving local community.
Table 3: Land use of simulated, projected ADTR with 10 km buffer and accuracy of simulation.
Category ACTUAL LU_2016 SIMULATED_2016 PROJECTED_2026
Ha % Ha % Ha %
Ever green to semi
evergreen forest 155,749.89 50.51 156550 50.77 145440.58 47.17
Deciduous forest 49,942.13 16.20 51044.74 16.55 53999.74 17.51
Scrub_Grass 10,827.89 3.51 9073.22 2.94 10469.42 3.40
Forest Plantations 42,998.74 13.95 44462.45 14.42 51890.53 16.83
Horticulture 3,174.08 1.03 2102.52 0.68 3049.56 0.99
Agriculture 14,354.82 4.66 15173.07 4.92 13584.48 4.41

Citation: Ramachandra T.V, Setturu Bharath, Nimish Guptha, Bhargavi R Sharma 2017, Modeling and
Visualization of Forest Cover Transition in Protected Areas, Sahyadri E-news, 2017 (58) : 3-45,
http://wgbis.ces.iisc.ernet.in/biodiversity/sahyadri_enews/newsletter/Issue58/index.htm.
Water 17,247.87 5.59 17253.48 5.60 17815.47 5.78
Built-up area 3710.29 1.20 2013.74 0.65 3495.36 1.13
Open area 10,328.67 3.35 10661.16 3.46 8589.54 2.79
Total Area 308334.38
Accuracy of
simulation
Kno Klocation Kstandard
0.79 0.82 0.83

Citation: Ramachandra T.V, Setturu Bharath, Nimish Guptha, Bhargavi R Sharma 2017, Modeling and
Visualization of Forest Cover Transition in Protected Areas, Sahyadri E-news, 2017 (58) : 3-45,
http://wgbis.ces.iisc.ernet.in/biodiversity/sahyadri_enews/newsletter/Issue58/index.htm.
Figure 1: Simulated and Predicted LU of ADTR
2. Sharavathy Wild life Sanctuary:
Sharavathy Wildlife Sanctuary (SWLS) is located on the Sharavathy river basin dominated by
dense evergreen to semi evergreen forests in the hills and moist deciduous in foot hills. It was
declared as protected wild life sanctuary under section 18 of WPA, 1972 as (amended upto 2003).
It is a rich habitat for many exotic species of animals including the lion-tail Macaque, varied
mammals, birds and tigers with regular river flow. The evergreen forest cover has lost from 22.87
to 20.99 % due to increase in plantations and built-up area (Table 4). The population pressure also
another factor for forest cover change in SWLS region as the increase in deciduous forest cover
depicted in buffer region at the cost of evergreen cover due to various alterations. The plantations
will constitute 6.67 % by 2026 to reduce the population pressure on forest cover (Figure 2). The
exotic plantations in edges and islands of Linganmakki reservoir and other regions shown an
increment, which will affect the native vegetation and ecological processes. The growth in exotic
cover has affected water yield in the region, which is also evident from earlier field estimations.
The increase in built-up area in the buffer region highlights the growth of various towns and other
villages in the buffer region. The shift from agriculture to horticulture is noticed at very high rates
in buffer areas as constituted 9% of entire region.
Table 4: Land use of simulated, projected SWLS with 10 km buffer and accuracy of simulation.
Category ACTUAL LU_2016 SIMULATED_2016 PROJECTED_2026
Ha % Ha % Ha %

Citation: Ramachandra T.V, Setturu Bharath, Nimish Guptha, Bhargavi R Sharma 2017, Modeling and
Visualization of Forest Cover Transition in Protected Areas, Sahyadri E-news, 2017 (58) : 3-45,
http://wgbis.ces.iisc.ernet.in/biodiversity/sahyadri_enews/newsletter/Issue58/index.htm.
Ever green to semi
evergreen forest 49578.93 22.87 52362.04 24.15 45504.67 20.99
Deciduous forest 61303.15 28.28 62976.78 29.05 61430.9 28.33
Scrub_Grass 11356.91 5.24 12022.72 5.55 13137.79 6.06
Forest Plantations 9229.62 4.26 12352.54 5.70 14457.47 6.67
Horticulture 25238.75 11.64 19536.7 9.01 18180.07 8.39
Agriculture 20118.75 9.28 19507.09 9.00 21798.95 10.05
Water 15076.67 6.95 16453.75 7.59 16453.75 7.59
Built-up area 6008.60 2.77 7208.7 3.32 9582 4.42
Open area 18897.31 8.72 14388.37 6.64 16263.09 7.50
Total Area 216,808.69
Accuracy of
simulation
Kno Klocation Kstandard
0.81 0.86 0.82

Citation: Ramachandra T.V, Setturu Bharath, Nimish Guptha, Bhargavi R Sharma 2017, Modeling and
Visualization of Forest Cover Transition in Protected Areas, Sahyadri E-news, 2017 (58) : 3-45,
http://wgbis.ces.iisc.ernet.in/biodiversity/sahyadri_enews/newsletter/Issue58/index.htm.
Figure 2: Simulated and Predicted LU of SWLS
3. Mookambika Wild Life Sanctuary:
Mookambika Wildlife Sanctuary is located in Udupi district of Karnataka, established with
AFD.48.FWL.74, dated: 22-05-1978 due to flag species such as lion-tailed macaque and cane
turtle, dense evergreen to semi evergreen forests. The rivers Chakra and Sowparnika drains
through the sanctuary. Projected land use of MWLS highlights loss of vegetation cover during
2016 to 2025 due to anthropogenic activities (Figure 3). The population pressure construction of
series of dams are major factors for forest cover change in the buffer region and all agriculture

Citation: Ramachandra T.V, Setturu Bharath, Nimish Guptha, Bhargavi R Sharma 2017, Modeling and
Visualization of Forest Cover Transition in Protected Areas, Sahyadri E-news, 2017 (58) : 3-45,
http://wgbis.ces.iisc.ernet.in/biodiversity/sahyadri_enews/newsletter/Issue58/index.htm.
regions are getting transformed for coffee plantations post 1980’s. Loss of evergreen cover from
22.38 to 19.22 % and increase in deciduous cover (Table 5). The increase in horticulture (15.32%)
is depicted in buffer region at the cost of forest cover due to various alterations. The increase in
built-up area in the buffer region highlights the growth and transformation of horticulture regions.
Table 5: Land use of simulated, projected MWLS with 10 km buffer and accuracy of simulation.
Category ACTUAL LU_2016 SIMULATED_2016 PROJECTED_2026
Ha % Ha % Ha %
Ever green to semi
evergreen forest 50061.12 21.95 51041.03 22.38 43847.19 19.22
Deciduous forest 60124.25 26.36 58054.08 25.45 63224.89 27.72
Scrub_Grass 11721.44 5.14 12319.00 5.40 14804.05 6.49
Forest Plantations 1832.32 0.80 3002.96 1.32 5144.10 2.26
Horticulture 41861.83 18.35 40916.89 17.94 34956.10 15.32
Agriculture 27375.47 12.00 27403.21 12.01 31356.17 13.75
Water 10667.88 4.68 10107.82 4.43 9520.40 4.17
Built-up area 8904.04 3.90 8451.81 3.71 9792.72 4.29
Open area 15564.11 6.82 16815.66 7.37 15466.84 6.78
Total Area 228112.46
Accuracy of
simulation
Kno Klocation Kstandard
0.79 0.88 0.87

Citation: Ramachandra T.V, Setturu Bharath, Nimish Guptha, Bhargavi R Sharma 2017, Modeling and
Visualization of Forest Cover Transition in Protected Areas, Sahyadri E-news, 2017 (58) : 3-45,
http://wgbis.ces.iisc.ernet.in/biodiversity/sahyadri_enews/newsletter/Issue58/index.htm.

Citation: Ramachandra T.V, Setturu Bharath, Nimish Guptha, Bhargavi R Sharma 2017, Modeling and
Visualization of Forest Cover Transition in Protected Areas, Sahyadri E-news, 2017 (58) : 3-45,
http://wgbis.ces.iisc.ernet.in/biodiversity/sahyadri_enews/newsletter/Issue58/index.htm.
Figure 3: Simulated and Predicted LU of MWLS
4. Someshwara Wild Life Sanctuary
Someshwara Wildlife Sanctuary is located the presiding deity of the famous Someshwara temple.
The sanctuary has semi-evergreen evergreen and moist deciduous forests. Sanctuary is drained by
Seethanadi river and nalas like Narasipura hole, Golihole etc. The projected land use of 2026
depicts loss of evergreen forests in the buffer region towards eastern side. The loss of evergreen
forest from 31.43 % to 28.84 % due to intensive horticulture cover 21.46 to 28.08 % by 2026
(Figure 4). The deciduous forest cover in west side of PA will be major loss (Table 6). The upsurge
of horticulture cover will lead to higher water requirement causes ground water depletion.
Table 6: LU of simulated, projected SOMWLS with 10 km buffer and accuracy.
Category ACTUAL LU_2016 SIMULATED_2016 PROJECTED_2026
Ha % Ha % Ha %
Ever green to semi
evergreen forest 57720.42 31.43 55,078.15 29.99 52,968.09 28.84
Deciduous forest 51310.10 27.94 54,316.27 29.57 45,576.62 24.82
Scrub_Grass 3529.16 1.92 3623.95 1.97 5450.86 2.97
Forest Plantations 174.67 0.10 169.2 0.09 150.05 0.08
Horticulture 39411.14 21.46 39,432.31 21.47 51,564.96 28.08
Agriculture 13563.64 7.39 13,609.64 7.41 13,452.49 7.32
Water 4760.64 2.59 5285.17 2.88 5409.28 2.95
Built-up area 938.26 0.51 518.04 0.28 1040.89 0.57
Open area 12255.69 6.67 11,630.99 6.33 8,050.48 4.38
Total Area 183663.72

Citation: Ramachandra T.V, Setturu Bharath, Nimish Guptha, Bhargavi R Sharma 2017, Modeling and
Visualization of Forest Cover Transition in Protected Areas, Sahyadri E-news, 2017 (58) : 3-45,
http://wgbis.ces.iisc.ernet.in/biodiversity/sahyadri_enews/newsletter/Issue58/index.htm.
Accuracy of
simulation
Kno Klocation Kstandard
0.81 0.86 0.84
Citation: Ramachandra T.V, Setturu Bharath, Nimish Guptha, Bhargavi R Sharma 2017, Modeling and
Visualization of Forest Cover Transition in Protected Areas, Sahyadri E-news, 2017 (58) : 3-45,
http://wgbis.ces.iisc.ernet.in/biodiversity/sahyadri_enews/newsletter/Issue58/index.htm.
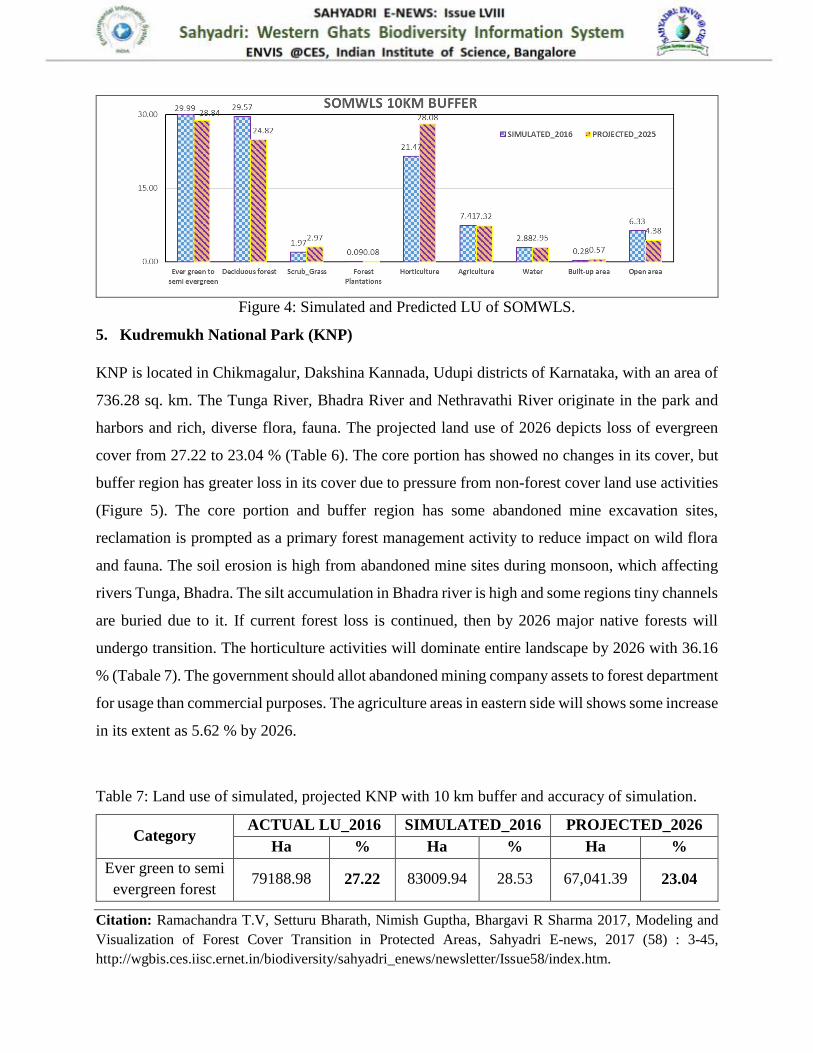
Figure 4: Simulated and Predicted LU of SOMWLS.
5. Kudremukh National Park (KNP)
KNP is located in Chikmagalur, Dakshina Kannada, Udupi districts of Karnataka, with an area of
736.28 sq. km. The Tunga River, Bhadra River and Nethravathi River originate in the park and
harbors and rich, diverse flora, fauna. The projected land use of 2026 depicts loss of evergreen
cover from 27.22 to 23.04 % (Table 6). The core portion has showed no changes in its cover, but
buffer region has greater loss in its cover due to pressure from non-forest cover land use activities
(Figure 5). The core portion and buffer region has some abandoned mine excavation sites,
reclamation is prompted as a primary forest management activity to reduce impact on wild flora
and fauna. The soil erosion is high from abandoned mine sites during monsoon, which affecting
rivers Tunga, Bhadra. The silt accumulation in Bhadra river is high and some regions tiny channels
are buried due to it. If current forest loss is continued, then by 2026 major native forests will
undergo transition. The horticulture activities will dominate entire landscape by 2026 with 36.16
% (Tabale 7). The government should allot abandoned mining company assets to forest department
for usage than commercial purposes. The agriculture areas in eastern side will shows some increase
in its extent as 5.62 % by 2026.
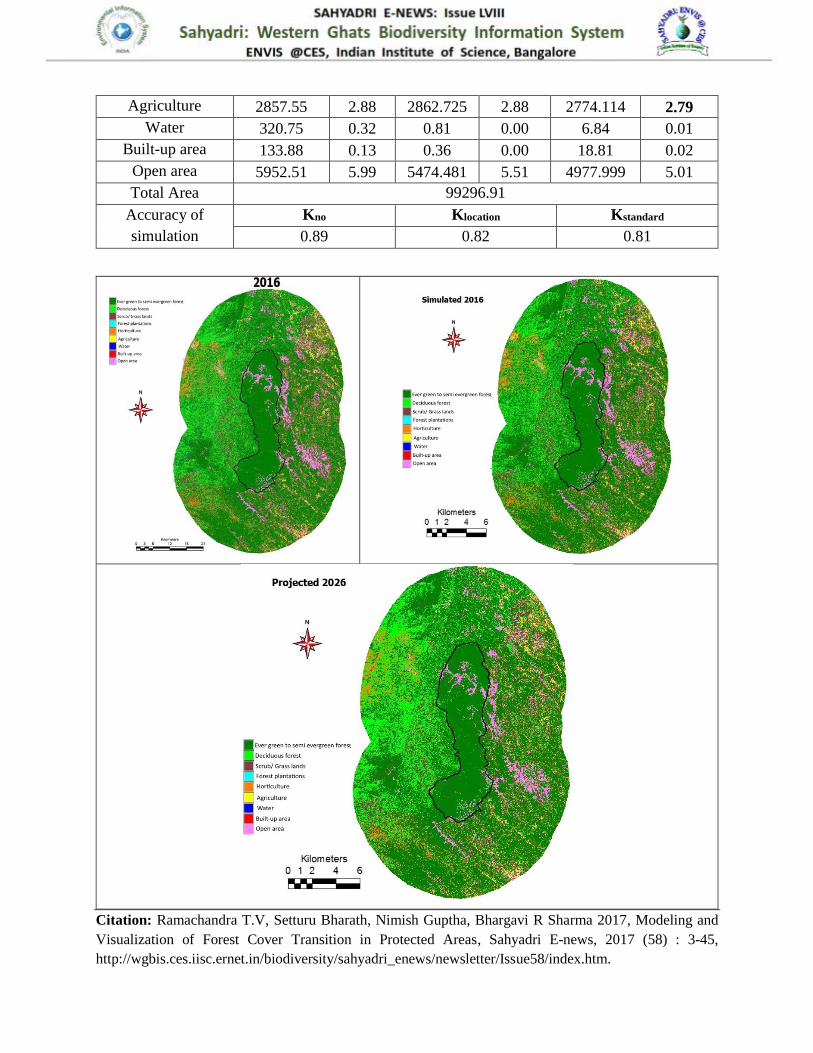
Table 7: Land use of simulated, projected KNP with 10 km buffer and accuracy of simulation.
Category ACTUAL LU_2016 SIMULATED_2016 PROJECTED_2026
Ha % Ha % Ha %
Ever green to semi
evergreen forest 79188.98 27.22 83009.94 28.53 67,041.39 23.04

Citation: Ramachandra T.V, Setturu Bharath, Nimish Guptha, Bhargavi R Sharma 2017, Modeling and
Visualization of Forest Cover Transition in Protected Areas, Sahyadri E-news, 2017 (58) : 3-45,
http://wgbis.ces.iisc.ernet.in/biodiversity/sahyadri_enews/newsletter/Issue58/index.htm.
Deciduous forest 72181.26 24.81 58343.14 20.05 55,126.27 18.95
Scrub_Grass 18747.29 6.44 14715.8 5.06 16,566.00 5.69
Forest Plantations 2027.64 0.70 1188.9 0.41 1388.25 0.48
Horticulture 73517.56 25.27 86789.86 29.83 105,200.36 36.16
Agriculture 10130.68 3.48 21137.62 7.27 16,356.00 5.62
Water 337.25 0.12 392.13 0.13 392.22 0.13
Built-up area 2447.58 0.84 1928.45 0.66 2887.35 0.99
Open area 32368 11.13 23440.36 8.06 25,988.36 8.93
Total Area 290946.2
Accuracy of
simulation
Kno Klocation Kstandard
0.79 0.85 0.82

Citation: Ramachandra T.V, Setturu Bharath, Nimish Guptha, Bhargavi R Sharma 2017, Modeling and
Visualization of Forest Cover Transition in Protected Areas, Sahyadri E-news, 2017 (58) : 3-45,
http://wgbis.ces.iisc.ernet.in/biodiversity/sahyadri_enews/newsletter/Issue58/index.htm.
Figure 5: Simulated and Predicted LU of KNP.

Citation: Ramachandra T.V, Setturu Bharath, Nimish Guptha, Bhargavi R Sharma 2017, Modeling and
Visualization of Forest Cover Transition in Protected Areas, Sahyadri E-news, 2017 (58) : 3-45,
http://wgbis.ces.iisc.ernet.in/biodiversity/sahyadri_enews/newsletter/Issue58/index.htm.
6. Bhadra Wildlife Sanctuary (BWLS)
BWLS is having high tropical biological richness, declared as a 25th tiger reserve under Project
Tiger area by the Government of India on 19th November 1999. The monoculture plantations
transformed composition of forest from past three decades. The large tracts of forests were clear
felled apparently for regeneration, simultaneously selection felling to feed the open market
continued till 1980. The projected land use of 2026 depicts no change in evergreen forest cover,
whereas deciduous forest will reduce from 37.43 to 34.71 % (Table 8). The horticulture in the
buffer region shown some positive changes followed by forest plantations. Horticulture will
constitute 18.5 % and agriculture to horticulture transformation also observed in western side of
study area (Figure 6). The changes will impact the wild fauna as the region is supporting greater
tiger population. The earlier coffee estates in buffer region with native vegetation supporting
diverse herbivorous populations are getting transformed to commercial rubber plantations, causing
serious impact on wild life. The conversion from tea estate to rubber plantations is another major
threat on ecosystem is noticed in recent times.
Table 8: Land use of simulated, projected BWLS with 10 km buffer and accuracy of simulation.
Category ACTUAL LU_2016 SIMULATED_2016 PROJECTED_2026
Ha % Ha % Ha %
Ever green to semi
evergreen forest 23319.88 10.61 25751.66 11.72 22632.08 10.30
Deciduous forest 82236.05 37.43 82490.73 37.54 76255.94 34.71
Scrub_Grass 19921.96 9.07 15331.44 6.98 18607.15 8.47
Forest Plantations 13702.54 6.24 17339.69 7.89 16123.26 7.34
Horticulture 32050.55 14.59 33425.57 15.21 40655.75 18.50
Agriculture 10570.89 4.81 10428.56 4.75 10540.91 4.80
Water 9955.07 4.53 10033.4 4.57 10014.32 4.56
Built-up area 1430.9 0.65 1200.25 0.55 1409.05 0.64
Open area 26524.3 12.07 23710.8 10.79 23473.64 10.68
Total Area 219712.14
Accuracy of
simulation
Kno Klocation Kstandard
0.88 0.89 0.88

Citation: Ramachandra T.V, Setturu Bharath, Nimish Guptha, Bhargavi R Sharma 2017, Modeling and
Visualization of Forest Cover Transition in Protected Areas, Sahyadri E-news, 2017 (58) : 3-45,
http://wgbis.ces.iisc.ernet.in/biodiversity/sahyadri_enews/newsletter/Issue58/index.htm.

Citation: Ramachandra T.V, Setturu Bharath, Nimish Guptha, Bhargavi R Sharma 2017, Modeling and
Visualization of Forest Cover Transition in Protected Areas, Sahyadri E-news, 2017 (58) : 3-45,
http://wgbis.ces.iisc.ernet.in/biodiversity/sahyadri_enews/newsletter/Issue58/index.htm.
Figure 6: Simulated and Predicted LU of BWLS.
7. Pushpagiri Wildlife Sanctuary (PWLS)
PWLS adjoins Bisle reserve forest to the north and Kukke Subramanya forest range to the west
dominated by steep terrains (160-1712 m) with waterfalls, swampy areas and streams. Projected
land use of 2026 depicts no changes inside PWLS, whereas buffer region adjoining horticulte and
agriculture plots depicts some changes. The loss of evergreen forests would be from 64.29 to 57.9
% by 2026 (Figure 7), with increase in deciduous forest cover from 13.79 to 17.26 % (Table 9). It
is one of the largest tropical evergreen forests in Karnataka with nearly 70% of the sanctuary
covered with evergreen forests. The changes in PWLS will have immense impact on ecology and
hydrology. The scrub forests and deciduous forests are increasing in regions adjacent to national
highways, existing agriculture areas due to conversion of evergreen forests. The introduction of
commercial crops, uncontrolled harvesting of zinger is causing serious impact on water, forest
cover.
Table 9: Land use of simulated, projected with 10 km buffer and accuracy of simulation.
Category ACTUAL LU_2016 SIMULATED_2016 PROJECTED_2026
Ha % Ha % Ha %
Ever green to semi
evergreen forest 63841.17 64.29 62,144.23 62.58 57,489.68 57.90
Deciduous forest 13697.26 13.79 13,997.91 14.10 17,140.52 17.26
Scrub_Grass 5417.84 5.46 7,740.72 7.80 9730.097 9.80
Forest Plantations 524.12 0.53 502.52 0.51 3.51 0.00
Horticulture 6551.82 6.60 6,573.16 6.62 7155.342 7.21
Citation: Ramachandra T.V, Setturu Bharath, Nimish Guptha, Bhargavi R Sharma 2017, Modeling and
Visualization of Forest Cover Transition in Protected Areas, Sahyadri E-news, 2017 (58) : 3-45,
http://wgbis.ces.iisc.ernet.in/biodiversity/sahyadri_enews/newsletter/Issue58/index.htm.
Agriculture 2857.55 2.88 2862.725 2.88 2774.114 2.79
Water 320.75 0.32 0.81 0.00 6.84 0.01
Built-up area 133.88 0.13 0.36 0.00 18.81 0.02
Open area 5952.51 5.99 5474.481 5.51 4977.999 5.01
Total Area 99296.91
Accuracy of
simulation
Kno Klocation Kstandard
0.89 0.82 0.81

Citation: Ramachandra T.V, Setturu Bharath, Nimish Guptha, Bhargavi R Sharma 2017, Modeling and
Visualization of Forest Cover Transition in Protected Areas, Sahyadri E-news, 2017 (58) : 3-45,
http://wgbis.ces.iisc.ernet.in/biodiversity/sahyadri_enews/newsletter/Issue58/index.htm.
Figure 7: Simulated and Predicted LU of KNP.
8. Bramhagiri Wildlife Sanctuary (BWLS)
Brahmagiri Wildlife Sanctuary (BRWLS) is located in Kodagu district. Eight rivers and streams
originate in BWLS and flow into the Bay of Bengal (Laxmanthirtha, Ramthirtha and Kabini) and
the Arabian sea (Borapole, Segamanihole, Somahole, Miugorehole and Urtihole). BWLS buffer
region is populated by tiny agricultural villages with coffee, cardamom and commercial
plantations. The projected land use depicts loss of evergreen forest cover from 39.19 to 34.4 %
(Table 10). The core portion of WLS shown positive change in its forest cover, as evident from
Figure 8. Horticulture and commercial crops constitute 30.95 % landscape by 2026 (Figure 8).
Threats to the sanctuary are poaching, encroachments by coffee estates, firewood collection and
hydroelectric projects. Invasive species like Eupatorium, Chromolaena odorata and Lantana
camara have affected the floral diversity of the sanctuary in the borders. The commercial crops in
the buffer region are another major impact on forests. The grasslands and scrub forests are being
encroached for commercial exploitation. Human animal conflicts are noticed due to illegal
collection of small timber, firewood, N.T.F.P., grass by villagers from within BWLS.
Table 10: Land use of simulated, projected BRWLS with 10 km buffer and accuracy of simulation.
Category ACTUAL LU_2016 SIMULATED_2016 PROJECTED_2026
Ha % Ha % Ha %
Ever green to semi
evergreen forest 58487.81 39.19 51,982.02 34.83 51,304.86 34.40
Deciduous forest 9692 6.49 11,853.56 7.94 8,039.28 5.39
Scrub_Grass 8115.36 5.44 7517.99 5.04 2,927.98 1.96

Citation: Ramachandra T.V, Setturu Bharath, Nimish Guptha, Bhargavi R Sharma 2017, Modeling and
Visualization of Forest Cover Transition in Protected Areas, Sahyadri E-news, 2017 (58) : 3-45,
http://wgbis.ces.iisc.ernet.in/biodiversity/sahyadri_enews/newsletter/Issue58/index.htm.
Forest Plantations 1497.71 1.00 105.66 0.07 158.75 0.11
Horticulture 39811.75 26.68 42,360.74 28.39 46,151.66 30.95
Agriculture 21366.3 14.32 24,097.63 16.15 27,392.09 18.37
Water 320.39 0.21 124.47 0.08 82.26 0.06
Built-up area 1302.6 0.87 1011.6 0.68 1676.21 1.12
Open area 8633.55 5.79 10,173.80 6.82 11,394.38 7.64
Total Area 149227.47
Accuracy of
simulation
Kno Klocation Kstandard
0.83 0.86 0.81

Citation: Ramachandra T.V, Setturu Bharath, Nimish Guptha, Bhargavi R Sharma 2017, Modeling and
Visualization of Forest Cover Transition in Protected Areas, Sahyadri E-news, 2017 (58) : 3-45,
http://wgbis.ces.iisc.ernet.in/biodiversity/sahyadri_enews/newsletter/Issue58/index.htm.
Figure 8: Simulated and Predicted LU of BRWLS.
9. Talacauvery Wildlife Sanctuary (TWLS)
TWLS is located in Madikeri taluk of Coorg district, covers an area of 105.59 sq. km. Since the
region is in heart of Western Ghats with more undulating terrain, not prevailing abrupt changes.
The PA is also origin of Cauvery River, which lies on the eastern edge of the sanctuary. Predicted
map of 2026 shows (Figure 9) that the evergreen forest remains almost same while the deciduous
forest will be increased to 6.7% (buffer region). This shows the good management by the forest

Citation: Ramachandra T.V, Setturu Bharath, Nimish Guptha, Bhargavi R Sharma 2017, Modeling and
Visualization of Forest Cover Transition in Protected Areas, Sahyadri E-news, 2017 (58) : 3-45,
http://wgbis.ces.iisc.ernet.in/biodiversity/sahyadri_enews/newsletter/Issue58/index.htm.
department with in core area. Buffer region has commercial activities and conversion of coffee
estates to rubber plantations, due to which agricultural activities may come down (Table 11) by
8.39% (2026). The scrub forest and horticultural activities are shown as steady state. Built-up area
is predicted to increase by a marginal value. Even though there are 6 villages (Bhagamandala,
Thannimani, Cherangala, Sannapulikotu, Aiyangeri and Perur) within the wildlife sanctuary but
due to lesser population the impact is minimum.
Table 11: LU analysis of Talacauvery WLS considering 10 km Buffer
Category ACTUAL LU_2016 SIMULATED_2016 PREDICTED_2026
Ha % Ha % Ha %
Ever green to semi
evergreen forest 44191.63 46.22 41352.12 43.25 44499.51 45.84
Deciduous forest 12783.26 13.37 11835.45 12.38 13919.22 14.34
Scrub_Grass 1587.15 1.66 3977.64 4.16 1460.97 1.50
Forest Plantations 0 0 0 0 0 0
Horticulture 29304.92 30.65 27449.19 28.71 29214.00 30.09
Agriculture 2418.97 2.53 3897.27 4.08 2600.37 2.68
Water 0 0 0 0 0 0
Built-up area 573.67 0.60 582.93 0.61 725.94 0.75
Open area 4742.33 4.96 6516.90 6.82 4665.60 4.81
Total Area 95611.50
Accuracy of
simulation
Kno Klocation Kstandard
0.83 0.77 0.74

Citation: Ramachandra T.V, Setturu Bharath, Nimish Guptha, Bhargavi R Sharma 2017, Modeling and
Visualization of Forest Cover Transition in Protected Areas, Sahyadri E-news, 2017 (58) : 3-45,
http://wgbis.ces.iisc.ernet.in/biodiversity/sahyadri_enews/newsletter/Issue58/index.htm.

Citation: Ramachandra T.V, Setturu Bharath, Nimish Guptha, Bhargavi R Sharma 2017, Modeling and
Visualization of Forest Cover Transition in Protected Areas, Sahyadri E-news, 2017 (58) : 3-45,
http://wgbis.ces.iisc.ernet.in/biodiversity/sahyadri_enews/newsletter/Issue58/index.htm.
Figure 9: Simulated and Predicted LU of TWLS.
10. Nagarhole National Park (NNP)
Nagarahole National Park is located in Mysore and Coorg district and comprises of three forest
ranges namely Nagarhole, Kallahalla and Thitimathi. In past, the park was an exclusive hunting
reserve of the king of Mysore. During 1870-1980, around 15% of the forest was cleared and was
replaced by teak plantation. Predicted map of 2026 shows the degradation of deciduous forest
cover by 3.35% while the scrub forest is expected to be increased. The evergreen forest patches
are retained. The built up area is expected to increase due to which the forest plantation as well as

Citation: Ramachandra T.V, Setturu Bharath, Nimish Guptha, Bhargavi R Sharma 2017, Modeling and
Visualization of Forest Cover Transition in Protected Areas, Sahyadri E-news, 2017 (58) : 3-45,
http://wgbis.ces.iisc.ernet.in/biodiversity/sahyadri_enews/newsletter/Issue58/index.htm.
commercial plantation shows an increasing trend while the agricultural activities shows no change.
The horticulture region shown a positive change in is cover due to commercial activities and land
transformation. The uncontrolled land conversion has resulted in less water availability and
drought like conditions towards Mysore district side (East). The protected area faces various
problems such as poaching activities, invasion of weed, increasing human habitation, smuggling
of timber, frequent forest fires (Natural and human induced). The tribal people in the region
depends on forest for grazing, timber and fuel-wood and also practice agriculture. Due to rich flora
and fauna, the tourism activity in the region is another cause of degradation and increased human-
animal conflict.
Table 12: LU analysis of NNP considering 10 km Buffer
Category ACTUAL LU_2016 SIMULATED_2016 PREDICTED_2026
Ha % Ha % Ha %
Ever green to semi
evergreen forest 7453.53 3.09 2916.18 1.19 12930.48 5.32
Deciduous forest 105100.56 43.51 115637.40 47.01 97679.52 40.16
Scrub_Grass 16492.32 6.83 16179.21 6.58 17414.37 7.16
Forest Plantations 1637.91 0.68 2307.24 0.94 2806.11 1.15
Horticulture 40560.03 16.79 32501.61 13.21 41734.44 17.16
Agriculture 61877.34 25.62 53759.52 21.85 61123.05 25.13
Water 4841.64 2.00 4925.97 2.00 4806.45 1.98
Built-up area 2228.31 0.92 3411.81 1.39 2388.78 0.98
Open area 1358.73 0.56 14355.00 5.84 2340.90 0.96
Total Area 245993.94
Accuracy of
simulation
Kno Klocation Kstandard
0.89 0.86 0.81

Citation: Ramachandra T.V, Setturu Bharath, Nimish Guptha, Bhargavi R Sharma 2017, Modeling and
Visualization of Forest Cover Transition in Protected Areas, Sahyadri E-news, 2017 (58) : 3-45,
http://wgbis.ces.iisc.ernet.in/biodiversity/sahyadri_enews/newsletter/Issue58/index.htm.

Citation: Ramachandra T.V, Setturu Bharath, Nimish Guptha, Bhargavi R Sharma 2017, Modeling and
Visualization of Forest Cover Transition in Protected Areas, Sahyadri E-news, 2017 (58) : 3-45,
http://wgbis.ces.iisc.ernet.in/biodiversity/sahyadri_enews/newsletter/Issue58/index.htm.
Figure 10: Simulated and Predicted LU of NNP
11. Bandipur National Park (BANP)
Bandipur National Park is located in Mysore and Chamarajanagar district of Karnataka, at foot
hills of Western Ghats with an area of 874.20 sq. km. Prediction map of 2026 shows that the
deciduous forest follows the degradation trend and will reduce by 3.21%. The scrub forest tends
to increase by 5.42% in the south-eastern part of the national park (Table 13). The agricultural
activities and the commercial plantations remains same while the built-up area increases signifying
growth in human population within the 10 km buffer region of the protected area. BNP faces forest

Citation: Ramachandra T.V, Setturu Bharath, Nimish Guptha, Bhargavi R Sharma 2017, Modeling and
Visualization of Forest Cover Transition in Protected Areas, Sahyadri E-news, 2017 (58) : 3-45,
http://wgbis.ces.iisc.ernet.in/biodiversity/sahyadri_enews/newsletter/Issue58/index.htm.
fire (natural and man-made) frequently in 2014 2427.707 Ha of forest are lost due to fire. Recently,
in 2017 1000 Ha of forest area lost due to fire, emphasizing need of effective management. The
protected area faces many human induced problems such as poaching activities, encroachments,
illegal logging of fuel-wood, weed infestation, grazing by animals within the national park. Due
to non-effective eco-management, the human animal conflicts is more and loss of crop is high.
Fire, weeds infestation and deforestation has resulted in barren hill tops in eastern side of buffer
and some core portion. Tourism activities are creating pressure on the forest, wild life. All these
problems if continued will enhance the degradation the forest in future. The analysis also highlights
how these cumulative drivers impact forest cover by 2026 with loss from 47.30 to 44.09 %. The
deciduous cover has lost due to fire and land transformation in eastern side of buffer region.
Table 13: LU analysis of BANP considering 10 km Buffer
Category ACTUAL LU_2016 SIMULATED_2016 PREDICTED_2026
Ha % Ha % Ha %
Ever green to semi
evergreen forest 3262.71 0.89 7132.86 1.95 3879.72 1.06
Deciduous forest 173062.99 47.30 159530.22 43.58 161340.30 44.09
Scrub_Grass 93593.87 25.58 64878.21 17.72 113419.08 31.00
Forest Plantations 478.36 0.13 478.89 0.13 478.89 0.13
Horticulture 10607.78 2.90 12280.68 3.35 12135.96 3.32
Agriculture 65011.30 17.77 112497.75 30.73 53478.18 14.62
Water 4992.39 1.36 5027.31 1.37 5034.51 1.38
Built-up area 3942.05 1.08 2757.06 0.75 4414.59 1.21
Open area 10956.82 2.99 1467.99 0.40 11728.44 3.21
Total Area 366050.97
Accuracy of
simulation
Kno Klocation Kstandard
0.82 0.86 0.75

Citation: Ramachandra T.V, Setturu Bharath, Nimish Guptha, Bhargavi R Sharma 2017, Modeling and
Visualization of Forest Cover Transition in Protected Areas, Sahyadri E-news, 2017 (58) : 3-45,
http://wgbis.ces.iisc.ernet.in/biodiversity/sahyadri_enews/newsletter/Issue58/index.htm.
Figure 11: Simulated and Predicted LU of BANP

Citation: Ramachandra T.V, Setturu Bharath, Nimish Guptha, Bhargavi R Sharma 2017, Modeling and
Visualization of Forest Cover Transition in Protected Areas, Sahyadri E-news, 2017 (58) : 3-45,
http://wgbis.ces.iisc.ernet.in/biodiversity/sahyadri_enews/newsletter/Issue58/index.htm.
12. MM-Hills Wildlife Sanctuary (MMHWLS)
MMHWLS is located in Kollegal taluk of Chamarajanagar, serves as a corridor between BRT
Tiger Reserve and Cauvery Wildlife Sanctuary. Predicted map of 2026 shows that the deciduous
forest continues to decrease (2.26%) and convert into scrub forest. The horticultural and
agricultural activities remain steady state. Prediction shows that there is a slight increase in built-
up area (351.36 Ha). This can be considered as the main reason of continuous degradation of forest
and decrement in the water bodies (0.09%). Soligas and Lingayats are the dominating communities
present in the MM Hills. Temple festivals every year draws millions of devotees to come, and this
causes degradation. Non-timber products are the main source of livelihood for these communities.
Other than religious tourism, there were mining activities for black granite practiced in the region
till 1996 and at present there is a huge pressure to restart the quarry work in the sanctuary which
will enhance the degradation. Considering degradation from 2016-2026 as %, regulatory agencies
should not allow any activities that harm ecosystem. The buffer region has gomla lands, which can
be used for grazing through effective management by community.
Table 14: LU analysis of MMHWLS considering 10 km Buffer
Category ACTUAL LU_2016 SIMULATED_2016 PREDICTED_2026
Ha % Ha % Ha %
Ever green to semi
evergreen forest 3384.40 1.1 2677.20 0.85 4415.58 1.42
Deciduous forest 202713.27 66.13 212118.54 67.70 198591.34 63.87
Scrub_Grass 34725.69 11.33 40350.28 12.88 42428.60 13.65
Forest Plantations 0 0 0 0 0 0
Horticulture 3114.37 1.02 36.54 0.01 2880.33 0.93
Agriculture 54838.09 17.89 53898.54 17.20 55290.05 17.78
Water 1026.68 0.33 2023.60 0.65 740.99 0.24
Built-up area 1623.19 0.53 696.34 0.22 1974.55 0.64
Open area 5097.91 1.66 1516.62 0.48 4614.76 1.48
Total Area 313317.66 Ha
Accuracy of
simulation
Kno Klocation Kstandard
0.85 0.80 0.77

Citation: Ramachandra T.V, Setturu Bharath, Nimish Guptha, Bhargavi R Sharma 2017, Modeling and
Visualization of Forest Cover Transition in Protected Areas, Sahyadri E-news, 2017 (58) : 3-45,
http://wgbis.ces.iisc.ernet.in/biodiversity/sahyadri_enews/newsletter/Issue58/index.htm.

Citation: Ramachandra T.V, Setturu Bharath, Nimish Guptha, Bhargavi R Sharma 2017, Modeling and
Visualization of Forest Cover Transition in Protected Areas, Sahyadri E-news, 2017 (58) : 3-45,
http://wgbis.ces.iisc.ernet.in/biodiversity/sahyadri_enews/newsletter/Issue58/index.htm.
Figure 12: Simulated and Predicted LU of MMHWLS.
13. Biligirirangaswamy Temple Tiger Reserve (BRT)
BRT Tiger Reserve is located in Chamarajanagar district of Karnataka, acts as a connector between
Eastern and Western Ghats. The crest and troughs in the protected area allows diverge flora and
fauna in the region. Prediction map of 2026 shows that there is a reduction in deciduous forest by
1.60% and increase in forest plantations. The built-up area increases while open area reduces. The
agricultural activities and horticultural practices remains unchanged. There is a slight increment in
evergreen forest at the top of the hill because of less interference by humans. The soligas who were
hunters and shifting cultivators are residents of BRT. They are given a land after the declaration
Citation: Ramachandra T.V, Setturu Bharath, Nimish Guptha, Bhargavi R Sharma 2017, Modeling and
Visualization of Forest Cover Transition in Protected Areas, Sahyadri E-news, 2017 (58) : 3-45,
http://wgbis.ces.iisc.ernet.in/biodiversity/sahyadri_enews/newsletter/Issue58/index.htm.
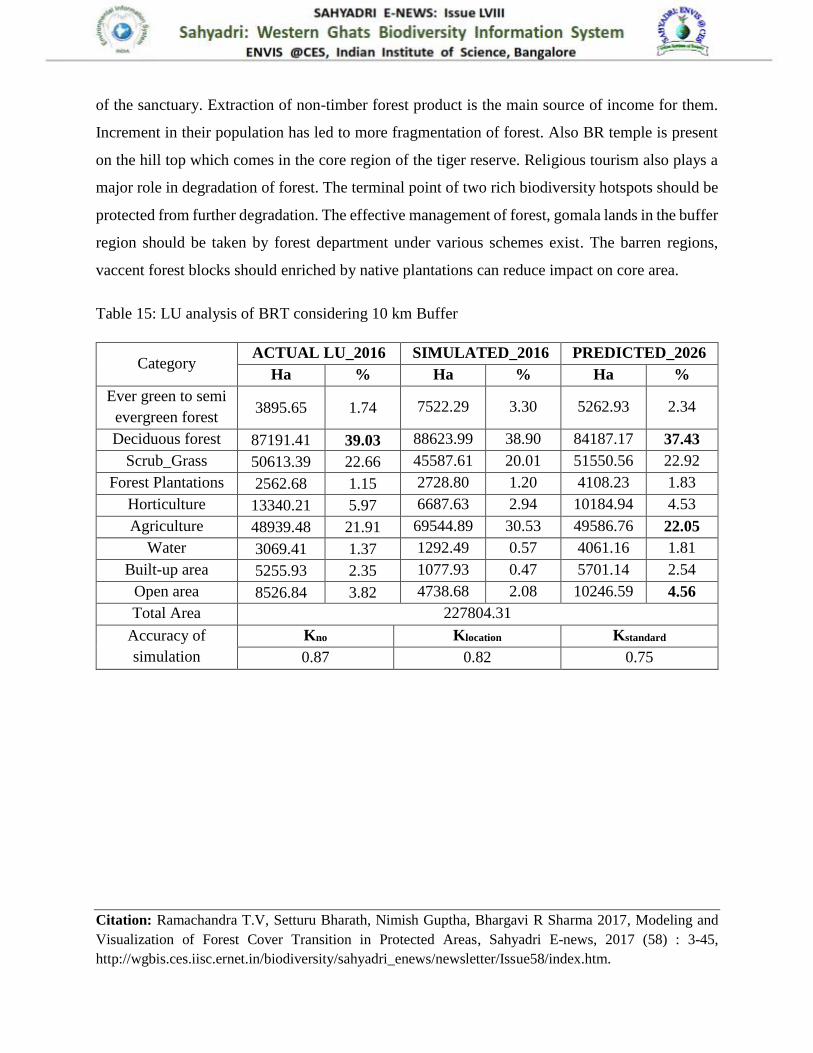
of the sanctuary. Extraction of non-timber forest product is the main source of income for them.
Increment in their population has led to more fragmentation of forest. Also BR temple is present
on the hill top which comes in the core region of the tiger reserve. Religious tourism also plays a
major role in degradation of forest. The terminal point of two rich biodiversity hotspots should be
protected from further degradation. The effective management of forest, gomala lands in the buffer
region should be taken by forest department under various schemes exist. The barren regions,
vaccent forest blocks should enriched by native plantations can reduce impact on core area.
Table 15: LU analysis of BRT considering 10 km Buffer
Category ACTUAL LU_2016 SIMULATED_2016 PREDICTED_2026
Ha % Ha % Ha %
Ever green to semi
evergreen forest 3895.65 1.74 7522.29 3.30 5262.93 2.34
Deciduous forest 87191.41 39.03 88623.99 38.90 84187.17 37.43
Scrub_Grass 50613.39 22.66 45587.61 20.01 51550.56 22.92
Forest Plantations 2562.68 1.15 2728.80 1.20 4108.23 1.83
Horticulture 13340.21 5.97 6687.63 2.94 10184.94 4.53
Agriculture 48939.48 21.91 69544.89 30.53 49586.76 22.05
Water 3069.41 1.37 1292.49 0.57 4061.16 1.81
Built-up area 5255.93 2.35 1077.93 0.47 5701.14 2.54
Open area 8526.84 3.82 4738.68 2.08 10246.59 4.56
Total Area 227804.31
Accuracy of
simulation
Kno Klocation Kstandard
0.87 0.82 0.75
Citation: Ramachandra T.V, Setturu Bharath, Nimish Guptha, Bhargavi R Sharma 2017, Modeling and
Visualization of Forest Cover Transition in Protected Areas, Sahyadri E-news, 2017 (58) : 3-45,
http://wgbis.ces.iisc.ernet.in/biodiversity/sahyadri_enews/newsletter/Issue58/index.htm.

Citation: Ramachandra T.V, Setturu Bharath, Nimish Guptha, Bhargavi R Sharma 2017, Modeling and
Visualization of Forest Cover Transition in Protected Areas, Sahyadri E-news, 2017 (58) : 3-45,
http://wgbis.ces.iisc.ernet.in/biodiversity/sahyadri_enews/newsletter/Issue58/index.htm.
Figure 13: Simulated and Predicted LU of BRT.
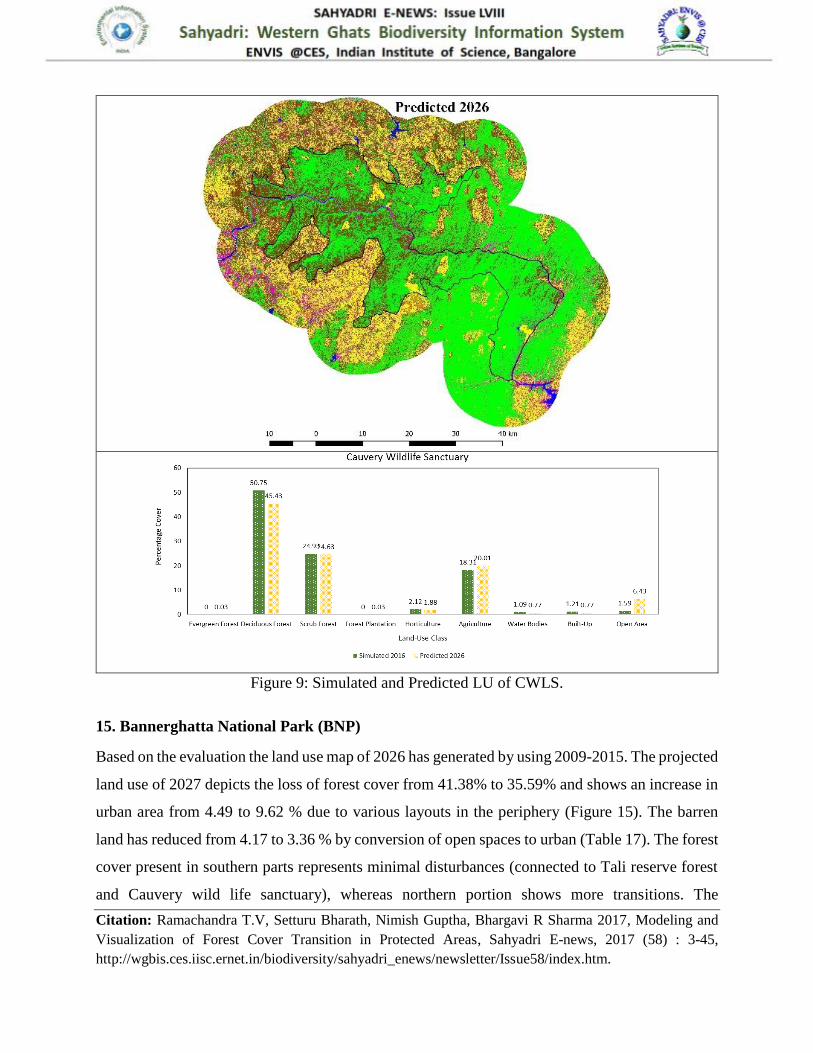
14. Cauvery Wildlife Sanctuary (CWLS)
Cauvery Wildlife Sanctuary is located in the district of Chamarajanagar, Ramanagar and Mandya
in Karnataka, located at the banks of river Cauvery. The predicted 2026 map shows the continued
decrement in the deciduous forest (3.26%) and increment in the scrub forest (7.44%). Prediction
shows that the agricultural and commercial plantation remains same. The built-up area remains
almost same while there is a slight decrease in the open area (0.68%). Forest plantations are
predicted to come up in future. The forest degradation continues because of more human
intervention as various tourist spots such as Mekedhatu and hogenakal falls are present within the

Citation: Ramachandra T.V, Setturu Bharath, Nimish Guptha, Bhargavi R Sharma 2017, Modeling and
Visualization of Forest Cover Transition in Protected Areas, Sahyadri E-news, 2017 (58) : 3-45,
http://wgbis.ces.iisc.ernet.in/biodiversity/sahyadri_enews/newsletter/Issue58/index.htm.
buffer region of CWLS. Another reason for degradation is practising the religious activities inside
the protected area (Muthathi – present in North-western part of the CWLS). Due to pressure on
forest for various human needs, fragmentation in the region has increased which has led to drought
conditions and will further affect the biodiversity in the protected area.
Table 16: LU analysis of CWLS considering 10 km Buffer
Category ACTUAL LU_2016 SIMULATED_2016 PREDICTED_2026
Ha % Ha % Ha %
Ever green to semi
evergreen forest 0 0 0 0 126 0.03
Deciduous forest 197619.42 48.69 209005.02 50.75 185072.58 45.43
Scrub_Grass 69789.38 17.19 102679.65 24.93 100359.54 24.63
Forest Plantations 0 0 0 0 126 0.03
Horticulture 7102.26 1.75 8737.56 2.12 7669.62 1.88
Agriculture 95303.98 23.48 75405.24 18.31 81528.75 20.01
Water 3266.79 0.8 4471.11 1.09 3154.95 0.77
Built-up area 3959.89 0.98 4979.61 1.21 3152.79 0.77
Open area 28872.60 7.11 6527.61 1.59 26211.15 6.43
Total Area 411805.80 Ha
Accuracy of
simulation
Kno Klocation Kstandard
0.93 0.96 0.91
Citation: Ramachandra T.V, Setturu Bharath, Nimish Guptha, Bhargavi R Sharma 2017, Modeling and
Visualization of Forest Cover Transition in Protected Areas, Sahyadri E-news, 2017 (58) : 3-45,
http://wgbis.ces.iisc.ernet.in/biodiversity/sahyadri_enews/newsletter/Issue58/index.htm.
Figure 9: Simulated and Predicted LU of CWLS.
15. Bannerghatta National Park (BNP)
Based on the evaluation the land use map of 2026 has generated by using 2009-2015. The projected
land use of 2027 depicts the loss of forest cover from 41.38% to 35.59% and shows an increase in
urban area from 4.49 to 9.62 % due to various layouts in the periphery (Figure 15). The barren
land has reduced from 4.17 to 3.36 % by conversion of open spaces to urban (Table 17). The forest
cover present in southern parts represents minimal disturbances (connected to Tali reserve forest
and Cauvery wild life sanctuary), whereas northern portion shows more transitions. The

Citation: Ramachandra T.V, Setturu Bharath, Nimish Guptha, Bhargavi R Sharma 2017, Modeling and
Visualization of Forest Cover Transition in Protected Areas, Sahyadri E-news, 2017 (58) : 3-45,
http://wgbis.ces.iisc.ernet.in/biodiversity/sahyadri_enews/newsletter/Issue58/index.htm.
uncontrolled and unplanned growth of greater Bangalore would have irreversible impact on forests
of BNP. Kolifram gate, Batterayana Doddi village, Weavers colony, Kalkere region and
Bannerghatta village, Anekal road represents higher loss in forest cover due to new paved surfaces
created in the form of townships highlights the region likely to undergo major transition in 2027.
The built-up area expansion in Anekal industrial area, Kalkere, Basavanapura and Weavers colony,
Uttarahalli Manavartha Kaval are the major regions represents urban growth.
Table 17: Simulated and projected land use of BNP from 2015-2027.
Categories ACTUAL LU_2015 SIMULATED_2015 PREDICTED_2027
Ha % Ha % Ha %
Forest 50372.60 41.38 49444.88 40.62 43315.05 35.59
Agriculture 58977.00 48.45 58208.18 48.64 60207.03 49.46
Barren land 5075.30 4.17 6668.57 4.66 4460.76 3.66
Water 1834.00 1.51 2011.68 1.65 2031.11 1.67
Urban 5462.10 4.49 5387.75 4.43 11707.15 9.62
Total area 121721.06
Accuracy of simulation Kno Klocation Kstandard
0.93 0.86 0.87

Citation: Ramachandra T.V, Setturu Bharath, Nimish Guptha, Bhargavi R Sharma 2017, Modeling and
Visualization of Forest Cover Transition in Protected Areas, Sahyadri E-news, 2017 (58) : 3-45,
http://wgbis.ces.iisc.ernet.in/biodiversity/sahyadri_enews/newsletter/Issue58/index.htm.
Figure 15: Simulated and projected LU of BNP with 5km buffer.
References:
1. Amato, A.W., Bradford, J.B., Fraver, S. & Palik, B.J. 2011. Forest management for mitigation
and adaptation to climate change: insights from long-term silvicultural experiments. Forest
Ecology and Management 262 (5): 803-816.
2. Bharath Setturu, Rajan, K.S., Ramchandra, T.V., 2014. Status and future transition of rapid
urbanizing landscape in Central Western Ghats – CA based approach, ISPRS Technical
Commission VIII Symposium, 09-12 December 2014.
3. Bharath Setturu, Rajan, K.S., Ramchandra, T.V., 2016. Geo-visualisation of landscape
dynamics in Sirsi and Haliyal forest divisions of Central Western Ghats, proceedings of

Citation: Ramachandra T.V, Setturu Bharath, Nimish Guptha, Bhargavi R Sharma 2017, Modeling and
Visualization of Forest Cover Transition in Protected Areas, Sahyadri E-news, 2017 (58) : 3-45,
http://wgbis.ces.iisc.ernet.in/biodiversity/sahyadri_enews/newsletter/Issue58/index.htm.
National Conference on Challenges of Civil Engineering Innovations (NCCCEI 2016), At
Bangalore from 4-5 May, 2016; Sri Venkateshwara College of Engineering NH 7, Vidyanagar,
Bengaluru International Airport Road, Bengaluru - 562157.
4. Bharath Setturu, Rajan, K.S., Ramchandra, T.V., 2017. Geo-Visualization of land cover
transitions in Karwar region of Central Western Ghats, International symposium on Water
Urbanism and Infrastructure Development in Eco-Sensitive Zones, Hyatt Regency, Kolkata,
India 6-7 January 2017,
5. Dang, A.N. and Kawasaki, A., 2017. Integrating biophysical and socio-economic factors for
land-use and land-cover change projection in agricultural economic regions. Ecological
Modelling, 344, pp.29-37.
6. Guan, D., Li, H., Inohae, T., Su, W., Nagaie, T. and Hokao, K., 2011. Modeling urban land
use change by the integration of cellular automaton and Markov model. Ecological Modelling,
222(20), pp.3761-3772.
7. Halmy, M.W.A., Gessler, P.E., Hicke, J.A. and Salem, B.B., 2015. Land use/land cover change
detection and prediction in the north-western coastal desert of Egypt using Markov-CA.
Applied Geography, 63, pp.101-112.
8. Hyandye, C. and Martz, L.W., 2017. A Markovian and cellular automata land-use change
predictive model of the Usangu Catchment. International Journal of Remote Sensing, 38(1),
pp.64-81.
9. Liu, X., Ou, J., Li, X. and Ai, B., 2013. Combining system dynamics and hybrid particle swarm
optimization for land use allocation. Ecological Modelling, 257, pp.11-24.
10. Overmars, K.P., De Koning, G.H.J. and Veldkamp, A., 2003. Spatial autocorrelation in multi-
scale land use models. Ecological modelling, 164(2), pp.257-270.
11. Pontius, G.R. and Malanson, J., 2005. Comparison of the structure and accuracy of two land
change models. International Journal of Geographical Information Science, 19(2), pp.243-265.
12. Ramachandra, T.V., Setturu, B., Rajan, K.S. and Chandran, M.S., Modelling the forest
transition in Central Western Ghats, India. Spatial Information Research, pp.1-14.
13. Saaty, T.L., 2008. Decision making with the analytic hierarchy process. International journal
of services sciences, 1(1), pp.83-98.

Citation: Ramachandra T.V, Setturu Bharath, Nimish Guptha, Bhargavi R Sharma 2017, Modeling and
Visualization of Forest Cover Transition in Protected Areas, Sahyadri E-news, 2017 (58) : 3-45,
http://wgbis.ces.iisc.ernet.in/biodiversity/sahyadri_enews/newsletter/Issue58/index.htm.
14. Sinha, P. and Kumar, L., 2013. Markov land cover change modeling using pairs of time-series
satellite images. Photogramm. Eng. Remote Sens, 79(11), p.11.
15. Tayyebi, A., Perry, P.C. and Tayyebi, A.H., 2014. Predicting the expansion of an urban
boundary using spatial logistic regression and hybrid raster–vector routines with remote
sensing and GIS. International Journal of Geographical Information Science, 28(4), pp.639-
659.
16. Von Neumann, J., 1966. Theory of Selfreproducing Automata (edited and completed by A. W.
Burks), Univ. of Illinois Press, 388 pp.
17. Yuan, H., Van Der Wiele, C.F. and Khorram, S., 2009. An automated artificial neural network
system for land use/land cover classification from Landsat TM imagery. Remote Sensing, 1(3),
pp.243-265.