modeling aquifer-system compaction and predicting land...
TRANSCRIPT

Engineering Geology 147-148 (2012) 78–90
Contents lists available at SciVerse ScienceDirect
Engineering Geology
j ourna l homepage: www.e lsev ie r .com/ locate /enggeo
Modeling aquifer-system compaction and predicting land subsidence incentral Taiwan
Wei-Chia Hung a, Cheinway Hwang b,⁎, Jyh-Chau Liou a, Yan-Syun Lin a, Hsiu-Lung Yang a
a Green Energy and Environment Research Laboratories, Industrial Technology Research Institute, Bldg. 24, 195 Sec. 4, Chung Hsing Rd., Chutung, Hsinchu 310, Taiwanb Department of Civil Engineering, National Chiao Tung University, 1001 Ta Hsueh Rd., Hsinchu 300, Taiwan
⁎ Corresponding author at: Department of Civil EngUniversity, 1001 Ta Hsueh Road, Hsinchu 300, Taiwan.
E-mail address: [email protected] (C. Hwhttp://space.cv.nctu.edu.tw (C. Hwang).
0013-7952/$ – see front matter © 2012 Elsevier B.V. Allhttp://dx.doi.org/10.1016/j.enggeo.2012.07.018
a b s t r a c t
a r t i c l e i n f oArticle history:Received 18 July 2011Received in revised form 18 July 2012Accepted 25 July 2012Available online 3 August 2012
Keywords:COMPACChanghuaGPSLand subsidenceMonitoring well
Changhua is a county in central Taiwan that will house severalmajor economic development projects. Extractinggroundwater has caused large-scale land subsidence in Changhua, with the largest cumulative subsidence being210 cm over 1992–2010. A multi-sensor monitoring system consisting of continuous GPS stations, a levelingnetwork, multi-layer compaction monitoring wells and groundwater wells is deployed to monitor land subsi-dence and its mechanism in Changhua. Data from the monitoring well CGSG in Dacheng Township of Changhuashow a cumulative compaction of 110.6 cm over 1997–2010, occurring mainly at two aquifers and one aquitard.A novel combination of GPS andmonitoringwell data was used to determine the stress–strain relations. The stra-tumcompaction turns fromplasticity to elastoplasticity after a long-term compaction at the second aquifer belowthe surface. Four hydrogeological parameters of the three sediment layers in Dacheng, vertical hydraulic conduc-tivity, elastic skeletal specific storage, inelastic skeletal specific storage, and the initialmaximumpreconsolidationstress, in the one‐dimensional compaction model COMPAC, are estimated using the genetic algorithm. With theparameters, COMPAC predicts compactions to an accuracy consistent with in situ measurements, and the meanabsolute percentage errors of prediction are below 10%. The result provides a key reference for water manage-ment in central Taiwan.
© 2012 Elsevier B.V. All rights reserved.
1. Introduction
In many parts of theworld, large consumptions of water due to pop-ulation and industry growths demand the use of groundwater to sup-plement surface water. Existing studies suggest that over-withdrawingof groundwater will cause land subsidence. Examples of groundwater-induced subsidence are in Mexico (Carreón-Freyre and Cerca, 2006;Lopez-Quiroz et al., 2009), United States (Galloway and Hoffmann,2007; Burbey, 2008), Japan (Munekane et al., 2008), Italy (Ferronatoet al., 2004; Teatini et al., 2005), mainland China (Hu et al., 2009; Wuet al., 2010), and Taiwan (Hu et al., 2006; Hung et al., 2010). In general,land subsidence occurs over regions with sediment stratums formed byrivers, lakes, sloughs and structural basins, where groundwater declinecan easily cause stratum compaction.
Taiwan is an island surrounded by oceans, with an average annualrainfall over 2,000 mm. However, the rainfalls are distributed unevenlythroughout the year. Due to a large topographic relief, limited spacesand natural hazards, storing surface water in Taiwan is difficult. Mostman-made reservoirs in Taiwan are prone to sediment by typhoons,
ineering, National Chiao TungFax: +886 3 5716257.ang).URL:
rights reserved.
making water storage even more challenging. Therefore, in many partsof Taiwan, groundwater becomes the major source of water, especiallyduring dry seasons. Because groundwater is not effectively replenishedduring wet seasons, the long-term groundwater of Taiwan level hasbeen declining. Also, recent climate anomalies (extreme dry and wetweathers) make it more difficult to allocate available water resources(Hsu et al., 2007).
Changhua County (Figure 1) is located north of the Choushui RiverAlluvial Fan in central Taiwan, and is an area with abundant groundwa-ter. During the 1970s, the agriculture and aquaculture in this area grewdramatically. Due to lack of sufficient surface water, massive amount ofgroundwater has been withdrawn, resulting in severe land subsidence,especially in coastal areas. Hundreds of square kilometers in ChanghuaCounty have been affected by land subsidence, which also caused fail-ures and deformations of man-made structures such as houses andrail (Hung and Liou, 2009). Changhua will housemanymajor economicdevelopment projects,with funds drawn fromTaiwan and internationalinvestors. For example, Dacheng Township of Changhua Countywas theproposed site of the Kuokuang Petrochemical Development Project,whichwas initiated in 2005with a total investment of aboutUSD 30 bil-lions. Despite the importance of this project on the long-term economicdevelopment of Taiwan, this project is suspended because of concernsabout land subsidence, large water consumption and damage to sus-tainable development. Local people of Dacheng fear that this petro-chemical project will deteriorate the already serious land subsidence
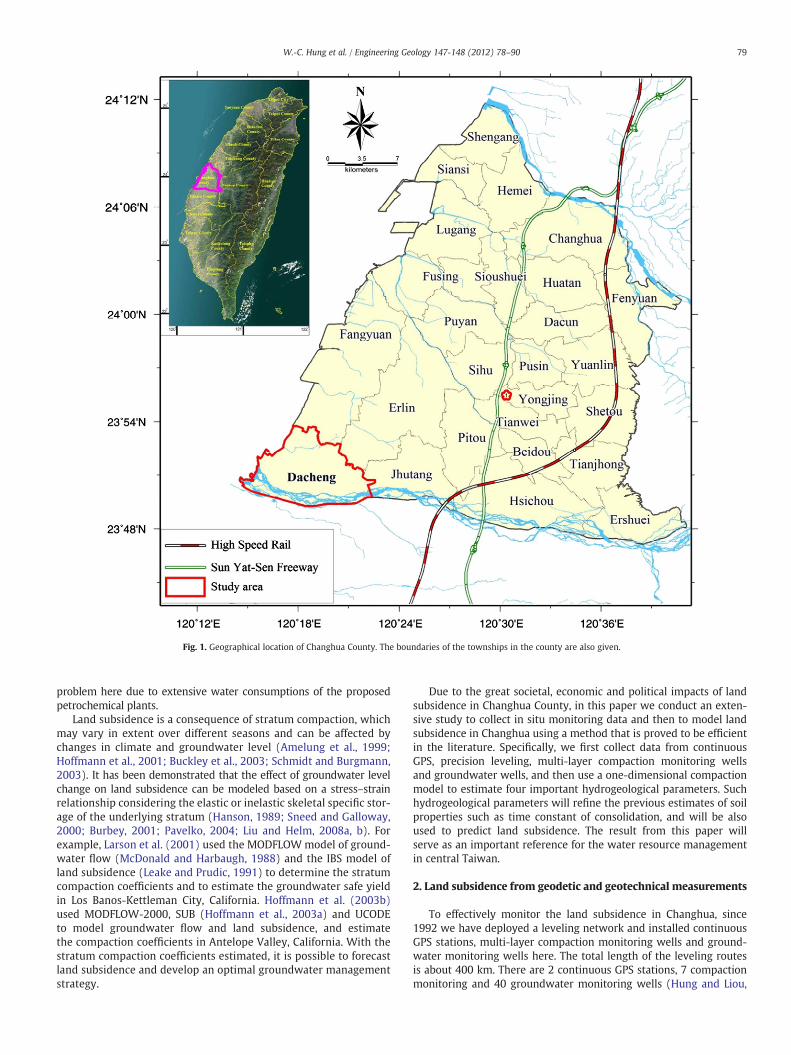
Fig. 1. Geographical location of Changhua County. The boundaries of the townships in the county are also given.
79W.-C. Hung et al. / Engineering Geology 147-148 (2012) 78–90
problem here due to extensive water consumptions of the proposedpetrochemical plants.
Land subsidence is a consequence of stratum compaction, whichmay vary in extent over different seasons and can be affected bychanges in climate and groundwater level (Amelung et al., 1999;Hoffmann et al., 2001; Buckley et al., 2003; Schmidt and Burgmann,2003). It has been demonstrated that the effect of groundwater levelchange on land subsidence can be modeled based on a stress–strainrelationship considering the elastic or inelastic skeletal specific stor-age of the underlying stratum (Hanson, 1989; Sneed and Galloway,2000; Burbey, 2001; Pavelko, 2004; Liu and Helm, 2008a, b). Forexample, Larson et al. (2001) used the MODFLOW model of ground-water flow (McDonald and Harbaugh, 1988) and the IBS model ofland subsidence (Leake and Prudic, 1991) to determine the stratumcompaction coefficients and to estimate the groundwater safe yieldin Los Banos-Kettleman City, California. Hoffmann et al. (2003b)used MODFLOW-2000, SUB (Hoffmann et al., 2003a) and UCODEto model groundwater flow and land subsidence, and estimatethe compaction coefficients in Antelope Valley, California. With thestratum compaction coefficients estimated, it is possible to forecastland subsidence and develop an optimal groundwater managementstrategy.
Due to the great societal, economic and political impacts of landsubsidence in Changhua County, in this paper we conduct an exten-sive study to collect in situ monitoring data and then to model landsubsidence in Changhua using a method that is proved to be efficientin the literature. Specifically, we first collect data from continuousGPS, precision leveling, multi-layer compaction monitoring wellsand groundwater wells, and then use a one-dimensional compactionmodel to estimate four important hydrogeological parameters. Suchhydrogeological parameters will refine the previous estimates of soilproperties such as time constant of consolidation, and will be alsoused to predict land subsidence. The result from this paper willserve as an important reference for the water resource managementin central Taiwan.
2. Land subsidence from geodetic and geotechnical measurements
To effectively monitor the land subsidence in Changhua, since1992 we have deployed a leveling network and installed continuousGPS stations, multi-layer compaction monitoring wells and ground-water monitoring wells here. The total length of the leveling routesis about 400 km. There are 2 continuous GPS stations, 7 compactionmonitoring and 40 groundwater monitoring wells (Hung and Liou,
80 W.-C. Hung et al. / Engineering Geology 147-148 (2012) 78–90
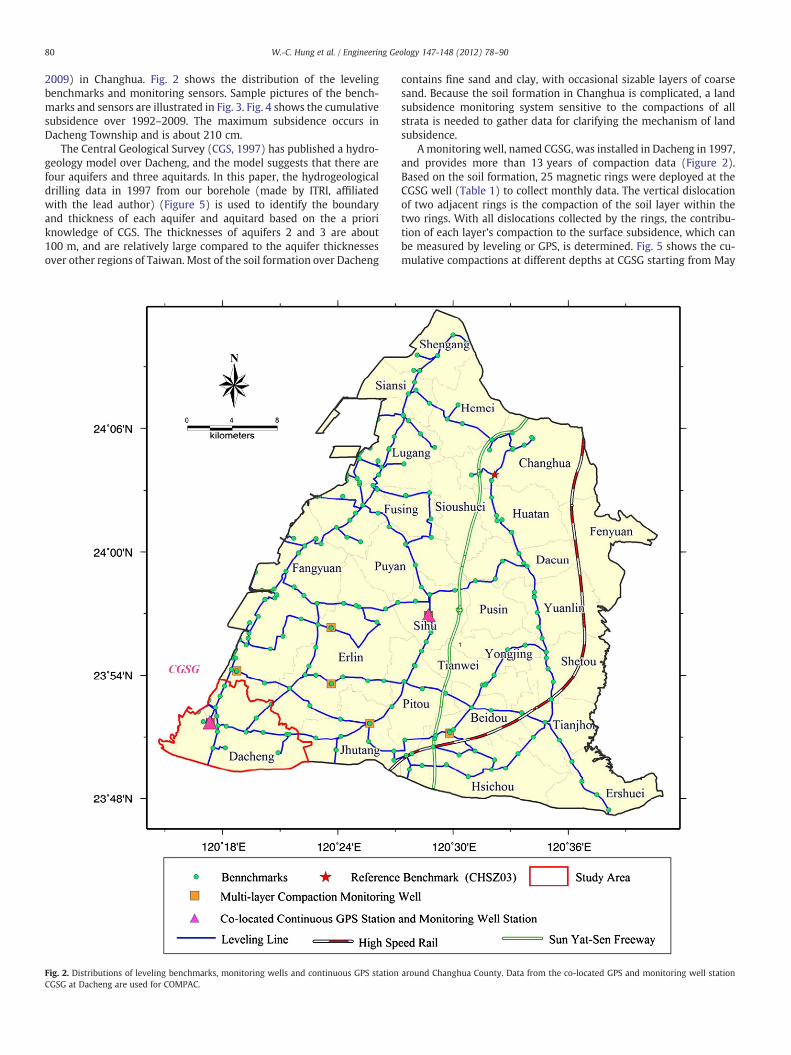
2009) in Changhua. Fig. 2 shows the distribution of the levelingbenchmarks and monitoring sensors. Sample pictures of the bench-marks and sensors are illustrated in Fig. 3. Fig. 4 shows the cumulativesubsidence over 1992–2009. The maximum subsidence occurs inDacheng Township and is about 210 cm.
The Central Geological Survey (CGS, 1997) has published a hydro-geology model over Dacheng, and the model suggests that there arefour aquifers and three aquitards. In this paper, the hydrogeologicaldrilling data in 1997 from our borehole (made by ITRI, affiliatedwith the lead author) (Figure 5) is used to identify the boundaryand thickness of each aquifer and aquitard based on the a prioriknowledge of CGS. The thicknesses of aquifers 2 and 3 are about100 m, and are relatively large compared to the aquifer thicknessesover other regions of Taiwan. Most of the soil formation over Dacheng
Fig. 2. Distributions of leveling benchmarks, monitoring wells and continuous GPS stationCGSG at Dacheng are used for COMPAC.
contains fine sand and clay, with occasional sizable layers of coarsesand. Because the soil formation in Changhua is complicated, a landsubsidence monitoring system sensitive to the compactions of allstrata is needed to gather data for clarifying the mechanism of landsubsidence.
A monitoring well, named CGSG, was installed in Dacheng in 1997,and provides more than 13 years of compaction data (Figure 2).Based on the soil formation, 25 magnetic rings were deployed at theCGSG well (Table 1) to collect monthly data. The vertical dislocationof two adjacent rings is the compaction of the soil layer within thetwo rings. With all dislocations collected by the rings, the contribu-tion of each layer's compaction to the surface subsidence, which canbe measured by leveling or GPS, is determined. Fig. 5 shows the cu-mulative compactions at different depths at CGSG starting from May
around Changhua County. Data from the co-located GPS and monitoring well station
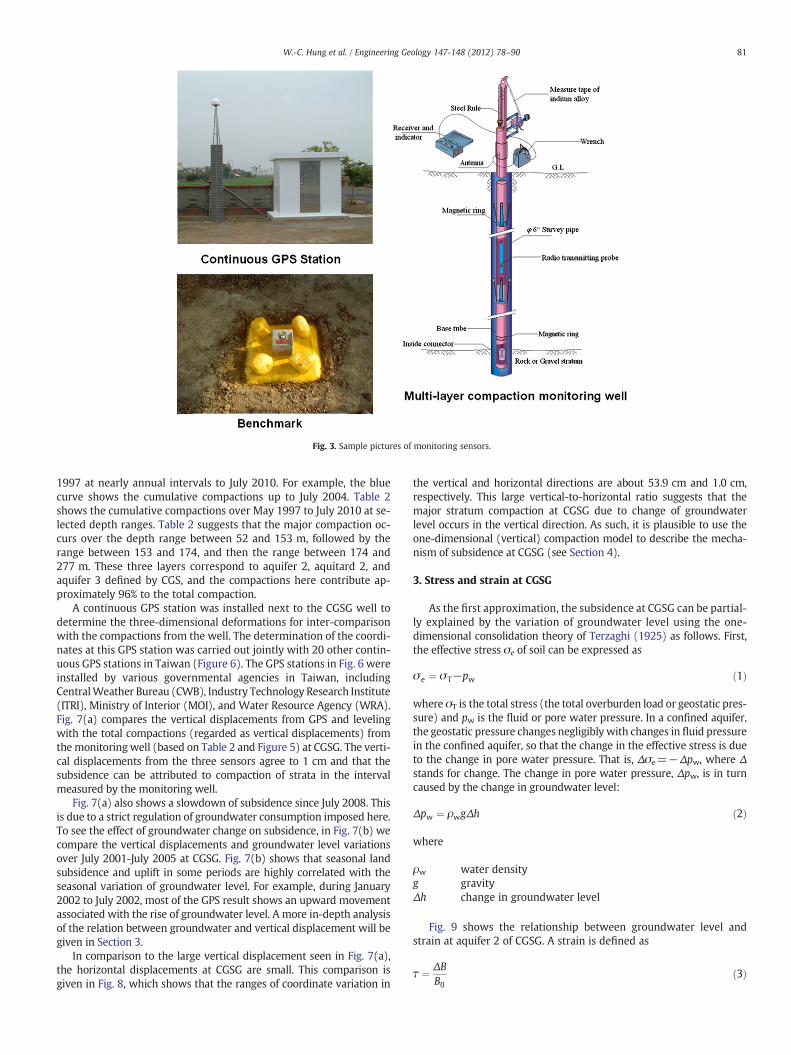
Fig. 3. Sample pictures of monitoring sensors.
81W.-C. Hung et al. / Engineering Geology 147-148 (2012) 78–90
1997 at nearly annual intervals to July 2010. For example, the bluecurve shows the cumulative compactions up to July 2004. Table 2shows the cumulative compactions over May 1997 to July 2010 at se-lected depth ranges. Table 2 suggests that the major compaction oc-curs over the depth range between 52 and 153 m, followed by therange between 153 and 174, and then the range between 174 and277 m. These three layers correspond to aquifer 2, aquitard 2, andaquifer 3 defined by CGS, and the compactions here contribute ap-proximately 96% to the total compaction.
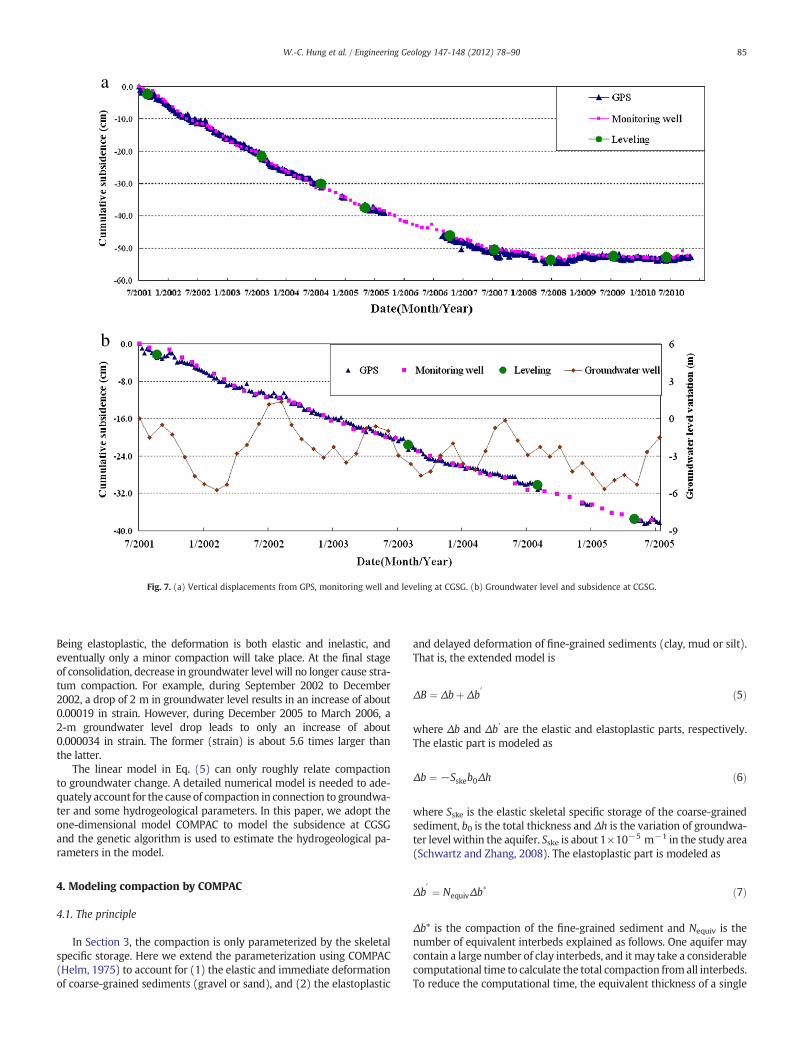
A continuous GPS station was installed next to the CGSG well todetermine the three-dimensional deformations for inter-comparisonwith the compactions from the well. The determination of the coordi-nates at this GPS station was carried out jointly with 20 other contin-uous GPS stations in Taiwan (Figure 6). The GPS stations in Fig. 6 wereinstalled by various governmental agencies in Taiwan, includingCentralWeather Bureau (CWB), Industry Technology Research Institute(ITRI), Ministry of Interior (MOI), and Water Resource Agency (WRA).Fig. 7(a) compares the vertical displacements from GPS and levelingwith the total compactions (regarded as vertical displacements) fromthemonitoring well (based on Table 2 and Figure 5) at CGSG. The verti-cal displacements from the three sensors agree to 1 cm and that thesubsidence can be attributed to compaction of strata in the intervalmeasured by the monitoring well.
Fig. 7(a) also shows a slowdown of subsidence since July 2008. Thisis due to a strict regulation of groundwater consumption imposed here.To see the effect of groundwater change on subsidence, in Fig. 7(b) wecompare the vertical displacements and groundwater level variationsover July 2001-July 2005 at CGSG. Fig. 7(b) shows that seasonal landsubsidence and uplift in some periods are highly correlated with theseasonal variation of groundwater level. For example, during January2002 to July 2002, most of the GPS result shows an upward movementassociated with the rise of groundwater level. A more in-depth analysisof the relation between groundwater and vertical displacement will begiven in Section 3.
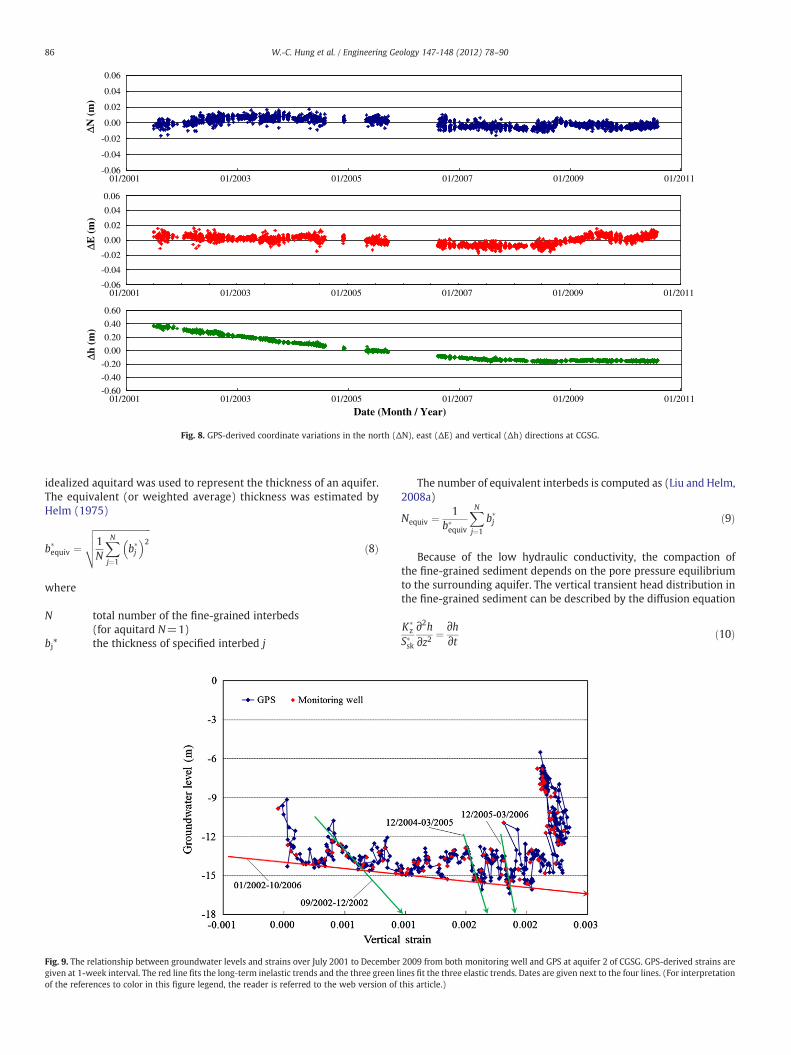
In comparison to the large vertical displacement seen in Fig. 7(a),the horizontal displacements at CGSG are small. This comparison isgiven in Fig. 8, which shows that the ranges of coordinate variation in
the vertical and horizontal directions are about 53.9 cm and 1.0 cm,respectively. This large vertical-to-horizontal ratio suggests that themajor stratum compaction at CGSG due to change of groundwaterlevel occurs in the vertical direction. As such, it is plausible to use theone-dimensional (vertical) compaction model to describe the mecha-nism of subsidence at CGSG (see Section 4).
3. Stress and strain at CGSG
As the first approximation, the subsidence at CGSG can be partial-ly explained by the variation of groundwater level using the one-dimensional consolidation theory of Terzaghi (1925) as follows. First,the effective stress σe of soil can be expressed as
σe ¼ σT−pw ð1Þ
where σT is the total stress (the total overburden load or geostatic pres-sure) and pw is the fluid or pore water pressure. In a confined aquifer,the geostatic pressure changes negligibly with changes in fluid pressurein the confined aquifer, so that the change in the effective stress is dueto the change in pore water pressure. That is, Δσe=−Δpw, where Δstands for change. The change in pore water pressure, Δpw, is in turncaused by the change in groundwater level:
Δpw ¼ ρwgΔh ð2Þ
where
ρw water densityg gravityΔh change in groundwater level
Fig. 9 shows the relationship between groundwater level andstrain at aquifer 2 of CGSG. A strain is defined as
τ ¼ ΔBB0
ð3Þ

Fig. 4. Cumulative subsidence in Changhua County from 1992 to 2010.
82 W.-C. Hung et al. / Engineering Geology 147-148 (2012) 78–90
where ΔB and B0 are the compaction and the total thickness of aquifer2 (101 m, Table 4). Because the vertical displacement from GPS andthe total compaction from the monitoring well are consistent to1 cm (Figure 7) and the sampling rate of GPS is higher than that ofthe well, a novel use of GPS data at CGSG was made in this paper.We used the parallel observations of GPS and monitoring well tocompute the compaction ratios between the compaction at aquifer 2and the displacement from GPS. For any desired epoch, this ratio wasused to compute the compaction at aquifer 2 using the displacementfrom GPS at a much higher frequency than the monitoring well.
Fig. 9 compares the in situ compactions (monitoring well) and theGPS-derived compactions at aquifer 2, which are consistent in depictingthe behavior of the stratum deformation at CGSG. This suggeststhat, with proper auxiliary data, a high-frequency variation of thecompaction at aquifer 2 can be determined using the GPS-deriveddisplacements.
Fig. 9 shows that the cumulative strain increases almost linearly withdecreasing groundwater level. This linear relation over the range of strainis consistent with inelastic behavior of aquifer compaction in the typicalranges of applied stresses in these aquifer systems (Leake and Prudic,

Fig. 5. Layers of sediments and cumulative compactions from May 1997 to a given time at CGSG. F1–F4 indicates the four layers of aquifer and aquitard.
Table 2Cumulative compactions over different depth ranges at CGSG from May 1997 to July2010.
83W.-C. Hung et al. / Engineering Geology 147-148 (2012) 78–90
1991). At the ending session of Fig. 9, a significant rise of groundwaterlevel (and hence a decrease in the measured effective stress) occurred(see also Figure 11 below), but the strain (compaction) remainsunchanged.
The variation in the slope of groundwater level-strain is explainedas follows. Without horizontal deformation (see Figure 8 for this as-sumption), the change in the soil volume is caused by the change inthe thickness, that is, compaction. As such, the one-dimensional com-pressibility α is related to the skeletal specific storage Ssk as
α ¼ −ΔB=B0
ρwgΔh¼ Ssk
ρwgð4Þ
Table 1Information for the monitoring well at station CGSG.
No. of magnetic rings 25Sediment types (1) 0–120 m: interlayers of sand
and clay(2) 120–220 m: clay with thick coarse
sand interbed(3) 220–300 m: interlayers of sand
and clayDepth of major compaction (m) 50–200 mCumulative compaction from July 2001to July 2007 (cm)
51.3 cm
Eq. (4) leads to
Δh ¼ − τSsk
ð5Þ
Thus, for a constant Ssk, the strainwill vary linearly with the ground-water level. Fig. 10 shows the relations between strain and groundwaterlevel variation at three selected time spans where significant changes
Depth range (m) Compaction (cm) Percentagea (%)
Aquifer 1(F1) 0–32 3.5 3.2Aquitard 1 (T1) 32–52 0.9 0.8Aquifer 2 (F2) 52–153 63.4 57.3Aquitard 2 (T2) 153–174 17.8 16.1Aquifer 3 (F3) 174–277 24.7 22.3Aquitard 3 (T3) 277–286 0.3 0.3Aquifer 4 (F4) 286–299 0.0 0.0
Sum 110.6 100.00
a Compaction in the depth range divided by the total compaction (110.6 cm).

Fig. 6. Distribution of 21 GPS stations established by various organizations in Taiwan (see the text for the abbreviations of the organizations).
84 W.-C. Hung et al. / Engineering Geology 147-148 (2012) 78–90
of groundwater level and compactions occurred. For each time span,a line is fitted to the strains and groundwater levels. The linear regres-sions result in correlation coefficients of about 0.86 for all cases,suggesting that the linear model fits well the relation between strainand groundwater level change.
For each time span, the skeletal specific storage is the negative, in-verse slope of the fitted line in Fig. 10. Table 3 shows the skeletal specific
storage taken from the slopes in the three time spans. The decrease of theskeletal specific storage is related to the decrease in porosity resultingfrom compaction. The reduced porosity (in time) causes a reduction incompressibility and therefore a reduction in skeletal specific storage.As the compaction continues for a sufficiently long time, the stratum isslowly consolidated and the density increases with time. In the processof consolidation, the stratum turns from plasticity to elastoplasticity.
a
b
Fig. 7. (a) Vertical displacements from GPS, monitoring well and leveling at CGSG. (b) Groundwater level and subsidence at CGSG.
85W.-C. Hung et al. / Engineering Geology 147-148 (2012) 78–90
Being elastoplastic, the deformation is both elastic and inelastic, andeventually only a minor compaction will take place. At the final stageof consolidation, decrease in groundwater level will no longer cause stra-tum compaction. For example, during September 2002 to December2002, a drop of 2 m in groundwater level results in an increase of about0.00019 in strain. However, during December 2005 to March 2006, a2-m groundwater level drop leads to only an increase of about0.000034 in strain. The former (strain) is about 5.6 times larger thanthe latter.
The linear model in Eq. (5) can only roughly relate compactionto groundwater change. A detailed numerical model is needed to ade-quately account for the cause of compaction in connection to groundwa-ter and some hydrogeological parameters. In this paper, we adopt theone-dimensional model COMPAC to model the subsidence at CGSGand the genetic algorithm is used to estimate the hydrogeological pa-rameters in the model.
4. Modeling compaction by COMPAC
4.1. The principle
In Section 3, the compaction is only parameterized by the skeletalspecific storage. Here we extend the parameterization using COMPAC(Helm, 1975) to account for (1) the elastic and immediate deformationof coarse-grained sediments (gravel or sand), and (2) the elastoplastic
and delayed deformation of fine-grained sediments (clay, mud or silt).That is, the extended model is
ΔB ¼ Δbþ Δb′ ð5Þ
where Δb and Δb' are the elastic and elastoplastic parts, respectively.The elastic part is modeled as
Δb ¼ −Sskeb0Δh ð6Þ
where Sske is the elastic skeletal specific storage of the coarse-grainedsediment, b0 is the total thickness and Δh is the variation of groundwa-ter level within the aquifer. Sske is about 1×10⁻⁵ m−1 in the study area(Schwartz and Zhang, 2008). The elastoplastic part is modeled as
Δb0¼ NequivΔb
� ð7Þ
Δb* is the compaction of the fine-grained sediment and Nequiv is thenumber of equivalent interbeds explained as follows. One aquifer maycontain a large number of clay interbeds, and it may take a considerablecomputational time to calculate the total compaction from all interbeds.To reduce the computational time, the equivalent thickness of a single
-0.06
-0.04
-0.02
0.00
0.02
0.04
0.06
01/2001 01/2003 01/2005 01/2007 01/2009 01/2011
-0.60
-0.40
-0.20
0.00
0.20
0.40
0.60
01/2001 01/2003 01/2005 01/2007 01/2009 01/2011
Date (Month / Year)
ΔN (
m)
Δh (
m)
ΔE (
m)
-0.06
-0.04
-0.02
0.00
0.02
0.04
0.06
01/2001 01/2003 01/2005 01/2007 01/2009 01/2011
Fig. 8. GPS-derived coordinate variations in the north (ΔN), east (ΔE) and vertical (Δh) directions at CGSG.
86 W.-C. Hung et al. / Engineering Geology 147-148 (2012) 78–90
idealized aquitard was used to represent the thickness of an aquifer.The equivalent (or weighted average) thickness was estimated byHelm (1975)
b�equiv ¼ffiffiffiffiffiffiffiffiffiffiffiffiffiffiffiffiffiffiffiffiffiffiffiffiffi1N
XNj¼1
b�j� �2
vuut ð8Þ
where
N total number of the fine-grained interbeds(for aquitard N=1)
bj* the thickness of specified interbed j
Fig. 9. The relationship between groundwater levels and strains over July 2001 to Decembergiven at 1-week interval. The red line fits the long‐term inelastic trends and the three green lof the references to color in this figure legend, the reader is referred to the web version of
The number of equivalent interbeds is computed as (Liu and Helm,2008a)
Nequiv ¼ 1b�equiv
XNj¼1
b�j ð9Þ
Because of the low hydraulic conductivity, the compaction ofthe fine-grained sediment depends on the pore pressure equilibriumto the surrounding aquifer. The vertical transient head distribution inthe fine-grained sediment can be described by the diffusion equation
K�z
S�sk
∂2h∂z2
¼ ∂h∂t ð10Þ
2009 from both monitoring well and GPS at aquifer 2 of CGSG. GPS-derived strains areines fit the three elastic trends. Dates are given next to the four lines. (For interpretationthis article.)
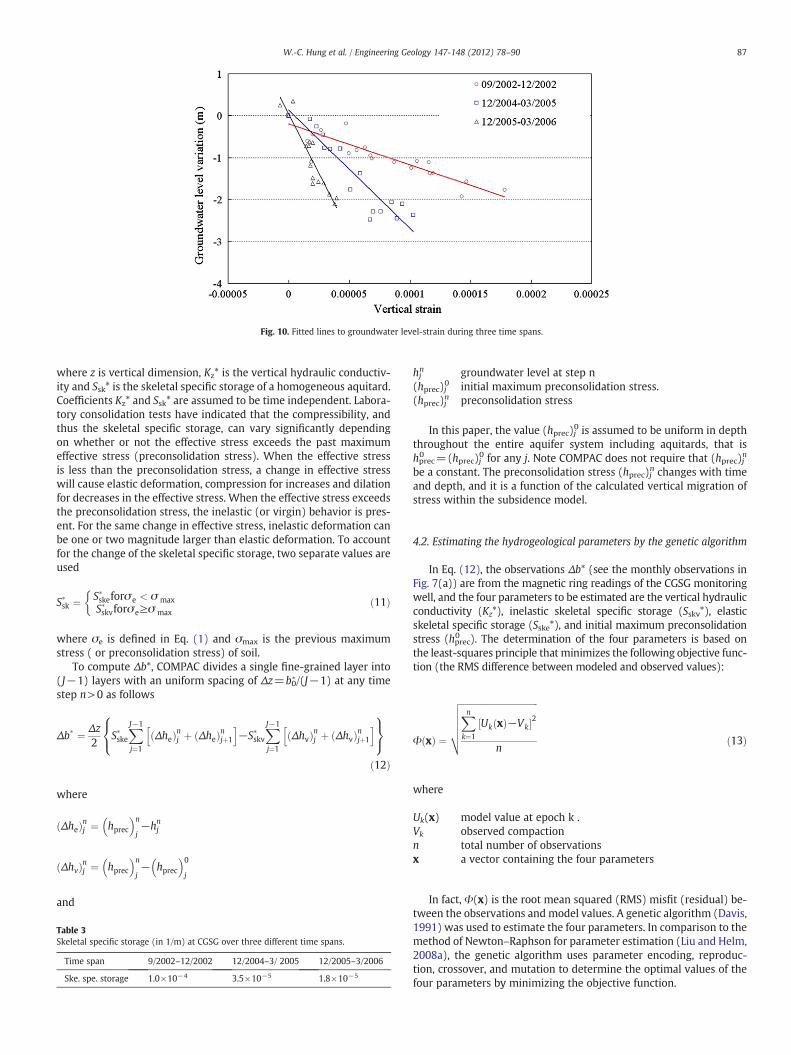
Fig. 10. Fitted lines to groundwater level-strain during three time spans.
87W.-C. Hung et al. / Engineering Geology 147-148 (2012) 78–90
where z is vertical dimension, Kz* is the vertical hydraulic conductiv-ity and Ssk* is the skeletal specific storage of a homogeneous aquitard.Coefficients Kz* and Ssk* are assumed to be time independent. Labora-tory consolidation tests have indicated that the compressibility, andthus the skeletal specific storage, can vary significantly dependingon whether or not the effective stress exceeds the past maximumeffective stress (preconsolidation stress). When the effective stressis less than the preconsolidation stress, a change in effective stresswill cause elastic deformation, compression for increases and dilationfor decreases in the effective stress. When the effective stress exceedsthe preconsolidation stress, the inelastic (or virgin) behavior is pres-ent. For the same change in effective stress, inelastic deformation canbe one or two magnitude larger than elastic deformation. To accountfor the change of the skeletal specific storage, two separate values areused
S�sk ¼ S�skeforσe < σ maxS�skvforσe≥σ max
�ð11Þ
where σe is defined in Eq. (1) and σmax is the previous maximumstress ( or preconsolidation stress) of soil.
To compute Δb*, COMPAC divides a single fine-grained layer into(J−1) layers with an uniform spacing of Δz=b0
∗/(J−1) at any timestep n>0 as follows
Δb� ¼ Δz2
S�skeXJ−1
j¼1
Δheð Þnj þ Δheð Þnjþ1
h i−S�skv
XJ−1
j¼1
Δhvð Þnj þ Δhvð Þnjþ1
h i8<:
9=;ð12Þ
where
Δheð Þnj ¼ hprec� �n
j−hnj
Δhvð Þnj ¼ hprec� �n
j− hprec� �0
j
and
Table 3Skeletal specific storage (in 1/m) at CGSG over three different time spans.
Time span 9/2002–12/2002 12/2004–3/ 2005 12/2005–3/2006
Ske. spe. storage 1.0×10⁻⁴ 3.5×10⁻⁵ 1.8×10⁻⁵
hjn groundwater level at step n
(hprec)j0 initial maximum preconsolidation stress.(hprec)jn preconsolidation stress
In this paper, the value (hprec)j0 is assumed to be uniform in depththroughout the entire aquifer system including aquitards, that ishprec0 =(hprec)j0 for any j. Note COMPAC does not require that (hprec)jn
be a constant. The preconsolidation stress (hprec)jn changes with timeand depth, and it is a function of the calculated vertical migration ofstress within the subsidence model.
4.2. Estimating the hydrogeological parameters by the genetic algorithm
In Eq. (12), the observations Δb* (see the monthly observations inFig. 7(a)) are from the magnetic ring readings of the CGSG monitoringwell, and the four parameters to be estimated are the vertical hydraulicconductivity (Kz*), inelastic skeletal specific storage (Sskv*), elasticskeletal specific storage (Sske*), and initial maximum preconsolidationstress (hprec0 ). The determination of the four parameters is based onthe least-squares principle that minimizes the following objective func-tion (the RMS difference between modeled and observed values):
Φ xð Þ ¼
ffiffiffiffiffiffiffiffiffiffiffiffiffiffiffiffiffiffiffiffiffiffiffiffiffiffiffiffiffiffiffiffiffiffiffiXnk¼1
Uk xð Þ−Vk½ �2
n
vuuuut ð13Þ
where
Uk(x) model value at epoch k .Vk observed compactionn total number of observationsx a vector containing the four parameters
In fact, Φ(x) is the root mean squared (RMS) misfit (residual) be-tween the observations and model values. A genetic algorithm (Davis,1991) was used to estimate the four parameters. In comparison to themethod of Newton–Raphson for parameter estimation (Liu and Helm,2008a), the genetic algorithm uses parameter encoding, reproduc-tion, crossover, and mutation to determine the optimal values of thefour parameters by minimizing the objective function.

Table 5Equivalent thickness and time constant for the three layers at CGSG.
Layer Equivalent thickness (m) Time constant (years)
Aquifer 2 30.54 238.3Aquitard 2 21.00 5221.6Aquifer 3 14.81 1106.3
88 W.-C. Hung et al. / Engineering Geology 147-148 (2012) 78–90
5. Result of modeling compaction
5.1. Estimated parameters for one-dimensional compaction
Based on the analysis in Section 3, the major stratum compactionoccurs at aquifer 2 and 3. Therefore, the four hydrogeological param-eters are needed for the COMPAC model at aquifers 2 and 3, andaquitard 2. The data used for parameter estimation is the stratum com-paction data from January 2003 to June 2008. The searching ranges forthe genetic algorithm are as follows
KZ∗: 0.00001 to 1 (m/year) for both aquifers 2 and 3
Sskv∗ and Sske
∗ : 0.00001 to 0.1 (1/m) for both aquifers 2 and 3hprec0 : −15 to 0 m for aquifer 2, −10 m to 5m for aquifer 3
The number of iterations for searching is set to 50000. In fact, theobjective function (RMSmisfit) becomes stable after some 30000 itera-tions. Use of 50000 iterations is to ensure the estimated parametersare finalized and stable. Table 4 shows the estimated parameters foraquifers 2 and 3 and aquitard 2. The RMS misfits in all cases are below0.5 cm.
For cross validation, we also used the method of Riley (1969) to es-timate Sskv. Fig. 9 shows a long-term inelastic trend and several episodicelastic trends. We fitted a line to the long-term inelastic trend (red linein Figure 9), which gives Sskv = 1.33×10⁻³ m−1 (red line). However,Fig. 9 shows the total compaction of aquifer 2 that includes the effectsof coarse-grained sediments and fine-grained sediments. However, inthis paper, COMPAC models only the effect of the fine-grained sedi-ments. Therefore, we need to adjust the value of Sskv based on the actualthickness of aquifer 2. In aquifer 2, the total thickness is 101 m and thethickness of fine-grained sediments is 61 m. With Eq. (5), the adjustedSskv value is 2.22×10⁻³ m−1 , which is close to the model value (Sskv)of 3.19×10⁻³ m−1 given in Table 4.
With the estimated parameters in Table 4, we determined thetime constant needed to complete 93% compaction for each layer.The time constant, t, is defined as (Terzaghi et al., 1996)
t ¼ TvH2
4Cvð14Þ
with
Cv ¼ K�Z
S�skvð15Þ
where Cv is coefficient of compaction, H is thickness , and Tv is set to 1.In Eq. (14), it is assumed that H is equal to bequiv*. The time constant isalso the time for a confining unit to equilibrate to the head of the sur-rounding aquifer. Table 5 shows the thicknesses and time constants ofthe three layers. For each layer, the equivalent thickness is smallerthan the depth range given in Table 4, because the former containsonly the fine-grained sediments in the layer while the latter is simplythe difference in depths. Table 5 shows that aquifer 2 takes the leasttime to complete the compaction, followed by aquifer 3, and thenaquitard 2. This suggests that aquifer 2 responds to groundwater change
Table 4Estimated parameters for the one-dimensional compaction model at CGSG and theRMS value of residuals.
Layer(depth range)
Estimated parameters RMS( cm )
Kz* ( m/y ) Sskv* ( 1/m ) Sske* ( 1/m ) hprec0 (m)
Aquifer 2(52–153 m)
3.12×10−03 3.19×10−03 4.07×10−04 −5.626 0.450
Aquitard 2(153–174 m)
5.29×10−04 2.51×10−02 3.13×10−03 −1.261 0.193
Aquifer 3(174–277 m)
6.20×10−04 1.25×10−02 4.28×10−04 −2.047 0.234
(either rise or drop) faster than the other two layers. Aquitar 2 takesthe longest time to consolidate, and this is also consistent with the re-sult in Table 4, which shows that the initial maximum preconsolidationstress (hprec0 ) of aquitar 2 is larger than the hprec0 values in the other twolayers.
5.2. Model validation and compaction prediction
The parameters in Table 4 are estimated from the observationsover January 2003 to June 2008 in the COMPAC model. Here we usesuch parameters to predict compactions over June 2008 to June2010, which are then compared with the monthly observations overthis period. This is to investigate the possibility of predicting compac-tion based on the COMPAC model with appropriate hydrogeologicalparameters. Table 6 shows the cumulative compactions over January2003 to June 2010 from the observations and from the model valuesof COMPAC (based on the parameters from Table 3). The RMS valuesof the monthly differences between the observation and model values,and the mean absolute percentage errors (MAPEs) over June 2008 toJune 2010 are also given in Table 6. MAPE is themean value of the abso-lute relative differences between model and observation. In all layers,the RMS differences are below 0.5 cm, and the MAPE are below 10%.These MAPEs are classified as good according to Lewis (1982a,b). Thissuggests that COMPAC is able to predict compactions to an accuracy con-sistent with the accuracy in the estimation of the four hydrogeologicalparameters.
Fig. 11 shows the monthly compactions from the observations andfrom the predictions of COMPAC in the three layers. The model valuesare in good agreementwith the observations. Relatively large deviationsbetween model and observation at aquifer 2 and aquitard 2 occurredover August 2008 to December 2008, when aquifer 2 experienced a re-bound due to the increase of groundwater by about 6 m in this layer.During this period, no rebound at aquifer 3 occurred, and this is proba-bly due to the relatively small increase of ground water (1.5 m) here.Based on Fig. 5, there are more thin layers of fine sediment at aquifer2, and this type of stratum allows change in the water level in a shorttime period. That is, when the groundwater level rises significantly,aquifer 2 will quickly rebound, but aquifer 3 will continue to descend.
6. Discussion and conclusions
The long-term (more than 10 years) geodetic and geotechnical ob-servations collected in this paper are complementary with each otherin explaining land subsidence in Dacheng. Continuous GPS recordsfrom July 2001 to June 2010 show a cumulative vertical displacementof 53.9 cm and a horizontal displacement of 1 cm in Dacheng. This
Table 6Cumulative compactions over January 2003 to June 2010 from observation and model,and RMS of monthly differences.
Layer Obs. totalcompaction (cm)
Pred. totalcompaction (cm)
RMS diff. (cm) MAPE
Aquifer 2(52–153 m)
−14.3 −15.0 0.484 8%
Aquitard 2(153–174 m)
−6.6 −7.2 0.250 7%
Aquifer 3(174–277 m)
−14.6 −14.6 0.210 5%

Fig. 11. Comparison between observed and predicted compactions in three layers of CGSG.
89W.-C. Hung et al. / Engineering Geology 147-148 (2012) 78–90
suggests that the major deformation caused by stratum compactionoccurs in the vertical direction. The observations also depict some sea-sonal variations of land subsidence and uplift associated with ground-water variations. With a proper transformation from GPS coordinatevariation to stratum compaction, the compactions at aquifer 2 weredetermined at a weekly frequency. The long-term skeletal storage coeffi-cients estimated from the strains and groundwater levels suggest that theproperty of compaction has turned from plasticity into elastoplasticity.
This paper uses the COMPAC model to explain the observed com-pactions. In the modeling, the vertical hydraulic conductivities, elasticskeletal specific storage, and inelastic skeletal specific storage at aquifer2, 3 and aquitard 3 were estimated by the genetic algorithm. The factthat the RMS residuals in all cases are below 0.5 cm suggests that theCOMPAC model fits well the observations. The estimated parameterswere used to determine the times needed to consolidate the threelayers. It turns out aquifer 2 needs the least time for consolidation,followed by aquifer 3 and aquitard 2. Because aquifer 2 is quick to re-spond to groundwater change, it may be possible tomitigate land subsi-dence in Dacheng by increasing groundwater of aquifer 2. On the otherhand, if groundwater at aquifer 2 is depleted, a quick compaction willoccur. In conclusion, a proper management of groundwater at aquifer2 is important for land subsidence mitigation in Dacheng.
Prediction of land subsidence based on COMPAC and the four esti-mated hydrogeological parameters results in an average MAPE ofbelow 10% over June 2008 to June 2010. Thus, the compaction model(with estimated parameters), along with the change of groundwaterlevel, can be used to predict future land subsidence with a sufficientconfidence in Dacheng. However, the prediction will be sufficiently ac-curate over a future time span (2 years in the case study of this paper)only if the hydrogeological parameters are properly calibrated. As such,continuous collection of data from themonitoring system (Section 2) iscritical to the success of prediction.
Although COMPAC canmodel land subsidence to a high accuracy, themodel itself is one-dimensional and site specific. With the data from 7monitoring wells and 40 groundwater wells in Changhua (Section 2),it is possible to extend the current study to cover all coastal areas inChanghua and use a model based on a three-dimensional groundwaterflow(USGS MODFLOW model) and the SUB package to simulate landsubsidence to determine the stratum compaction coefficients and to es-timate the groundwater safe yield. In addition to Dacheng, Erlin(Figure 2) is another important township: it is the planned site of a
science-based industrial park, which is vital to the economic develop-ment of Taiwan. Because this industrial park will consume a largeamount of water, a proper water management plan taking into accountland subsidence is of great importance. According to Table 6, the cali-brated parameter values predict subsidence values consistent with theobservations to 0.5 cm. Therefore, thewatermanagement agency of Tai-wan (Water Resource Agency, WRA) can use our model to estimate fu-ture subsidence values under different situations with good confidence.In order to prevent irreversible compaction, WRA can manage to keepthe groundwater levels of the field above the corresponding past maxi-mumpreconsolidation stress around the study area. The result from thispaper will provide an important reference for such a management plan.
Acknowledgements
This study is supported by Water Resource Agency, Taiwan, ROC.
References
Amelung, F., Galloway, D.L., Bell, J.W., Zebker, H.A., Laczniak, R.J., 1999. Sensing the upsand downs of Las Vegas: InSAR reveals structural control of land subsidence andaquifer-system deformation. Geology 27 (6), 483–486.
Buckley, S.M., Rosen, P.A., Hensley, S., Tapley, B.D., 2003. Land subsidence in Houston,Texas, measured by radar interferometry and constrained by extensometers. Jour-nal of Geophysical Research 108 (B11), 2542.
Burbey, T.J., 2001. Stress–strain analyses for aquifer-system characterization. GroundWater 39 (1), 128–136.
Burbey, T.J., 2008. The influence of geologic structures on deformation due to groundwater withdrawal. Ground Water 46 (2), 202–211.
Carreón-Freyre, D.C., Cerca, M., 2006. Delineating the near-surface geometry of thefracture system affecting the Querétaro valley, Mexico: correlation of GPR signa-tures and physical properties of sediments, Near Surface Geophysics, 4(1). EAGE(European Assoc. of Geoscientists and Engineers), pp. 49–55.
CGS, 1997. The investigation of hydrogeology in the Choshui River alluvial fan, Taiwan(in Chinese). Central Geological Survey of Taiwan, Taipei.
Davis, L., 1991. Handbook of genetic algorithms. Van Nostrand Reinhold, New York.385 pp.
Ferronato, M., Gambolati, G., Teatini, P., 2004. On the role of reservoir geometry inwaterdrive hydrodynamics. Journal of Petroleum Science and Engineering 44(3–4), 205–221.
Galloway, D.L., Hoffmann, J., 2007. The application of satellite differential SARinterferometry-derived ground displacements in hydrogeology. HydrogeologyJournal 15 (1), 133–154.
Hanson, R.T., 1989. Aquifer-system compaction, Tucson Basin and Avra Valley, Arizona.U.S. Geological Survey Water-Resources Investigations Report 88–4172. . 69 pp.
Helm, D.C., 1975. One-dimensional simulation of aquifer system compaction near Pixley,California, (1) Constant parameters. Water Resources Research 11 (3), 465–478.

90 W.-C. Hung et al. / Engineering Geology 147-148 (2012) 78–90
Hoffmann, J., Zebker, H.A., Galloway, D.L., Amelung, F., 2001. Seasonal subsidence andrebound in Las Vegas Valley, Nevada, observed by synthetic aperture radar inter-ferometry. Water Resources Research 37 (6), 1551–1566.
Hoffmann, J., Leake, S.A., Galloway, D.L., Wilson, A.M., 2003b. MODFLOW-2000 ground-water model-User guide to the subsidence and aquifer-system compaction (SUB)package. U.S. Geological Survey Techniques of Water-Resources Investigations,Open-File Report 03–233. 46 pp.
Hoffmann, J., Galloway, D.L., Zebker, H.A., 2003a. Inverse modling of interbed storageparameters using land subsidence observations, Antelope Valley, California.Water Resources Research 39 (2), 1231.
Hsu, K.C., Wang, C.H., Chen, K.C., Chen, C.T., Ma, K.W., 2007. Climate-induced hydrolog-ical impacts on the groundwater system of the Pingtung Plain, Taiwan. Hydrogeol-ogy Journal 15 (5), 903–913.
Hu, B.B., Zhou, J., Wang, J., Chen, Z.L., Wang, D.Q., Xu, S.Y., 2009. Risk assessment of landsubsidence at Tianjin coastal area in China. Environmental Earth Sciences 59 (2),269–276.
Hu, J.C., Chu, H.T., Hou, C.S., Lai, T.H., Chen, R.F., Nien, P.F., 2006. The contribution totectonic subsidence by groundwater abstraction in the Pingtung area, southwesternTaiwan as determined by GPS measurements. Quaternary International 147, 62–69.
Hung, W.C., Liou, J.C., 2009. Fundamental Data Survey and Cross Analysis of Land Sub-sidence in Taipei Basin, Chahwa and Yunlin Area. Report of Industrial TechnologyResearch Institute (ITRI), Hsinchu. . 349 pp. (in Chinese).
Hung, W.C., Hwang, C., Chang, C.P., Yen, J.Y., Liu, C.H., Yang, W.H., 2010. Monitoring se-vere subsidence in Taiwan by multi-sensors: Yunlin, the southern Choushui RiverAlluvial Fan. Earth Science Geology 59, 1535–1548.
Larson, K.J., Başağaoğlu, H., Mariňo, M.A., 2001. Prediction of optimal safe ground wateryield and land subsidence in the Los Banos-Kettleman City area, California, using acalibrated numerical simulation model. Journal of Hydrology 242, 79–102.
Leake, S.A., Prudic, D.E., 1991. Documentation of a computer program to simulateaquifer-system compaction using the modular finite-difference ground waterflow model. US Geological Survey Technique of Water Resources Investigation, 6(A2). 68 pp.
Lewis, C.D., 1982a. Industrial and Business Forecasting Methods. Butterworths, London.158 pp.
Liu, Y., Helm, D.C., 2008b. Inverse procedure for calibrating parameters that control landsubsidence caused by subsidence fluid withdrawal: 1. Methods. Water ResourcesResearch 44, W07423.
Liu, Y., Helm, D.C., 2008a. Inverse procedure for calibrating parameters that control landsubsidence caused by subsidence fluid withdrawal: 2. Field application. Water Re-sources Research 44, W07424.
Lopez-Quiroz, P., Doin, M.P., Tupin, F., Briole, P., Nicolas, J.M., 2009. Time series analysisof Mexico City subsidence constrained by radar interferometry. Journal of AppliedGeophysics 69 (1), 1–15.
Lewis, C.D., 1982b. Industrial and Business Forecasting Methods. Butterworths, London.158 pp.
McDonald, M.G., Harbaugh, A.W., 1988. A modular three-dimensional finite-differencegroundwater flow model. US Geological Survey Technique of Water Resources In-vestigation, 6 (A1). 586 pp.
Munekane, H., Kuroishi, Y., Hatanaka, Y., Yarai, H., 2008. Spurious annual vertical defor-mations over Japan due to mismodelling of tropospheric delays. Geophysical Jour-nal International 175 (3), 831–836.
Pavelko, M.T., 2004. Estimates of hydraulic properties from a one-dimensional numer-ical model of vertical aquifer-system deformation, Lorenzi Site, Las Vegas, Nevada.U.S. Geological Survey Water-Resources Investigations Report 03–4083. 35 pp.
Riley, F.S., 1969. Analysis of borehole extensometer data from central California. 2ndInternational Symposium on Land Subsidence, Tokyo (2), 423–432.
Schmidt, D.A., Burgmann, R., 2003. Time-dependent land uplift and subsidence in theSanta Clara valley, California, from a large interferometric synthetic apertureradar data set. Journal of Geophysical Research 108 (B9), 2416.
Schwartz, F.W., Zhang, H., 2008. The fundamentals of ground water. John Wiley andSons, Danvers. 592 pp.
Sneed, Michelle, Galloway, D.L., 2000. Aquifer-system compaction and land subsi-dence: measurements, analyses, and simulations? the Holly site, Edwards AirForce Base, Antelope Valley, California. U.S. Geological Survey Water-Resources In-vestigations Report 00–4015 65 pp.
Teatini, P., Ferronato, M., Gambolati, G., Bertoni, W., Gonella, M., 2005. A century of landsubsidence in Ravenna, Italy. Environmental Geology 47 (6), 831–846.
Terzaghi, K., 1925. Principles of soil mechanics: IV, Settlement and consolidation ofclay. McGraw-Hill, New York. 95 pp.
Terzaghi, K., Peck, R.B., Mesri, G., 1996. Soil Mechanics in Engineering Practice. Wiley,New York. 592 pp.
Wu, J.C., Shi, X.Q., Ye, S.J., Xue, Y.Q., Zhang, Y., Wei, Z.X., Fang, Z., 2010. Numerical sim-ulation of viscoelastoplastic land subsidence due to groundwater overdrafting inShanghai, China. Journal of Hydrologic Engineering 15 (3), 223–236.