modeling carbon cycles and estimation of greenhouse gas
TRANSCRIPT

Modeling carbon cycles and estimationof greenhouse gas emissions from organicand conventional farming systems
Bjorn Kustermann Maximilian Kainz and Kurt-Jurgen Hulsbergen
Lehrstuhl fur Okologischen Landbau Technische Universitat Munchen Alte Akademie 12 D-85354Freising-Weihenstephan GermanyCorresponding author kuestermannwzwtumde
Accepted 30 July 2007 Research Paper
AbstractThe paper describes the model software REPRO (REPROduction of soil fertility) designed for analyzing interlinked carbon
(C) and nitrogen (N) fluxes in the system soilndashplantndashanimalndashenvironment The model couples the balancing of C N and
energy fluxes with the target to estimate the climate-relevant CO2 CH4 and N2O sources and sinks of farming systems For
the determination of the net greenhouse effect calculations of C sequestration in the soil CO2 emissions from the use of
fossil energy CH4 emissions from livestock keeping and N2O emissions from the soil have been made The results were
converted into CO2 equivalents using its specific global warming potential (GWP) The model has been applied in the
experimental farm Scheyern in southern Germany which had been divided into an organic (org) and a conventional (con)
farming system in 1992 Rather detailed series of long-term measuring data are available for the farm in Scheyern which
have been used for validating the software for its efficiency and applicability under very different management yet nearly
equal site conditions
The organic farm is multi-structured with a legume-based crop rotation (N2 fixation 83 kg ha-1 yr-1) The livestock
density (LSU = Livestock Unit according to FAO) is 14 LSU ha-1 The farm is oriented on closed mass cycles from the
energetic point of view it represents a low-input system (energy input 45 GJ ha-1 yr-1) The conventional farm is a simple-
structured cash crop system based on mineral N (N input 145 kg ha-1 yr-1) Regarding the energy consumption the system
is run on high inputs (energy input 140 GJ ha-1 yr-1) The organic crop rotation reaches about 57 (83 Mg ha-1 yr-1) of the
DM yield about 66 (163 kg ha-1 yr-1) of the N removal and roughly 56 (3741 kg ha-1 yr-1) of the C fixation of the
conventional crop rotation In the organic rotation 18 GJ per GJ of fossil energy input are bound in the harvested biomass
vis-a-vis 111 GJ in the conventional rotation The strongest influence on the greenhouse effect is exerted by C sequestration
and N2O emissions In Scheyern C sequestration has set in under organic management (+037 Mg ha-1 yr-1) while humus
depletion has been recorded in the conventional system (-025 Mg ha-1 yr-1)
Greenhouse gas emissions (GGEs) due to fuel consumption and the use of machines are nearly on the same level in both
crop rotations However the conventional system emits an additional 637 kg CO2 eq ha-1 yr-1 which had been consumed in
the manufacture of mineral N and pesticides in the upstream industry
Besides the analyses in the experimental farm Scheyern the model has been applied in 28 commercial farms (18 org and
10 con) with comparable soil and climate conditions in the surroundings of Scheyern (mean distance 60 km) The program
calculations are aimed at benchmarking the results obtained in the farming systems Scheyern they are expected to disclose
management-specific variations in the emission of climate-relevant gases and to rate the suitability of the model for
describing such management-specific effects In order to make the situation in the farms comparable only the emissions
from cropping systems were analyzed Livestock keeping remained unconsidered Due to lower N and energy inputs clearly
lower N2O and CO2 emissions were obtained for the organic farms than for the conventional systems
The analyses have shown possibilities for the optimization of management and the mitigation of GGE Our findings
underline that organic farming includes a high potential for C sequestration and the reduction of GGEs Currently the model
REPRO is tested by 90 farms in the Federal Republic of Germany with the aim to apply it in the future not only in the field
of research but also in the management of commercial farms
Key words carbon cycle farming system modeling global warming potential C sequestration greenhouse gas emissions REPRO
Renewable Agriculture and Food Systems 23(1) 38ndash52 doi101017S1742170507002062
2008 Cambridge University Press
httpwwwcambridgeorgcoreterms httpdxdoiorg101017S1742170507002062Downloaded from httpwwwcambridgeorgcore Technical University of Munich University Library on 14 Oct 2016 at 131211 subject to the Cambridge Core terms of use available at
Introduction
The carbon budget of agricultural systems has been the
focus of numerous studies on different scales from the
elucidation of molecular mechanisms in the C metabolism
of plants up to the analysis of the influence of land use
systems on biogeochemical C cycles1ndash3 Especially the
dramatic rise of the CO2 concentration in the atmosphere
has led to a worldwide search for possibilities of C
sequestration in agriculturally used soils and for the
reduction of CO2 emissions under specific soil climate
and management conditions3
A large number of research findings are available on the
effect of management practices on C sequestration and CO2
emissions Experiments have shown that a considerable
CO2 reduction potential lies in reduced and zero tillage
versus conventional tillage2 in the growing of perennial
legumes rather than cereals and maize4 and in the
conversion of arable land to grassland5 Some studies
contain analyses of greenhouse gas emissions (GGEs) from
complex production systems (for example organic versus
conventional farming) on the basis of field experiments3
experimental and commercial farms6 or in model calcula-
tions with statistic data material7 However so far few
scientific studies have been published that deal with the
analysis of C cycles in farming systems and the interrelated
on-farm C fluxes between soils plants animals and the
environment This is surprising as C cycles beyond their
climatic relevance are of major significance for the
efficiency of production The carbon input to the soil has
a decisive influence on humus level biological activities
and soil structure thus considerably controlling the biomass
yield
Especially systems with limited inputs like organically
managed farms require a sufficient recycling of organic C
in order to support the yield capacity of the soil
In studies of the net greenhouse effect of farming
systems not only are CO2 and CH4 emissions important
but due to their high specific greenhouse potential also the
site- and management-related N2O emissions8 Model ap-
proaches have been elaborated for emission inventories on
the farm level which consider all relevant outputs29 how-
ever on the basis of partly simplified model algorithms An
overall view of the net greenhouse effect of farming sys-
tems must take into account beside the biological C fluxes
also technical C fluxes ie all CO2 emissions involved by
the input of fossil energy This comprises (see10)
$ on-farm CO2 emissions resulting from the use of diesel
fuel electrical power solid fuels and other energy
carriers (= direct energy input)
$ CO2 emissions from the industrial upstream sector for
the manufacture and transport of fertilizers pesticides
and machines (= indirect energy input)
The present paper has the following aims to
$ outline an approach to the modeling of C cycles in
farming systems and to integrate the methods into a
complex farming model
$ describe and validate the results computed by use of the
model software in example farms of different structure
and intensity and to evaluate the practicability of the
program
$ come to conclusions on the influence of a given farming
system on the greenhouse effect and on practicable
reduction strategies for GGEs
The investigations took place in the experimental farm
Scheyern in southern Germany where two management
systems are practiced (organic and conventional) and in 28
commercial farms also in the south of Germany
The experimental farm Scheyern had been chosen as test
farm for the model applications because here very detailed
and scientifically profound data are available (management
records measuring data on C fluxes C pools and GGEs)
which are suited for validating the program
In contrast to this commercial farms do not dispose of
comparable databases The records in the experimental
farm Scheyern were made independently of data sampled
for the design of the model software In Scheyern under
nearly equal site conditions two completely different
management systems were established an organically run
mixed farm and a conventional cash crop farm The target
was to analyze their effects on the agroecosystem11
The primary target of the application is to test its
efficiency and validity to juxtapose computed and mea-
sured results to check the sensitivity of the software for
the consequences of management activities and to find out
to which extent the results allow an interpretation
The application of the program in 28 commercial farms
is to benchmark the results obtained in the experimental
farm Scheyern on a larger scale to disclose management-
specific variations in the GGEs and to evaluate the aptitude
of the model for depicting such management effects In
order to make these farms with their highly different struc-
ture comparable only emissions from the cropping systems
were analyzed livestock keeping was not considered
The studies were based on the hypothesis that (1)
modeling C cycles contributes to a better understanding of
farming systems thus providing the preconditions for an
emission inventory (2) farming systems have a particular
importance for the implementation of CO2 reduction
strategies because climate-related management decisions
are due to be made on farm level (3) tools for the analysis
of C cycles have to be integrated into complex management
systems in order to estimate the ecological and economic
effects of climate-protecting measures and to assess their
feasibility
Methods and Materials
Modeling approach
In the described investigations C cycles on farm level were
depicted by using the computer program REPRO (REPRO-
duction of soil fertility1213) REPRO is software for
analyzing evaluating and optimizing the environmental
Modeling carbon cycles and estimation of greenhouse gas emissions 39
httpwwwcambridgeorgcoreterms httpdxdoiorg101017S1742170507002062Downloaded from httpwwwcambridgeorgcore Technical University of Munich University Library on 14 Oct 2016 at 131211 subject to the Cambridge Core terms of use available at
effects of agricultural enterprises The model describes
a given farm as a functioning system REPRO has a
hierarchical set-up Lower system levels ie subfields
crop stands and products are regarded as elements of the
higher system levels like crop rotation or farm Interactions
between different sectors of the farm and the relationships
to the environment are depicted as mass and energy fluxes
(see Figs 1 and 2) REPRO has a modular set-up and
comprises the following components
$ relational databases for the handling of site and
management information
$ balancing models for the description of farm-specific
mass and energy fluxes13ndash15
$ empirical models for example for the estimation of soil
loss by water erosion16 and for the assessment of soil
compaction damage caused by machine passage17
$ interfaces to CN simulation models18
$ interfaces to Geographic Information Systems16
$ rating methods for example for indicators and evalu-
ation functions12
In the program on-farm mass fluxes are described as closed
cycles The partial balances are interlocked the outputs
of one subsystem are the inputs of the other as shown by
the following example the path of the produced feed is
completely traced in quantity and quality from the field via
preservation storage and use down to the stable Farm
manure produced in dependence on feed input animal
performance and technological design is depicted both in
quantity and quality from the very beginning via excreta
storage to spreading it on the field On-farm N transfers and
N emissions are thoroughly considered by the program13
The objective to balance the C containing mass fluxes made
it necessary to identify relevant C fluxes and C pools to
derive appropriate algorithms and model parameters using
findings from the literature and our own research results to
design the software module and to link it with the already
existing modules13 To balance the net greenhouse effect
the quantities of N2O CH4 and CO2 emissions are deter-
mined and evaluated All emissions were converted to CO2
equivalents [CO2 eq] using their specific global warming
potential (GWP) which determines the relative contribution
of a gas to the greenhouse effect The GWP index is defined
as the cumulative radiative forcing between the present and
a selected time in the future caused by a unit mass of gas
emitted now19 The GWP (with a time span of 100 years) of
CO2 CH4 and N2O is 1 23 and 296 respectively
In order to quantify the C fluxes primarily the following
approaches have been used
D Soil organic carbon (D SOC) Changes in SOC were
determined by use of humus balancing12 This method
includes analyses of the crop-specific effects (depending
on site yield and mineral N doses) and of the organic ferti-
lizers (depending on quantity and quality) on the humus
level of the soil The parameters were derived in long-term
F
A
A
S
C C
P
Plant Animal
S
P
Y
F
O
M
P
M
D
O
ndash ndash
I
Year 1999ndash2002
Inputs Outputs
Soil
Decomposed losses
Internal farm cycling
Figure 1 On-farm carbon cycle of the organic farming system Scheyern kg C ha-1 yr-1 (av 1999ndash2002) screenshot of the model
REPRO
40 B Kustermann et al
httpwwwcambridgeorgcoreterms httpdxdoiorg101017S1742170507002062Downloaded from httpwwwcambridgeorgcore Technical University of Munich University Library on 14 Oct 2016 at 131211 subject to the Cambridge Core terms of use available at
field experiments run with various crop rotations and ferti-
lization patterns in regions of different soil and climate
conditions for example on diluvial loess and highland
sites surveying the development of SOC over more than
20 years Indirectly the parameters also take into account
root mass and rhizodeposition of the crops as well as type
and intensity of tillage The mean crop-specific coefficients
D SOC [Mg ha-1 yr-1] are potato ndash10 to ndash16 maize
ndash07 to ndash12 winter wheat ndash04 to ndash08 grassndashcloverndash
alfalfa (GCA) 09 to 12 The indicated variability ensues
from the influence of factors such as yield (yield-related
root mass and C input) production technology (eg effect
of fertilization) and site conditions (eg soil texture)
These factors do not include the effects of the byproducts
(straw beet tops potato vines) and of mulched biomass
(GCA) on SOC they were determined on the basis of bio-
mass input The mean humus reproduction coefficients DSOC [kg C (kg C Input) - 1] are farmyard manure (FYM)
035 slurry 026 straw 021 and green manure 014
Slurry provides 75 straw 60 and green manure 40
of the humus reproduction performance of FYM The par-
ameters were determined with regard to the C turnover in
open field trials Apart from this analyses were also made
of the C turnover of organic matter in incubation tests
under controlled laboratory conditions122021
C assimilation and C inputs to soils by plants The
net C assimilation of the plants was estimated from the
measured aboveground net primary production (ANPP)
and the C contents in the biomass The harvested yield
of the main products was entered as measured value
The soil C inputs were estimated as crop yield and site
specific values with consideration of (1) byproducts (2)
crop residues (stubble) (3) roots and (4) rhizodeposition
(exudates and root turnover in the growth period) The
parameters were based on measurements in field experi-
ments2223 and on data obtained in a literature study By
use of this method the following values were obtained
for winter wheat for example dry matter (DM) and C
quantities [Mg ha-1 yr-1] grain as main product 50 Mg
DM 222 Mg C straw as byproduct 40 Mg DM 184 Mg
C stubble 08 Mg DM 037 kg C roots 13 Mg DM
052 Mg C rhizodeposition 08 Mg DM 031 Mg C total
biomass 119 Mg DM 526 Mg C Thus the C harvest
index (harvested biomass [kg C ha-1]total biomass [kg
C ha-1]) amounted to 042 for mere grain harvesting and
077 when grain and straw were harvested as well
CO2 emissions from the use of fossil energy CO2
and energy balances are interlocked they consider direct
and indirect inputs of fossil energy and the involved CO2
emissions Energy balancing has been performed according
to Hulsbergen et al1015 Energy inputs and CO2 emissions
have been estimated by use of the parameters listed in
Tables 1 and 5 the determined energy outputs are based on
the calorific values per kilogram DM as given in Table 3
A
C
P
O
S
Internal farm cycling
Year 1999ndash2002
Inputs Outputs
Y M
Soil
Plant
S
C
ndash248
ndash ndash
Figure 2 On-farm carbon cycle of the conventional farming system Scheyern kg C ha-1 yr-1 (av 1999ndash2002) screenshot of the model
REPRO
Modeling carbon cycles and estimation of greenhouse gas emissions 41
httpwwwcambridgeorgcoreterms httpdxdoiorg101017S1742170507002062Downloaded from httpwwwcambridgeorgcore Technical University of Munich University Library on 14 Oct 2016 at 131211 subject to the Cambridge Core terms of use available at
CH4 emissions The metabolic methane emissions from
livestock keeping were estimated with regard to animal
species performance and feeding On the basis of the
feed gross energy methane releases were estimated by
means of conversion factors For quantifying the methane
release from organic fertilizer during storage the excreta
output (quantity chemical components degradability)
was chosen as the basis for calculating the methane for-
mation potential the amount of produced methane was
then determined with regard to the storage system24
N fluxes relevant for an emission inventory were
estimated as follows
N2O emissions N2O emissions were estimated follow-
ing the IPCC approach24 It was assumed albeit very
simplified that 125 of the nitrogen supplied to the soils
by organic and mineral fertilization N2 fixation and N
deposition is emitted in the form of N2OndashN Alternatively
a N2OndashN emission factor of 253 of the total N input as
obtained in numerous measurements at the experimental
farm8 was applied The indirect N2O emissions from
gaseous NH3 and NOx losses as well as from N losses via
leaching were quantified using emission factors24
N2 fixation The symbiotic N2 fixation by legumes has
been estimated under the assumption that the fixation rate
rises with increasing yields1225 The yields were entered
into the calculations in the form of measured values For
each legume crop a specific Ndfa value (Ndfa = nitrogen de-
rived from atmosphere) was assumed which was modified
according to the given conditions among others the con-
tent of plant available nitrogen in the soil (ie GCA under
organic conditions Ndfa = 090 under conventional con-
ditions Ndfa = 080) The N quantities bound in roots crop
residues and rhizodeposition were estimated using crop
specific parameters12 The legume share of the crop blends
(mass ) was entered as measured or estimated value
Experimental site and test farms
The described model was applied (1) in the experimental
farm Scheyern located 40 km north of Munich in southern
Germany (483000N 112070E) and (2) in 28 commercial
farms under comparable climate and soil conditions
(1) In the experimental farm Scheyern investigations of
processes taking place in agroecosystems were made
as well as analyses and optimization studies of the
sustainability of management systems11 In 1992 the
farm was divided into two independent farming
systems with experimental character One farm
(315 ha arable land and 254 ha grassland) has been
managed according to the principles of organic farming
(org) the other (300 ha arable land) has remained
under conventional management (con)
The research station is located 445ndash498 m above
sea level in a hilly landscape derived from tertiary
sediments partly covered by loess There is a high
variability of soil types and soil properties most soils
have a loamy texture and are classified as Cambisols
or Eutrochrepts The mean annual precipitation is
833 mm the mean annual temperature 74C11
The productivity of the two farm sites is not
absolutely the same The organic farm works land of
a slightly lower yield potential and steeper sloping than
the conventional counterpart The arable areas (AAs) of
the organic farm scores 48 the conventional farm 52
points on an average (100 scores correspond to the
highest cropping capacity according to German Soil
Classification Scheme26) The organic farm keeps a
suckler cowherd The stock density had increased step
by step from 0 LSU ha-1 (in 1992) to 14 LSU ha-1 (av
1999ndash2002) and was then continuously reduced again
(LSU = Livestock Unit according to FAO) Thus
different intensity levels and on-farm mass fluxes were
reached In compliance with the guidelines for organic
farming mineral N and chemico-synthetic plant
protection products have been omitted Since arable
and grassland soils in both farms show high to very
high nutrient levels no mineral P and K doses
needed to be applied in the reference period The crop
rotation of the organic system comprised (1) GCA
(2) potatoes+undersown mustard (3) winter wheat
(4) sunflower+undersown GCA (5) GCA (6) winter
wheat and (7) winter rye+undersown GCA
The conventional farm has specialized on cash crop
production The crop rotation included (1) potatoes+mustard as catch crop (2) winter wheat (3) maize+mustard as catch crop and (4) winter wheat Occasion-
ally silage maize was sold to a neighboring farm for an
equivalent import of cattle slurry The organic crop
rotation has a much broader crop diversity than the
conventional The mean size of a crop rotation field is
45 ha (org) and 75 ha (con)
Tillage was adjusted to the cropping systems In the
seven-field organic rotation usually three operations
with a moldboard plough are carried out and two with a
chisel plough In years of GCA cultivation tillage is
omitted The conventional crop rotation refrains
completely from ploughing
The characterization of the systems according to
tillage (org = with ploughing con = no ploughing)
reflects the practice in the commercial farms of the
region It becomes evident that the two management
systems in Scheyern have very different structures
and production features but this is typical for the
different farming systems (org and con) and also for the
region The farming systems of Scheyern have been
subjected to numerous evaluations and comparisons
of the effects of organic and conventional farming on the
abiotic and biotic environment (among others827ndash29)
For more than 15 years an intensive monitoring
program has been run on the farm areas From the very
beginning of the investigations all operations have
been documented in electronic field files
Yields DM and nutrient contents of the harvested
products were documented on field and subfield level
42 B Kustermann et al
httpwwwcambridgeorgcoreterms httpdxdoiorg101017S1742170507002062Downloaded from httpwwwcambridgeorgcore Technical University of Munich University Library on 14 Oct 2016 at 131211 subject to the Cambridge Core terms of use available at
separately Before spreading the doses of farm manure
were weighed and their nutrient contents determined in
laboratory analyses In 50r50 m grids SOC SON and
nutrient levels have been sampled at time intervals of
5 years The Ap-horizon revealed SOC levels of 139
(078ndash269 n = 116) in the organic and 125 (105ndash
208 n = 106) in the conventional farm (sampling of
200130) In some places relevant C and N fluxes were
measured for example the N2O emissions8 Thus a
rich data pool is now available which is used for the
validation of the model software As reference period
the years 1999ndash2002 were chosen because during this
time no management changes took place and the
systems had principally became established since the
management shift in 1992
(2) The 28 commercial farms are located in the surround-
ings of the experimental farm Scheyern (mean distance
60 km) Of the monitored farms 18 are run organically
(org) 10 conventionally (con) The soils are similar to
those in Scheyern their mean yield productivity
however ranks slightly higher in view of scores
average of 58 (40ndash70) (org) and 61 (45ndash77) (con)
The livestock density is 05 (00ndash14) LSU ha-1 (org)
and 08 (00ndash22) LSU ha-1 (con) The crop rotations
vary broadly The proportion of grain crops amounts to
60 (35ndash80) of the AA (org) and 70 (50ndash80) (con)
respectively Legumes occupy 25 (15ndash45) (org) and 5
(0ndash20) (con) of the AA row crops 3 (0ndash25) (org)
and 15 (0ndash50) (con) respectively
Results
Experimental farm Scheyern
Mass and energy inputs in the cropping system At a
N2 fixation rate of 83 kg ha-1 yr-1 (Table 1) the organic
crop rotation is based on legumes Due to a stock density
of 14 LSU ha-1 large C and N quantities circulate at
farm level For each hectare of arable land 70 kg N
bound in FYM and 9 kg N bound in slurry are available
The residues of sunflower and potatoes non-harvested
GCA and the residues of the cover crop (mustard) are
usually incorporated into the soil The straw of the small
grain crops is used as bedding material and returns to
the land as FYM The CN ratio of the organic matter
supplied to the soil in the organic system is 18 1 on
Table 1 Mass and energy input in the organic farm Scheyern averaging the years 1999ndash2002
Field
Crop1
+ catch crop3N2 fixation
(kg ha-1)
Organic matter input
Energy input2
(GJ ha-1)Type N (kg ha-1) C (kg ha-1)
1 GCA 261 50
2 Potatoes FYM 186 3099 105
Residues4 31 1377
+ undersown mustard Green manure4 46 851 11
3 Winter wheat FYM 99 1714 47
Slurry 18 107
4 Sunflower FYM 82 1310 35
Slurry 8 50
Straw4 39 1096
+ undersown GCA 31 Green manure4 46 808 15
5 GCA 236 46
6 Winter wheat FYM 26 477 49
Slurry 23 139
7 Winter rye FYM 95 1625 43
Slurry 17 102
+ undersown GCA 50 14
Crop rotation 83 102 1822 59
Grassland 33 FYM 10 156 27
Slurry 8 50
Excreta 87 890
Agricultural area (AA) 60 104 1499 45
1 Crop rotation (1) GCA (Lolium perenne L + Trifolium pratense L +Medicago sativa L) (2) potatoes (Solanum tuberosumL)+ undersown mustard (Sinapis alba L) (3) winter wheat (Triticum aestivum L) (4) sunflower (Helianthus annuus L) + undersownGCA (5) GCA (6) winter wheat and (7) winter rye (Secale cereale L) + undersown GCA2 To calculate the energy input the following energy equivalents per kilogram were assumed diesel 466 MJ mineral N 353 MJP fertilizer 362 MJ K fertilizer 112 MJ herbicides 288 MJ insecticides 237 MJ seed of winter wheat 55 MJ potato seed 13 MJmachines 108 MJ12443 All information on catch crops in italic4 Non-harvested plant biomass (potato vines non-harvested biomass of mustard and GCA and sunflower straw) Stubble roots andrhizodeposition are not included
Modeling carbon cycles and estimation of greenhouse gas emissions 43
httpwwwcambridgeorgcoreterms httpdxdoiorg101017S1742170507002062Downloaded from httpwwwcambridgeorgcore Technical University of Munich University Library on 14 Oct 2016 at 131211 subject to the Cambridge Core terms of use available at
an average (FYM 17 1 slurry 6 1 and residues
24 1ndash30 1) The nitrogen returns mainly as organically
fixed N the NH4ndashN proportion in FYM amounts to 25
From the energetic point of view the organic crop
rotation is run as a low-input system with 59 GJ ha-1 yr-1
only potato cropping requires higher energy inputs
(105 GJ ha-1 yr-1) compared to cereals This has to be
attributed to the labor-intensive planting cultivation and
harvesting of potatoes The grassland area is under
extensive use (energy input 27 GJ ha-1)
The conventional farm is oriented on mineral nitrogen
(Table 2) the N doses (145 kg ha-1 yr-1) are typical for the
region Although the farm has specialized on cash crops
over the whole crop rotation period more C and N are
returned in organic form than in the stocked organic
system The reasons are large quantities of straw remaining
on the land for shallow incorporation and also large
amounts of cover crop residues due to favorable growth
conditions The mean CN ratio of the supplied organic
matter is relatively high (24 1) owing to the big share of
straw (slurry 6 1 wheat straw and maize residues 80 1
residues of cover crops and potatoes 27 1)
In view of the energy input of 14 GJ ha-1 yr-1 the system
is run on a high-input level
Production performance and efficiency levels in thecropping system Depending on the type of management
yields are clearly differentiated Potatoes and winter wheat
are grown in both crop rotations a juxtaposition of the
yield productivity of these crops underlines the higher
yield level under conventional management (Tables 3
and 4) In the organic crop rotation the recorded 83 Mg
ha-1 yr-1 corresponds to about 57 of the conventional
DM yield 163 kg N ha-1 yr-1 equal to about 66 of the N
removal and 3741 kg C ha-1 yr-1 to roughly 56 of the C
bound in the conventional rotation (Tables 3 and 4)
The N surplus (N input minus N removal) amounts
to 22 kg ha-1 yr-1 (org) versus 28 kg ha-1 yr-1 (con)
Considering the measured N emissions of 16 kg ha-1 yr-1
and the calculated changes of 35 kg ha-1 yr-1 (org) and
ndash24 kg ha-1 yr-1 (con) in the soil N reserves due to changes
in humus level (Tables 5 and 6) N surplus figures have to
be adjusted to 3 kg ha-1 yr-1 (org) and 68 kg ha-1 yr-1
(con) respectively This reveals higher N loss potentials in
the conventional system
The energy outputinput ratio displays clear differences
in the energy efficiency of crops and crop rotations By far
the highest energy efficiency is reached in GCA cropping
due to low inputs (no fertilizer application) but high energy
binding in the harvested biomass Averaging the organic
crop rotation 18 GJ are bound per GJ of supplied energy
this value ranks about 60 above that of the conventional
farm If the straw harvested in the organic farm were
evaluated in an energy balance sheet the energy output
input ratio would rise to at least 21 Interpreting this value
it must be underlined that the harvested straw is destined
only for animal bedding without any utilization in feeding
or as energy source
On-farm C cycles Depending on the farm structure
mass fluxes in both systems are basically different the
organic system is oriented on closed cycles the conven-
tional counterpart on transitional fluxes (Figs 1 and 2)
The organic farm imports considerable forage quantities
from adjacent organic areas thus supporting its C fluxes
The C assimilation efficiency of the organic farm reaches
nearly 70 of that of the conventional farm because GCA
and grassland leave a large root mass in the soil In the
organic system the C input with crop and root residues is
80 higher than in the conventional variant On the other
hand extremely large C quantities are supplied to the soils
of the conventional farm as straw and green biomass which
raises the total C input in the conventional system to
4253 kg ha-1 yr-1 and exceeds the C supply to the organic
system (3497 kg ha-1 yr-1) Depending on the different
humus replacement potential of FYM and slurry compared
Table 2 Mass and energy input in the conventional farm Scheyern averaging the years 1999ndash2002
Field
Crop1
+ catch crop3Mineral N
(kg ha-1)
Organic matter input
Energy input2
(GJ ha-1)Type N (kg ha-1) C (kg ha-1)
1 Potatoes 90 Residues4 75 2495 161
+ catch crop mustard 20 Green manure4 127 2011 20
2 Winter wheat 160 Slurry 46 360 116
Straw4 28 2182
3 Maize 130 Slurry 21 215 125
+ catch crop mustard 20 Slurry 37 390
Green manure4 127 2011 20
4 Winter wheat 160 Slurry 28 208 116
Straw4 30 2355
Crop rotation 145 130 3057 140
1 Crop rotation (1) potatoes +mustard as catch crop (2) winter wheat (3) maize (Zea mays L) +mustard as catch crop (4) winter wheat2 Energy equivalents see Table 13 All information on catch crops in italic4 Non-harvested plant biomass (potato vines non-harvested biomass of mustard and cereal straw) Stubble roots and rhizodeposition arenot included
44 B Kustermann et al
httpwwwcambridgeorgcoreterms httpdxdoiorg101017S1742170507002062Downloaded from httpwwwcambridgeorgcore Technical University of Munich University Library on 14 Oct 2016 at 131211 subject to the Cambridge Core terms of use available at
to straw and the humus accumulation by GCA a rise in the
SOC was estimated for the AA of the organic system and a
decline for the conventional system A C steady state (DSOC = 0) has been assumed for the grassland during the
regarded period because it represents permanent grassland
without any changes in management
By way of computing the soil-borne CO2 respiration
(= SD C input-D SOC) turned out to be 3293 kg ha-1 yr-1
(org) and 4501 kg ha-1 yr-1 (con) (Figs 1 and 2)
The differing yield levels but mainly the different
use of the products produce substantial variations in the
C output In the cash crops 342 kg ha-1 yr-1 (org) and
3894 kg ha-1 yr-1 (con) respectively are fixed The C
quantities in animal products amount to 127 kg ha-1 yr-1
(org) The stock-keeping organic farm involves C loss
processes that do not take place in the cash crop farm for
example metabolic CH4 (109 kg C ha-1 yr-1) and CO2
emissions from the animals (1300 kg C ha-1 yr-1) as well
Table 3 ANPP and energy efficiency in the organic farm Scheyern averaging the years 1999ndash2002
Field
Crop
+ catch crop1
ANPP Energy
outputinput
ratio4Type DM (Mgha-1) N (kg ha-1) C (kg ha-1) GJ2 (ha-1)
1 GCA Forage 118 304 5335 213 426
2 Potatoes Tubers 49 66 2044 84 80
Green manure 34 31 1377 59
+ undersown mustard Green manure 19 46 851 32
3 Winter wheat Grain 24 49 1110 45 96
Straw 22 10 1016 39
4 Sunflower Grain 16 46 864 43 122
Straw 24 39 1096 43
+ undersown GCA Green manure 18 46 808 32
5 GCA Forage 109 283 4942 197 428
6 Winter wheat Grain 31 69 1403 58 119
Straw 28 13 1320 50
7 Winter rye Grain 29 48 1317 54 126
Straw 29 16 1365 53
+ undersown GCA Forage 29 76 1339 53 379
Crop rotation 83 163 3741 1073 180
Grassland Forage 62 136 2819 111 411
Agricultural area 73 151 3330 1093 283
1 All information on catch crops in italic2 To calculate the energy recovery in ANPP the following calorific values per kg DM were assumed potato tubers 172 MJ potatovines 170 MJ winter wheat grain 186 MJ winter wheat straw 177 MJ winter rye grain 183 MJ winter rye straw 183 MJ GCA181 MJ sunflower grain 268 MJ sunflower straw 180 MJ mustard 166 MJ103 Energy recovery in ANPP of the main products (without byproducts and non-harvested biomass)4 Energy outputinput ratio = energy recovery in ANPP of the main productsenergy input
Table 4 ANPP and energy efficiency in the conventional farm Scheyern averaging the years 1999ndash2002
Field
Crop
+ catch crop1
ANPP Energy
outputinput
ratio4DM (Mgha-1) N (kg ha-1) C (kg ha-1) GJ2 (ha-1)
1 Potatoes Tubers 89 128 3695 153 95
Green manure 62 75 2495 106
+ catch crop mustard Green manure 42 127 2011 71
2 Winter wheat Grain 59 144 2760 110 95
Straw 47 28 2182 84
3 Maize Silage 138 178 6204 255 204
+ catch crop mustard Green manure 42 127 2011 71
4 Winter wheat Grain 55 149 2917 103 89
Straw 44 30 2355 78
Crop rotation 145 247 6658 1553 111
1 All information on catch crops in italic2 Calorific values see Table 33 Energy recovery in ANPP of the main products (without byproducts and non-harvested biomass)4 Energy outputinput ratio = energy recovery in ANPP of the main productsenergy input
Modeling carbon cycles and estimation of greenhouse gas emissions 45
httpwwwcambridgeorgcoreterms httpdxdoiorg101017S1742170507002062Downloaded from httpwwwcambridgeorgcore Technical University of Munich University Library on 14 Oct 2016 at 131211 subject to the Cambridge Core terms of use available at
Table 5 Annual C sequestration and estimated emissions of greenhouse gases in the organic farm Scheyern averaging the years 1999ndash2002
Field
Crop
+ catch crop1
C sequestration in SOM Fertilizer Fuel Pesticides Machines N2O Net GGE5ndash7
D C Crop2
(kg ha-1)
D C Manure3
(kg ha-1)
CO2 eq
(kg ha-1)
CO2 eq
(kg ha-1)
CO2 eq
(kg ha-1)
CO2 eq
(kg ha-1)
CO2 eq
(kg ha-1)
CO2 eq
(kg ha-1)
CO2 eq
(kg ha-1)
1 GCA 916 0 - 3362 0 345 0 121 1733 - 1203
2 Potatoes - 1073 1259 - 681 0 366 62 352 1358 1417
+ undersown mustard 110 110 - 808 0 94 0 9 247 - 4713 Winter wheat - 626 696 - 255 0 213 0 168 782 869
4 Sunflower - 719 412 1128 0 204 0 145 602 2039
+ undersown GCA 307 516 - 3022 0 92 0 11 683 - 22775 GCA 945 0 - 3470 0 316 0 114 1644 - 1436
6 Winter wheat - 806 191 2256 0 252 0 153 375 2996
7 Winter rye - 650 592 213 0 225 0 177 720 1295
+ undersown GCA 394 0 - 1447 0 95 0 9 416 - 967Crop rotation - 1724 5394 - 1350 0 315 9 180 1227 323
Grassland 0 0 0 0 195 0 55 813 1023
Agricultural area - 95 299 - 748 0 261 5 124 1042 635
1 All information on catch crops in italic2 C sequestration net effect of the grown crop on SOC caused by C inputs (stubble roots C rhizodeposition) influence on C mineralization and C immobilization including the effects ofthe production technology (ie type and intensity of tillage) computed with humus balancing Negative values indicate a SOC decrease positive values a SOC increase3 C sequestration net effect of the applied fertilizer (FYM and slurry) and the supply of plant biomass to the soil (straw residues non-harvested biomass of mustard and GCA) on SOCwith consideration of the specific humus replacement rate (see Methods and Materials) computed with humus balancing4 Averaging the crop rotation C sequestration amounts to 367 (539ndash172) kg C ha-1 yr-1 this equals a N immobilization in SOM of 35 kg N ha-1 yr-1 at a CN-ratio of 1051 in SOM5 To calculate the GGEs the following CO2 emissions per kilogram were assumed diesel 419 kg mineral N 286 kg P fertilizer 257 kg K fertilizer 073 kg herbicides 2310 kginsecticides 2310 kg seed of winter wheat 055 kg potato seed 013 kg machines 471 kg446 Plus denotes an increase minus a reduction in net GGEs7 To calculate the net GGEs a methane uptake by the soil of 40 kg CO2 eq ha-1 yr - 1 is considered
46
B
Kusterm
annet
al
httpww
wcam
bridgeorgcoreterms httpdxdoiorg101017S1742170507002062
Dow
nloaded from httpw
ww
cambridgeorgcore Technical U
niversity of Munich U
niversity Library on 14 Oct 2016 at 131211 subject to the Cam
bridge Core terms of use available at
as losses from farm manure on store (Fig 1) Due to their
high specific GWP CH4 emissions have a particular
importance
Inventory of climate relevant gases The inventory of
climate relevant gases (Tables 5 and 6) includes exclusively
the cropping sector and allows comparisons of the systems
on the levels arable land crop rotation and crop species
Emissions from the livestock sector were not considered
The results elucidate the influence of crops and
fertilization (D SOC) cropping intensity (energy input)
and crop rotation pattern on the emission of greenhouse
gases The biggest influence on the greenhouse effect is
exerted by the D SOC and N2O emissions The GGEs [CO2
eq] caused by fuel input (org 315 kg ha-1 yr-1 and con
389 kg ha-1 yr-1) and the manufacture of the machines
(org 180 kg ha-1 yr-1 and con 194 kg ha-1 yr-1) are
equally high in both crop rotations More intensive tillage
manure spreading operations and more field passages for
mechanical crop cultivation in the organic farm are
compensated in the conventional farm by operations for
spreading mineral fertilizer and pesticides and also by a
higher input for harvesting the larger biomass yields As a
result of mineral N and pesticide applications additional
637 kg ha-1 yr-1 CO2 eq from the upstream sector are
emitted in the conventional system
Pertaining to the mitigation of GGEs the most favorable
effect among the crops with a negative greenhouse effect is
reached by GCA owing to C sequestration in the range of
about 09 Mg ha-1 yr-1 High GGE values were obtained for
the row crops potato and maize favorable levels for catch
crops Related to the cultivated area the organic rotation
produces only 10 of the greenhouse effect of the con-
ventional rotation related to the energy fixed in the
harvested products approximately 18
Results of 28 farms in the region
The mean energy input in the organic farms amounts
to 53 GJ ha-1 yr-1 (Table 7) which corresponds to the
situation in the organic farm in Scheyern Due to dif-
ferences in cropping structures and management some
farms rank above this level by up to 50 The application
of mineral fertilizers and chemical plant protection involves
clearly higher energy inputs in the conventional farms
(117 GJ ha-1 yr-1) Within the range of fluctuation (95ndash
150 GJ ha-1 yr-1) only one farm exceeded the crop-
ping intensity of the conventional system in Scheyern
(140 GJ ha-1 yr-1)
In the organic farms DM yields (20ndash77 Mg ha-1 yr-1)
vary much more than in the conventional farms
(45ndash90 Mg ha-1 yr-1) The highest-yielding organic farms
reach the mean yield level of the conventional farms The
DM yields are not only conditioned by the management
system (org versus con) but also by the disposal of the
grown biomass High DM yields were recorded mainly
in connection with a high harvest index (ie use of
byproducts and catch crops) The energy efficiencyTable
6
An
nu
alC
seq
ues
trat
ion
and
esti
mat
edem
issi
on
so
fg
reen
ho
use
gas
esin
the
con
ven
tio
nal
farm
Sch
eyer
nav
erag
ing
the
yea
rs1
99
9ndash
20
02
Field
Crop
+catchcrop1
Csequestrationin
SOM
Fertilizer
Fuel
Pesticides
Machines
N2O
Net
GGE5ndash7
DCcrop2
(kgha-1)
DCmanure
3
(kgha-1)
CO
2eq
(kgha-1)
CO
2eq
(kgha-1)
CO
2eq
(kgha-1)
CO
2eq
(kgha-1)
CO
2eq
(kgha-1)
CO
2eq
(kgha-1)
CO
2eq
(kgha-1)
1P
ota
toes
-1
23
02
96
34
26
25
43
52
34
12
68
11
15
57
17
+catchcropmustard
116
261
-1384
61
250
34
55
853
-170
2W
inte
rw
hea
t-
56
35
45
64
46
72
20
13
21
32
14
22
23
97
3M
aize
-7
95
70
26
61
48
12
68
84
13
69
47
45
37
+catchcropmustard
116
261
-1384
61
250
34
55
853
-170
4W
inte
rw
hea
t-
60
35
34
25
54
62
21
71
39
12
81
31
72
47
9
Croprotation
-7404
4924
910
446
389
191
194
1627
3697
1Allinform
ationoncatchcropsin
italic
23
Est
imat
ion
of
Cse
qu
estr
atio
nse
eT
able
5
4A
ver
agin
gth
ecr
op
rota
tio
n
Cse
qu
estr
atio
nw
asndash
24
8(4
92
ndash7
40
)k
gC
ha-
1y
r-1
this
equ
als
toa
Nim
mo
bil
izat
ion
inS
OM
of
ndash2
4k
gN
ha-
1y
r-1
ata
CN
-rat
ioo
f1
05
1in
SO
M
5C
alcu
lati
on
of
the
GG
Es
see
Tab
le5
6
Plu
sd
eno
tes
anin
crea
se
min
us
are
du
ctio
nin
net
GG
Es
7T
oca
lcu
late
the
net
GG
Es
am
eth
ane
up
tak
eb
yth
eso
ilo
f4
0k
gC
O2
eqh
a-
1y
r-1
isco
nsi
der
ed
Modeling carbon cycles and estimation of greenhouse gas emissions 47
httpwwwcambridgeorgcoreterms httpdxdoiorg101017S1742170507002062Downloaded from httpwwwcambridgeorgcore Technical University of Munich University Library on 14 Oct 2016 at 131211 subject to the Cambridge Core terms of use available at
expressed as energy outputinput ratio is on the same level
in organic and conventional farms
The calculated C sequestration [CO2 eq] varies broadly
both in organic and conventional farms Averaging all
organic farms C sequestration amounts to (+123 kg C ha-1
yr-1 = reduction of the greenhouse effect by 452 kg CO2
eq ha-1 yr-1) while the conventional farms reveal depleting
SOC levels (-73 kg C ha-1 yr-1 with an increase of the
greenhouse effect by 266 kg CO2 eq ha-1 yr-1) The devia-
ting development of the SOC stock is caused by different
crop rotations (high legume proportion (org) versus high
proportion of cereals and row crops (con)) and by the
quantity and quality of the organic matter supplied to the soil
(mainly FYM (org) versus straw and slurry input (con))
In view of lower N and energy inputs in the organic
farms their N2O and CO2 emissions are clearly lower
The area-related total GGEs from the conventional farms
(2717 kg CO2 eq ha-1 yr-1) with consideration of SOC
changes are nearly threefold higher than the GGE from
the organic farms (887 kg CO2 eq ha-1 yr-1)
The differences are lower when we regard the single crop
species Winter wheat is directly comparable because of its
major position in the cropping structure of both farming
systems (org and con) Regarding the 1669 kg CO2 eq ha-1
averaging all organic farms we come to 72 of the
emissions from conventional systems When we focus on
the harvested product [per Mg DM] lower yields in organic
farming involve higher emissions (496 kg CO2 eq Mg-1
(org) and 355 kg CO2 eq Mg-1 con) When all products
[Mg DM] of the analyzed crop rotation are taken into
account organic management produced emissions of
263 kg CO2 eq Mg-1 for the conventional management
376 kg CO2 eq Mg-1 were computed
Breaking down the farms according to their stock
density the following emissions were computed (in kg
CO2 eq ha-1 yr-1)
$ organic farms keeping livestock 851 kg CO2 eq (thereof
emissions from fossil energy input 523 kg CO2 eq C
sequestration -658 kg CO2 eq N2O emissions 986 kg
CO2 eq)
$ organic farms without livestock 936 kg CO2 eq (thereof
emissions from fossil energy input 359 kg CO2 eq C
sequestration -167 kg CO2 eq N2O emissions 744 kg
CO2 eq)
$ conventional farms with livestock 2531 kg CO2 eq
(thereof emissions from fossil energy input 990 kg CO2
eq C sequestration 64 kg CO2 eq N2O emissions
1477 kg CO2 eq)
$ conventional farms without livestock 2939 kg CO2 eq
(thereof emissions from fossil energy input 1093 kg CO2
eq C sequestration 510 kg CO2 eq N2O emissions
1336 kg CO2 eq)
Stocked farms reach higher C sequestration values due to
the benefits of crop rotation (more forage cropping) and the
effects of organic fertilizer There is a tendency to increased
N2O emissions in stocked farms caused by higher N inputs
with manure and legume fodder crops Organic farms with
stock require higher energy inputs connected with increased
C emission due to additional harvesting and transport
operations for forage provision In principal it can be stated
that the basic system-related differences in the emission
potentials between organic and conventional farms con-
tinue to exist also when we distinguish between stocked
and stockless systems
Relationship between energy input and GWP The
parameters energy input and net greenhouse effect in the
Table 7 Coefficients of mass and energy budget C sequestration and estimated GGEs in the monitored farms averaging the arable land
Parameter Unit
Organic farms (18 + 1) Conventional farms (10 + 1)
Scheyern Medium Min Max Scheyern Medium Min Max
Energy input1 GJ ha-1 59 53 41 78 140 117 95 150
N input2 kg N ha-1 204 152 108 227 296 246 193 304
DM yield Mg ha-1 58 38 20 77 85 76 45 90
Energy outputinput ratio 180 130 60 193 111 118 61 162
C sequestration3 CO2 eq kg ha-1 - 1350 - 452 - 1830 489 910 266 - 659 910
N2O emissions CO2 eq kg ha-1 1227 887 631 1322 1627 1418 1123 1771
Emissions from fossil energy input CO2 eq kg ha-1 504 454 320 750 1220 1037 819 1220
Net GGE45 CO2 eq kg ha-1 323 887 106 1875 3697 2717 1878 3697
Net GGE winter wheat5 CO2 eq kg ha-1 1968 1669 - 278 2966 2514 2333 1478 3680
Net GGE6 CO2 eq kg Mg-1 56 263 23 431 434 376 271 434
Net GGE winter wheat6 CO2 eq kg Mg-1 715 496 - 102 958 441 355 213 545
1 Energy equivalents see Table 12 N input = sum of N emissions (16 kg ha-1 yr-1) N2 fixation organic and mineral fertilizer and non-harvested residues3 Plus denotes mineralization and loss of SOC to the atmosphere minus denotes an immobilization and sequestration of C in the soil4 Plus denotes an increase minus a reduction in net GGEs5 Area-related calculation of the GGEs6 Product-related calculation of the GGEs
48 B Kustermann et al
httpwwwcambridgeorgcoreterms httpdxdoiorg101017S1742170507002062Downloaded from httpwwwcambridgeorgcore Technical University of Munich University Library on 14 Oct 2016 at 131211 subject to the Cambridge Core terms of use available at
experimental farm Scheyern and in the analyzed commer-
cial farms (n = 28+2) have been compared in Figure 3
When all test farms are regarded as a basic population
a linear relationship is recorded between energy input
and net greenhouse effect (r2 = 069) Emissions rise
with increasing input of fuel fertilizer pesticides and
machines and the involved energy consumption
Distinguishing between organic and conventional farms
produces two clusters and a possible distinction between low
and high-input systems The organic farms are characterized
by low energy inputs (41ndash78 GJ ha-1 yr-1) and low GGE
values (106ndash1875 kg CO2 eq ha-1 yr-1) They are in contrast
with the conventional farms and their principally higher
energy inputs (95ndash150 GJ ha-1 yr-1) and higher GGE
values (1878ndash3697 kg CO2 eq ha-1 yr-1) The relationship
between energy input and greenhouse effect appears to be
fuzzy because it has been affected by D SOC and N2O
emissions Supposing the D SOC of the experimental farm
Scheyern were not considered the net greenhouse effect
of the organic rotation would rise markedly while that of
the conventional rotation would decrease (Fig 3)
Discussion
While sophisticated software programs for the analysis of
nitrogen and energy fluxes at the farm level have been
developed (eg1431ndash33) few tools are available for the
balancing of carbon fluxes in the system soilndashplantndashanimalndash
environment In the literature various models have been
described for the estimation of relevant CO2 CH4 and N2O
sources and sinks There exist for example economic
models with linear programming supplemented by algo-
rithms for the estimation of the GWP of farms3435
However they do not link technical and biological C
fluxes The model REPRO is oriented on the description of
such on-farm C fluxes it combines the balancing of
C N and energy fluxes A guiding principle during the
development of the model was the depiction of farms as
systems (Figs 1 and 2) This distinguishes REPRO from
other approaches Analyses of farm enterprises on the basis
of REPRO have shown that the analysed mass cycles
depend on site conditions (soil and climate) farm structure
(livestock density and crop rotation) inputs (fertilizers
pesticides and energy) outputs (plant and animal products
for market presentation) cropping technologies (tillage and
harvest procedure) and also on the interactions between
these factors (see1214) The relationships between manage-
ment C cycles and emission potentials have been
demonstrated in detail in the example of the experimental
farm Scheyern Scheyern was divided into two independent
farming systems with highly different mass fluxes despite
comparable site conditions The organic farm is character-
ized by a high crop diversity The multiple legume-based
rotation favors high N2 fixation rates high stock numbers
allow an intensive recycling of the organic matter mainly
by recirculating high-quality fertilizers in the form of FYM
The mass fluxes in the farm are oriented on closed matter
cycles from the energetic point of view the system is run
on a low-input basis Thus Scheyern largely fulfills a basic
criterion of organic farming a principally closed mass
cycle in a multi-structured farm Only the relatively high
feed extra-purchase and the involved C and N imports
intensify the farm-internal mass fluxes decisively thus
restricting nutrient self-sufficiency The conventional farm
in Scheyern represents a very simply structured cash crop
system with a crop rotation of low diversity The farm is
based on mineral nitrogen with transit character from the
energetic point of view a high-input system
A rich database is available for the experimental farm
Part of the measured values for example yields and nutrient
y = 23895x ndash 21862R2 = 069
0
500
1000
1500
2000
2500
3000
3500
4000
0 2 4 6 8 10 12 14 16
Energy input (GJ handash1)
Organic farms Conventional farms Scheyern organic farm Scheyern conventional farm
GG
E (
kg C
O2
eq h
andash1 )
SOCWith
SOCWith
SOCWithout
SOCWithout
Figure 3 Energy input and GGE kg CO2 eq ha - 1 of the arable area in the organic and conventional farm in Scheyern and in the
analyzed organic (n = 18) and conventional (n = 10) commercial farms
Modeling carbon cycles and estimation of greenhouse gas emissions 49
httpwwwcambridgeorgcoreterms httpdxdoiorg101017S1742170507002062Downloaded from httpwwwcambridgeorgcore Technical University of Munich University Library on 14 Oct 2016 at 131211 subject to the Cambridge Core terms of use available at
contents were used in the model calculations Other data
for instance emission and SOC measurements are useful
for the verification of the computed results
The cropping systems in Scheyern have differentiated
effects on SOC For the years 1999ndash2002 the calculated
mean C sequestration was 037 Mg ha-1 (org) and
ndash025 Mg ha-1 (con) respectively (Tables 5 and 6) The
levels determined for 1991ndash2001 are lower 016 Mg
ha-1 yr-1 (org) and ndash008 Mg ha-1 yr-1 (con) due to lower
livestock density lower use intensity in the early 90s and a
modified crop rotation
The chemico-analytical determination of SOC after 10
years of differentiated land use (1991ndash2001) revealed a SOC
increase by 018 Mg ha-1 yr-1 (org n = 106) and a SOC de-
crease by 012 Mg ha-1 yr-1 (con n = 116) respectively30 It
becomes obvious that measured and computed results are in
good agreement For a final evaluation however a longer
period of monitoring will be necessary (see36)
C sequestration in the soil is often more influenced by the
quality of the organic primary matter (probably because
organic matter and residues with close CN ratio are already
partly decomposed and contain an increased proportion of
chemically recalcitrant organic compounds) than by the
quantity of the supplied matter (see37) this has to be taken
into account when C cycles are to be described
In Scheyern SOC values increased under organic and
declined under conventional farming although the conven-
tional crop rotation is a reduced-till system with higher C
inputs According to the humus balance C sequestration
relies strongly on the quality of the organic fertilizer (FYM
versus straw) as well as on the legume share in the
rotation For GCA C sequestration turned out to be
093 Mg ha-1 yr-1 for maize (-072 Mg ha-1 yr-1) and
potatoes (- 093 Mg ha-1 yr-1 con) negative effects on
SOC were computed In Scheyern only the overall
influence of a cropping system on the SOC can be
measured and not the separate effects by crops and
fertilization measures This would require a different
approach for example factorial field experiments Experi-
ments on C sequestration by perennial legumes however
were already described in detail in literature and confirm
the values communicated here For example the C
sequestration rate of alfalfa obtained in field experiments
under different climatic and soil conditions was reported to
be 05 to gt10 Mg ha-1 yr-1 (341238)
In the present paper the net greenhouse effect has been
estimated with regard to the C sequestration It should be
pointed out that C accumulation and depletion as induced
by management shifts are temporarily limited and that with
the development of new steady states D SOC finally falls to
zero39 In view of this situation (D SOC = 0) the GGEs
[CO2 eq] in Scheyern reached 1673 kg ha-1 yr-1 (org)
versus 2787 kg ha-1 yr-1 (con) which is clearly different
from Tables 5 and 6 According to these findings in the
organic crop rotation about 60 of the GGEs from
the conventional rotation are area-related and gt100
product-related
The N2O emissions were quantified following IPCC19 To
simplify the calculation it was assumed that 00125 kg N2Ondash
N kg - 1 N input (deposition mineral N organic N and
symbiotic N2 fixation) is emitted In recent publications this
relationship between N input and N2O emission was princi-
pally confirmed Petersen et al40 found an emission factor of
0016 kg N2OndashN kg - 1 N input (r2 = 056) in European crop
rotations Gregorich et al41 reported for Canadian conditions
0012 kg N2OndashN kg - 1 N input (r2 = 043)
Long-term measurements in Scheyern revealed that
the IPCC method may lead to an underestimation of
N2O emissions (Tables 5 and 6)8 The N2O emissions [kg
N2OndashN ha-1 yr-1] computed by us per hectare and year
amounted to 08ndash31 kg for winter wheat 24ndash29 kg for
potatoes the measured values were 18ndash168 kg for winter
wheat and 53ndash82 kg for potatoes Some N2O measurement
series in Scheyern for example in wheat42 furnished N2O
emission levels in the order of IPCC values other
measurements like those in potatoes42 ranked clearly above
the computed levels It turned out that in potato crops very
high N2O quantities were emitted from the inter-ridge
space42 According to Flessa et al8 the high N2O emissions
in Scheyern may probably be attributed to the local soil
properties (high soil bulk density and soil water content low
O2 availability) and the climatic conditions favoring
denitrification Also increased emissions induced by freez-
ing and thawing events occurred each year and accounted
for a substantial part (30ndash50) of the annual emissions842
The N2O measurement series made in Scheyern shows
that it is principally extremely difficult to project selective
and temporarily limited measurements to large areas or
even whole farms Unfortunately a generally applicable
algorithm that considers beside N inputs other influential
parameters like site conditions crop species tillage and soil
N turnover could not yet be derived from the values
measured in Scheyern Tools for a more precise estimation
of emissions are simulation models for example the
software DNDC43 Currently this software is in validation
using N2O measurement data from Scheyern
Supposing a higher N2OndashN emission factor (253 of
the total N input according to Flessa et al8 instead of
125 as calculated by IPCC24) is assumed the emission
inventory would be modified as follows The GGEs [CO2
eq] resulting from N2O would rise from 1227 to
2483 kg ha-1 yr-1 (org) and from 1627 to 3294 kg ha-1 yr-1
(con) respectively the total GGEs from both crop rotations
would increase to 1579 kg ha-1 yr-1 (org) and 5363 kg
ha-1 yr-1 (con) Accordingly the organic rotation would
reach 30 of the net greenhouse effect recorded in the
conventional rotation
The application of the model REPRO in 28 farms in
southern Germany (Tables 7 and Fig 3) revealed under the
given local conditions distinct differences between organic
and conventional farms concerning their structure mass
and energy inputs yields C sequestration and GGEs
From the energetic point of view the organic farms are
low-input the conventional farms high-input systems The
50 B Kustermann et al
httpwwwcambridgeorgcoreterms httpdxdoiorg101017S1742170507002062Downloaded from httpwwwcambridgeorgcore Technical University of Munich University Library on 14 Oct 2016 at 131211 subject to the Cambridge Core terms of use available at
energy input is primarily related to the mineral N input
Increasing mineral N and energy inputs enhance also the
area-related N2O and CO2 emissions there is a linear
relationship between energy input and GGEs per hectare
(Fig 3) Further factors are integrated in the computing of
net GGEs like C sequestration symbiotic N2 fixation
energy input by the use of machines and fuel This explains
the enormous variability of the net greenhouse effect in
organic and conventional farms (Fig 3)
Our investigations have revealed that organic farms
produce less area-related GGEs than conventional farms
this was also confirmed by other authors (eg7840) The
mean product-related emissions from organic farms are also
lower but they vary broadly (see Table 7) It is quite
possible that there are organic farms with higher product-
related GGEs than their conventional counterparts One
reason among others is the broad variation of yields
Conclusions
The results communicated in this paper refer to farms under
organic and conventional management The criteria for
farm selection and the model-based analyses were not
targeted at drawing general conclusions on the climatic
relevance of organic and conventional farming or even at
giving recommendations to policy-makers The main
emphasis was placed on testing the model software under
practice conditions The consideration of both organically
and conventionally run farms was to allow the sampling of
the largest possible range of management conditions The
results presented reflect only the system level crop
production in the surveyed agricultural region
Despite of this restriction the investigations admit
preliminary conclusions for the optimization of farm
management and the reduction of GGEs According to our
results organic farming includes a high potential of C
sequestration preferably by the growing of perennial
legumendashgrass blends and the input of FYM In conventional
farming legumes and FYM are nearly neglectable humus
balance sheets point to declining SOC values In some farms
however the situation may be completely different depend-
ing on crop rotation and technological design and therefore
in the final run recommendations and optimization strate-
gies will always require a farm-specific approach The farm
as such has been in the focus of our studies because
management decisions taken at this level have effects on
climate and environment In order to mitigate emissions
problem areas must be identified with attention to farm
specifics subsequently coordinated measures and strategies
must be elaborated In order to gain acceptance by the
farmers the possible economic and ecological consequences
of the implementation of these activities must be predictable
The REPRO model is therefore oriented to an overall rating
of farms according to multiple criteria Besides the
balancing of C N and energy fluxes as described in this
paper further modules are under construction analyzing
harmful soil compaction erosion and biodiversity
Under the umbrella of the German Agricultural Society
an organization for the promotion of technical and scientific
progress in the food and agricultural sector with over
17000 German and international members more than 90
farms in the Federal Republic of Germany are currently
testing the software with the purpose of using it not only in
research but in the future also in the management of farms
Acknowledgements We are grateful to the staff of the experi-mental farm Scheyern for providing all detailed managementinformation and to Mrs Ute Schlosser for reviewing themanuscript We also acknowledge the financial support by theDeutsche Bundesstiftung Umwelt
References
1 Janzen HH 2004 Carbon cycling in earth systemsndashndasha soil
science perspective Agriculture Ecosystems and Environ-
ment 104399ndash417
2 West TO and Marland G 2002 Net carbon flux from
agricultural ecosystems methodology for full carbon cycle
analyses Environmental Pollution 116439ndash444
3 Robertson GP Paul EA and Harwood RR 2000
Greenhouse gases in intensive agriculture contributions of
individual gases to the radiative forcing of the atmosphere
Science 2891922ndash1925
4 Su YZ 2006 Soil carbon and nitrogen sequestration
following the conversion of cropland to alfalfa forage land
in northwest China Soil and Tillage Research 92181ndash189
5 Smith P 2004 Carbon sequestration in croplands the
potential in Europe and the global context European Journal
of Agronomy 20229ndash236
6 Lovett DK Shalloo L Dillon P and OrsquoMara FP 2006 A
systems approach to quantify greenhouse gas fluxes from
pastoral dairy production as affected by management regime
Agricultural Systems 88156ndash179
7 Haas G Geier U Schulz DG and Kopke U 1995
Vergleich konventioneller und organischer Landbau Teil I
Klimarelevante Kohlendioxid-Emission durch den Verbrauch
fossiler Energie Berichte uber Landwirtschaft 73401ndash415
8 Flessa H Ruser R Dorsch P Kamp T Jimenez MA
Munch JC and Beese F 2002 Integrated evaluation of
greenhouse gas emissions (CO2 CH4 N2O) from two farming
systems in southern Germany Agriculture Ecosystems and
Environment 91175ndash189
9 Lewis KA Newbold MJ and Tzilivakis J 1999
Developing an emissions inventory from farm data Journal
of Environmental Management 55183ndash197
10 Hulsbergen K-J Feil B Biermann S Rathke G-W
Kalk W-D and Diepenbrock W 2001 A method of energy
balancing in crop production and its application in a long-term
fertilizer trial Agriculture Ecosystems and Environment 86
303ndash321
11 Schroder P Huber B Olazabal U Kammerer A and
Munch JC 2002 Land use and sustainability FAM Research
Network on Agroecosystems Geoderma 105155ndash166
12 Hulsbergen K-J 2003 Entwicklung und Anwendung eines
Bilanzierungsmodells zur Bewertung der Nachhaltigkeit
landwirtschaftlicher Systeme Shaker Verlag Aachen
13 Hulsbergen K-J and Kustermann B 2005 Development of
an environmental management system for organic farms and
its introduction into practice ISOFAR Proceedings of the
Modeling carbon cycles and estimation of greenhouse gas emissions 51
httpwwwcambridgeorgcoreterms httpdxdoiorg101017S1742170507002062Downloaded from httpwwwcambridgeorgcore Technical University of Munich University Library on 14 Oct 2016 at 131211 subject to the Cambridge Core terms of use available at
Conference lsquoResearching Sustainable Systemsrsquo Adelaide
p 460ndash463
14 Kalk W-D Hulsbergen K-J and Biermann S 1998
Management-related material and energy balances for the
rating of production intensity and environmental acceptability
of land use Archiv fur Acker- Pflanzenbau und Boden
43167ndash182
15 Hulsbergen K-J Feil B and Diepenbrock W 2002 Rates
of nitrogen application required to achieve maximum energy
efficiency for various crops results of a long-term experiment
Field Crops Research 7761ndash76
16 Siebrecht N Lipski A Wenske K and Hulsbergen K-J
2006 Integration eines Geographischen Informationssystems
in ein Umwelt- und Betriebsmanagementsystem Proceedings
der 26 Jahrestagung der Gesellschaft fur Informatik p
269ndash272
17 Rucknagel J Hofmann B Paul R Christen O and
Hulsbergen K-J 2007 Estimating precompression stress of
structured soils on the basis of aggregate density and dry bulk
density Soil and Tillage Research 92213ndash220
18 Abraham J Hulsbergen K-J and Diepenbrock W 1999
Modellierung des Stickstoffhaushaltes landwirtschaftlich
genutzter Flachen im Elbeeinzugsgebiet Mitteilungen der
Gesellschaft fur Pflanzenbauwissenschaften 1277ndash79
19 IPCC 2001 Climate Change The Scientific Basis Cambridge
University Press Cambridge UK
20 Asmus F 1992 Einfluss organischer Dunger auf Ertrag
Humusgehalt des Bodens und Humus-reproduktion Berichte
uber Landwirtschaft Sonderheft 206127ndash139
21 Korschens M Rogasik J and Schulz E 2005 Bilanzierung
und Richtwerte organischer Bodensubstanz Landbau-
forschung Volkenrode 551ndash10
22 Steingrobe B Schmid H Gutser R and Claassen N 2001
Root production and root mortality of winter wheat grown on
sandy and loamy soils in different farming systems Biology
Fertility Soils 33331ndash339
23 Steingrobe B Schmid H and Claassen N 2001 Root
production and root mortality of winter barley and its
implication with regard to phosphate acquisition Plant and
Soil 237239ndash248
24 IPCC 1997 Revised 1996 IPCC Guidelines for National
Greenhouse Gas Inventories Reference Manual Intergovern-
mental Panel on Climate Change Paris
25 Bolger TP Pate JS Unkovich MJ and Turner NC
1995 Estimates of seasonal nitrogen fixation of annual
subterranean clover-based pastures using the 15N natural
abundance technique Plant and Soil 17557ndash66
26 Scheffer F and Schachtschabel P 1998 Lehrbuch der
Bodenkunde Enke Verlag Stuttgart
27 Auerswald K Albrecht H Kainz M and Pfadenhauer J
2000 Principles of sustainable land-use systems developed
and evaluated by the Munich Research Alliance on Agro-
Ecosystems (FAM) Petermanns Geographische Mitteilungen
14416ndash25
28 Auerswald K Kainz M and Fiener P 2003 Soil erosion
potential of organic versus conventional farming evaluated by
USLE modeling of cropping statistics for agricultural districts
in Bavaria Soil Use and Management 19305ndash311
29 Meyer-Aurich A 2005 Economic and environmental analysis
of sustainable farming practicesmdasha Bavarian case study
Agricultural Systems 86190ndash206
30 Ruhling I Ruser R Kolbl A Priesack E and Gutser R
2005 Kohlenstoff und Stickstoff in Agrarokosystemen In
E Osinski A Meyer-Aurich B Huber I Ruhling G Gerl
and P Schroder (eds) Landwirtschaft und Umweltmdashein
Spannungsfeld oekom Verlag Munchen p 99ndash154
31 Refsgaard K Halberg N and Kristensen ES 1998
Energy utilization in crop and dairy production in organic
and conventional livestock production systems Agricultural
Systems 57599ndash630
32 Oenema O Kros H and de Vries W 2003 Approaches and
uncertainties in nutrient budgets implications for nutrient
management and environmental policies European Journal of
Agronomy 203ndash16
33 Schroder JJ Aarts HFM ten Berge HFM van Keulen
H and Neeteson JJ 2003 An evaluation of whole-farm
nitrogen balances and related indices for efficient nitrogen use
European Journal of Agronomy 2033ndash44
34 Neufeldt H Schafer M Angenendt E Li C Kaltschmitt
M and Zeddies J 2006 Disaggregated greenhouse gas
emission inventories from agriculture via a coupled economic-
ecosystem model Agriculture Ecosystems and Environment
112233ndash240
35 Gibbons JM Ramsden SJ and Blake A 2006 Modeling
uncertainty in greenhouse gas emissions from UK agriculture
at the farm level Agriculture Ecosystems and Environment
112347ndash355
36 Smith P 2004 How long before a change in soil organic carbon
can be detected Global Change Biology 101878ndash1883
37 Drinkwater LE Wagoner P and Sarrantonio M 1998
Legume-based cropping systems have reduced carbon and
nitrogen losses Nature 396 262ndash265
38 Meyer-Aurich A Weersink A Janovicek K and Deen B
2006 Cost efficient rotation and tillage options to sequester
carbon and mitigate GHG emissions from agriculture in
Eastern Canada Agriculture Ecosystems and Environment
117119ndash127
39 Johnson MG Levine ER and Kern JS 1995 Soil organic
matter distribution genesis and management to reduce
greenhouse gas emissions Water Air and Soil Pollution
82593ndash615
40 Petersen SO Regina K Pollinger A Rigler E Valli L
Yamulki S Esala M Fabbri C Syvasalo E and Vinther
FP 2006 Nitrous oxide emissions from organic and
conventional crop rotations in five European countries
Agriculture Ecosystems and Environment 112200ndash206
41 Gregorich EG Rochette P VandenBygaart AJ and
Angers DA 2005 Greenhouse gas contributions of agri-
cultural soils and potential mitigation practices in Eastern
Canada Soil Tillage Research 8353ndash72
42 Ruser R Flessa H Schilling R Beese F and Munch JC
2001 Effect of crop-specific management and N fertilization
on N2O emissions from a fine-loamy soil Nutrient Cycling in
Agroecosystems 59177ndash191
43 Li CS 2000 Modeling trace gas emissions from agricultural
ecosystems Nutrient Cycling in Agroecosystems 58259ndash276
44 Kalk W-D Hellebrand HJ Hulsbergen K-J and
Abraham J 2005 Kohlenstoffbilanzen landwirtschaftlicher
Betriebssysteme unterschiedlicher Produktionsintensitat In
H-J Weigel and U Dammgen (eds) Biologische Senken fur
Kohlenstoff in Deutschland Landbauforschung Volkenrode
p 71ndash92
52 B Kustermann et al
httpwwwcambridgeorgcoreterms httpdxdoiorg101017S1742170507002062Downloaded from httpwwwcambridgeorgcore Technical University of Munich University Library on 14 Oct 2016 at 131211 subject to the Cambridge Core terms of use available at
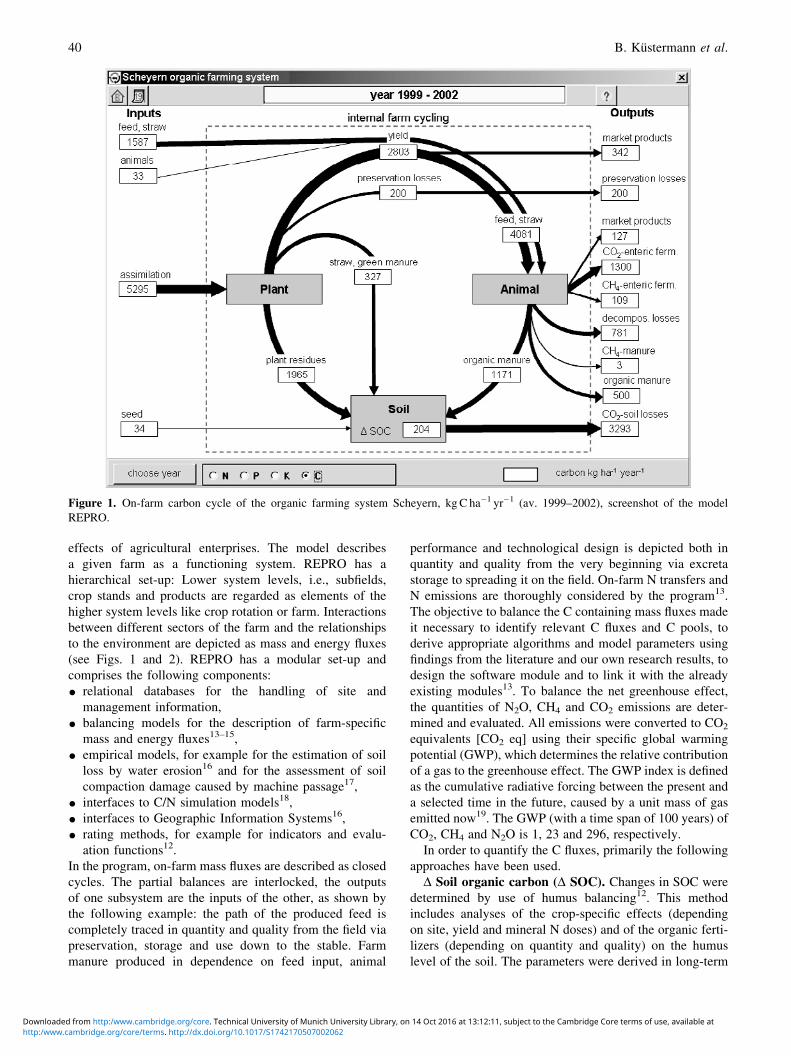
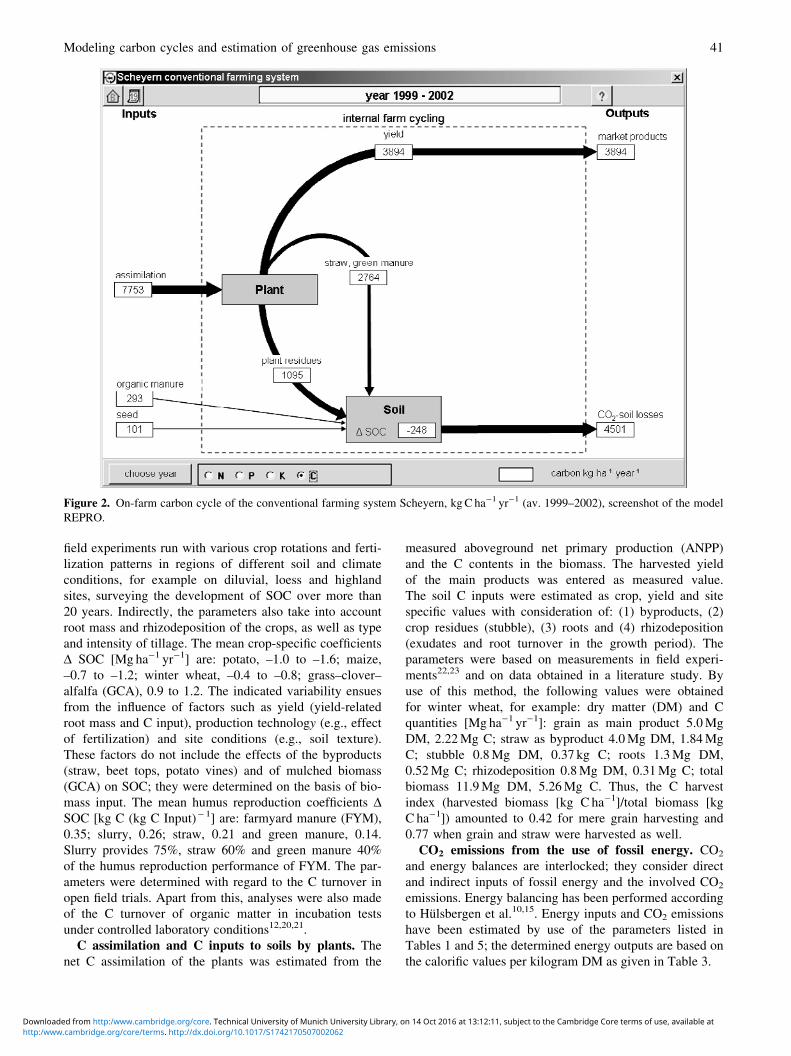
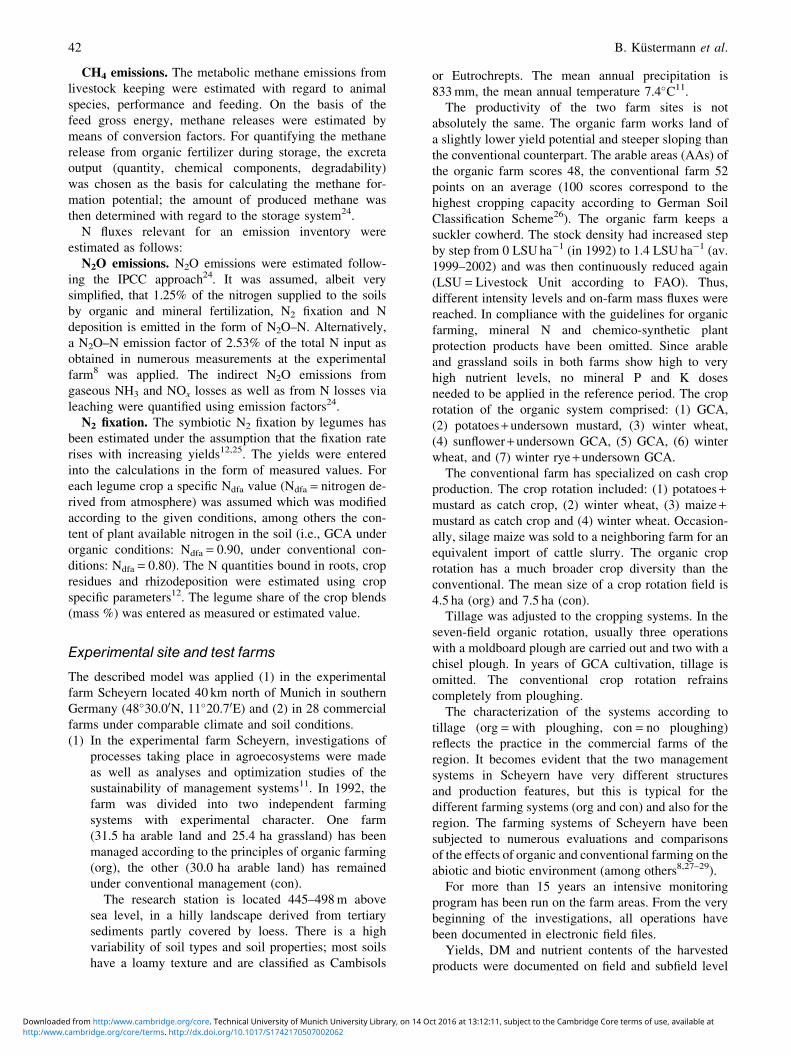
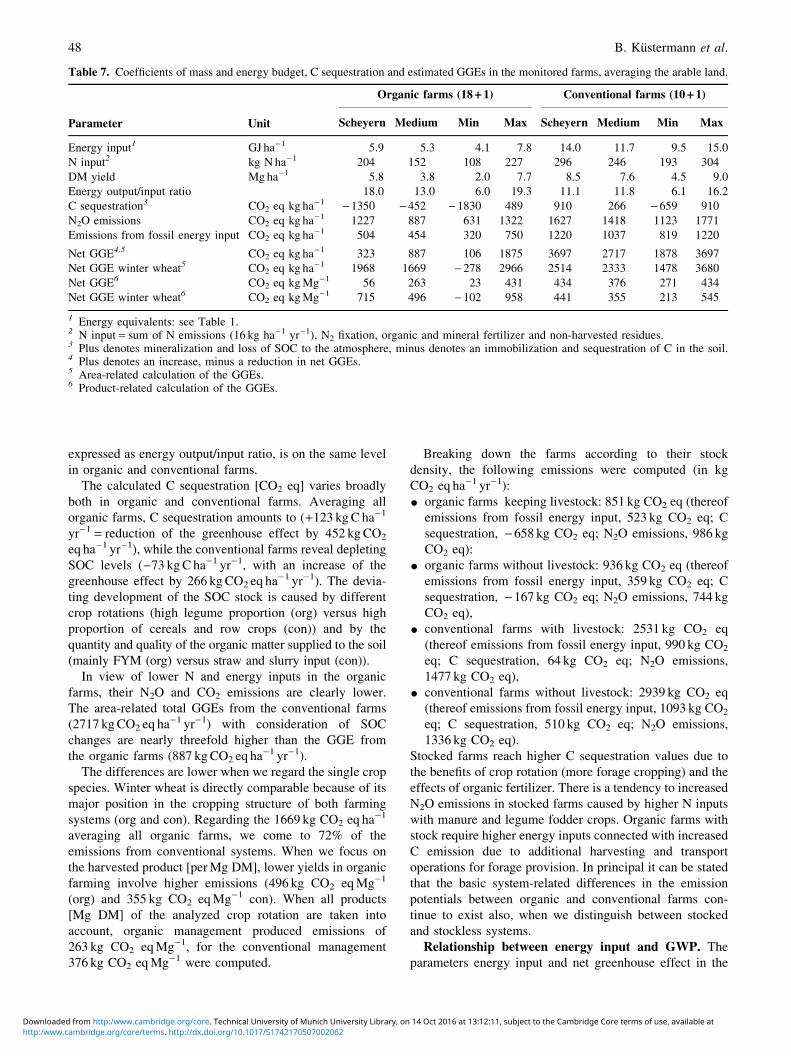
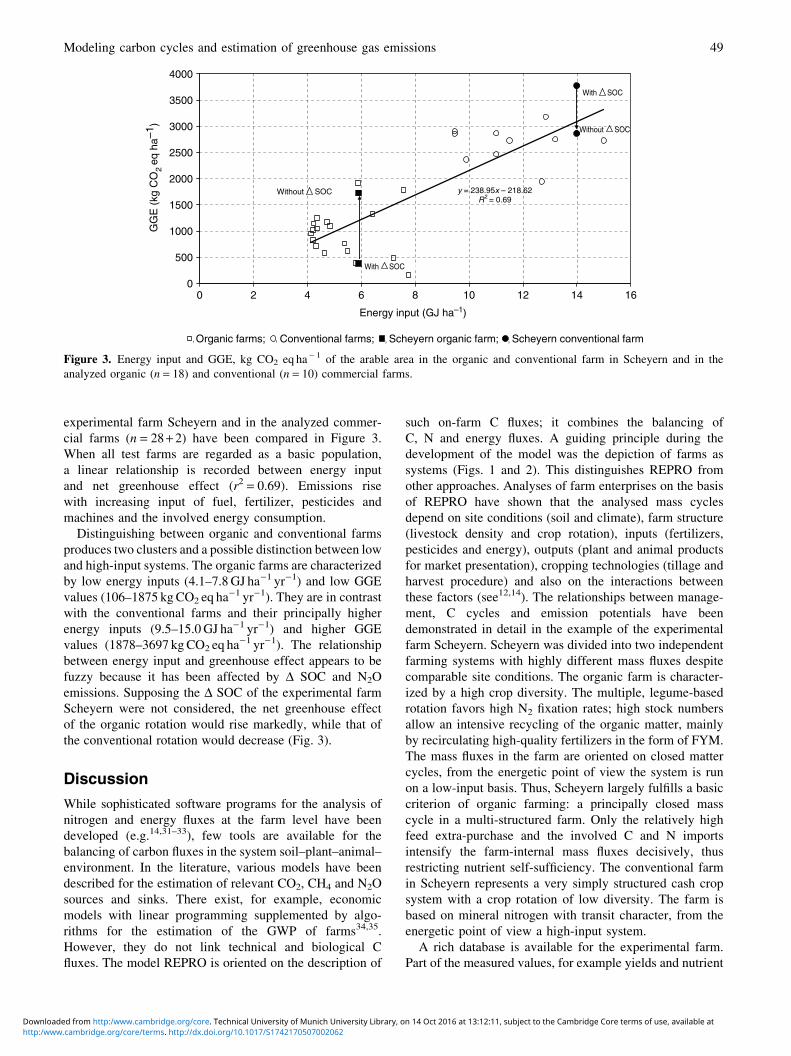