modeling critical success factors for adoption of big data
TRANSCRIPT

93
CDQM, An Int. J., Volume 18, Number 4, 2015, pp. 93-110
COMMUNICATIONS
IN
DEPENDABILITY AND
QUALITY
MANAGEMENT
An International Journal
Modeling Critical Success Factors for Adoption of Big Data Analytics Project:
An ISM -MICMAC Based Analysis
Nitin Sachdeva1, Ompal Singh1 and P. K. Kapur2
1Department of Operational Research, University of Delhi, Delhi, India E-mail: [email protected] 1Department of Operational Research, University of Delhi, Delhi, India E-mail: [email protected] 2 Centre for Interdisciplinary Research, Amity University, Noida, UP, India E-mail: [email protected]
accepted November 19, 2015
Summary Global buzzword “Big Data Analytics” has observed overwhelming response in the last five years. It is still an emerging area in the field of analytics as advocated through our research. The presence of several analytics tools in the market, selecting and implementing an appropriate big data system is a multifaceted undertaking requiring substantial resources. Researchers & practitioners have investigated some key factors affecting the adoption of big data analytics projects in the past however there is a limited authoritative set of factors whose interaction has been identified. In this paper, we advance the state-of-the-art of the research in this area by a two stage qualitative approach. Firstly, Critical Success Factors (CSFs) are identified through a survey of literature and ranked using a Likert Scale by respondents who practice big data analytics. The respondents were carefully selected based on their experience in practicing plan-driven big data analytics projects in the past. Secondly, an interpretive structural model (ISM) is proposed and the identified factors are classified using matrice d’impacts croises-multiplication appliequé à un classement (MICMAC). The research findings can significantly impact how big data analytics practices can be successfully implemented by understanding the interactions between various critical success factors in its adoption.
Key words: Big Data Analytics (BDA), Interpretive Structural Modeling (ISM), Critical Success Factors (CSFs).
Acronym: BDA - Big Data Analytics, ISM – Interpretive Structural Modeling, CSF - Critical Success Factors,
UDC 004.62 COBISS.SR-ID 220846092

94
1. INTRODUCTION Big Data is "the buzz word" that captures the interest of many executives. But what can be done with Big Data? How can advantage be gained from this new trend in IT? This research encompasses the questions and answers on how the critical success factors of Big Data analytics project are related to each other and how can they be classified based on Interpretive Structural Modeling and MICMAC Analysis? In order to identify relationship between existing CSFs so as to create business value from large amounts of internal and external data, tools are needed to collect, clean, enrich and aggregate this data and transport this data to a data warehouse. Analysis of this data can generate business value if information, and thus understanding of business and the market where the organization operates, is derived from this data. Knowledge can be gained from this information. This information and knowledge can eventually be used in order to support decision making. This includes decisions regarding process optimization, reduction of operational risk, marketing and communication with customers etc. The CSFs identified through literature included 17 major CSF regarding BDA projects. These CSFs are divided between personal factors, process factors and technological factors in relation to Big Data Analytics projects. Finally these CSFs are categorized by means of ISM.
The research focuses on the critical factors for business success regarding the projects that aims to derive business value from multiple data sources and databases, including structured as well as unstructured data. Due to the general increase in volume, velocity and variety of electronic data, traditional SQL-based analysis tools used on traditional database management systems (DBMS) do not always provide sufficient possibilities for analyzing big amounts of data. This phenomenon can be seen as the Big Data problem that some businesses and organizations are facing today. The challenge is to develop or implement smarter and more insightful data analysis tools and techniques. This trend is defined as Big Data and resulted in a rapid increase of academic publications about Big Data since 2010. If you read these articles, "there's a good chance the 3 Vs -- volume, variety, and velocity will be cited in at least half of them", Swoyer, 2012. But is there not a more important "V"?
The "V" of "Value" that can be derived from the use of Big Data analytics to justify the use of Big Data solutions such as BI and analysis applications within organizations. What are the critical factors that will result in value from analysis of multidimensional data? While keeping this in mind the following research question was defined: "What are the critical success factors of Business Intelligence and Big Data analytical systems that lead to the creation of business value, when focusing on the implementation and utilization of these systems?" In order to answer this question the theoretical framework of this paper includes the ontological and epistemological aspects of Business Intelligence and Big Data. Furthermore, the technological and organizational aspects of Business Intelligence and Big Data Analysis (BI&BDA) are presented while focusing on the critical success factors (CSF) of BI&BDA projects that were cited within the literature. This includes CSF, that are found in the existing literature, regarding business intelligence, Big Data, data warehousing, decision support systems and data mining. Furthermore, a theoretical model is included that represents the relationship between the organizational and technological factors of BI&BDA projects. The model also encompasses the performance indicators that can indicate the potential success of these projects. Thereafter the methodology for an interpretive research perspective is given, because the scope of this research is to produce "an understanding of the context of the information system, and the process whereby the information system influences and is influence by the context" [31]. Since this research is conducted in the field of information technology and concerning the organizational issues in relation to the ongoing technological developments, the choice is made to conduct a prospective analysis of multiple big data project cases. This analysis is

95
done by means of a qualitative research method. This included multiple cases that were obtained by mains of structured interviews with experts in the field of business intelligence and big data analysis. Eventually, these cases were extensively analyzed, with the aim to investigate the gaps between the CSF that are found in the literature and the CSF perceived by the experts in the field. This is in order to link the theory with the practice of business intelligence and big data analysis. Finally, conclusions are drawn from this research. This includes the findings that; the volume and variety cannot be seen as critical element for the success of BI&BDA projects.
Rest of the paper is organized in a way that firstly an overview of Big Data related issues are highlighted following by Section 2 presenting the identification of critical success factors obtained from experts interviews and literature review. Section 3 highlights the research methodology adopted to conduct this research followed by Section 4 describing the Interpretive Structural Modeling (ISM) application in the present context. In Section 5 we present the MICMAC analysis to segregate identified factors into 4 different characteristics based on their driving and dependence power as suggested by ISM techniques. Furthermore, in Section 6 conclusions and future research scope are suggested which includes the limitation of limited number of case study available due to time constrains and limitations that are derived from the chosen research methodology. Moreover, suggestions are made for further research, in the form of qualitative and quantitative research.
1.1 Overview of big data related issues
The topic of Big Data emerged during the last years due to changes in using and processing information. Data warehouses have been the base for most of the data analysis tasks during the past decades and they are still playing a major role in this area. The possibilities of these systems however are limited. Information nowadays is captured in many different formats and stored in a big variety of sources. The first paper discussing this change and the new challenges faced in data management by using typical Big Data characteristics volume, variety and velocity was published by [16]. This problem description has been used, modified and refined by different authors since, [10] for instance is using [16] characteristics for their own official definition: "Big data is high-volume, high-velocity and high-variety information assets that demand cost-effective, innovative forms of information processing for enhanced insight and decision making". However, Big Data problems are complex and can therefore be seen and defined from different perspectives. "Big data is the term increasingly used to describe the process of applying serious computing power – the latest in machine learning and artificial intelligence – to seriously massive and often highly complex sets of information" [14]. Whereas Big Data from a technical perspective is defined as "the frontier of a firm’s ability to store, process, and access all the data it needs to operate effectively, make decisions, reduce risks, and serve customers" [15]. This research is following the Laney and Gartner definition of Big Data being characterized by the three dimensions volume, variety and velocity.
Due to the immaturity of the available Big Data solutions it is important to focus in projects not only on technologies, but to be aware of all challenges the project has to face. Three major areas have to be taken into consideration in IT projects: "Three equally important and interdependent components cause success or failure of an undertaking: people, process and technology" as described in Figure 1, claims [26].
Applying this categorization, Big Data projects have to face the following challenges.
• People: Big Data experts are very difficult to find and expensive to hire due to the novelty of this area. There are simply not a lot of people with the needed computational background and analytical skills. These experts are often referred to as data scientists [9].

96
Data scientists gain domain expertise or industry knowledge, which is used later on in the Big Data analysis to gain the best results. They also develop a detailed understanding of specific business practices within the organization they are working for [12]. Furthermore, it is vital in Big Data projects to involve experts from the business right from the beginning of the project to ensure maximal success by focusing on business values [26]. Data scientists usually have a background in software development and computer science, but they also do have basic analytical skills such as statistics [12]. The term scientist comes from the way these experts are looking for answers within data sets. They ask questions and set up experiments in research fashion [12].
In most of the Big Data projects it will be beneficial not only to relay on the skills of one single data scientist. Big Data projects require a various set of different skills best covered by a team of experts from different areas. The bests result can be expected by creating a multidisciplinary analysis team, with the required skills needed for the respective project [26]. Another challenge arises from the huge security and ethical issues, which come along with Big Data projects. Therefore, risk management and legal experts should be involved in very early project stages, as well as compliance representatives [26].
• Process: Big Data projects are innovation projects and require therefore a special treatment. The analysis team has to be able to react on changes during the analysis process. The team has to be organized in a way that allows all members to react flexible on these changes. Often changes are necessary due to revealed data management problems detected throughout the Big Data analysis. These problems require an immediate action and cannot be ignored [26].
Many organizations are challenged handling the ever growing large amounts of data. In order to ease this problem, organizations are likely to get into the situation to decide whether to keep all the emerging data or store only these parts that really benefit the business. If the decision is made in favor of determining upfront which data is relevant, it is important for organizations to establish processes to identify those documents that contain the information with the highest potential business value [24].
Figure 1. Big data related issues
It is important that the results are based on high data quality, as the actions resulting out of Big Data projects can have severe consequences for an organization. As the data usually comes from a number of different sources from inside and outside of the organization, it is very challenging for the analysis team to ensure a high quality of the data provided from these sources [23]. Due to the innovative character of Big Data projects, members of the analysis team need to be engaged to think

97
in innovative ways and come up with creative ideas. Nevertheless, it is necessary to set some boundaries for the analysis team to ensure the project does not lose its focus. Within these boundaries, however, team members should be granted total freedom [26].
Supporting a well-defined business goal is vital for Big Data projects in order to deliver a value for the organization. Measurements have to be implemented to determine to what degree the business goals were supported by the project [26]. Furthermore, the analysis has to follow the fundamentals of cost/benefit analysis, as well as core statistical science to succeed [13].
Another challenge arising from the novelty of Big Data is dealing with the expectations from the business towards it. The project team has to make sure to set boundaries for expectations coming from the business. These boundaries, however, have to be set in a way to keep the business still interested in the projects [26].
• Technology: The major technical issues are the abstinence of end-to-end solutions, design patterns or universal architecture recommendations for Big Data problems due to the technical immaturity. That means that the used technology has to be individually assembled and customized to the purpose of the analysis project [26]. Due to the massive volume of data used in the projects, storage is going to be an issue sooner or later. This problem needs to be addressed in early planning stages of the project [26]. Moreover, traditional database systems won’t be able in some organizations to deal any longer with the ever growing amount of data. Bhashyam stated already in the year 2011 that Big Data is already 10 – 100 times as voluminous as typical data warehouses at this time. There is a need for new technology to address this situation [6].
One of the aspects of Big Data is the transformation from large-scale, enormous-size, heterogeneous data repositories into well-structured data, which can be easily analyzed and interpreted. For some use cases the so transformed data has to be transformed even further to fit the requirements of typical business intelligence components such as diagrams, plots or dashboards. It is technically challenging to bring systems together that are so different in their nature and purpose of use. Big Data, however, is more than just data transformation into a structured form. Traditional database systems are built on data organized in a highly structured form in tables. Due to the various numbers of sources in Big Data projects, it is very challenging to extract the information in such a highly structured way. It is likely that information gets lost during the transformation process of this highly unstructured raw data to the structured form required by data base systems [8, 13].
Merging the data from different systems with different security levels, intellectual property and privacy settings into one system is causing big security issues that Big Data projects are facing. The Big Data project teams need to find solutions to make sure sensitive data is only displayed to people who are supposed to have access to it [28]. As discussed above, there are a number of different challenges to overcome in Big Data projects. People, process and technology perspectives have to be included in information management strategies. To focus on more than just technology is especially important in Big Data projects as the technology is still immature and new to many organizations. This circumstance has to be compensated by paying special attention to processes and people involved in Big Data projects [26]. The process of answering questions through Big Data analysis requires a certain set of skills that are preferably provided from a multidisciplinary project team. There are existing process models for business analysis from the age before Big Data, which have been proven to be efficient. Although these process models have proven to cover all the relevant facts of business analysis, there are certain issues to be taken into consideration if these models are applied on Big Data projects. Therefore, adaptations of these models are necessary to

98
meet the Big Data characteristics volume, variety and velocity. Also, learning is an important factor in the planning process to have a foundation for future Big Data projects [26]. 2. IDENTIFICATION OF CRITICAL SUCCESS FACTORS FOR A DOPTION OF BIG DATA ANALYTICS PRACTICES The CSFs have been deduced from the researcher from the general CSFs in general projects, IT-projects and data management studies. These CSFs have been adjusted according to the requirements arising from the Big Data challenges mentioned previously. Table 1 shows the summarized CSFs for Big Data projects taken from [26].
Table 1. Success factors for adoption of big data analytics practices
Dimension Success Factors Keywords Factor Educated analysts in text analysis methodologies are needed. Analytical, Statistical
Skills F1
Big Data technology skills within own staff or hired externally are needed.
Technological Skills F2
The analysis team should consist of members from different business departments that are involved in the project, as well as members from the IT department.
Multidisciplinary team F3 People
IT staff needs to be aware that creating and maintaining the documentation of the new implemented systems is vital. Especially because these are innovative systems.
Documentation F4
Identifiable value for the business is delivered from the project. The project must support the business needs.
Identifiable Business Value, ROI,TCO
F5
Creation of a clear vision and implementation strategy for the software and hardware components of the new analysis platform.
Big Data Strategy F6
Creation and disseminating of documentation needs to be a fixed part of the project.
Documentation F4
The growth of analysis data has to be forecasted to be able to react early when used systems need to be expanded.
Forecast Data Growth F7
Processes need to be established in order to ensure high data quality of the documents used for the analysis.
High Data Quality F8
A measureable project outcome has to be defined and in fact measured to evaluate the success of the project.
Measurement, Defined Outcome
F9
Strong leadership has to be provided throughout the project. The top management level of the organization needs to get involved.
Top Management Support, Executive Level Support, Leadership
F10
A clear goal of the project has to be defined, and measurements have to be established. The project needs to have a clear start and end.
Project Goal, Milestones, Deadlines
F11
Process
The size of the project has to be determined carefully. Clear, Manageable Project Scope, Adequate Size
F12
Awareness of recent developments in the Big Data analysis area, including evaluation, selection and implementation of new software methodologies.
Investment in new Technologies, Analytical Tools
F13
Document collection is a significant problem, only with the right documents provided the needed answers can be found within the data.
Document collection, Access to Sources
F14
Evaluation of the used hardware to make sure it meets the requirement of the growing data amount also in future.
Adequate Hardware, Storage, Real Time
F15
Developing, integration and application of logical data models for the new analysis platform.
Integration of New Solution, Coexistence
F16
Technology
Performance has to be monitored continuously and the system needs to be tuned on a regular basis to meet operational goals.
Fast Performance, Fast Delivering of Results
F17

99
3. RESEARCH METHODOLOGY This study employed the web survey method to gather data. The target population was members of the Big Data Analytics group. A web survey with Likert scale questionnaires and demographic information collection was distributed to the target population (Annexure A and B). There were three sections in the survey. The first section was on success factors. To measure the importance of success factors, a 5-point Likert scale was used to reflect the level of perception of the question by the respondent. The third section was on perception of success, and again, to measure perception of success of agile projects, a 7-point Likert scale was used to reflect the level of perception of the question by the respondent. The third section was on demographic data, which included both the respondent’s demographic information as well as the big data analytics project related information. In order to avoid ambiguity in terms of perception of success on the part of the respondent, the questions focused on one particular project of the respondent's choice in case he/she had been involved in multiple BDA projects. The last section was for additional comments, where respondents were invited to enter any feedback or thoughts on a free-form text area, which might be used for follow-up for clarification if necessary. As part of the pilot process, to test content validity and readability, three members of the Big Data Analytics group supplied feedback on improving the survey. The feedback was incorporated into the survey before the survey invitation was emailed to the group coordinators of all 20 user groups. In all, a total of 40 people responded by accessing the online survey and 29 projects were submitted with complete data.
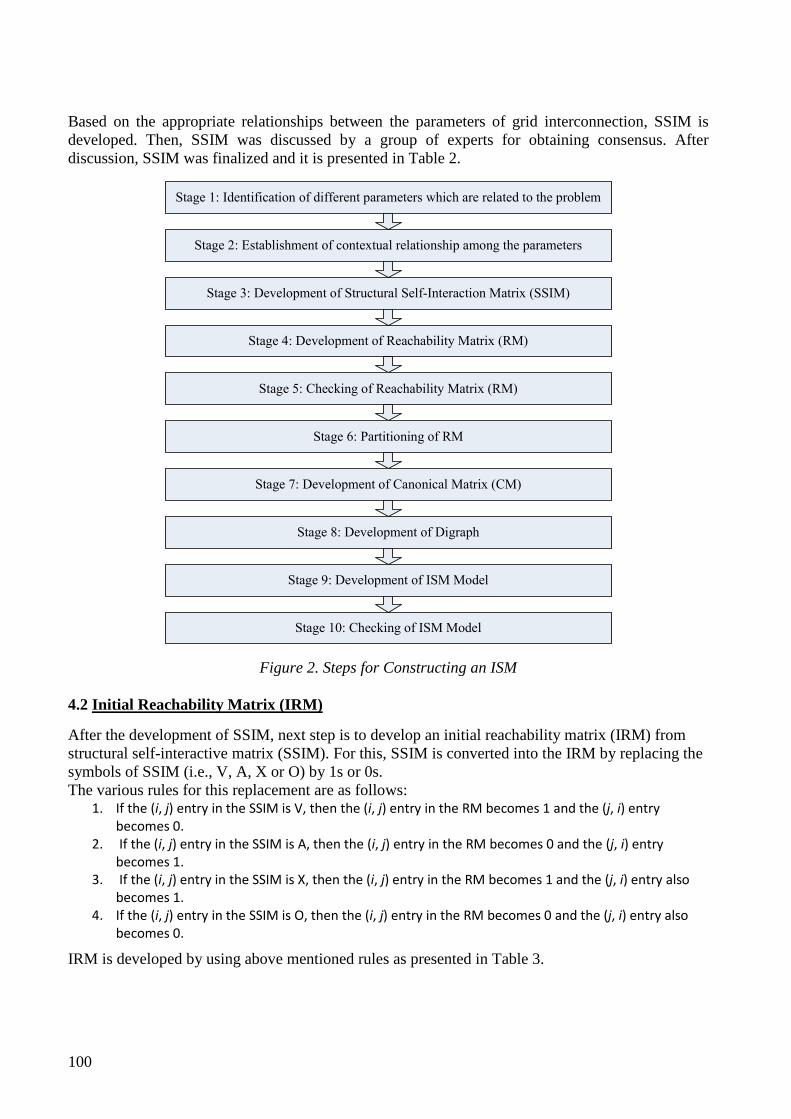
4. ANALYSIS USING INTERPRETIVE STRUCTURAL MODELLING (ISM) Interpretive structural modelling (ISM) is an interactive learning method, in which different and directly related elements are arranged into an organized system [32,22]. ISM approach transforms vague, ill-defined models of systems into visible and well defined models [1,2]. This process is interpretive as judgment of the group decides how the parameters are related to each other [3,19]. Moreover, it is also structural as a complete structure is developed from the set of parameters [20]. It is considered as a group learning process, but it can be utilized by the individuals also. ISM approach has been used by a number of authors to solve different problems of different areas. Recent application of ISM methodology has been made in the areas of Scheduling system stage of production system life cycle [4], Inventory control system stage of production system life cycle [5], E-procurement, [29], Quality of management education, [17], Supplier development, [21], R&D performance, [30], Information security management, [7]. Figure 2 provides the various steps involved in applying ISM in different areas of science and management.
4.1 Structural Self-Interaction Matrix (SSIM)
In ISM approach, expert opinions obtained from techniques such as brain storming, nominal group technique, are used for the development of contextual relationship among the identified parameters. In the current paper, five experts (three from organization and two from academia) were consulted in recognizing the contextual relationship among the parameters of grid interconnection. A contextual relationship of ‘leads to’ or ‘influences’ type is selected for the evaluation of parameters of BDA projects. This means that one parameter influences the other parameter.
Following four symbols have been used to signify the relationship between two parameters (i and j): V : Parameter i influences parameter j; A : Parameter j influences parameter i; X : Parameters i and j influences each other; and O: Parameters i and j are unrelated.
100
Based on the appropriate relationships between the parameters of grid interconnection, SSIM is developed. Then, SSIM was discussed by a group of experts for obtaining consensus. After discussion, SSIM was finalized and it is presented in Table 2.
Stage 1: Identification of different parameters which are related to the problem
Stage 2: Establishment of contextual relationship among the parameters
Stage 3: Development of Structural Self-Interaction Matrix (SSIM)
Stage 4: Development of Reachability Matrix (RM)
Stage 5: Checking of Reachability Matrix (RM)
Stage 6: Partitioning of RM
Stage 7: Development of Canonical Matrix (CM)
Stage 8: Development of Digraph
Stage 9: Development of ISM Model
Stage 10: Checking of ISM Model
Figure 2. Steps for Constructing an ISM 4.2 Initial Reachability Matrix (IRM)
After the development of SSIM, next step is to develop an initial reachability matrix (IRM) from structural self-interactive matrix (SSIM). For this, SSIM is converted into the IRM by replacing the symbols of SSIM (i.e., V, A, X or O) by 1s or 0s. The various rules for this replacement are as follows:
1. If the (i, j) entry in the SSIM is V, then the (i, j) entry in the RM becomes 1 and the (j, i) entry
becomes 0.
2. If the (i, j) entry in the SSIM is A, then the (i, j) entry in the RM becomes 0 and the (j, i) entry
becomes 1.
3. If the (i, j) entry in the SSIM is X, then the (i, j) entry in the RM becomes 1 and the (j, i) entry also
becomes 1.
4. If the (i, j) entry in the SSIM is O, then the (i, j) entry in the RM becomes 0 and the (j, i) entry also
becomes 0.
IRM is developed by using above mentioned rules as presented in Table 3.

101
Table 2. Structural Self-Interactive Matrix
Factors F17 F16 F15 F14 F13 F12 F11 F10 F9 F8 F7 F6 F5 F4 F3 F2
F1 V O O O V V V O V O V V O V O O
F2 X V V X X O O O V V V O O V O
F3 V V O V V X X X V O V V V V
F4 V O O X V V V A A O O O O
F5 V O O V V V V V X O O X
F6 X X X X X V X X X A V
F7 O A O A A V V A O A
F8 V V O O O V V A V
F9 V V V V V V V A
F10 V V V V V X X
F11 V V A V V X
F12 V V A A V
F13 V V X X
F14 V X X
F15 V V
F16 V 4.3 Final Reachability Matrix (FRM)
The final reachability matrix (FRM) for the parameters of BDA projects is achieved by including the transitivity concept. It is a basic assumption made in ISM. Transitivity states that if an element A is related to B and B is related to C, then A is certainly related to C.
1* entries are involved to include transitivity in IRM. After including the transitivity concept as defined earlier, the FRM is developed as presented in Table 4.
Table 3. Initial Reachability Matrix
F1 F2 F3 F4 F5 F6 F7 F8 F9 F10 F11 F12 F13 F14 F15 F16 F17
F1 1 0 0 1 0 1 1 0 1 0 1 1 1 0 0 0 1
F2 0 1 0 1 0 0 1 1 1 0 0 0 1 1 1 1 1
F3 0 0 1 1 1 1 1 0 1 1 1 1 1 1 0 1 1
F4 0 0 0 1 0 0 0 0 0 0 1 1 1 1 0 0 1
F5 0 0 0 0 1 1 0 0 1 1 1 1 1 1 0 0 1
F6 0 0 0 0 1 1 1 0 1 1 1 1 1 1 1 1 1
F7 0 0 0 0 0 0 1 0 0 0 1 1 0 0 0 0 0
F8 0 0 0 0 0 1 0 1 1 0 1 1 0 0 0 1 1
F9 0 0 0 1 1 1 1 0 1 0 1 1 1 1 1 1 1
F10 0 0 1 1 0 1 0 1 1 1 1 1 1 1 1 1 1
F11 0 0 1 0 0 1 0 0 0 1 1 1 1 1 0 1 1
F12 0 0 1 0 0 0 0 0 0 1 1 1 1 0 0 1 1
F13 0 1 0 0 0 1 1 0 0 0 0 0 1 1 1 1 1
F14 0 1 0 1 0 1 1 0 0 0 0 1 1 1 1 1 1
F15 0 0 0 0 0 1 0 0 0 0 1 1 1 1 1 1 1
F16 0 0 0 0 0 1 1 0 0 0 0 0 0 1 0 1 1
F17 0 1 0 0 0 1 0 0 0 0 0 0 0 0 0 0 1

102
Table 4. Final Reachability Matrix
F1 F2 F3 F4 F5 F6 F7 F8 F9 F10 F11 F12 F13 F14 F15 F16 F17
F1 1 1* 1* 1 1* 1 1 0 1 1* 1 1 1 1* 1* 1* 1
F2 0 1 0 1 1* 1* 1 1 1 0 1* 1* 1 1 1 1 1
F3 0 1* 1 1 1 1 1 1* 1 1 1 1 1 1 1* 1 1
F4 0 1* 1* 1 0 1* 1* 0 0 1* 1 1 1 1 1* 1* 1
F5 0 1* 1* 1* 1 1 1* 1* 1 1 1 1 1 1 1* 1* 1
F6 0 1* 1* 1* 1 1 1 1* 1 1 1 1 1 1 1 1 1
F7 0 0 1* 0 0 1* 1 0 0 1* 1 1 1* 1* 0 1* 1*
F8 0 1* 1* 1* 1* 1 1* 1 1 1* 1 1 1* 1* 1* 1 1
F9 0 1* 1* 1 1 1 1 0 1 1* 1 1 1 1 1 1 1
F10 0 1* 1* 1 1* 1 1* 1 1 1 1 1 1 1 1 1 1
F11 0 1* 1 1* 1* 1 1* 1* 1* 1 1 1 1 1 1* 1 1
F12 0 1* 1 1* 1* 1* 1* 1* 1* 1 1 1 1 1* 1* 1 1
F13 0 1 0 1* 1* 1 1 1* 1* 1* 1* 1* 1 1 1 1 1
F14 0 1 1* 1 1* 1 1 1* 1* 1* 1* 1 1 1 1 1 1
F15 0 1* 1* 1* 1* 1 1* 0 1* 1* 1 1 1 1 1 1 1
F16 0 1* 0 1* 1* 1 1 0 1* 1* 1* 1* 1* 1 1* 1 1
F17 0 1 0 1* 1* 1 1* 1* 1* 1* 1* 1* 1* 1* 1* 1* 1
4.4 Conical Matrix (CM)
It is established by grouping parameters in the same level across the rows and columns of the final reachability matrix, as shown in Table 5. Drive power of a parameter is obtained by totaling the number of ones in the rows while dependence power is obtained by totaling the number of ones in the columns.
Table 5. Conical Matrix
F1 F2 F3 F4 F5 F6 F7 F8 F9 F10 F11 F12 F13 F14 F15 F16 F17 Driver Power Driver Rank
F1 1 1* 1* 1 1* 1 1 0 1 1* 1 1 1 1* 1* 1* 1 16 I
F2 0 1 0 1 1* 1* 1 1 1 0 1* 1* 1 1 1 1 1 14 III
F3 0 1* 1 1 1 1 1 1* 1 1 1 1 1 1 1* 1 1 16 I
F4 0 1* 1* 1 0 1* 1* 0 0 1* 1 1 1 1 1* 1* 1 13 IV
F5 0 1* 1* 1* 1 1 1* 1* 1 1 1 1 1 1 1* 1* 1 16 I
F6 0 1* 1* 1* 1 1 1 1* 1 1 1 1 1 1 1 1 1 16 I
F7 0 0 1* 0 0 1* 1 0 0 1* 1 1 1* 1* 0 1* 1* 10 V
F8 0 1* 1* 1* 1* 1 1* 1 1 1* 1 1 1* 1* 1* 1 1 16 I
F9 0 1* 1* 1 1 1 1 0 1 1* 1 1 1 1 1 1 1 15 II
F10 0 1* 1* 1 1* 1 1* 1 1 1 1 1 1 1 1 1 1 16 I
F11 0 1* 1 1* 1* 1 1* 1* 1* 1 1 1 1 1 1* 1 1 16 I
F12 0 1* 1 1* 1* 1* 1* 1* 1* 1 1 1 1 1* 1* 1 1 16 I
F13 0 1 0 1* 1* 1 1 1* 1* 1* 1* 1* 1 1 1 1 1 15 II
F14 0 1 1* 1 1* 1 1 1* 1* 1* 1* 1 1 1 1 1 1 16 I
F15 0 1* 1* 1* 1* 1 1* 0 1* 1* 1 1 1 1 1 1 1 15 II
F16 0 1* 0 1* 1* 1 1 0 1* 1* 1* 1* 1* 1 1* 1 1 14 III
F17 0 1 0 1* 1* 1 1* 1* 1* 1* 1* 1* 1* 1* 1* 1* 1 15 II
Dependence 1 16 13 16 15 17 17 11 15 16 17 17 17 17 16 17 17
Dependence Rank V II IV II III I I V III II I I I I II I I
4.4.1 Partitioning factors
Reachability set and antecedent sets for each parameter of BDA projects are derived from FRM. Reachability set consists of the parameter itself and other parameters, which it may help to attain,

103
but antecedent set consists of the parameter itself and other parameters, which may help attaining it. After, finding out the reachability and antecedent set, intersection sets is derived for all the parameters. If the reachability set and the intersection set are the same, then that parameter is considered to be in first level and it is positioned on the top level of the ISM hierarchy. The parameters placed on the top-level of ISM model would not help in alleviating any other parameter above its own level. After, the top-level parameter has been identified then it is detached from the other parameters. This process is repeated to find out the parameter in the next level. This procedure is continued till the level of each parameter is obtained. These obtained levels aid in development of diagraph and ISM model. For the present case of BDA projects, different parameters along with their reachability set, antecedent set, intersection set and levels, are shown in Tables 6-10.
From the final reachability matrix and after obtaining the conical matrix, the reachability and antecedent set [32] for each factor are obtained to identify intersection of the sets. The factor for which the reachability and the intersection sets are the same become the top-level factor in the ISM hierarchy. It is clear from Table 6 that “Big data strategy (F6)”, “Forecast data growth (F7)”, “Project Goal, Milestones, Deadlines (F11)”, “Clear & Manageable Project Scope, Adequate Size (F12)”, “Investment in new technologies, analytical tools (F13)”, “Document collection, access to sources (F14)”, “Integration of new solution, coexistence (F16)” and “Fast Performance, fast delivering of results (F17)” are at level 1.
Tables 7 depicts level II factor as “Documentation (F4)”, & “Adequate Hardware, Storage, Real Time (F15)” while table 8 displays level III factors as “Identifiable Business Value, ROI,TCO (F5” & “Measurement, Defined Outcome (F9)”. We obtain factors like “Analytical, Statistical Skills (F1)” and “High Data Quality (F8) at level IV. Following on the similar lines, we obtain level IV, V & VI factors which are shown in tables 9 & 10. Table 6. Iteration 1 Variables Reachability Set Antecedent Set Intersection Set Level
F1 1,2,3,4,5,6,7,9,10,11,12,13,14,15,16,17 1 1
F2 2,4,5,6,7,8,9,11,12,13,14,15,16,17 1,2,3,4,5,6,8,9,10,11,12,13,14,15,16,17 2,4,5,6,8,9,11,12,13,14,15,16,17
F3 2,3,4,5,6,7,8,9,10,11,12,13,14,15,16,17 1,3,4,5,6,7,8,9,10,11,12,14,15 3,4,5,6,7,8,9,10,11,12,14,15
F4 2,3,4,6,7,10,11,12,13,14,15,16,17 1,2,3,4,5,6,8,9,10,11,12,13,14,15,16,17 2,3,4,6,10,11,12,13,14,15,16,17
F5 2,3,4,5,6,7,8,9,10,11,12,13,14,15,16,17 1,2,3,5,6,8,9,10,11,12,13,14,16,17 2,3,5,6,8,9,10,11,12,13,14,15,16,17
F6 2,3,4,5,6,7,8,9,10,11,12,13,14,15,16,17 1,2,3,4,5,6,7,8,9,10,11,12,13,14,15,16,17 2,3,4,5,6,7,8,9,10,11,12,13,14,15,16,17 I
F7 3,6,7,10,11,12,13,14,16,17 1,2,3,4,5,6,7,8,9,10,11,12,13,14,15,16,17 3,6,7,10,11,12,13,14,16,17 I
F8 2,3,4,5,6,7,8,9,10,11,12,13,14,15,16,17 2,3,5,6,8,10,11,12,13,14,17 2,3,5,6,8,10,11,12,13,14,17
F9 2,3,4,5,6,7,9,10,11,12,13,14,15,16,17 1,2,3,5,6,8,9,10,11,12,13,14,15,16,17 2,3,5,6,9,10,11,12,13,14,15,16,17
F10 2,3,4,5,6,7,8,9,10,11,12,13,14,15,16,17 1,3,4,5,6,7,8,9,10,11,12,13,14,15,16,17 3,4,5,6,7,8,9,10,11,12,13,14,15,16,17
F11 2,3,4,5,6,7,8,9,10,11,12,13,14,15,16,17 1,2,3,4,5,6,7,8,9,10,11,12,13,14,15,16,17 2,3,4,5,6,7,8,9,10,11,12,13,14,15,16,17 I
F12 2,3,4,5,6,7,8,9,10,11,12,13,14,15,16,17 1,2,3,4,5,6,7,8,9,10,11,12,13,14,15,16,17 2,3,4,5,6,7,8,9,10,11,12,13,14,15,16,17 I
F13 2,4,5,6,7,8,9,10,11,12,13,14,15,16,17 1,2,3,4,5,6,7,8,9,10,11,12,13,14,15,16,17 2,4,5,6,7,8,9,10,11,12,13,14,15,16,17 I
F14 2,3,4,5,6,7,8,9,10,11,12,13,14,15,16,17 1,2,3,4,5,6,7,8,9,10,11,12,13,14,15,16,17 2,3,4,5,6,7,8,9,10,11,12,13,14,15,16,17 I
F15 2,3,4,5,6,7,9,10,11,12,13,14,15,16,17 1,2,3,4,5,6,8,9,10,11,12,13,14,15,16,17 2,3,4,5,6,9,10,11,12,13,14,15,16,17
F16 2,4,5,6,7,9,10,11,12,13,14,15,16,17 1,2,3,4,5,6,7,8,9,10,11,12,13,14,15,16,17 2,4,5,6,7,9,10,11,12,13,14,15,16,17 I
F17 2,4,6,7,8,9,13,14,15,17 1,2,3,4,5,6,7,8,9,10,11,12,13,14,15,16,17 2,4,6,7,8,9,13,14,15,17 I 4.5 Digraph development
Initial digraph with transitive links is obtained from the CM. It is produced by nodes and lines of edges. After eliminating the subsidiary links the final digraph is established (Figure 3). In the digraph, the top-level parameter is located at the top of the digraph and second level parameter is positioned at second location and so on, till the lowest level is retained at the lowest place in the digraph.

104
Table 7. Iteration 2
Variables Reachability Set Antecedent Set Intersection Set Level
F1 1,4,5,9,15 1 1
F2 2,4,5,8,9,15 2 2
F3 3,4,5,8,9,10,15 3,5,10
F4 4 1,2,3,4,5,8,9,10 4 II
F5 3,4,5,8,9,10,15 1,2,3,5,8,9,10 3,5,8,9,10
F8 4,5,8,9,15 2,3,5,8,10 5,8
F9 4,5,9,10,15 1,2,3,5,8,9,10 5,9,10
F10 3,4,5,8,9,10,15 3,5,9,10 3,5,9,10
F15 15 1,2,3,5,8,9,10,15 15 II Table 8. Iteration 3
Variables Reachability Set Antecedent Set Intersection Set Level
F1 1,5,9 1 1
F2 2,5,8,9 2 2
F3 3,5,8,9,10 3,5,10 3,5,10
F5 3,5,8,9,10 1,2,3,5,8,9,10 3,5,8,9,10 III
F8 5,8,9 2,3,5,8,10 5,8
F9 9,10 1,2,3,5,8,9,10 9,10 III
F10 3,5,8,9,10 3,5,9,10 3,5,9,10 Table 9. Iteration 4
Variables Reachability Set Antecedent Set Intersection Set Level
F1 1 1 1 IV
F2 2,8 2 2
F3 3,8,10 3,10 3,10
F8 8 2,3,8,10 8 IV
F10 3,8,10 3,10 3,10 Table 10. Iteration 5
Variables Reachability Set Antecedent Set Intersection Set Level
F2 1 1 1 V
F3 3,10 3,10 3,10 V
F10 3,10 3,10 3,10 V 5. MICMAC ANALYSIS Matrice d'Impacts croises-multiplication appliqúe an classment (cross-impact matrix multiplication applied to classification) is truncated as MICMAC. MICMAC analysis is mainly used to analyze the drive power and dependence power of identified parameters. It is based on multiplication properties of matrices [25]. It is carried out for the identification of key parameters that drive the system in various groups. On the basis of the drive power and dependence power (shown in CM), the parameters have been categorized into four groups as explained below:

105
Figure 3. Digraph of CSFs for big data analytics projects 1. Autonomous parameters: In this, parameters have weak drive power and weak dependence power in this group. 2. Linkage parameters: In this, parameters have strong drive power as well as strong dependence power in this group. 3. Dependent parameters: In this, parameters have weak drive power but strong dependence power in this group. 4. Independent parameters: In this, parameters have strong drive power but weak dependence power in this group.
The above grouping is analogous to that done by [18]. Similar to table 5 which shows the driving power and dependence power of each parameter, we obtained these powers for each of the factors. By using drive power-dependence power values, a diagram is prepared as shown in Figure 4. This diagram has been divided into four clusters namely "autonomous parameters", "dependent parameters", "linkage parameters" and "independent parameters". For the further illustration of this drive power-dependence power diagram, it is observed from table 5 that factor 6 has driving power of 16 and dependence power of 17; henceforth in Figure 5, it is placed in the third cluster at a place which resembles to drive power of 16 and dependence power of 17. Now, its position in the third cluster illustrates that it is a linkage parameter. In the same way, all the parameters are placed at places conforming to their driving and dependence power.

106
Figure 4. MICMAC analysis
6. CONCLUSIONS AND FUTURE RESEARCH SCOPE This research tries to provide an answer on the research question "How are the critical success factors of Big Data analytics practice interrelated to each other & how they are classified based on ISM & MICMAC Analysis?" In order to identify relationship between existing CSFs so as to create business value from large amounts of internal and external data, tools are needed to collect, clean, enrich and aggregate this data and transport this data to a data warehouse. Analysis of this data can generate business value if information, and thus understanding of business and the market where the organization operates, is derived from this data. Knowledge can be gained from this information. This information and knowledge can eventually be used in order to support decision making. This includes decisions regarding process optimization, reduction of operational risk, marketing and communication with customers etc. The CSFs identified through literature included 17 major CSF regarding Big Data Analytics practices. These CSF were divided between personal factors, process factors and technological factors in relation to Big Data Analytics projects. Eventually these CSF were categorized by means of ISM.
Analysis of the research undertaken showed that, people related skills like "Technological, Analytical skills", "Multidisciplinary team" and process related skill, "Top Management Support, Executive Level Support, Leadership", are key elements that influence the success of BDA projects based on their high level of independence shown in ISM framework. Moreover, factors such as "Analytical, Statistical Skills" and "High Data Quality" shows second level importance in defining success of BDA projects. Furthermore, process related factors like "Identifiable Business Value, ROI, TCO", and "Measurement, Defined Outcome" seems quite strong driving and dependent factors; as in the practice as well a significant number of BDA projects faces changes in planning and project scoop in the due course of a project, so it quite resembles the expected outcome. "Adequate Hardware Storage, Real Time", and "Documentation", are quite the dependent as well as

107
the driving factors determining the success of the project from outcome perspective. More important however, factors like "Big Data Strategy" and "Fast performance, fast delivering of results", "Project Goal, Milestones, Deadlines", and "Clear and Manageable Project Scope, Adequate Size", "Forecast Data Growth", "Investment in new technologies, analytical tools", "Document collection, and access to sources" and "Integration of new solution, coexistence" proved to be the key dependent factors depicting the dependency of these factors on all other CSFs.
Using the MICMAC analysis, apart from the factor “Analytical, Statistical Skills”, all the other CSFs are clustered under the head Linkage Parameters indicating high driving and dependence power in determining the success of big data analytics projects. It clearly conveys that the factors considered in the study are detrimental to the success of big data analytics projects and must be significantly taken care of to ensure smooth implementation of such large projects.
The research work undertaken brings some key insights into the CSFs enabling success of BDA projects by creating a hierarchical representation of factors and classifying them under four relatively diverse clusters based on their driving and dependence power. Although the research is quite newer in regards to presenting the idea of classification and level creation of CSFs, however, further quantitative research should be conducted using the CSF's of BDA classified here based on different industries where BDA is currently applied. This is to ensure that we can come to reliable results and representative findings regarding the CSF's of BDA. Furthermore, the development of the phenomenon Big Data should be continuously studied, since this phenomenon is relatively new and emerging, new insights, movements and theories regarding Big Data can influence the nature of this phenomenon. Moreover a quantitative research approach enables the quantification of each single CSF in relation to BDA implementation and utilization projects in the IT industry. ACKNOWLEDGEMENT The research work presented in this paper is supported by grants to the second author from DST, via DST PURSE phase II, India. REFERENCES [1] Attri R., Dev, N. and Sharma, V.: (2013a), Interpretive structural modelling (ISM) approach: an
overview, Research Journal of Management Sciences, 2(2), pp. 3-8 [2] Attri R., Grover S., Dev N. Kumar D.: (2013b), An ISM approach for modelling the enablers in
the implementation of Total Productive Maintenance (TPM), International Journal System Assurance Engineering and Management, 4(4), pp. 313-326
[3] Attri R., Grover S., Dev N., Kumar D.: (2013c), Analysis of barriers of Total Productive Maintenance (TPM), International Journal System Assurance Engineering and Management, 4(4), pp. 365-377
[4] Attri R., Grover, S.: (2015a), Analyzing the scheduling system stage of production system life cycle, Management Science Letters, 5(5), pp. 431-442
[5] Attri R., Grover S.: (2015b), Contextual relationship among the quality enabled factors of inventory control system stage, International Journal of Recent advances in Mechanical Engineering, 4(2), pp. 45-57
[6] Bhashyam R.: (2011), Challenges of Handling Big Data, Retrieved 22.07.2013, from http://cdn.ttgtmedia.com/rms/pdf/Technology%20Challenges%20of%20Big%20Data.pdf [7] Chander M., Jain S. K., Shankar R.: (2013), Modeling of information security management
parameters in Indian organizations using ISM and MICMAC Approach, Journal of Modelling in Management, 8(2), pp. 171-189

108
[8] Cuzzocrea, Alfredo, Song, Il-Yeol, Davis, Karen C.: (2011), Analytics over Large-Scale Multidimensional Data: The Big Data Revolution! ACM (?), 3
[9] Davenport T. H., Patil D. J.: (2012), Data Scientist: The Sexiest Job of the 21st Century [10] Gartner: (2013a), Big Data, Retrieved 22.06.2013, from http://www.gartner.com/it-
glossary/big-data/ [11] Gartner: (2013b), Critical Success Factors. Retrieved 22.06.2013, from
http://www.gartner.com/itglossary/csf-critical-success-factor/ [12] Giannikas V.: (2011), Six Tips for Students Interested in Big Data Analytics. ACM, 1 [13] Gopalkrishnan V., Steier D., Lewis H., Guszcza J.: (2012). Big Data, Big Business: Bridging
the Gap. 5 [14] Gualtieri M.: (2012), The pragmatic definition of big data. Retrieved 11.08.2013, from http://blogs.forrester.com/mike_gualtieri/12-12-16,
technopolitics_podcast_the_pragmatic_definition_of_big_data_explained [15] Howie T.: (2013), The Big Bang: How the Big Data Explosion Is Changing the World.
28.07.2013, http://blogs.msdn.com/b/microsoftenterpriseinsight/archive/2013/04/15/thebig-bang-how-the-big-data-explosion-is-changing-the-world.aspx (Retrieved)
[16] Laney D.: (2001), 3D Data Management: Cotrolling Data Volume, Velocity, and Variety. 4 [17] Mahajan R., Agrawal R., Sharma, V., Nangia V.: (2014), Factors affecting quality of
management education in India, International Journal of Educational Management, 28(4), pp. 379-399
[18] Mandal A., Deshmukh S. G.: (1994), Vendor selection using interpretive structural modeling (ISM) International Journal of Operations and Production Management, 14(6), pp.52–59
[19]Raj T., Attri R.: (2011), Identification and modelling of barriers in the implementation of TQM, International Journal of Productivity and Quality Management, 28(2), pp. 153-179
[20] Raj T., Attri R., Jain V.: (2012), Modelling the factor affecting flexibility in FMS, International Journal of Industrial and System Engineering, 11(4), pp. 350-374
[21] Sage A. P.: (1977), Interpretive Structural Modeling: Methodology for Large-scale Systems, McGraw-Hill, New York, NY, pp. 91-164
[22] Routroy S., Pradhan S. K.: (2014), Benchmarking model of supplier development for an Indian gear manufacturing company, Benchmarking: An International Journal, 21(2), pp. 253-275
[23] Sathi A.: (2012), Big Data Analytics: Disruptive Technologies for Changing the Game. 1. Mc Press
[24] SAS: (2013), Big Data – What Is It? Retrieved 02.05.2013, from http://www.sas.com/big-data/ [25] Sharma R. K., Kumar D., Kumar P.: (2005), FLM to select suitable maintenance strategy in process industries using MISO model, Journal of Quality in Maintenance Engineering 11(4), pp. 359-374 [26] Sicular S.: (2012), No Data Scientist Is an Island in the Ocean of Big Data. Gartner [27] Swoyer S.: (2012), Big Data- Why the 3Vs Just Don’t Make Sense, TDWI.org, Retrieved
February 7, 2014 from http://tdwi.org/articles/2012/07/24/big-data-4th-v.aspx [28] Tankard C.: (2012), Big data security. Network Security, Volume 2012, Number 7 [29] Toktaş-Palut P., Baylav E., Teoman S., Altunbey M.: (2014), The impact of barriers and benefits of
e-procurement on its adoption decision: An empirical analysis, International Journal of Production Economics, 158, pp. 77-90.
[30] Tripathy S., Sahu S., Ray P. K.: (2013), Interpretive structural modelling for critical success factors of R&D performance in Indian manufacturing firms, Journal of Modelling in Management, 8(2), pp. 212-240
[31] Walsham G.: (1993), Interpreting Information Systems in Organizations, Wiley, Chichester [32] Warfield J. N.: (1974), Developing interconnection matrices in structural modeling, IEEE
Transactions on Systems, Man and Cybernetics, 4(1), pp. 81-87

109
Appendix A: Survey Questionnaire
Please indicate your level of agreement of the following statements regarding Big Data Analytics Practices in your organization based on your experience and understanding. Please mark your choice on a scale of 1-5, where 1 implies a "Strongly Disagree", whereas a 5 implies a "Strongly Agree".
Please ensure that your responses are your best guess based on your understanding and experience of Big Data Analytics Practices employed by your team in your organization.
Strongly Disagree
Disagree Neither disagree nor agree
Somewhat Agree
Strongly Agree
Not Applicable
Educated analysts in text analysis methodologies are needed. 1 2 3 4 5 X Big Data technology skills within own staff or hired externally are needed. 1 2 3 4 5 X
The analysis team should consist of members from different business departments that are involved in the project, as well as members from the IT department.
1 2 3 4 5 X
IT staff needs to be aware that creating and maintaining the documentation of the new implemented systems is vital.
Especially because these are innovative systems.
1 2 3 4 5 X
Identifiable value for the business is delivered from the project. The project must support the business needs. 1 2 3 4 5 X
Creation of a clear vision and implementation strategy for the software and hardware components of the new analysis platform.
1 2 3 4 5 X
Creation and disseminating of documentation needs to be a fixed part of the project. 1 2 3 4 5 X
The growth of analysis data has to be forecasted to be able to react early when used systems need to be expanded.
1 2 3 4 5 X
Processes need to be established in order to ensure high data quality of the documents used for the analysis. 1 2 3 4 5 X
A measureable project outcome has to be defined and in fact measured to evaluate the success of the project. 1 2 3 4 5 X
Strong leadership has to be provided throughout the project. The top management level of the organization needs to get involved.
1 2 3 4 5 X
A clear goal of the project has to be defined, and measurements have to be established. The project needs to have a clear start and end.
1 2 3 4 5 X
The size of the project has to be determined carefully. 1 2 3 4 5 X Awareness of recent developments in the Big Data analysis area, including evaluation, selection and
implementation of new software methodologies. 1 2 3 4 5 X
Document collection is a significant problem, only with the right documents provided the needed answers can be found within the data.
1 2 3 4 5 X
Evaluation of the used hardware to make sure it meets the requirement of the growing data amount also in future.
1 2 3 4 5 X
Developing, integration and application of logical data models for the new analysis platform. 1 2 3 4 5 X
Performance has to be monitored continuously and the system needs to be tuned on a regular basis to meet operational goals.
1 2 3 4 5 X

110
Appendix B: Please tick mark (√) in the cells wherever you find that the row factor influences the column factor. For example, if you find that Analytical/Statistical Skills influences measurement, defined outcome of the project than in the Ist row under measurement, defined outcome mark ‘√’ else leave it blank.
Factors
Analytical/Statistical Skills
Technological Skills
Multidisciplinary Team
Documentation
Identifiable Business
Value, ROI
Big Data Strat
egy
Forecast Data
Growth
High Data Quali
ty
Measurement, Defined
Outcome
Top Management Support,
Executive Level Support, Leadership
Project Goal, Milestones,
Deadlines
Clear & Manageable Project
Scope, Adequate Size
Investment in new technology/a
nalytical tools
Document collection, access to
sources
Adequate hardware, storage
Integration of new solution
Fast performance, fast
delivering of results
Analytical/Statistical Skills
X
Technological Skills
X
Multidisciplinary Team
X
Documentation X
Identifiable Business Value, ROI
X
Big Data Strategy
X
Forecast Data Growth
X
High Data
Quality X
Measurement, Defined
Outcome
X
Top
Management Support, Executive Level Support,
Leadership
X
Project Goal, Milestones,
Deadlines
X
Clear & Manageable
Project Scope, Adequate Size
X
Investment in new technologies, analytical tools
X
Document
collection, access to sources
X
Adequate hardware, storage, real time
X
Integration of new solution, coexistence
X
Fast performance,
fast delivering of results
X
Respondent’s Background Information Response (Mark √)
Choices
Primary ‘identity’ of our organization Computer Related (IS/MIS/DP/Hardware/Software) Telecommunications Banking/Insurance Real Estate Business Supplies/Services Education/Research Entertainment/Media/Publishing Hospitality Medical/Health Care Government Engineering/Construction Consulting Legal Services Manufacturing/Distribution Consumer Retail/wholesale Non-Profit/membership organization Electrical Machines Aerospace Other ___________ (please specify) Number of employees in our organization Less than 10 10-20 21-50 51-100 101-500 501 – 1000 Greater than 1000 Number of employees in our team Less than 5 6-10 11-20 21-50 Greater than 50 My role in the team: Functional Manager Project Manager Data Scientist Team Leader Developer/Tester Other ______ _____ (please specify) I have been aware about Big Data Analytics practices for: 1-3 years 3-5 years Greater than 5 years Less than 1 year I have been working on big data analytics project for: 1-3 years 3-5 years Greater than 5 years Less than 1 year