modeling multi channel advertising attribution across...
TRANSCRIPT
Modeling Multi-Channel Advertising Attribution Across Competitors
Eric Zheng, Yiyi Li, Ying Xie
Jindal School Of Management
University of Texas at Dallas
Abstract
The bursts and multiplicity of Internet advertising have made multi-channel attribution an
immediate challenge for marketing practitioners. Existing attribution models predominantly
focus on analyzing consumers’ converting path with respect to one focal firm while largely
overlooking the impact of their interactions with competing firms, leading to biased advertising
effectiveness estimates. We address this problem by developing an integrated individual-level
choice model that considers consumers’ online visit and purchase decisions across all
competitors within one industry. We specifically analyze the effects of multi-channel advertising
on: (1) consumer choice of entry site, (2) consumer search decisions concerning the remaining
websites that compete in the same industry, and (3) subsequent purchase at one of the searched
websites. We quantify the impact of different digital advertising channels on consumers’
decisions at different purchase funnel stages based on an individual-level click stream data for
the online air ticket booking industry. We find that information stock collected through all
advertising channels contributes significantly to consumers’ visit and purchase decisions, among
which search advertising is more effective in driving the choice of entry site while email
advertising has a larger effect on visit decision concerning remaining websites and purchase
decision. The own- and cross-marginal impacts of various ad channels on each firm vary widely
across competitors, and this is true at all purchase funnel stages. We also show that neglecting
competition may lead to underestimated advertising effects and worse predictions, by comparing
the estimated advertising effectiveness and predictive performance of our proposed model with
those of the common baseline model that only models consumers’ binary purchase decisions on a
focal firm.
Keywords: multi-channel attribution, competition, purchase funnel
1. Introduction
The advancement of digital technology has enabled firms to reach consumers through a
variety of advertising channels such as search engines, email, referral sites, and display ads. The
United States digital advertising market is estimated to reach US $72.09 billion by the end of
2016, surpassing the same year TV ad spending for the first time (emarketer.com, 2016).1
Consumers have also become more shopping savvy than ever before as many of them visit
multiple stores repeatedly while seeking the best deal before making a purchase (Park and Fader
2004). During this process it is highly likely that consumers are exposed to many ads posted by
different advertisers through multiple digital channels at different points in their purchase
journeys. It is therefore vital for firms to have a sound understanding of ad attribution and
analytics regarding the effects of various types of online advertisement across multi-channels and
multi-touch-points (MCMT hereafter).
Determining the value of digital advertising channels has attracted a growing interest
recently among researchers in Information Systems (e.g. Ghose and Todri 2015, Xu et al. 2014)
and Marketing (e.g. Li and Kannan 2014). The effectiveness of cross-channel advertising was
initially assessed with simple heuristic attribution rules. The “last-touch” model, the linear
model, the time decay model, and the position-based model are all examples of ad attribution
models using heuristic rules (Tornquist and Tradewell 2012). However, these models often do
not fully consider consumers’ entire purchase funnel (Li and Kannan 2014). To address this
1
https://www.emarketer.com/Article/US-Digital-Ad-Spending-Surpass-TV-this-Year/1014469, last accessed on
12/13/2016.
issue, researchers have proposed a number of algorithmic attribution models in recent years as
richer multi-channel data become available (e.g., Li and Kannan 2014, Abhishek et al. 2014, Xu
et al. 2014). Industry leaders such as Visual IQ, Convertro and Google also provide their clients
with advanced algorithmic-based models for understanding marketing performance across
multiple channels (Forrester 2014). These data-driven models attempt to go beyond advertising’s
direct effect on conversion by considering a consumer’s entire purchase journey. However, these
models predominantly focus on consumer interactions with a single focal firm while leaving out
the impact of competitive actions implemented by competing firms, which we view as a critical
determinant of consumer conversion.
Our goal is to develop a new cross-channel attribution model that incorporates consumers’
both searching and purchasing behaviors across multiple competing online stores within a
competitive online shopping environment. The most important distinction between our model
and other extant attribution models is that we consider consumers’ online store choice decisions
across multiple sellers, thus expanding the literature’s single-seller scope (e.g. Li and Kannan
2014, Xu et al. 2014) to a multi-seller scope. Consumers are likely to be exposed to various types
of digital ads from various competing sellers, and failing to account for consumers’ interactions
with these sellers may yield biased estimates of ad effectiveness. Advertising can exert two
separate effects on a consumer’s final purchase decision: converting the consumer from not
buying into buying, and influencing the consumer in choosing where to buy. With a single-seller
model, we are only able to capture the second effect, thus can underestimate the overall effect of
advertising. Moreover, the problem (of not accounting for competitive advertising) exacerbates
in a purchase funnel model because competitive advertising not only influences the final
conversion stage, but also the earlier product information search and alternative evaluation
stages. It is natural to expect that the marginal impact of different advertising channels on
consumers’ conversion probabilities varies across competitive firms and across different stages in
a purchase funnel. Firms can benefit from having competitive intelligence by considering
consumers’ interactions with all other firms competing within the same industry.
Toward this goal, we propose an integrated two-stage choice model in which a consumer
considers all available websites that offer the relevant product and then decide which ones to
visit and which one to make the purchase from. We follow previous literature (e.g. Li and
Kannan 2014, Abhishek et al. 2014) and adopt a funnel view of consumer online store choice
decisions for two reasons. First, doing so allows us to capture the heterogeneity in consumers’
consideration set which directly impacts their final purchase decisions. Ignoring this source of
heterogeneity will lead to biased advertising effect estimates on purchase decisions (Goeree
2008). Second, this model structure differentiates between the impacts of various advertising
channels on different purchase funnel stages, allowing us to separate the two advertising effects -
the effect on a brand’s inclusion within the consideration set and its effect on consumer purchase
utility. The resulting inferences therefore provide guidelines for more efficient ad allocation
along the purchase decision process.
We estimate this model using a unique individual-level panel dataset that records consumers’
interactions in their purchase funnel with all competing websites within the online air booking
industry through various online advertising channels including search engines, email, display

ads, referral engines and direct channel. Our result shows that the effects of information stock
gained through different channels are significant at both the visit stage and purchase stage.
However, the size of these effects varies across channels and stages. Specifically, we find that
information stock gained through direct channel is the most effective in driving both visit and
purchase decisions, followed by search advertising and email advertising. Display ads and
referral engines are less effective on either decision compared to the other channels. With our
competitive model, we are able to compute the own- and cross-marginal impacts of various ad
channels on each website. Our marginal impact analysis shows that the effectiveness of
advertising channels varies widely across competitors, and this is true for all purchase stages
considered in our model. The disparate effectiveness of the same advertising channel across
competitors highlights the importance of ad content and message strategies in a competitive
environment. A firm needs to determine its standing among the competitive pack and revise its
strategy accordingly by benchmarking its own ad effectiveness against competitors. Finally, we
highlight the importance and necessity of considering competition by comparing the estimated
advertising effectiveness and predictive performance derived from the two models: our proposed
model and a baseline model where we assume each firm only knows consumers’ interactions
within its own website. It turns out that the baseline model significantly underestimates the
advertising effectiveness and performs worse than our proposed model in predicting purchase of
a holdout sample.
To the best of our knowledge, this paper represents the first attempt in modeling multi-
channel attribution across competitors. Our primary contribution is that we develop an integrated
model that captures individual consumers’ interactions with all competing firms at different
stages along their online purchase journey. Our competition-centric analysis represents a
significant enrichment over extant ad attribution models that typically take a single firm
perspective, while neglecting competitive interactions. As companies are attaching more
importance to deriving competitive intelligence in ad attribution, there is an increasing
availability in cross-competitor ad clicks and browsing data provided by many marketing
analytics companies. For example, both ACNielsen and ComScore constantly track
representative consumers’ web browsing and purchases through cookies installed on their
browsers2. Companies can also form strategic alliance and share customer data with each other,
e.g. the strategic data sharing agreement between Amazon and Salesforce in 20163. In addition,
the advance of the new digital technologies has also made it possible for companies to infer
competitive intelligence through social media and online surveys4. In light of the increasing
availability of data that tracks consumers’ MCMT interactions with all competing firms, our
study represents a timely precursor to what is to come in the imminent competitive analytics
field. Our model will become more and more feasible as the information technology advances.
The inferences from our model will provide companies critical competitive intelligence that
helps guide their advertising allocation decisions in an online shopping environment that is
2 These firms are even able to link consumers’ behavior across multiple devices. According to their websites (e.g.,
http://www.comscore.com/Industries), many leading firms (including those in our analysis) have subscribed to these
services. 3
http://www.nasdaq.com/article/amazon-and-salesforce-extend-strategic-alliance-to-deliver-service-integrations-
20161202-00256/amp, last accessed on 12/13/2016. 4 Tracking customers’ social media activities can also help firms to identify their customers’ interactions with their
competitors. In fact, SAS’s social media analytics tool provides such analysis
(https://www.sas.com/content/dam/SAS/pl_pl/doc/factsheet/sas-social-media-analytics.pdf) .
characterized by intense competition.
The rest of this paper is organized as follows. In §2 we review the related research and
discuss how our study contributes to the literature. In §3 we set up the proposed integrated two-
stage model. We then provide an overview of the data used for this study and show model-free
evidence of the online shoppers’ searching and purchasing patterns in §4. In §5 we present the
estimation results and evaluate the effectiveness of different ad formats implied by these model
estimates. In §6, we demonstrate the importance and necessity of modeling competition between
websites by comparing our model with a baseline model which only considers consumers’
interactions with a focal firm. Finally, we conclude with discussions and directions for future
research in §7.
2. Literature Review
Information Systems and Marketing researchers have long been interested in measuring the
effectiveness of different online advertising formats such as search advertising (Agarwal et al.
2011 & 2015, Ghose and Yang 2009) and display ads (e.g., Lewis and Reiley 2014, Rutz and
Bucklin 2012, Goldfarb and Tucker 2011). Recently as rich multi-channel data becomes
available, multi-channel ad attribution has gained special attention. Table 1 provides an overview
of the extant research on multi-channel attribution, where we compare the studies along
dimensions including the level of data aggregation, product category, ad channels investigated,
the consideration of pre-purchase decisions, the consideration of competition and the modeling
approach. Some notable recent papers in this stream of literature include Ghose and Todri
(2015), Li and Kannan (2014), Xu et al. (2014), Abhishek et al. (2014), and Zantedeschi et al.

(2016). Ghose and Todri (2015) study how exposure to various types of display ads (e.g.,
retargeting, affiliate targeting advertising, etc.) and the duration of exposures affect consumers’
active and passive search behaviors and conversion probability using a difference-in-difference
(DID) matching estimator. Li and Kannan (2014) model a consumer’s consideration of
advertising channels, the visit through a given channel and purchase decision jointly; and
estimate the carryover and spillover effects of advertising channels. They find that information
stock gained through firm-initiated channels significantly increases a consumer’s conversion
probability, but the incremental impact of paid search channels is smaller than previously
estimated. Abhishek et al. (2014) apply a Hidden Markov Model to uncover the impact of ads at
different latent purchase stages. They show that display ads exert a positive impact on early
stages but do not increase the conversion probability directly, while search ad effects show up
throughout all stages. Xu et al. (2014) report similar findings using a Mutually Exciting Point
Process Model in which ad clicks and purchases are modeled as different types of random points
in continuous time and earlier points can affect the types of later points. Zantedeschi et al. (2016)
conduct randomized field experiments to estimate the short- and long-term effects of multiple
online and offline advertising formats on consumer purchases from a single firm.
Most of the above studies suggest that the effect size of ad channels may vary across
different stages along the conversion funnel, emphasizing the importance of modeling multiple
stages in consumer’s purchase funnel. We accordingly adopt the same funnel view and model a
consumer’s website visit decisions in addition to her final purchase choice. However, the key
distinction of our model from these previous studies lies in our explicit consideration of cross-
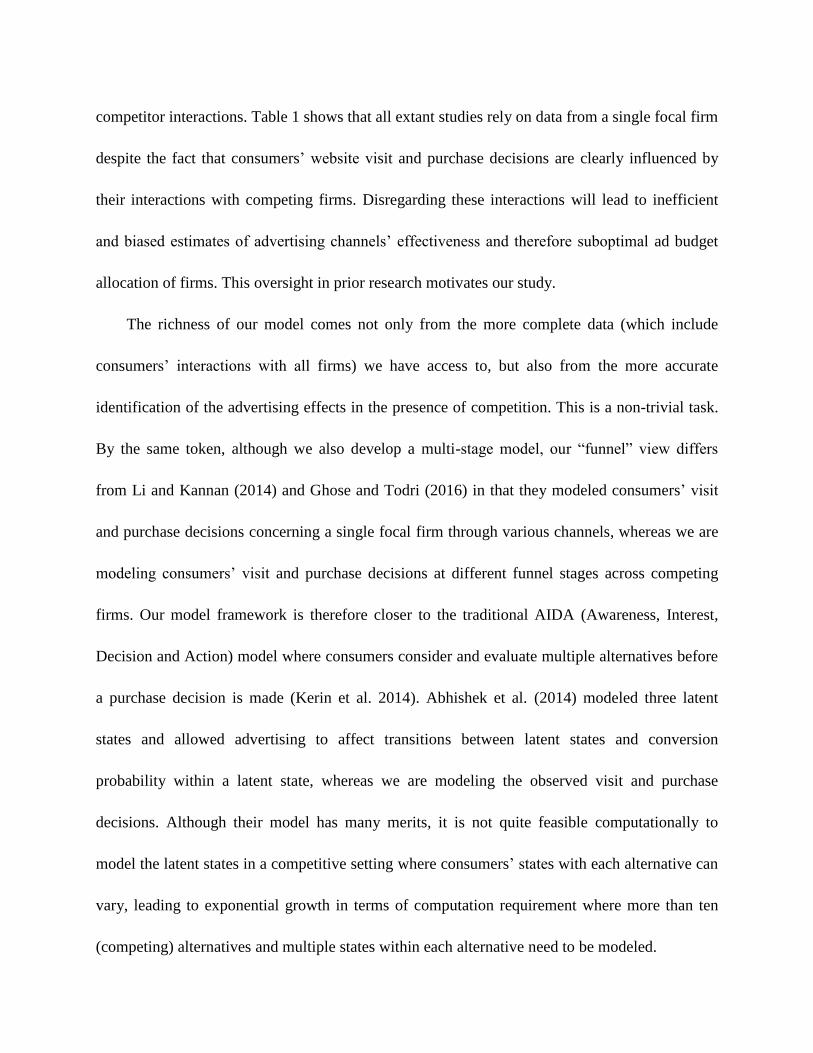
competitor interactions. Table 1 shows that all extant studies rely on data from a single focal firm
despite the fact that consumers’ website visit and purchase decisions are clearly influenced by
their interactions with competing firms. Disregarding these interactions will lead to inefficient
and biased estimates of advertising channels’ effectiveness and therefore suboptimal ad budget
allocation of firms. This oversight in prior research motivates our study.
The richness of our model comes not only from the more complete data (which include
consumers’ interactions with all firms) we have access to, but also from the more accurate
identification of the advertising effects in the presence of competition. This is a non-trivial task.
By the same token, although we also develop a multi-stage model, our “funnel” view differs
from Li and Kannan (2014) and Ghose and Todri (2016) in that they modeled consumers’ visit
and purchase decisions concerning a single focal firm through various channels, whereas we are
modeling consumers’ visit and purchase decisions at different funnel stages across competing
firms. Our model framework is therefore closer to the traditional AIDA (Awareness, Interest,
Decision and Action) model where consumers consider and evaluate multiple alternatives before
a purchase decision is made (Kerin et al. 2014). Abhishek et al. (2014) modeled three latent
states and allowed advertising to affect transitions between latent states and conversion
probability within a latent state, whereas we are modeling the observed visit and purchase
decisions. Although their model has many merits, it is not quite feasible computationally to
model the latent states in a competitive setting where consumers’ states with each alternative can
vary, leading to exponential growth in terms of computation requirement where more than ten
(competing) alternatives and multiple states within each alternative need to be modeled.
Table 1. Summary of Research on Multi-channel Attribution
Individual
/aggregate
Data: product
category
Ad
channels
Funnel
View
Dynamic
Effect
Competitive
Effect
Methodology
Ghose and Todri
2015
Individual Concealed 1,2,4 Yes No No DID Matching
Shao and Li 2011 Individual Software 3,5,6,7 No No No Bagged Logit
Li and Kannan
2014
Individual Hospitality 1,2,4,5,6 Yes No No Hierarchical Bayes model
Xu et al. 2014 Individual Electronics 3,6,7 Yes No No Mutually exciting point
process model
Anderl et al. 2013 Individual Fashion, luggage,
travel
1,2,4,5,6,7 No No No Graph-Based data mining
Anderl 2013 Individual Fashion 1,2,4,5,6,7 No No No Proportional hazard
Abhishek et al.
2014
Individual Automobile 3,6 Yes No No Dynamic Hidden Markov
model
Zantedeschi et al.
2016
Individual Specialty retailer 5,8 No Yes No Bayesian Tobit model
Wiesel et al. 2011 Aggregate Furniture 1,5,7 Yes No No VAR
Haan et al. 2014 Aggregate 5 categories 3,4,5,6,7,8 Yes No No Structural VAR
Demirci et al. 2014 Aggregate 4 categories 1,2,5,6,7,8 No No No Bayesian VAR
Raman et al. 2012 Analytical NR 2 channels No No No Time-varying Nerlove-Arrow
Our paper Individual Air travel 3,4,5,6 Yes Yes Yes Three-Stage Choice Model
Note: 1) Ad channels: 1- search: paid, 2- search: organic, 3- search: general, 4- referral, 5- email, 6- display, 7- other online, 8-
offline 2) NR = Not Relevant
3. Empirical Setting
We obtained a click-stream data set collected by a leading media measurement and
analytics US company in 2010. This company manages a large-scale consumer panel that is
representative of the U.S. population. The company recruits panelists to install a software meter
so that all their PC-based Internet activities across all web entities will be recorded non-
intrusively. The click stream data is organized into user sessions which are defined as visits to a
sequence of specific websites consecutively without a break of more than 30 minutes. Each
session tracks a panelist’s ID, domain name, date and time of visit, referral domain name (from
which advertising channel can be inferred), browsing activity measured by the number of pages
viewed and duration in minutes, as well as the purchase activity including product category,
product description, quantity and price paid if a transaction occurs.
The analysis is confined to data that pertain to online flight booking service. We choose
this category among more than 60 product categories for the following reasons. First, travel is
the largest eCommerce category, comprising of 36% of all B2C eCommerce sales in 2012
(eMarketer, 2013)5, so we will have a sufficiently large sample to ensure reliable estimation.
Second, air tickets tend to be non-differentiated search goods which reduce the possible
confounding effect resulting from product-level heterogeneity. The price differentiation across
online agents for a given trip at a given time point is also minimal; price is therefore unlikely to
play a major role in a consumer’s decision regarding which website to purchase from. Third, air
tickets are relatively expensive, averaging US $450 per ticket (Li et al. 2014). Since the prices of
air tickets are extremely dynamic, savvy consumers act strategically with extensive searches and
patience to wait for discounted tickets (Li et al. 2014). Advertising plays an important role in
5 https://www.emarketer.com/Article/Slow-Steady-Continued-Gains-US-Digital-Travel-Sales/1009909, last accessed
on 12/13/2016.
informing and reminding consumers in such an environment, making it an appealing test-bed for
our model. These features ensure that consumers will be highly subject to ad exposures and
engage in substantial searches for air travel, making this category an ideal setting for our
research.
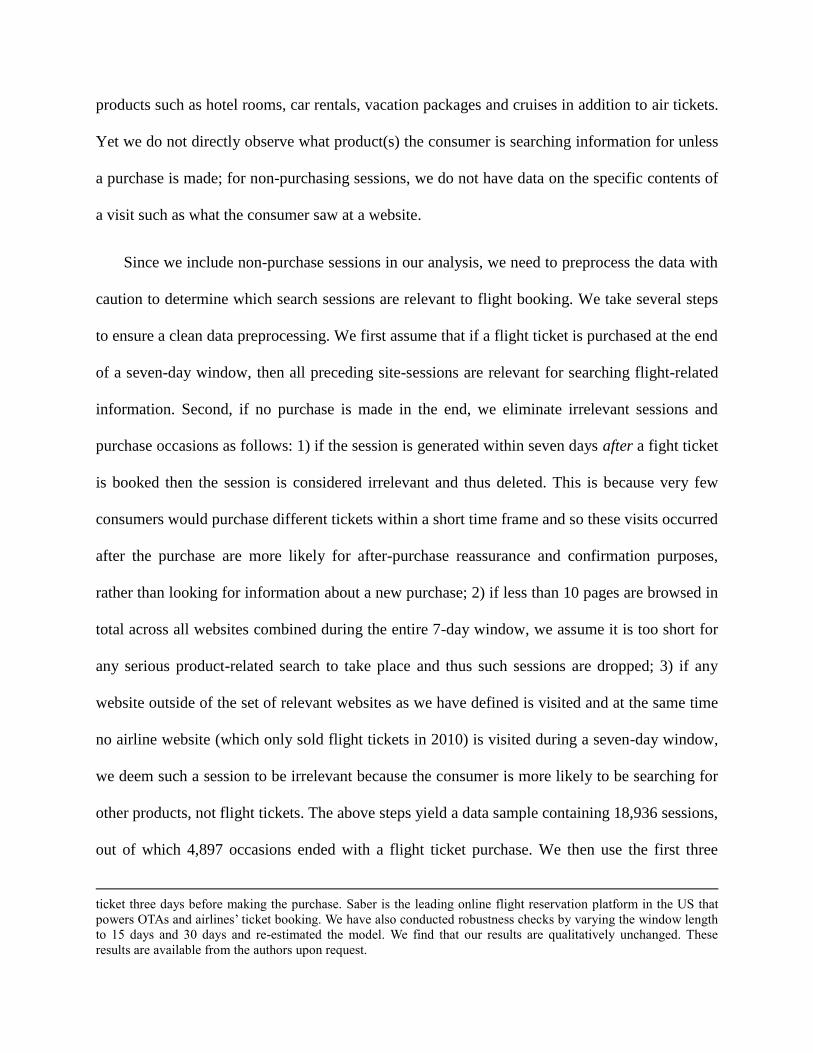
We identify the set of relevant websites from the panelists’ purchase records. A website is
included in the analysis if at least one purchase in the air travel category occurred on the website
during our entire observational period6. These websites can be grouped into two types: 1) major
airlines’ official websites, including AA.com, Airtran.com, Alaskaair.com, Continental.com,
Delta.com, Jetblueairways.com, Nwa.com, Southwest.com, Spiritair.com, United.com, and
Usairways.com; 2) major online travel agencies (OTA hereafter), including Expedia.com,
Priceline.com, Orbitz.com, Travelocity.com, Cheaptickets.com, Hotwire.com, Americanexpress-
travel.com, Sabresonicweb.com, and Wwte1.com. We exclude Southwest.com from our analysis
because their tickets are sold only via the company’s direct website but not through OTAs.
Consumers who purchase from Southwest.com may have completely different consideration set
(only consists of Southwest.com) than others (consists of all available websites). Due to
computational considerations (to alleviate the curse of dimensionality), we opted to consolidate
some smaller airlines and OTAs when constructing the full choice set. For airlines, we separate
the top three airlines, Delta Airlines, American Airlines and United Airlines from the rest
because they were the top three largest major airlines in the US in year 2010 and were visited
more frequently in our data sample than any single remaining airline website as shown in Table
27. We accordingly combine the remaining airline websites into one “other airlines” option. By
6 There might be other websites that also sell air tickets excluded from our analysis. However, since no air-travel
ticket purchase took place on those websites during the entire sample period these websites are likely to be very
small players in this category. The exclusion of these websites should therefore not significantly alter the results. 7 In 2010, Delta , United and American Airlines enplaned 162.6, 145.6 and 104.5 billion passengers respectively,
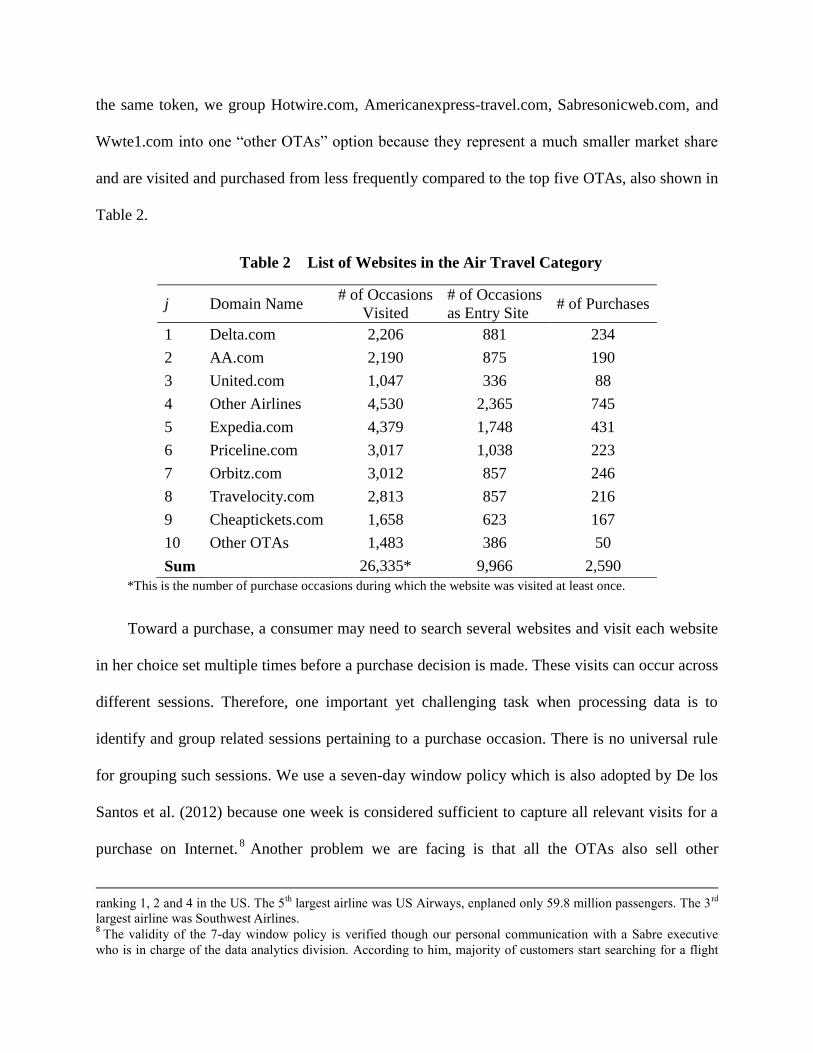
the same token, we group Hotwire.com, Americanexpress-travel.com, Sabresonicweb.com, and
Wwte1.com into one “other OTAs” option because they represent a much smaller market share
and are visited and purchased from less frequently compared to the top five OTAs, also shown in
Table 2.
Table 2 List of Websites in the Air Travel Category
j Domain Name # of Occasions
Visited
# of Occasions
as Entry Site # of Purchases
1 Delta.com 2,206 881 234
2 AA.com 2,190 875 190
3 United.com 1,047 336 88
4 Other Airlines 4,530 2,365 745
5 Expedia.com 4,379 1,748 431
6 Priceline.com 3,017 1,038 223
7 Orbitz.com 3,012 857 246
8 Travelocity.com 2,813 857 216
9 Cheaptickets.com 1,658 623 167
10 Other OTAs 1,483 386 50
Sum
26,335* 9,966 2,590
*This is the number of purchase occasions during which the website was visited at least once.
Toward a purchase, a consumer may need to search several websites and visit each website
in her choice set multiple times before a purchase decision is made. These visits can occur across
different sessions. Therefore, one important yet challenging task when processing data is to
identify and group related sessions pertaining to a purchase occasion. There is no universal rule
for grouping such sessions. We use a seven-day window policy which is also adopted by De los
Santos et al. (2012) because one week is considered sufficient to capture all relevant visits for a
purchase on Internet.8 Another problem we are facing is that all the OTAs also sell other
ranking 1, 2 and 4 in the US. The 5
th largest airline was US Airways, enplaned only 59.8 million passengers. The 3
rd
largest airline was Southwest Airlines. 8 The validity of the 7-day window policy is verified though our personal communication with a Sabre executive
who is in charge of the data analytics division. According to him, majority of customers start searching for a flight
products such as hotel rooms, car rentals, vacation packages and cruises in addition to air tickets.
Yet we do not directly observe what product(s) the consumer is searching information for unless
a purchase is made; for non-purchasing sessions, we do not have data on the specific contents of
a visit such as what the consumer saw at a website.
Since we include non-purchase sessions in our analysis, we need to preprocess the data with
caution to determine which search sessions are relevant to flight booking. We take several steps
to ensure a clean data preprocessing. We first assume that if a flight ticket is purchased at the end
of a seven-day window, then all preceding site-sessions are relevant for searching flight-related
information. Second, if no purchase is made in the end, we eliminate irrelevant sessions and
purchase occasions as follows: 1) if the session is generated within seven days after a fight ticket
is booked then the session is considered irrelevant and thus deleted. This is because very few
consumers would purchase different tickets within a short time frame and so these visits occurred
after the purchase are more likely for after-purchase reassurance and confirmation purposes,
rather than looking for information about a new purchase; 2) if less than 10 pages are browsed in
total across all websites combined during the entire 7-day window, we assume it is too short for
any serious product-related search to take place and thus such sessions are dropped; 3) if any
website outside of the set of relevant websites as we have defined is visited and at the same time
no airline website (which only sold flight tickets in 2010) is visited during a seven-day window,
we deem such a session to be irrelevant because the consumer is more likely to be searching for
other products, not flight tickets. The above steps yield a data sample containing 18,936 sessions,
out of which 4,897 occasions ended with a flight ticket purchase. We then use the first three
ticket three days before making the purchase. Saber is the leading online flight reservation platform in the US that
powers OTAs and airlines’ ticket booking. We have also conducted robustness checks by varying the window length
to 15 days and 30 days and re-estimated the model. We find that our results are qualitatively unchanged. These
results are available from the authors upon request.
months (January to March 2010) to construct the historical variables for each individual user,
and the next six months (April to September 2010) as the estimation sample to calibrate the
model, and the last three months (October to December 2010) as the out-of-sample to conduct
predictive analysis. Our final estimation sample consists of 9,966 purchase occasions with 2,590
of them ended up with a purchase. Table 2 presents the complete list of websites included in our
analysis and their respective frequencies of being searched, being chosen as the entry website as
well as being the website to make the purchase in the estimation sample.
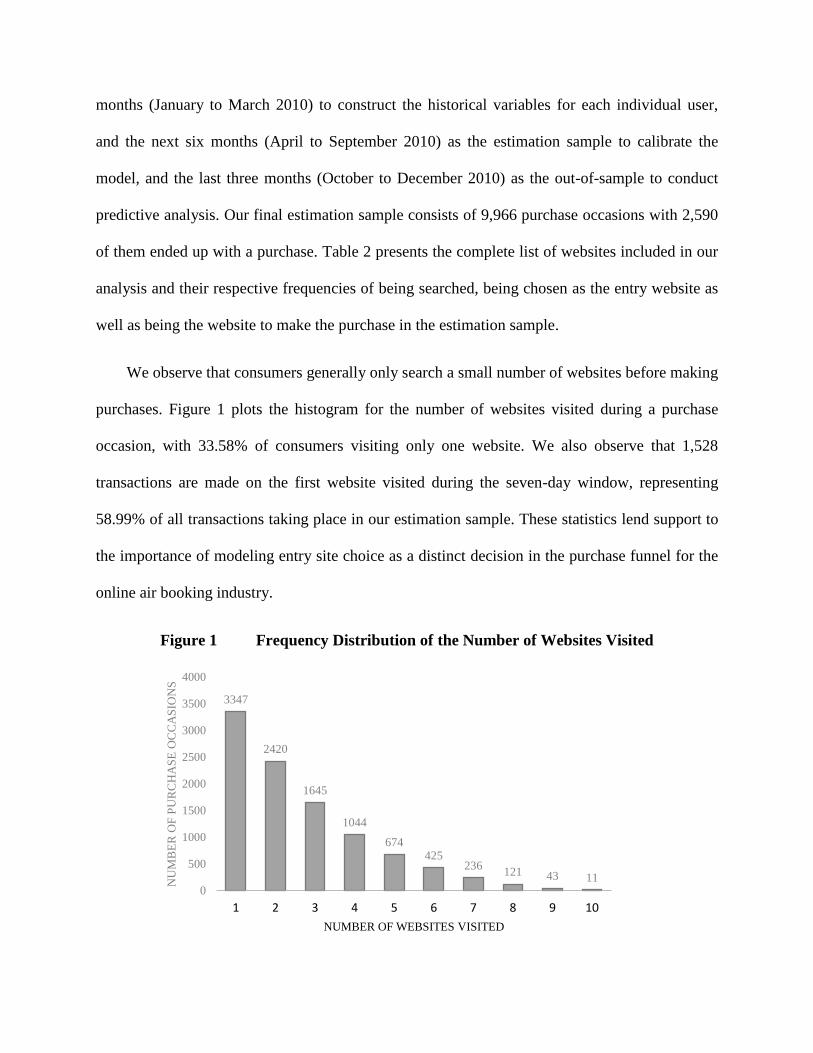
We observe that consumers generally only search a small number of websites before making
purchases. Figure 1 plots the histogram for the number of websites visited during a purchase
occasion, with 33.58% of consumers visiting only one website. We also observe that 1,528
transactions are made on the first website visited during the seven-day window, representing
58.99% of all transactions taking place in our estimation sample. These statistics lend support to
the importance of modeling entry site choice as a distinct decision in the purchase funnel for the
online air booking industry.
Figure 1 Frequency Distribution of the Number of Websites Visited
3347
2420
1645
1044
674 425
236 121 43 11
0
500
1000
1500
2000
2500
3000
3500
4000
1 2 3 4 5 6 7 8 9 10
NU
MB
ER
OF
PU
RC
HA
SE
OC
CA
SIO
NS
NUMBER OF WEBSITES VISITED
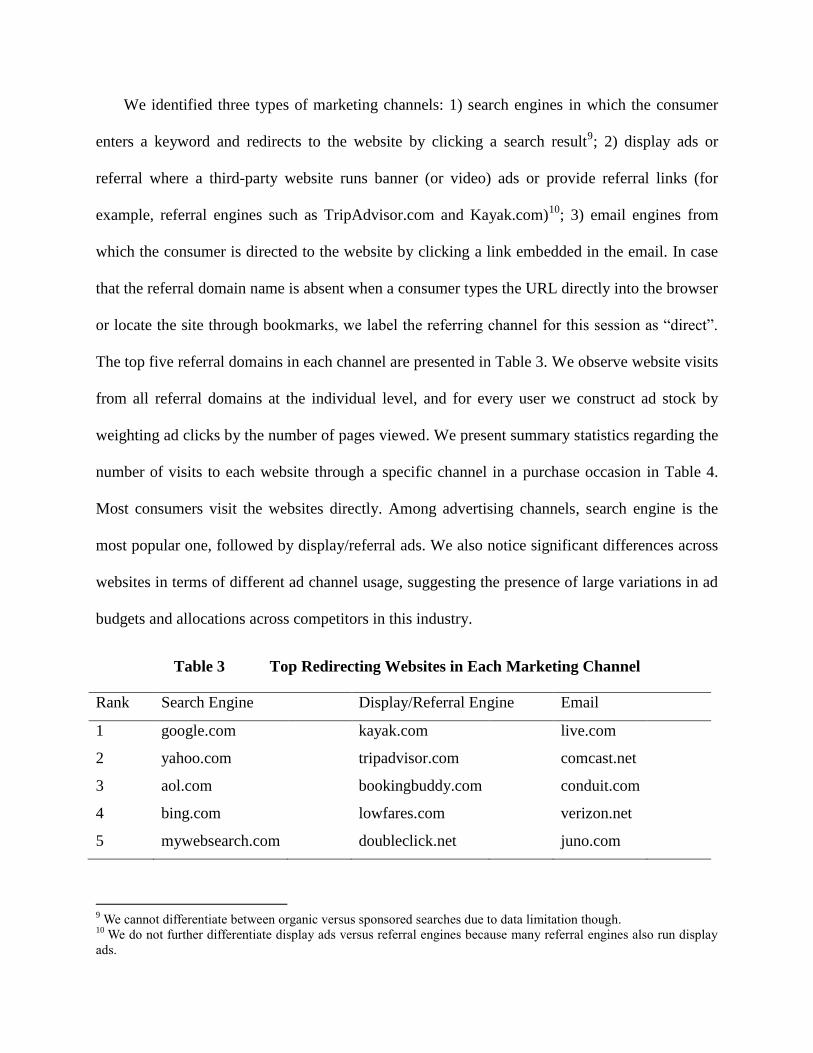
We identified three types of marketing channels: 1) search engines in which the consumer
enters a keyword and redirects to the website by clicking a search result9; 2) display ads or
referral where a third-party website runs banner (or video) ads or provide referral links (for
example, referral engines such as TripAdvisor.com and Kayak.com)10
; 3) email engines from
which the consumer is directed to the website by clicking a link embedded in the email. In case
that the referral domain name is absent when a consumer types the URL directly into the browser
or locate the site through bookmarks, we label the referring channel for this session as “direct”.
The top five referral domains in each channel are presented in Table 3. We observe website visits
from all referral domains at the individual level, and for every user we construct ad stock by
weighting ad clicks by the number of pages viewed. We present summary statistics regarding the
number of visits to each website through a specific channel in a purchase occasion in Table 4.
Most consumers visit the websites directly. Among advertising channels, search engine is the
most popular one, followed by display/referral ads. We also notice significant differences across
websites in terms of different ad channel usage, suggesting the presence of large variations in ad
budgets and allocations across competitors in this industry.
Table 3 Top Redirecting Websites in Each Marketing Channel
Rank Search Engine Display/Referral Engine Email
1 google.com 30.96% kayak.com 2.92% live.com 2.65%
2 yahoo.com 14.58% tripadvisor.com 2.14% comcast.net 1.11%
3 aol.com 6.10% bookingbuddy.com 1.87% conduit.com 0.69%
4 bing.com 5.53% lowfares.com 1.33% verizon.net 0.25%
5 mywebsearch.com 1.48% doubleclick.net 1.16% juno.com 0.12%
9 We cannot differentiate between organic versus sponsored searches due to data limitation though.
10 We do not further differentiate display ads versus referral engines because many referral engines also run display
ads.
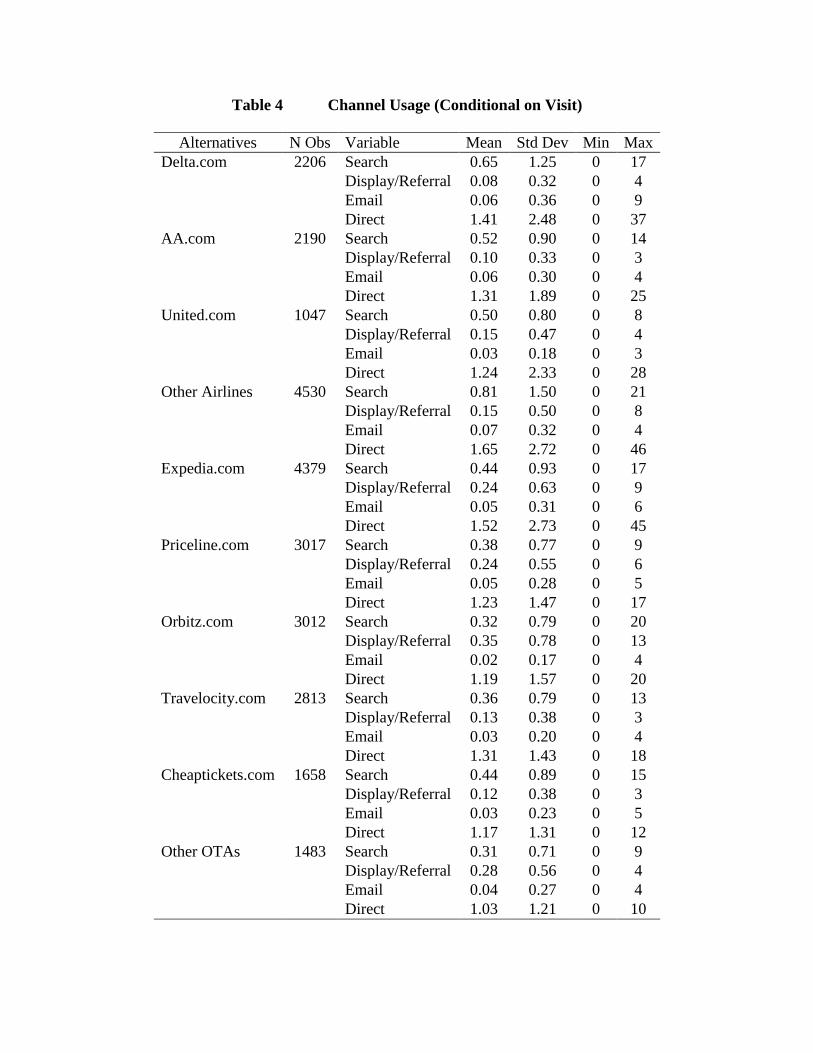
Table 4 Channel Usage (Conditional on Visit)
Alternatives N Obs Variable Mean Std Dev Min Max
Delta.com 2206 Search 0.65 1.25 0 17
Display/Referral 0.08 0.32 0 4
Email 0.06 0.36 0 9
Direct 1.41 2.48 0 37
AA.com 2190 Search 0.52 0.90 0 14
Display/Referral 0.10 0.33 0 3
Email 0.06 0.30 0 4
Direct 1.31 1.89 0 25
United.com 1047 Search 0.50 0.80 0 8
Display/Referral 0.15 0.47 0 4
Email 0.03 0.18 0 3
Direct 1.24 2.33 0 28
Other Airlines 4530 Search 0.81 1.50 0 21
Display/Referral 0.15 0.50 0 8
Email 0.07 0.32 0 4
Direct 1.65 2.72 0 46
Expedia.com 4379 Search 0.44 0.93 0 17
Display/Referral 0.24 0.63 0 9
Email 0.05 0.31 0 6
Direct 1.52 2.73 0 45
Priceline.com 3017 Search 0.38 0.77 0 9
Display/Referral 0.24 0.55 0 6
Email 0.05 0.28 0 5
Direct 1.23 1.47 0 17
Orbitz.com 3012 Search 0.32 0.79 0 20
Display/Referral 0.35 0.78 0 13
Email 0.02 0.17 0 4
Direct 1.19 1.57 0 20
Travelocity.com 2813 Search 0.36 0.79 0 13
Display/Referral 0.13 0.38 0 3
Email 0.03 0.20 0 4
Direct 1.31 1.43 0 18
Cheaptickets.com 1658 Search 0.44 0.89 0 15
Display/Referral 0.12 0.38 0 3
Email 0.03 0.23 0 5
Direct 1.17 1.31 0 12
Other OTAs 1483 Search 0.31 0.71 0 9
Display/Referral 0.28 0.56 0 4
Email 0.04 0.27 0 4
Direct 1.03 1.21 0 10
4. The Model
Our model adopts the purchase funnel view in the context of online shopping of high-
involvement products within a competitive environment. The funnel view is grounded in the
information processing theory describing the path through which consumers make their purchase
decisions, from perceiving a need to post-purchase behaviors (Bettman et al., 1998). A
consumer’s decision process is metaphorically referred to as a funnel because the number of
alternatives considered diminishes as she moves along the purchase journey.
The purchase funnel view can be applied to both product (or brand) choices and store (or
website) choices. We apply it to the second scenario and study how online multi-channel
advertising affects consumers’ decision to visit and purchase from available websites. We
specifically model a two-stage choice process in which consumers first select a subset of relevant
websites to search for product information and then choose a single website from the subset to
make the purchase or choose the outside option of no purchase.
We allow the effect of the information stock (accumulated through different advertising
channels) of a consumer to vary across different funnel stages. Previous literature on
multichannel marketing supports this assumption. For example, Abhishek et al. (2014) show that
display ads tend to be more effective during the early stage in a purchase funnel; while the
impact of email, search, and referral is more pronounced in later stages. Li and Kannan (2014)
find that consumer-initiated channels (paid search, referral and direct) are more effective in
reducing consumer search cost in early stages, while firm-initiated channels (email and display)
contribute more at later stages. However, in contrast to most extant ad attribution models that
focus on choices within a focal website only (for example, in-store product choices in Abhishek
et al. 2014 and ad channel choices in Li and Kannan 2014), our primary interest is to model
consumer choices across competing websites at different stages of a purchase funnel. Next we
describe the details of each stage.
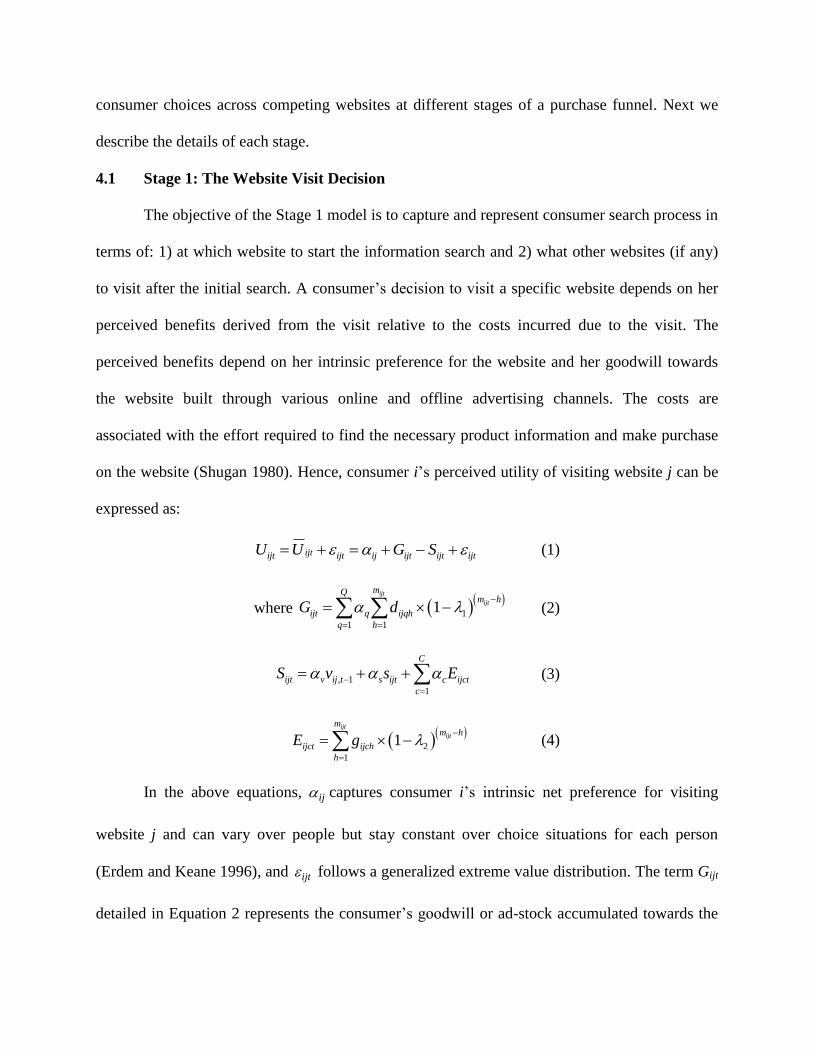
4.1 Stage 1: The Website Visit Decision
The objective of the Stage 1 model is to capture and represent consumer search process in
terms of: 1) at which website to start the information search and 2) what other websites (if any)
to visit after the initial search. A consumer’s decision to visit a specific website depends on her
perceived benefits derived from the visit relative to the costs incurred due to the visit. The
perceived benefits depend on her intrinsic preference for the website and her goodwill towards
the website built through various online and offline advertising channels. The costs are
associated with the effort required to find the necessary product information and make purchase
on the website (Shugan 1980). Hence, consumer i’s perceived utility of visiting website j can be
expressed as:
ijtijt ijt ij ijt ijt ijtU U G S (1)
where 1
1 1
1ijt
ijt
mQm h
ijt q ijqh
q h
G d
(2)
, 1
1
C
ijt v ij t s ijt c ijct
c
S v s E
(3)
2
1
1ijt
ijt
mm h
ijct ijch
h
E g
(4)
In the above equations, ij captures consumer i’s intrinsic net preference for visiting
website j and can vary over people but stay constant over choice situations for each person
(Erdem and Keane 1996), and ijt follows a generalized extreme value distribution. The term Gijt
detailed in Equation 2 represents the consumer’s goodwill or ad-stock accumulated towards the
website through exposures to various firm-initiated advertising formats (Nerlove and Arrow
1962). Ad exposures to channel q in each period h are approximated using the website’s national
and local ad spending in that period, dijqh. We will provide details on the ad expenditure data in
Section 4.3. The informational effect of pervious exposures decays at a monthly discount rate λ1,
according to the elapsed number of months (mijt-h). The information channel-specific goodwill
can take many possible functional forms; we adopt a parsimonious one that assumes a linear
functional form, computed as a linear function of the decayed effects of a website’s investment
in various advertising channels. However, we must note that which functional form to use is
nonessential to our model and our model can be readily adapted to incorporate other
specifications for the latent goodwill accumulation process such as a nonlinear decay model.
The term Sijt detailed in Equation 3 represents consumer i’s cost of visiting website j. The
cost is non-zero, so an intercept is needed in the cost function. However, we would not be able to
separately identify the cost intercept and the website-specific preference. So, the term ij in
Equation 1 denotes the composite intercept of consumer i with respect to site j, and represents i's
“net preference” on j. Search cost usually reduces as a consumer gains familiarity with the
website through previous visits and purchases (Li and Kannan 2014), exhibited as reduced time
in finding relevant information and a faster checkout process (Shugan 1980). The dummy term
vij,t-1 indexes lagged visit, indicating whether or not the consumer visited the same website in the
preceding purchase occasion. The term sijt represents the logarithm of the consumer’s cumulative
spending on the website. The term Eijct captures a channel-specific information stock
accumulated through navigating the website in the previous purchase occasions, which is
calculated according to Equation 4. The term gijch denotes the logarithm of the number of pages
viewed on website j coming through channel c in purchase occasion h. We then compute the
channel-specific information stock as the sum of decayed page-views at a monthly discount rate
of λ2, according to the elapsed number of months (mijt-h). When coefficients αv, αs and αc are
negative, their associated variables reduce the cost of visiting the website.
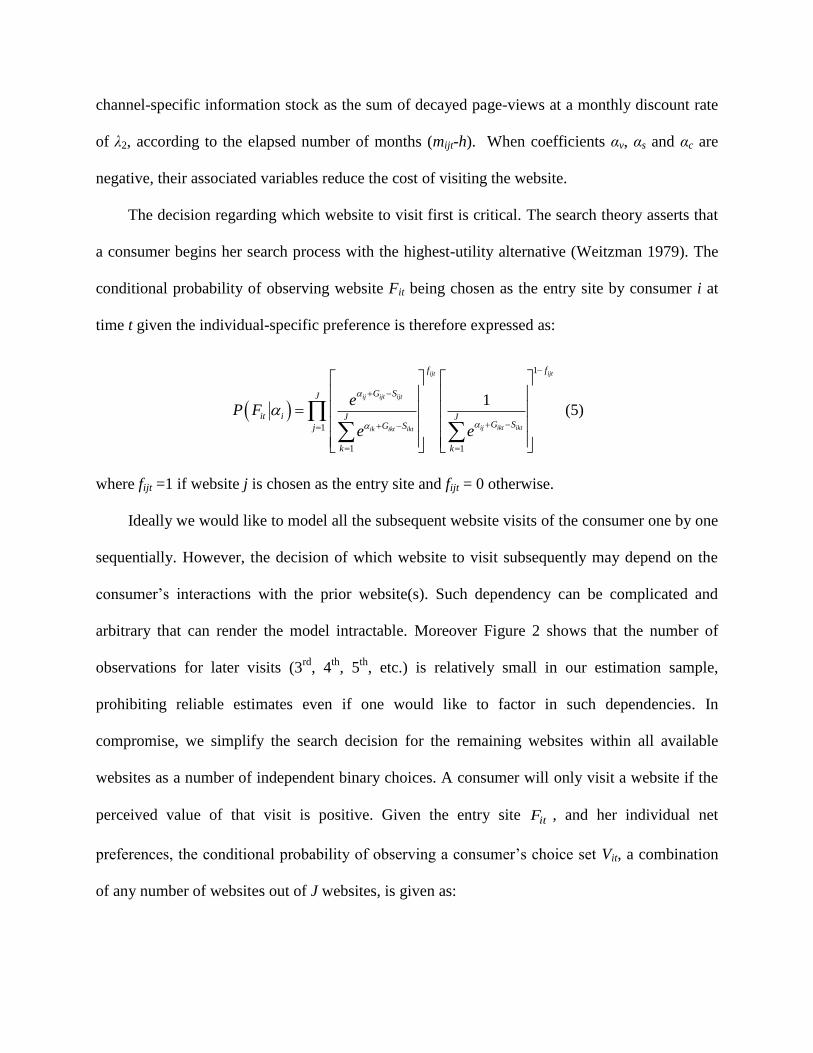
The decision regarding which website to visit first is critical. The search theory asserts that
a consumer begins her search process with the highest-utility alternative (Weitzman 1979). The
conditional probability of observing website Fit being chosen as the entry site by consumer i at
time t given the individual-specific preference is therefore expressed as:
1
1
1 1
1
ijt ijt
ij ijt ijt
ij ikt iktik ikt ikt
f f
G SJ
it i J JG SG Sj
k k
eP F
e e
(5)
where fijt =1 if website j is chosen as the entry site and fijt = 0 otherwise.
Ideally we would like to model all the subsequent website visits of the consumer one by one
sequentially. However, the decision of which website to visit subsequently may depend on the
consumer’s interactions with the prior website(s). Such dependency can be complicated and
arbitrary that can render the model intractable. Moreover Figure 2 shows that the number of
observations for later visits (3rd
, 4th
, 5th
, etc.) is relatively small in our estimation sample,
prohibiting reliable estimates even if one would like to factor in such dependencies. In
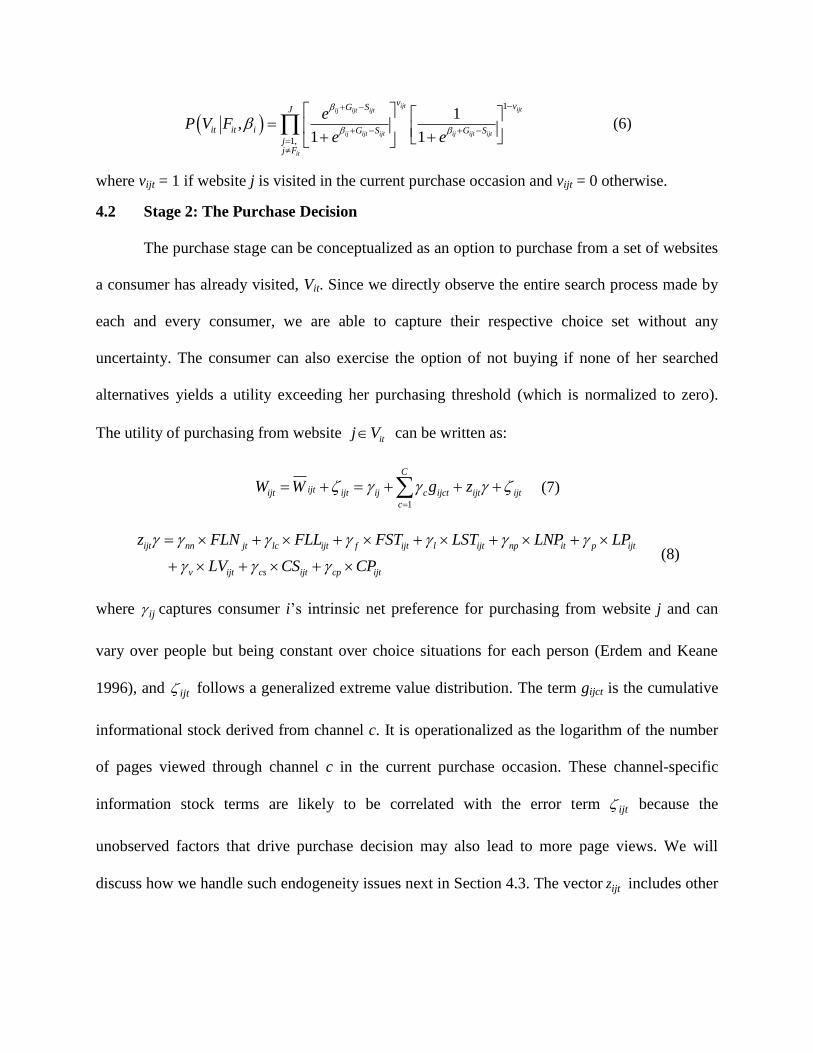
compromise, we simplify the search decision for the remaining websites within all available
websites as a number of independent binary choices. A consumer will only visit a website if the
perceived value of that visit is positive. Given the entry site itF , and her individual net
preferences, the conditional probability of observing a consumer’s choice set Vit, a combination
of any number of websites out of J websites, is given as:
1
1,
1,
1 1
ijtijtij ijt ijt
ij ijt ijt ij ijt ijt
it
v vG SJ
it it i G S G Sjj F
eP V F
e e
(6)
where vijt = 1 if website j is visited in the current purchase occasion and vijt = 0 otherwise.
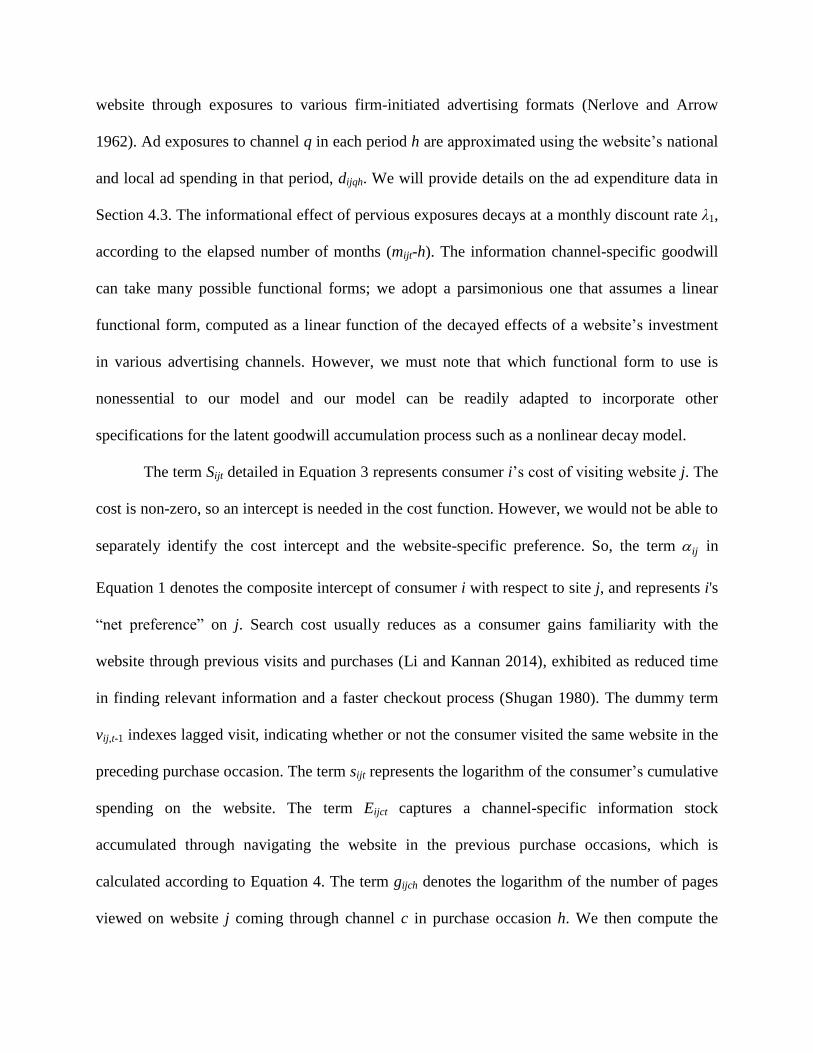
4.2 Stage 2: The Purchase Decision
The purchase stage can be conceptualized as an option to purchase from a set of websites
a consumer has already visited, Vit. Since we directly observe the entire search process made by
each and every consumer, we are able to capture their respective choice set without any
uncertainty. The consumer can also exercise the option of not buying if none of her searched
alternatives yields a utility exceeding her purchasing threshold (which is normalized to zero).
The utility of purchasing from website itj V can be written as:
1
C
ijtijt ijt ij c ijct ijt ijt
c
W W g z
(7)
ijt nn jt lc ijt f ijt l ijt np it p ijt
v ijt cs ijt cp ijt
z FLN FLL FST LST LNP LP
LV CS CP
(8)
where ij captures consumer i’s intrinsic net preference for purchasing from website j and can
vary over people but being constant over choice situations for each person (Erdem and Keane
1996), and ijt follows a generalized extreme value distribution. The term gijct is the cumulative
informational stock derived from channel c. It is operationalized as the logarithm of the number
of pages viewed through channel c in the current purchase occasion. These channel-specific
information stock terms are likely to be correlated with the error term ijt because the
unobserved factors that drive purchase decision may also lead to more page views. We will
discuss how we handle such endogeneity issues next in Section 4.3. The vector ijtz includes other
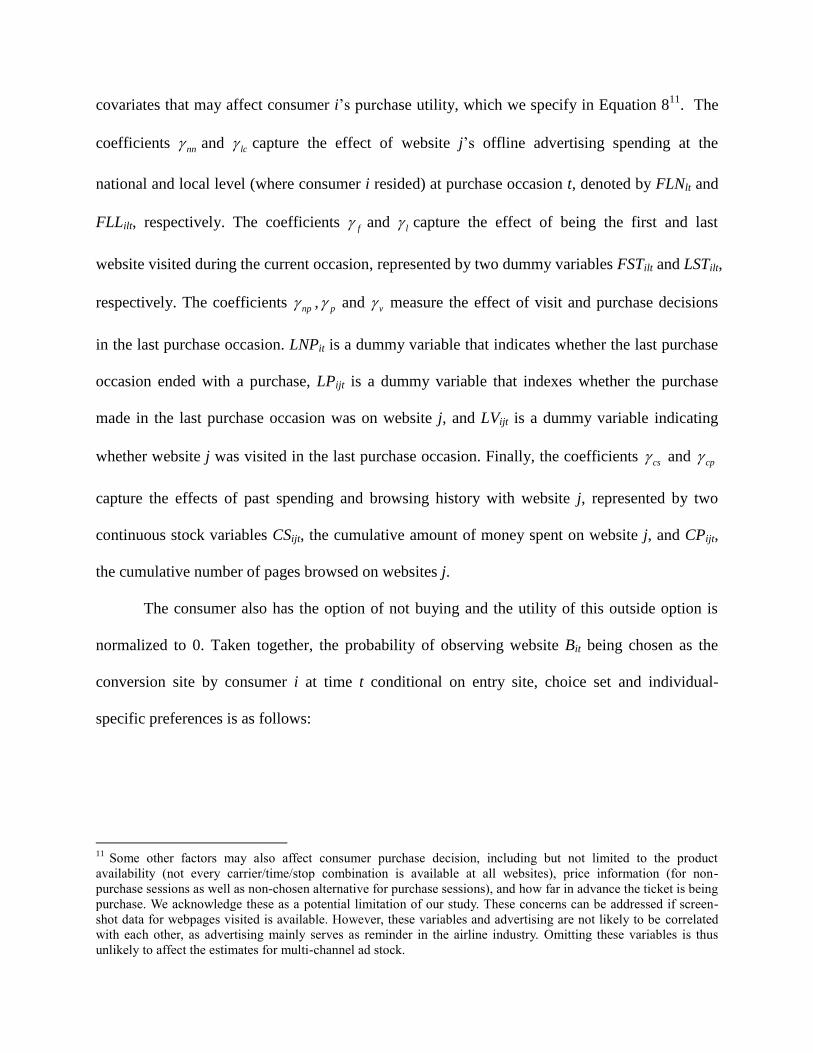
covariates that may affect consumer i’s purchase utility, which we specify in Equation 811
. The
coefficients nn and lc capture the effect of website j’s offline advertising spending at the
national and local level (where consumer i resided) at purchase occasion t, denoted by FLNlt and
FLLilt, respectively. The coefficients f and l capture the effect of being the first and last
website visited during the current occasion, represented by two dummy variables FSTilt and LSTilt,
respectively. The coefficients np , p and v measure the effect of visit and purchase decisions
in the last purchase occasion. LNPit is a dummy variable that indicates whether the last purchase
occasion ended with a purchase, LPijt is a dummy variable that indexes whether the purchase
made in the last purchase occasion was on website j, and LVijt is a dummy variable indicating
whether website j was visited in the last purchase occasion. Finally, the coefficients cs and cp
capture the effects of past spending and browsing history with website j, represented by two
continuous stock variables CSijt, the cumulative amount of money spent on website j, and CPijt,
the cumulative number of pages browsed on websites j.
The consumer also has the option of not buying and the utility of this outside option is
normalized to 0. Taken together, the probability of observing website Bit being chosen as the
conversion site by consumer i at time t conditional on entry site, choice set and individual-
specific preferences is as follows:
11
Some other factors may also affect consumer purchase decision, including but not limited to the product
availability (not every carrier/time/stop combination is available at all websites), price information (for non-
purchase sessions as well as non-chosen alternative for purchase sessions), and how far in advance the ticket is being
purchase. We acknowledge these as a potential limitation of our study. These concerns can be addressed if screen-
shot data for webpages visited is available. However, these variables and advertising are not likely to be correlated
with each other, as advertising mainly serves as reminder in the airline industry. Omitting these variables is thus
unlikely to affect the estimates for multi-channel ad stock.
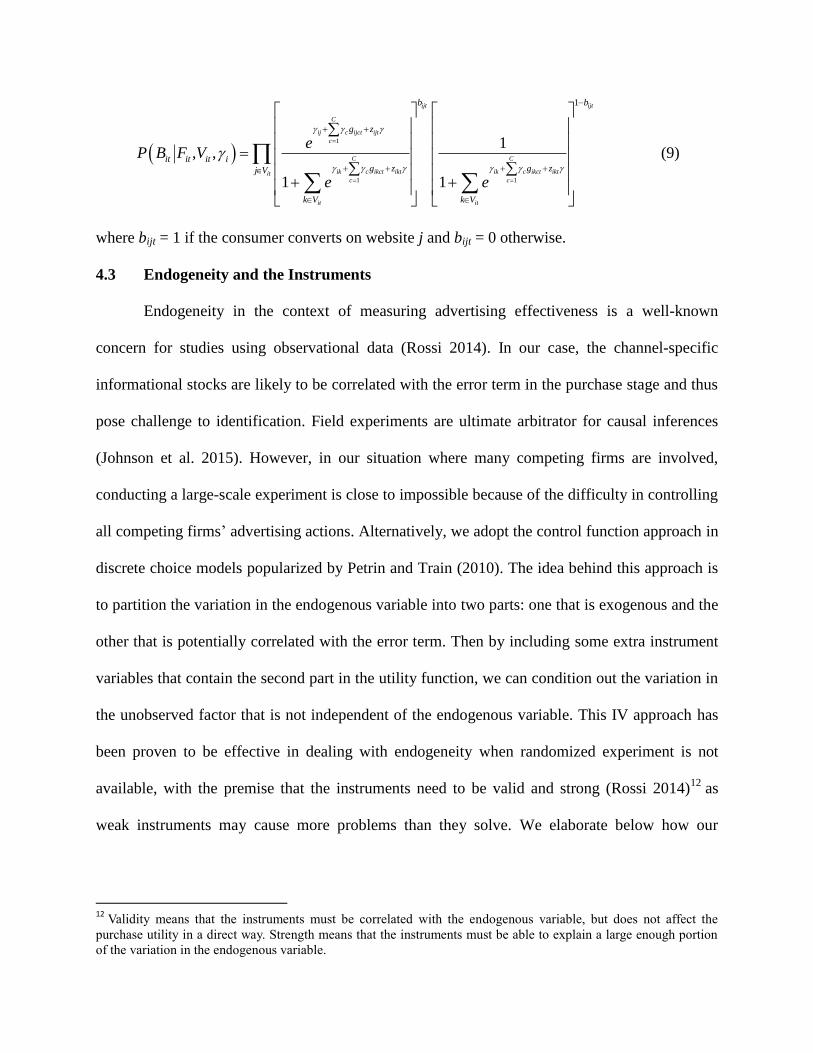
1
1 1
1
1, ,
1 1
ijt ijt
C
ij c ijct ijt
c
C C
ik c ikct ikt ik c ikct iktitc c
it it
b b
g z
it it it ig z g zj V
k V k V
eP B F V
e e
(9)
where bijt = 1 if the consumer converts on website j and bijt = 0 otherwise.
4.3 Endogeneity and the Instruments
Endogeneity in the context of measuring advertising effectiveness is a well-known
concern for studies using observational data (Rossi 2014). In our case, the channel-specific
informational stocks are likely to be correlated with the error term in the purchase stage and thus
pose challenge to identification. Field experiments are ultimate arbitrator for causal inferences
(Johnson et al. 2015). However, in our situation where many competing firms are involved,
conducting a large-scale experiment is close to impossible because of the difficulty in controlling
all competing firms’ advertising actions. Alternatively, we adopt the control function approach in
discrete choice models popularized by Petrin and Train (2010). The idea behind this approach is
to partition the variation in the endogenous variable into two parts: one that is exogenous and the
other that is potentially correlated with the error term. Then by including some extra instrument
variables that contain the second part in the utility function, we can condition out the variation in
the unobserved factor that is not independent of the endogenous variable. This IV approach has
been proven to be effective in dealing with endogeneity when randomized experiment is not
available, with the premise that the instruments need to be valid and strong (Rossi 2014)12
as
weak instruments may cause more problems than they solve. We elaborate below how our
12
Validity means that the instruments must be correlated with the endogenous variable, but does not affect the
purchase utility in a direct way. Strength means that the instruments must be able to explain a large enough portion
of the variation in the endogenous variable.
proposed instruments help mitigate the endogeneity concerns coming from multiple potential
sources.
The first potential source of endogeneity is customer selection, which happens when
these consumers who are exposed to and interact with advertising are systematically different
than the others who are not (Manchanda et al. 2004). This can occur for any marketing channels
in our context, even for the direct channel. For example, consumers who are more loyal to a
website are more likely to accumulate information by visiting the website directly more
frequently than other people and to make purchases on this website eventually. This could also
happen for firm-initiated marketing channels such as search advertising, email campaigns and
display ads if the companies select customers to target for a specific campaign based on certain
information such as past browsing or purchase history, responsiveness to ad campaigns, or
demographics. If this is the case, the estimates for advertising effectiveness will be biased
upward because these selected customers have a higher propensity to convert inherently. The
second potential endogeneity source can arise when the unobserved ad impressions
simultaneously drive advertising click and purchase intention. The third potential endogeneity
source can come from the temporal simultaneity between advertising and unobserved demand
shocks (Zantedeschi et al. 2016). It can happen at both the market level and the individual level.
At the market level, firms may increase advertising spending when there is an external demand
shock unobservable to researchers. As a result, consumers are exposed to more ads leading to
simultaneous increases both in terms of ad clicks and purchases. The individual level demand
shock can occur due to factors such as a sudden change in her income, a large bonus etc.
We devised several instrument variables to alleviate the aforementioned endogeneity
concerns. We first construct an instrument variable using the consumer’s lagged channel-specific
information stock. We expect the cost of visiting through a specific channel to decrease with
information stock accumulated through the channel in the past, and thus, the consumer may visit
the website and accumulate more information through the same channel in the current purchase
occasion as well. However, this lagged variable should not be systematically co-determined by
the future purchase intention.
We further acquired an external data source from the Kantar Media Database (KMD) to
address endogeneity. This database tracks all the companies in our analysis on their monthly
spending on offline advertising channels including TV, newspaper and radio, as well as two
major online advertising channels, search advertising and display ads at both the national and
local DMA (Designated Market Area) level. This supply-side ad data enables us to directly
control ad impression. The ad spending reflects potential unobserved demand shocks and
inclusion of ad spending would directly control for the increase in ad impression due to
unobserved random shocks.
We then construct several additional instrument variables using the KMD data. For each
firm in a DMA in a month, we compute its competitors’ online ad spending on the focal channel
(search engine and display/referral) and use this as the IV. Exogeneity of this IV is warranted
because it is hard to imagine that competitors would adjust their ad spending according to the
searching and purchasing behavior of the focal firm’s consumers observed in our data.
Furthermore, when a random demand shock occurs, it is reasonable to expect all other
competitors to respond by adjusting their ad spending accordingly, but this activity should not be
systematically co-determined by the consumer’s purchase utility on our focal website.
At the individual level, a consumer may increase the likelihood to click on ads (e.g. to
seek deal information actively) and purchase simultaneously due to a random personal shock, e.g.

due to a windfall or a sudden increase in income. To control for this type of possibility, we use
each individual’s number of clicks on ads of the same channel for other product categories (car
rental and hotel) as instrument. We argue that when random personal shock occurs (e.g. income
increases), the consumer’s interest in ads for other product categories also changes, but this
should not be directly affected by her purchase intention on the focal product category.
4.4 Likelihood Function
Overall, the joint likelihood function in Equation 10 takes into account the selection of
entry site, the formation of the choice set, and purchase decision. It is conditional on the
individual-specific preferences for various websites in the two stages. We assume the individual
website-specific intercepts αij, βij, γij follow a normal distribution specified below:
,
jij
ij jj
jij
N
, where j = 1, 2, …, J
j is the variance-covariance matrix for the website-specific intercepts. We assume that the
correlation between intercepts of different stages remains the same across websites, but allow the
variance of each intercept to vary by website and stage to reduce the number of parameters to be
estimated13
. We estimated the model using the Simulated Maximum Likelihood approach. The
details for the estimation procedure are provided in Appendix A.
1 1
, , ,iTN
it i it it i it it it i
i t
L B P F j P V F P B F V
(10)
5. Model Results
5.1 Stage 1: The Website Visit Decision
13
Due to dimensionality concern, we do not allow for correlation across websites, such as allowing intercepts for
expedia.com to be correlated with intercepts for orbitz.com, to maintain model tractability.

Table 5 presents parameter estimates for the first stage in the purchase funnel - website visit
decision. This stage is composed of two sub-decisions: 1) choosing an entry site from the full
choice set of all relevant websites, and 2) deciding whether or not to visit other remaining
websites. The estimates for the choice of entry site are presented in the first column of Table 5.
We observe that Delta.com and Cheaptickets.com are more likely to be chosen as the entry site
compared to the other alternatives, all else being equal. We also find that there is a significant
variation in preference for the same website across consumers for all websites except United.com
and Cheaptickets.com. The coefficients for cumulative ad spending on offline channels at both
the national level and the local DMA level are positive and significant, indicating that offline
advertising is still important in generating awareness and goodwill for online consumers.
Cumulative ad spending on the local-level display ads also significantly increase the website’s
likelihood of being chosen as the entry site, but the effects of ad spending on the national-level
display ads and search ads are not significant. This reflects the difficulty of converting ad
spending into exposure, even more so at the national level.
Our results show that the coefficients for lag visit, cumulative amount of money spent on the
website and channel-specific lag information stock are all negative and significant, indicating
that they can increase visit utility by reducing search costs. These results are not surprising as
they suggest that the more experience a consumer accumulates with a website, the more likely
she will choose it to be the entry site. The cognitive lock-in effects explain it well (Johnson et al.
2003). When the amount of experience with the website increases via repeated visits and
purchases, the consumer becomes locked in due to the reduction in costs associated with
navigating or understanding the website.
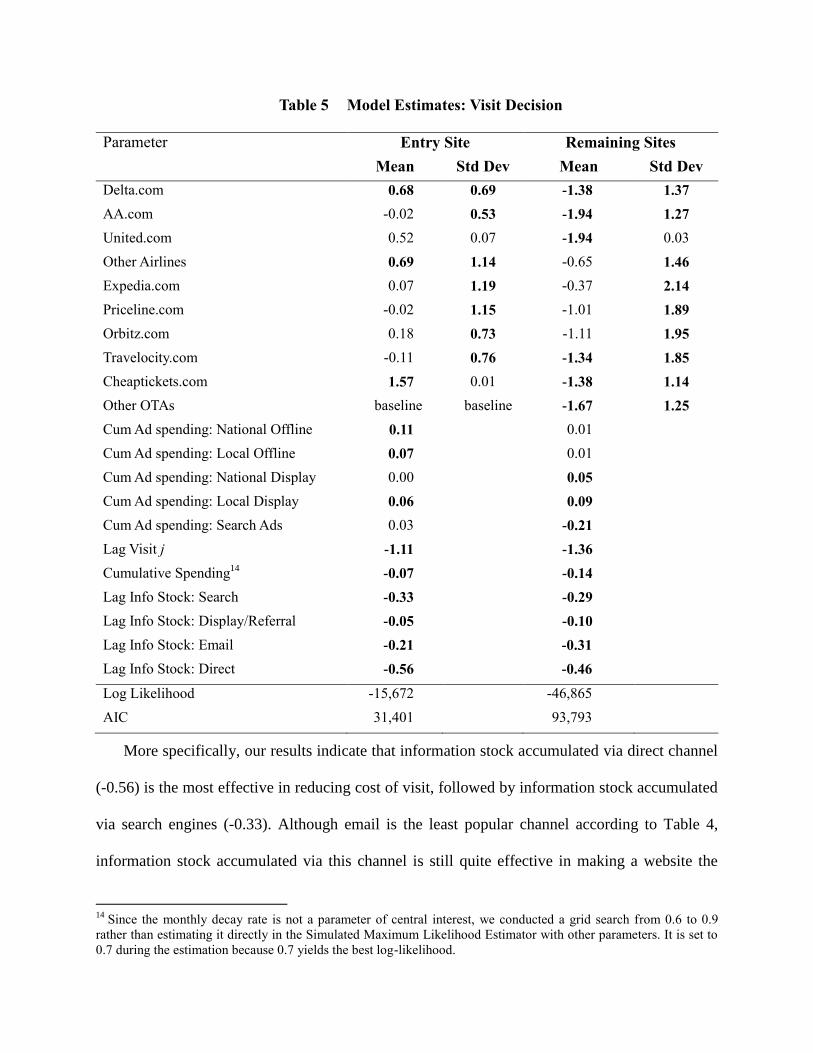
Table 5 Model Estimates: Visit Decision
Parameter Entry Site Remaining Sites
Mean Std Dev Mean Std Dev
Delta.com 0.68 0.69 -1.38 1.37
AA.com -0.02 0.53 -1.94 1.27
United.com 0.52 0.07 -1.94 0.03
Other Airlines 0.69 1.14 -0.65 1.46
Expedia.com 0.07 1.19 -0.37 2.14
Priceline.com -0.02 1.15 -1.01 1.89
Orbitz.com 0.18 0.73 -1.11 1.95
Travelocity.com -0.11 0.76 -1.34 1.85
Cheaptickets.com 1.57 0.01 -1.38 1.14
Other OTAs baseline baseline -1.67 1.25
Cum Ad spending: National Offline 0.11 0.01
Cum Ad spending: Local Offline 0.07 0.01
Cum Ad spending: National Display 0.00 0.05
Cum Ad spending: Local Display 0.06 0.09
Cum Ad spending: Search Ads 0.03 -0.21
Lag Visit j -1.11 -1.36
Cumulative Spending14
-0.07 -0.14
Lag Info Stock: Search -0.33 -0.29
Lag Info Stock: Display/Referral -0.05 -0.10
Lag Info Stock: Email -0.21 -0.31
Lag Info Stock: Direct -0.56 -0.46
Log Likelihood -15,672 -46,865
AIC 31,401 93,793
More specifically, our results indicate that information stock accumulated via direct channel
(-0.56) is the most effective in reducing cost of visit, followed by information stock accumulated
via search engines (-0.33). Although email is the least popular channel according to Table 4,
information stock accumulated via this channel is still quite effective in making a website the
14
Since the monthly decay rate is not a parameter of central interest, we conducted a grid search from 0.6 to 0.9
rather than estimating it directly in the Simulated Maximum Likelihood Estimator with other parameters. It is set to
0.7 during the estimation because 0.7 yields the best log-likelihood.
entry site. This could be due to the fact that email subscribers are more loyal to the website
compared to those who visit the website via display ads or referral engines. Our result indicates
that e-mail is more effective than display ads or referral engines in influencing consumers to
choose a website to enter.
Next, we discuss the estimation results for the visit decision beyond the entry site. The
estimates for website-specific intercepts represent individual consumers’ net preference for
visiting the website. In general consumers have a low probability of visiting other websites
beyond the entry site, and this is particularly true for the airline companies’ own online booking
websites and small OTAs. Again, we observe significant variations across individuals in their
preferences for visiting a website (standard deviations are statistically significant varying from
1.14 to 2.14, except for United.com). Offline channel spending does not significantly influence
consumers’ decisions to visit the remaining websites. The coefficients for lag visit, cumulative
amount of money spent on the website and channel-specific lag information stock are found to
be significant and negative, indicating that they can lead to lower search costs. Direct channel (-
0.46) turns out to be the most effective channel in enticing consumers to visit beyond the entry
site, followed by email (-0.31) and search ads (-0.29).
5.2 Stage 2: Purchase Decision
5.2.1 Control Function Results
We first report the first stage regression results in Table 6, which details the effects of the
instruments on the information stock for the four channels (the endogenous variables). The R-
squares of these four regression models (ranging from 0.76 to 0.91) are high, indicating that our
instruments explain a great deal of variations in the endogenous variables. We then employ the J-
statistic of Hansen (1982) to test exogeneity of these instruments. The statistic is distributed as
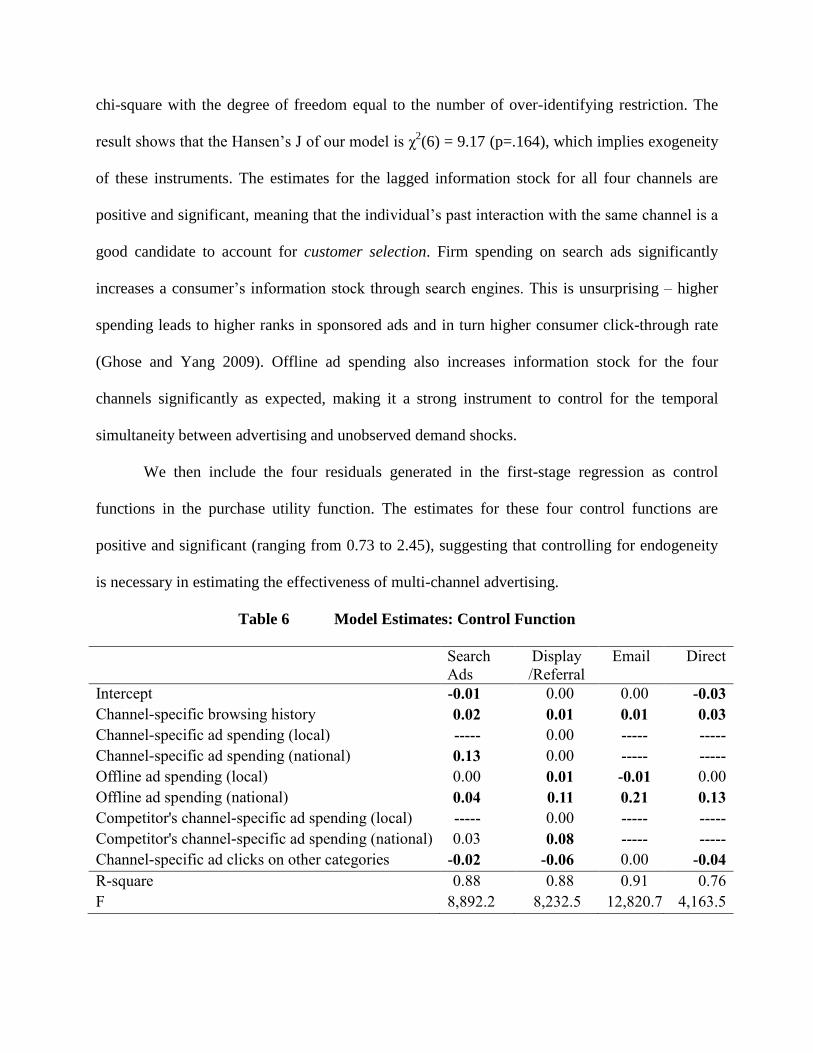
chi-square with the degree of freedom equal to the number of over-identifying restriction. The
result shows that the Hansen’s J of our model is χ2(6) = 9.17 (p=.164), which implies exogeneity
of these instruments. The estimates for the lagged information stock for all four channels are
positive and significant, meaning that the individual’s past interaction with the same channel is a
good candidate to account for customer selection. Firm spending on search ads significantly
increases a consumer’s information stock through search engines. This is unsurprising – higher
spending leads to higher ranks in sponsored ads and in turn higher consumer click-through rate
(Ghose and Yang 2009). Offline ad spending also increases information stock for the four
channels significantly as expected, making it a strong instrument to control for the temporal
simultaneity between advertising and unobserved demand shocks.
We then include the four residuals generated in the first-stage regression as control
functions in the purchase utility function. The estimates for these four control functions are
positive and significant (ranging from 0.73 to 2.45), suggesting that controlling for endogeneity
is necessary in estimating the effectiveness of multi-channel advertising.
Table 6 Model Estimates: Control Function
Search
Ads
Display
/Referral
Email Direct
Intercept -0.01 0.00 0.00 -0.03
Channel-specific browsing history 0.02 0.01 0.01 0.03
Channel-specific ad spending (local) ----- 0.00 ----- -----
Channel-specific ad spending (national) 0.13 0.00 ----- -----
Offline ad spending (local) 0.00 0.01 -0.01 0.00
Offline ad spending (national) 0.04 0.11 0.21 0.13
Competitor's channel-specific ad spending (local) ----- 0.00 ----- -----
Competitor's channel-specific ad spending (national) 0.03 0.08 ----- -----
Channel-specific ad clicks on other categories -0.02 -0.06 0.00 -0.04
R-square 0.88 0.88 0.91 0.76
F 8,892.2 8,232.5 12,820.7 4,163.5
5.2.2 Model Estimates for Purchase Decision
We present the parameter estimates for the purchase decision of our proposed model in
the first and second columns of Table 7. First, we notice that among all the competing websites,
Cheapticket.com, being a relatively niche OTA, is most preferred conditional on it being
searched. Its net preference is the least negative (baseline is the no purchase option). Among the
airlines’ official websites, United.com is the most preferred. This indicates that once the
consumers have visited United.com, their conversion rate is higher compared to other airline
websites, everything else being equal. There is significant variation in these website-specific
intercepts, indicating high level of heterogeneity across consumers in their preferences for these
websites.
The coefficients for the information stocks gained from all four channels are positive and
significant, suggesting that all advertising channels are important in generating sales. However,
among the four channels, the direct channel (0.56) is the most effective, followed by search ads
(0.41) and email ads (0.39). We discuss the implications of these estimates in detail using
marginal impact analysis in the next section.
We find that the sequence in website visits also matters. Being either the first or the last
website visited during the visit stage significantly increases conversion probability compared to
those visited in-between. This finding shows that while consumers usually start with their
favorable website, they are also likely to convert on the last-visited website. In addition, we find
that consumers exhibit strong inertia when making online purchases. A prior online flight
purchase increases the likelihood of a current purchase, especially if the prior purchase is made
on the same website. And the more money a consumer has spent on booking flights at a website
in the past, the higher her conversion probability will be at the website. Lag visit also increases
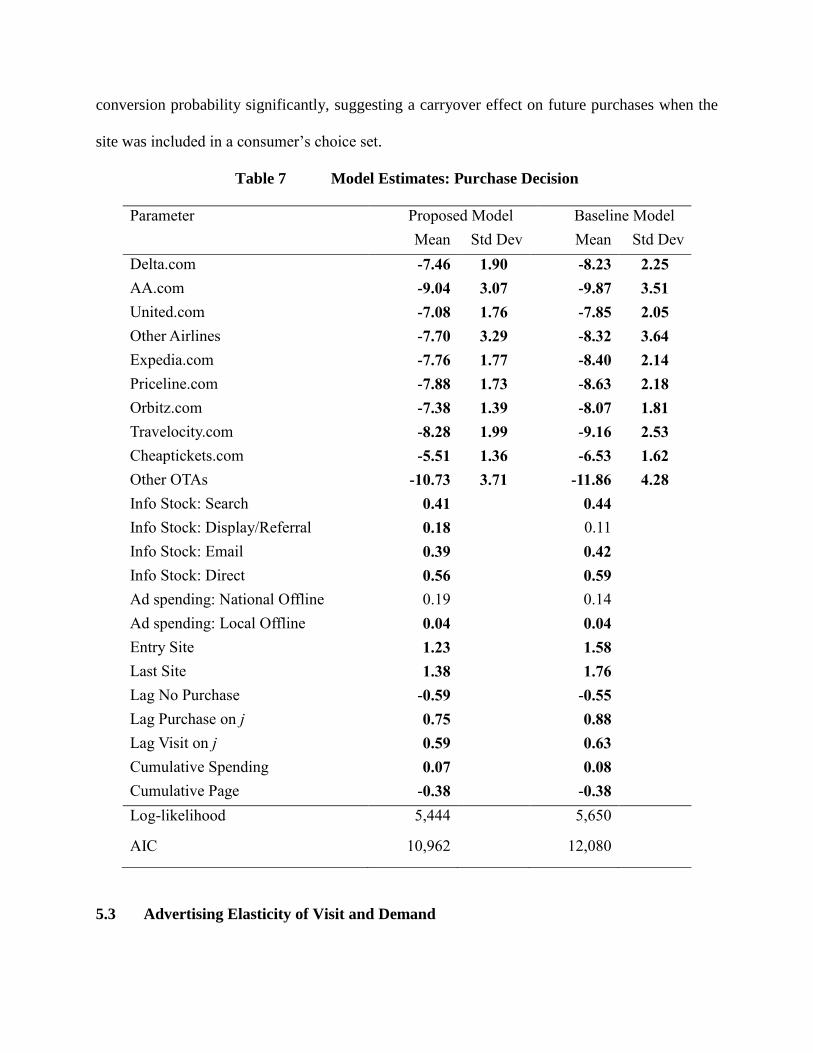
conversion probability significantly, suggesting a carryover effect on future purchases when the
site was included in a consumer’s choice set.
Table 7 Model Estimates: Purchase Decision
Parameter Proposed Model Baseline Model
Mean Std Dev Mean Std Dev
Delta.com -7.46 1.90 -8.23 2.25
AA.com -9.04 3.07 -9.87 3.51
United.com -7.08 1.76 -7.85 2.05
Other Airlines -7.70 3.29 -8.32 3.64
Expedia.com -7.76 1.77 -8.40 2.14
Priceline.com -7.88 1.73 -8.63 2.18
Orbitz.com -7.38 1.39 -8.07 1.81
Travelocity.com -8.28 1.99 -9.16 2.53
Cheaptickets.com -5.51 1.36 -6.53 1.62
Other OTAs -10.73 3.71 -11.86 4.28
Info Stock: Search 0.41 0.44
Info Stock: Display/Referral 0.18 0.11
Info Stock: Email 0.39 0.42
Info Stock: Direct 0.56 0.59
Ad spending: National Offline 0.19 0.14
Ad spending: Local Offline 0.04 0.04
Entry Site 1.23 1.58
Last Site 1.38 1.76
Lag No Purchase -0.59 -0.55
Lag Purchase on j 0.75 0.88
Lag Visit on j 0.59 0.63
Cumulative Spending 0.07 0.08
Cumulative Page -0.38 -0.38
Log-likelihood 5,444 5,650
AIC 10,962 12,080
5.3 Advertising Elasticity of Visit and Demand

While parameter estimates show the relative significance of different channels, it is often
more informative to know the extent to which visit and purchase probabilities change in response
to a change in information stock. We quantify the impact of information stock of different
channels on visit and purchase probability using a marginal impact analysis. The marginal
impact is measured as the change in visit and purchase probabilities for each website given a
change of the same magnitude in information stock collected through a specific channel for a
specific website. For example, a marginal impact analysis can inform us how probabilities of
being chosen as the entry site change for each website if a consumer has collected more
information about Expedia.com by browsing more webpages under the influence of search
advertising in the past. This marginal impact analysis therefore enables us to compare the effects
of ad stock for the same website across different channels and for the same channel across
different websites.
We need to simulate the change in choice probabilities because the net preferences for
different websites are heterogeneous across consumers and are drawn from a normal distribution.
The simulation follows six steps, which is explained in detail in Appendix B. The resulting
average changes across consumers for the choice of entry site, visit probability of remaining
websites, and purchase probability of visited websites are reported in Table 8 to 10.
Table 8 tabulates the own- and cross-impacts on the entry site choice as a result of 10
additional pages of a focal site browsed in the last month through additional ad clicks resulted
from the four different channels. The own marginal impacts show that in general information
stock collected through direct channel is most effective in raising the probability of being chosen
as the entry website, followed closely by search ads. Display/referral ads and email ads also
increase the choice probability but the effect is small compared to the other two channels. Every

website sees a boost in choice probability due to additional information stock, but this effect size
varies significantly across websites. Ad stock is most effective for Expedia.com. For example,
increased information stock through search ads due to 10 more pages browsed can increase
Expedia.com’s probability of being chosen as the entry site by 5.86%, but the same amount of
change in information stock only increases United.com’s choice probability by 1.77%.
[Insert Table 8 Here]
The off-diagonal entries of Table 8 show the cross-impact of change in information stock
for the website in the row on choice probability for the website in the column. This effect size
varies by channels. For example, if the consumer reaches Expedia.com through search engine,
Priceline.com’s probability of being chosen as the entry site will decrease by 0.76%. However,
the same probability will only decrease by 0.12% under the influence of display/referral ads.
Table 9 shows the changes in visit probability given an increase in information stock
through different channels by websites. Again, information stock collected through direct
channel is most valuable in driving up the visit probability. However, information stock gathered
through email ads is also very effective, compared to search ads and display/referral ads. For
example, for AA.com, if the consumer browsed 10 more webpages in the last month through
email ad, the probability that she will visit the website in this purchase occasion increases by
7.54%, more than triple the change in visit probability as a result of display/referral ads. Across
websites, Expedia.com is most sensitive to the change in information stock through a channel,
followed by other airlines’ direct websites, Priceline.com and Orbitz.com.
[Insert Table 9 Here]
Table 10 tabulates the change in purchase probabilities for every website as a result of 10
more pages browsed through additional ad clicks resulted from different channels on a focal
website. The diagonal entries record the own-marginal impacts for each website. In general
email ads have a greater impact on conversion probability than any other advertising formats.
For example, the change in information stock gathered through email ads increases conversion
probability by 4.16% for expedia.com, higher than the 3.23% increase due to more information
stock through search ads or 1.79% increase due to more information stock through
display/referral ads. While the high effectiveness of search engine advertising or direct visits is
expected because they are consumer-initiated, the larger impact of email ads might be attributed
to the higher level of consumer loyalty. Consumers who subscribed to a website’s email list are
often more loyal than those who are not, so they may also become more responsive to email
campaigns. Moreover, if a consumer happens to receive an email ad when she has a purchase
need, the coincidence will also increase her purchase probability on the website.
[Insert Table 10 Here]
However, even though every website enjoys a boost in conversion probability due to
additional ad clicks, this effect size is not uniform across websites. Advertising is most effective
for Expedia.com, Orbitz.com, but has barely any impact on small OTAs’ conversion probability.
The disparate effectiveness of the same advertising channel across competitors suggests the
importance of ad content and message strategies. Firms can use these figures as the starting point
toward a diagnostic process to improve its own ad messaging and copy strategies. By
benchmarking its own ad effectiveness with a competitor’s, a firm can determine its standing
among the competitive pack.
The off-diagonal entries in Table 10 show the cross-marginal impacts of advertising on
competitors’ conversion probabilities. Each off-diagonal entry in Table 10 indicates the change in
conversion probability for the column website due to more information stock on the row website.
Increasing information stock draws disproportionately from the website’s competitors. For
example, an increase in information stock gathered through email ads for Expedia.com will
decrease the purchase probability for Priceline.com, Orbitz.com and Travelocity.com by more
than 0.33%, but will only decrease the purchase probabilities for the other websites by less than
0.2%. This indicates that the competition between these OTAS is more intense. Moreover, the
cross-impact of ad stock varies across channels. For example, an increase in information stock
through Expedia.com’s email ads (-0.33%) imposes greater damage versus an increase in
information stock through its search ads (-0.25%) to the conversion probability of Oritz.com.
6. Predictive Analysis and Comparisons
In order to demonstrate the importance and necessity of modeling competition between
firms, we compare our competitive analytics approach with a baseline model. The baseline
model mimics the scenario where the company only knows its customers’ interactions with itself,
but not with their competitors. In this case, a consumer’s purchase decision is modeled as a
binary choice between buying and not buying on a visited website (in contrast to a multinomial
choice from all the visited websites in the proposed model). Our comparison is carried out on the
purchase stage with a focus on their predictive performances in terms of predicting purchases in
the out-of-sample.
We first present the parameter estimates and in-sample model fit statistics of the baseline
model in the third and fourth columns of Table 7. It is clear that our proposed model outperforms
the baseline model in terms of model fitness as measured by the log-likelihood and the AIC
criterion.
We then compare the predictive performance of these two models on a holdout sample.
The holdout sample is composed of 3,576 purchase occasions made by the same group of
consumers for a three month period between October 2010 and December 2010. Each consumer
on average visited 2.41 websites in a purchase occasion, and 950 out of these 3,576 occasions
ended up with a purchase, consistent with our estimation sample. The predicted purchase
probability is simulated using the same method described in Appendix B.
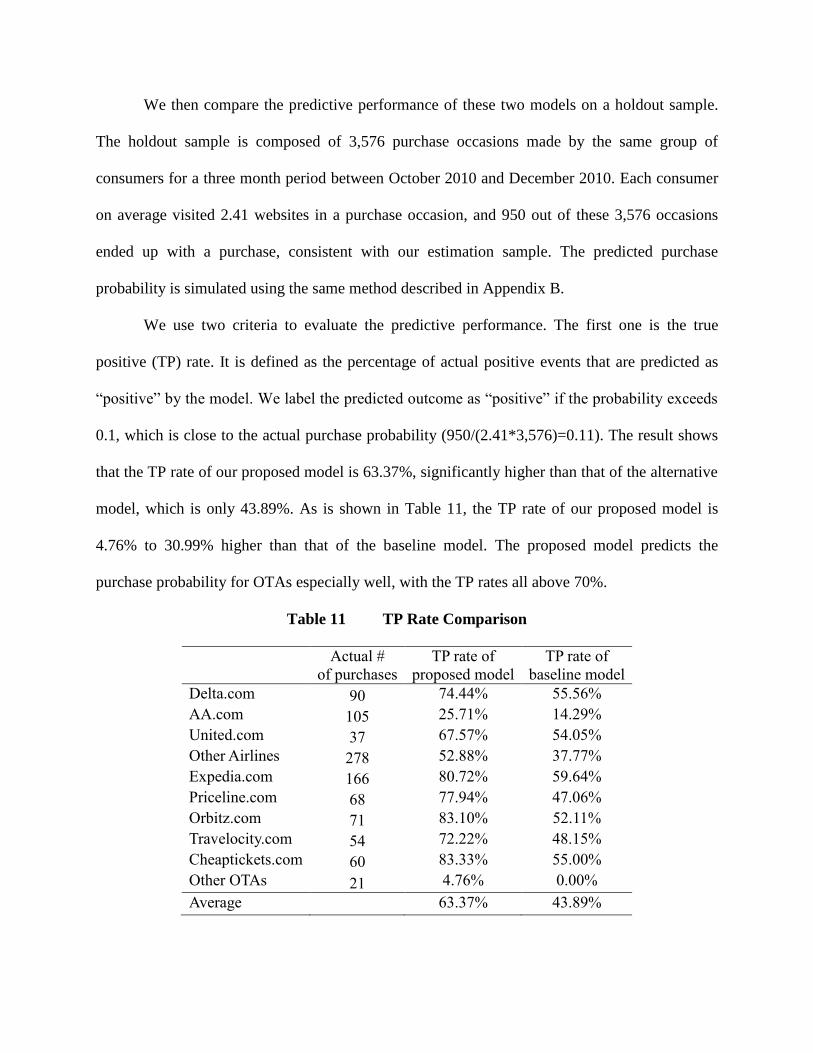
We use two criteria to evaluate the predictive performance. The first one is the true
positive (TP) rate. It is defined as the percentage of actual positive events that are predicted as
“positive” by the model. We label the predicted outcome as “positive” if the probability exceeds
0.1, which is close to the actual purchase probability (950/(2.41*3,576)=0.11). The result shows
that the TP rate of our proposed model is 63.37%, significantly higher than that of the alternative
model, which is only 43.89%. As is shown in Table 11, the TP rate of our proposed model is
4.76% to 30.99% higher than that of the baseline model. The proposed model predicts the
purchase probability for OTAs especially well, with the TP rates all above 70%.
Table 11 TP Rate Comparison
Actual #
of purchases
TP rate of
proposed model
TP rate of
baseline model
Delta.com 90 74.44% 55.56%
AA.com 105 25.71% 14.29%
United.com 37 67.57% 54.05%
Other Airlines 278 52.88% 37.77%
Expedia.com 166 80.72% 59.64%
Priceline.com 68 77.94% 47.06%
Orbitz.com 71 83.10% 52.11%
Travelocity.com 54 72.22% 48.15%
Cheaptickets.com 60 83.33% 55.00%
Other OTAs 21 4.76% 0.00%
Average 63.37% 43.89%
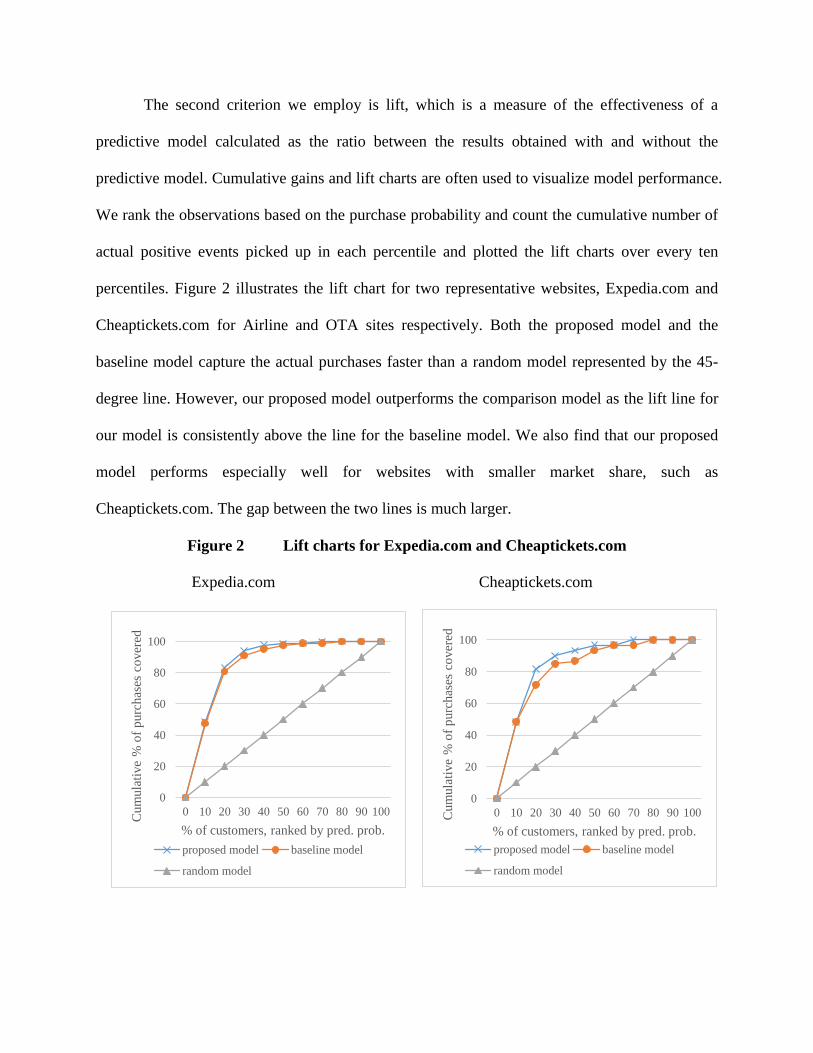
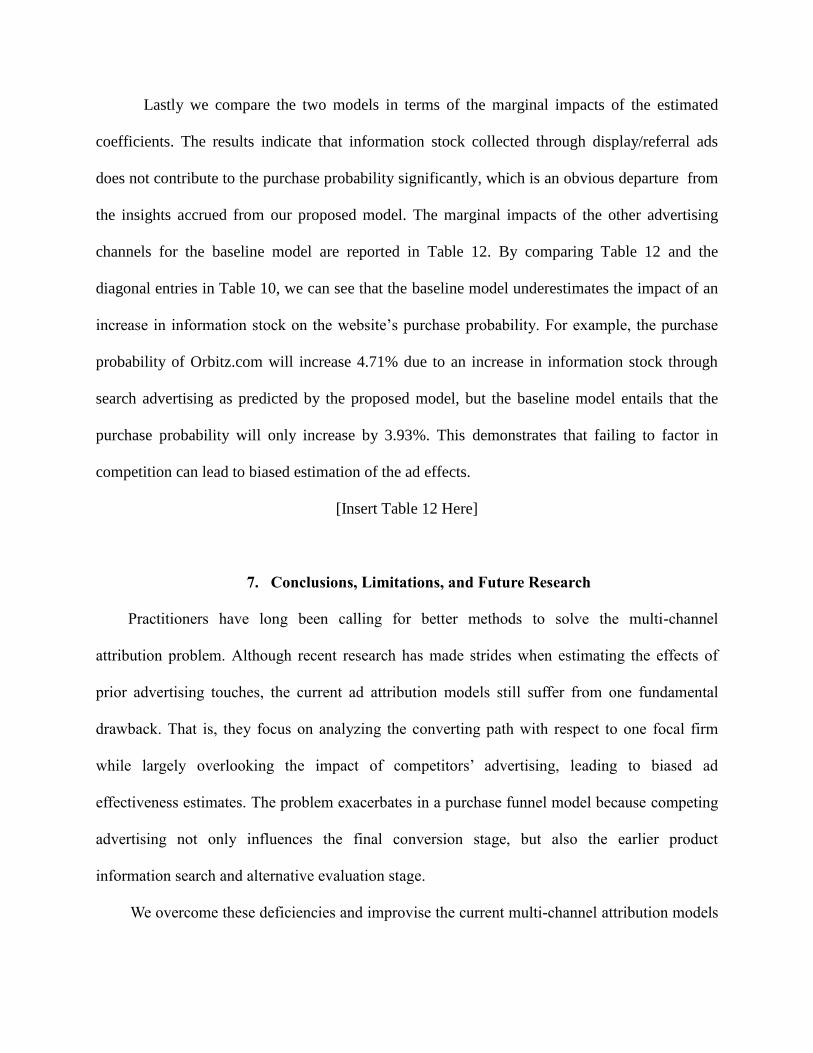
The second criterion we employ is lift, which is a measure of the effectiveness of a
predictive model calculated as the ratio between the results obtained with and without the
predictive model. Cumulative gains and lift charts are often used to visualize model performance.
We rank the observations based on the purchase probability and count the cumulative number of
actual positive events picked up in each percentile and plotted the lift charts over every ten
percentiles. Figure 2 illustrates the lift chart for two representative websites, Expedia.com and
Cheaptickets.com for Airline and OTA sites respectively. Both the proposed model and the
baseline model capture the actual purchases faster than a random model represented by the 45-
degree line. However, our proposed model outperforms the comparison model as the lift line for
our model is consistently above the line for the baseline model. We also find that our proposed
model performs especially well for websites with smaller market share, such as
Cheaptickets.com. The gap between the two lines is much larger.
Figure 2 Lift charts for Expedia.com and Cheaptickets.com
Expedia.com Cheaptickets.com
0
20
40
60
80
100
0 10 20 30 40 50 60 70 80 90 100
Cum
ula
tive
% o
f p
urc
has
es c
over
ed
% of customers, ranked by pred. prob.
proposed model baseline model
random model
0
20
40
60
80
100
0 10 20 30 40 50 60 70 80 90 100Cum
ula
tive
% o
f p
urc
has
es c
over
ed
% of customers, ranked by pred. prob.
proposed model baseline model
random model
Lastly we compare the two models in terms of the marginal impacts of the estimated
coefficients. The results indicate that information stock collected through display/referral ads
does not contribute to the purchase probability significantly, which is an obvious departure from
the insights accrued from our proposed model. The marginal impacts of the other advertising
channels for the baseline model are reported in Table 12. By comparing Table 12 and the
diagonal entries in Table 10, we can see that the baseline model underestimates the impact of an
increase in information stock on the website’s purchase probability. For example, the purchase
probability of Orbitz.com will increase 4.71% due to an increase in information stock through
search advertising as predicted by the proposed model, but the baseline model entails that the
purchase probability will only increase by 3.93%. This demonstrates that failing to factor in
competition can lead to biased estimation of the ad effects.
[Insert Table 12 Here]
7. Conclusions, Limitations, and Future Research
Practitioners have long been calling for better methods to solve the multi-channel
attribution problem. Although recent research has made strides when estimating the effects of
prior advertising touches, the current ad attribution models still suffer from one fundamental
drawback. That is, they focus on analyzing the converting path with respect to one focal firm
while largely overlooking the impact of competitors’ advertising, leading to biased ad
effectiveness estimates. The problem exacerbates in a purchase funnel model because competing
advertising not only influences the final conversion stage, but also the earlier product
information search and alternative evaluation stage.
We overcome these deficiencies and improvise the current multi-channel attribution models
by accounting for competition in a consumer’s purchase funnel, estimating both the direct and
indirect effect of ad-clicks prior to conversion. Specifically, we develop an integrated multi-stage
choice model in order to measure the advertising effectiveness on a consumer’s online search
and purchase decisions in a multi-channel, multi-touch-point, multi-competitor environment
using individual-level advertising response data. Our model considers: (1) consumer choice of
entry site, (2) consumer search decisions concerning the remaining websites that compete in the
same industry and (3) subsequent purchases at one of the websites searched. We estimate this
model on a unique panel data set covering both search and purchase decisions across multiple
websites in the online air ticket booking industry. We then use these parameter estimates to
compute the direct and indirect marginal impacts of online advertising channels and predict a
consumer’s future purchasing behavior based on observed variables. We further compare our
proposed competition-centric model against a baseline model using data from a single-firm only.
Our model outperforms the baseline model in terms of in-sample model fit as well as out-of-
sample predictive performance, necessitating modeling competition in multichannel ad
attribution.
Our findings offer managers new insights for evaluating advertising effectiveness. First, we
find that in the online air travel industry, information stock collected through search advertising
is the most effective ad format in increasing the visit probability. This is consistent with the
findings in the prior literature that search ads are the most important channel under all attribution
methodologies (Abhishek et al. 2014). The finding also echoes the industry belief that search
engine ads are the king of online advertising. However, our result regarding the strong direct
effect of email ads is contrary to the conventional belief that email ads are less useful in sealing
the deal. This difference demonstrates the strength of our approach because we consider the
entire purchase journey and reward all ad clicks prior to conversion, whereas most rule-based
models adopted by practitioners only assign weights to touches that directly lead to a purchase;
such approaches under-estimate the effect of assisting touches prior to purchase.
Second, we are able to quantify the channel- and stage-specific marginal ad impacts based
on our model estimates. Some websites may find that advertising has small effect on improving
its conversion probability directly, but this may not be the case for its competitors. These
websites should accordingly benchmark against their competitors and focus more on ad designs.
For example, firms may need to choose better keywords and improve their search ad rankings;
they may also make display ads more attractive by matching the webpage content or targeting
more interested online users. We also find that ad clicks through a specific channel can have
either a direct impact on the conversion probability, an indirect impact through its influence on
consumers’ search decisions during the next purchase session, or both. Additional information
stock accrued through a specific channel may still be beneficial because they increase the
likelihood of these websites being included in the consumer’s consideration set during the next
purchase session and indirectly increase the future conversion probability, even if they have a
small effect in leading to a higher direct conversion. Firms must consider both the direct and
indirect effects of advertising when allocating their budgets.
Multi-channel attribution is a rapidly growing new research area and many aspects await
future investigation. Our model spawns at least five interesting directions for further
investigation. First, one of the main limitations of our research is that we do not observe the
content of webpages visited by the consumers. If page content data is available, future research
can take advantage of such data by incorporating product attribute information such as prices and
product features into ad attribution models. Second, since we do not observe consumers’ ad
exposure in our data we cannot model their click-through decisions. It will be a very interesting
extension to further model consumers’ ad click decisions together with their purchase funnel
decisions. Third, another limitation of our estimation sample is that the data was collected in
2010 and several popular ad channels firms in use today were not as developed at the time. This
model can therefore be readily extended to incorporate the effects of more recent ad channels
such as social media, mobile ads, etc. Fourth, marketing practitioners are particularly interested
in determining how online and offline advertising interact, as well as the spillover effect of
online advertising on offline sales and vice versa. Future research may answer this question by
incorporating offline advertising and purchase decisions into the model. Finally, our model can
be applied to other product categories in order to test these findings regarding the direct and
indirect effects of advertising. Different industries have their own characteristics and may differ
widely in channels they employ to reach out to customers.
Reference
Abhishek, V., Fader, P. S. and Hosanagar, K. (2014), “Media Exposure through the Funnel: A
Model of Multi-Stage Attribution,” working paper, Carnegie Mellon University, Pittsburgh
Agarwal, A., Hosanagar, K., and Smith, M. D. (2011), “Location, Location, Location: An
Analysis of Profitability and Position in Online Advertising Markets,” Journal of Marketing
Research, 48(6):1057-1073.
Agarwal, A., Hosanagar, K., and Smith, M. D. (2015), “Do Organic Results Help or Hurt
Sponsored Search Performance?” Information Systems Research, 26(4): 695-713.
Andrel, E., (2014), “Analyzing Multichannel Online Customer Journeys for an Online Retailer:
A Categorization Approach”, Working Paper.
Andrel, E., Becker, I., Wangenheim, F. V. and Schumann, J. H. (2013), “Putting Attribution to
Work: A Graph-based Framework for Attribution Modeling in Managerial Practice,” SSRN.
Bettman, J.R., Luce, M. F. and Payne, J.W. (1998), “Constructive Consumer Choice Processes,”
Journal of Consumer Research, 25(3): 187-217.
De los Santos, B., Hortacsu, A. and Wildenbeest, M. R. (2012), “Testing Models of Consumer
Search using Data on Web Browsing and Purchasing Behavior,” American Economic
Review, 102(6): 2955-2980.
Demirci, C., Pauwels, K., Srinivasan S., and Yildirim, G., (2014), “Conditions for Owned, Paid
and Earned Media Impact and Synergy”, Working Paper.
Dubé, J., Hitsch, G. J., Rossi, P. E., and Vitorino, M. A. (2008), “Category Pricing with State-
Dependent Utility,” Marketing Science, 27 (3): 417-29.
Econsultancy, (2012), “Marketing Attribution: Valuing the Customer Journey,” Retrieved from
http://econsultancy.com/de/reports/marketing-attribution-valuing-
the-customer-journey
Erdem, T. and Keane, M. P. (1996), “Decision-Making under Uncertainty: Capturing Dynamic
Brand Choice Processes in Turbulent Consumer Goods Markets,” Marketing Science, 15 (1):
1-20.
Ghose, A. and Todri, V. (2015), “Towards Digital Attribution: Measuring the Impact of Display
Advertising on Online Consumer Behavior,” MIS Quarterly, forthcoming.
Ghose A. and Yang, S. (2009), “An Empirical Analysis of Search Engine Advertising: Sponsored
Search in Electronic Markets,” Management Science 50(10):1605-1622.
Goeree, S. M. (2008), “Limited Information and Advertising in the U.S. Personal Computer
Industry,” Econometrica, 76(5): 1017–1074.
Goldfarb, A. and Tucker, C. (2011), "Online Display Advertising: Targeting and Obtrusiveness,"
Marketing Science, 30(3): 389-404.
Haan, E., Wiesel, T. and Pauwels, K. (2014), “The Effectiveness of Different Forms of Online
Advertising for Purchase Conversion in a Multiple-Channel Attribution Framework,”
Working paper.
Johnson, E. J., Bellman, S. and Lohse, G. L. (2003), “Cognitive Lock-In and the Power Law of
Practice,” Journal of Marketing, 67, April 2003, 62-75.
Johnson, G. A. and Lewis, R. A. and Nubbemeyer, E. I. (2015) “Ghost Ads: Improving the
Economics of Measuring Ad Effectiveness,” Simon Business School Working Paper, No.
FR 15-21.
Kerin, R., Hartley, S. and Rudelius, W. (2015), Marketing 12th
Edition, New York, NY:
McGrawHill Irwin
Lewis, R. A. and Reiley, D. H. (2014), "Online Ads and Offline Sales: Measuring the Effects of
Online Advertising via a Controlled Experiment on Yahoo!" Quantitative Marketing and
Economics, 12(3): 235-266.
Li, H. and Kannan, P. (2014), “Attributing Conversion in a Multichannel Online Marketing
Environment: An Empirical Model and a Field Experiment,” Journal of Marketing
Research, 51(1):40-56.
Li, J., Granado, N. and Netessine, S. (2014), “Are Consumers Strategic? Structural Estimation
from the Air-Travel Industry,” Management Science, 60(9): 2114-2137.
Manchanda, P., Rossi P. E., and Chintagunta, P. K., (2004), “Response Modeling with Non-
Random Marketing Mix Variables,” Journal of Marketing Research, 41(3): 467-478.
Nerlove, M., and Arrow, K. J. (1962), “Optimal Advertising Policy under Dynamic Conditions,”
Economica, 29(144):129-142.
Park, Young-Hoon and Fader, P. S. (2004), “Modeling Browsing Behavior at Multiple Websites,”
Marketing Science, 23(3): 280-303.
Petrin, A. and Train, K. (2010), “A Control Function Approach to Endogeneity in Consumer
Choice Models,” Journal of Marketing Research, 47(1):3-13.
Raman, K., Mantrala, M. K., Sridhar, S. and Tang, Y. (2012), “Optimal Resource Allocation
with Time-varying Marketing Effectiveness, Margins and Costs,” Journal of Interactive
Marketing, 26:43-53.
Rossi, P. (2014), “Even the Rich Can Make Themselves Poor: A Critical Examination of IV
Methods in Marketing Applications,” Marketing Science, 33(5):655-672.
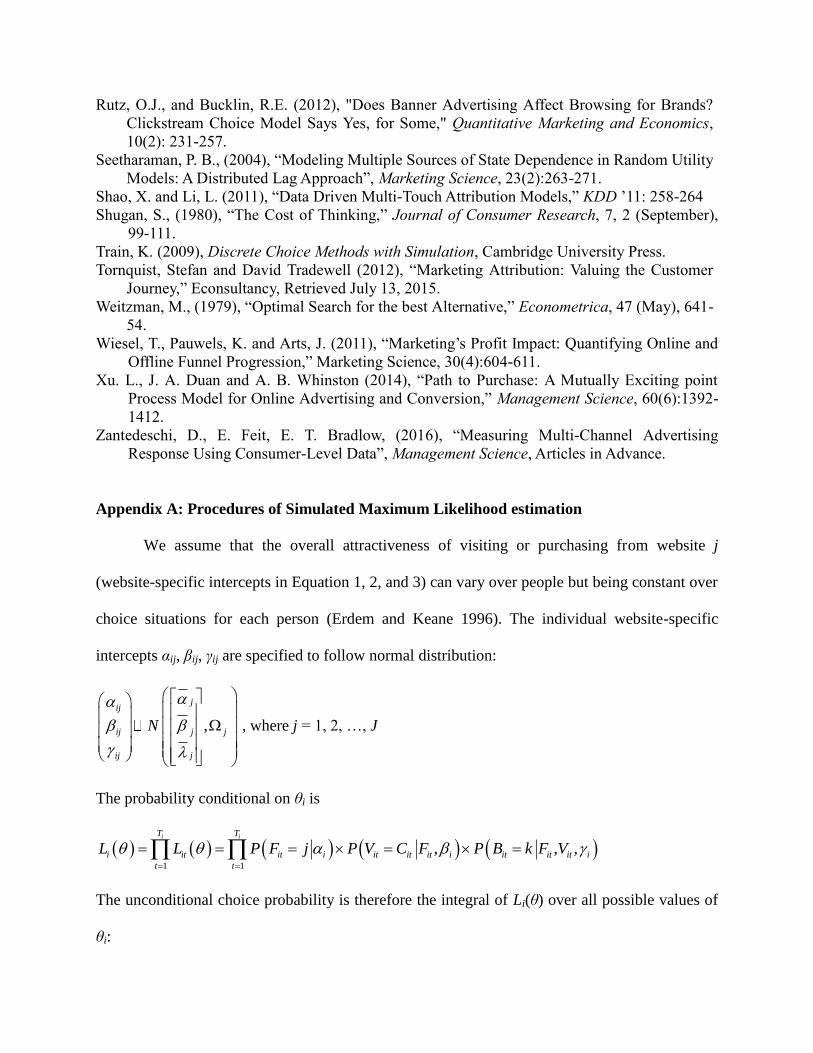
Rutz, O.J., and Bucklin, R.E. (2012), "Does Banner Advertising Affect Browsing for Brands?
Clickstream Choice Model Says Yes, for Some," Quantitative Marketing and Economics,
10(2): 231-257.
Seetharaman, P. B., (2004), “Modeling Multiple Sources of State Dependence in Random Utility
Models: A Distributed Lag Approach”, Marketing Science, 23(2):263-271.
Shao, X. and Li, L. (2011), “Data Driven Multi-Touch Attribution Models,” KDD ’11: 258-264
Shugan, S., (1980), “The Cost of Thinking,” Journal of Consumer Research, 7, 2 (September),
99-111.
Train, K. (2009), Discrete Choice Methods with Simulation, Cambridge University Press.
Tornquist, Stefan and David Tradewell (2012), “Marketing Attribution: Valuing the Customer
Journey,” Econsultancy, Retrieved July 13, 2015.
Weitzman, M., (1979), “Optimal Search for the best Alternative,” Econometrica, 47 (May), 641-
54.
Wiesel, T., Pauwels, K. and Arts, J. (2011), “Marketing’s Profit Impact: Quantifying Online and
Offline Funnel Progression,” Marketing Science, 30(4):604-611.
Xu. L., J. A. Duan and A. B. Whinston (2014), “Path to Purchase: A Mutually Exciting point
Process Model for Online Advertising and Conversion,” Management Science, 60(6):1392-
1412.
Zantedeschi, D., E. Feit, E. T. Bradlow, (2016), “Measuring Multi-Channel Advertising
Response Using Consumer-Level Data”, Management Science, Articles in Advance.
Appendix A: Procedures of Simulated Maximum Likelihood estimation
We assume that the overall attractiveness of visiting or purchasing from website j
(website-specific intercepts in Equation 1, 2, and 3) can vary over people but being constant over
choice situations for each person (Erdem and Keane 1996). The individual website-specific
intercepts αij, βij, γij are specified to follow normal distribution:
,
jij
ij jj
jij
N
, where j = 1, 2, …, J
The probability conditional on θi is
1 1
, , ,i iT T
i it it i it it it i it it it i
t t
L L P F j P V C F P B k F V
The unconditional choice probability is therefore the integral of Li(θ) over all possible values of
θi:

it itP L f d
1. Draw θir from its distribution.
A set of random variables 1 2 3, ,r r r r
i j j j , j = 1, 2, …, J are drawn from i.i.d. standard normal
distribution. Then we compute the website-specific intercepts for each person as follows:
1j
r rjij j
21 1 22 2j j j
r r r
ij j jj c c
31 1 32 2 33 3j j j j
r r r r
ij j j jj c c c
The benefit of this specification is that the correlation between intercepts of different stages
remains the same across websites, thus significantly reducing the number of parameters to be
estimated. With this specification, the variance and covariance matrix can be written as follows:
2
21 31
2 2 2
21 21 22 21 31 22 32
2 2 2 2
31 21 31 22 32 31 32 33
j j j j j
j j j j j
j j j j j
j
c c
c c c c c c c
c c c c c c c c
2. Lit(θ) is calculated for each period, and the product of these Lit(θ)’s is taken:
1 1
, , ,i iT T
r r r r r
i it it i it it it i it it it i
t t
L L P F j P V C F P B k F V
3. Repeat 1 and 2 for many time, and the results are averaged: 1
1 Rr
i i
r
P LR
.
4. Calculate the simulated log-likelihood: 1
N
i
i
SLL P
.

Appendix B: Procedures of Simulated Choice Probabilities
We will use the choice of entry site due to a change in information stock through search engine
for Expedia.com as an example to illustrate. In step 1, we update the corresponding variable in
the dataset, for example by adding 10 pages browsed a month ago through search advertising for
Expedia.com to each individual and then re-computing the information stock through search
advertising using Equation 4. In step 2, we make a draw of net preferences for each website as
described in step 1 in Appendix A. In step 3, we calculate the probability of being chosen as the
entry website for each website using the updated data and the net preferences drawn in step 2.
Repeat step 2 and 3 for many times and in step 4, we calculate the simulated probabilities by
taking a weighted average of the results in step 4. The weight is given as
|
|
r
itr
it r
it
r
P Fw
P F
where Fit is the actual chosen entry-site for individual i in purchase occasion t. In step 5, we
follow step 2 to 4 to calculate the original choice probabilities without the change in ad stock. In
the last step, we calculate the differences in choice probabilities for each website.
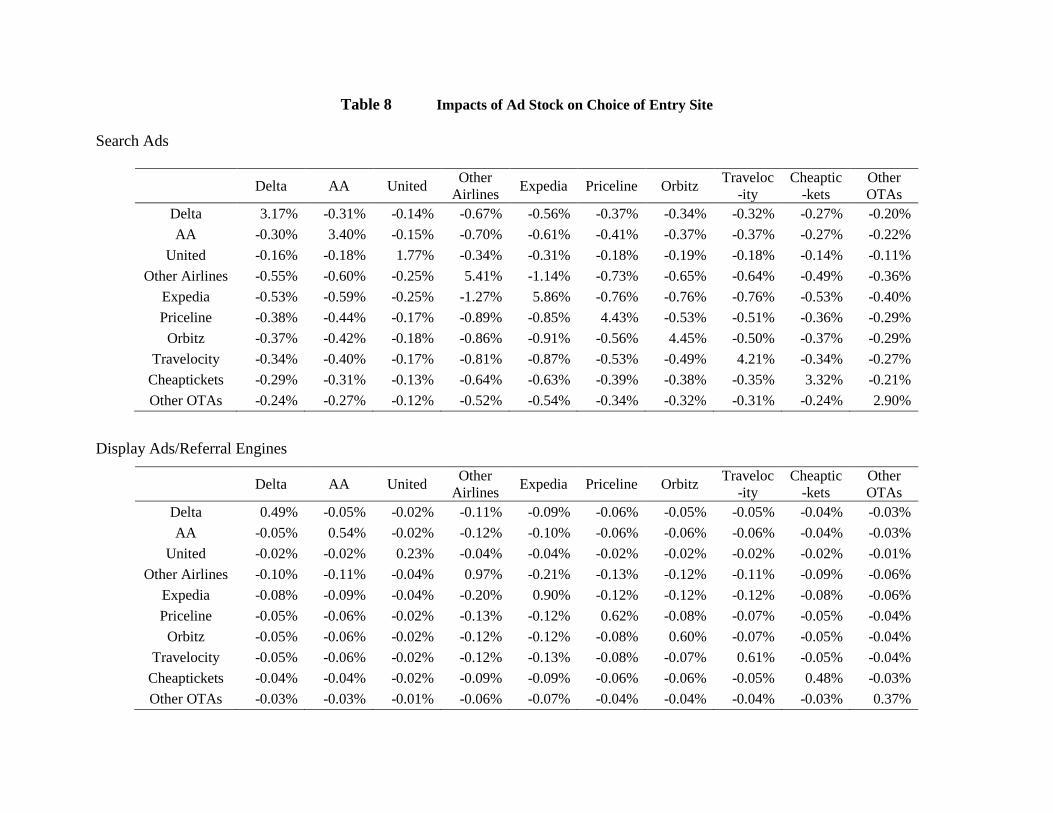
Table 8 Impacts of Ad Stock on Choice of Entry Site
Search Ads
Delta AA United
Other
Airlines Expedia Priceline Orbitz
Traveloc
-ity
Cheaptic
-kets
Other
OTAs
Delta 3.17% -0.31% -0.14% -0.67% -0.56% -0.37% -0.34% -0.32% -0.27% -0.20%
AA -0.30% 3.40% -0.15% -0.70% -0.61% -0.41% -0.37% -0.37% -0.27% -0.22%
United -0.16% -0.18% 1.77% -0.34% -0.31% -0.18% -0.19% -0.18% -0.14% -0.11%
Other Airlines -0.55% -0.60% -0.25% 5.41% -1.14% -0.73% -0.65% -0.64% -0.49% -0.36%
Expedia -0.53% -0.59% -0.25% -1.27% 5.86% -0.76% -0.76% -0.76% -0.53% -0.40%
Priceline -0.38% -0.44% -0.17% -0.89% -0.85% 4.43% -0.53% -0.51% -0.36% -0.29%
Orbitz -0.37% -0.42% -0.18% -0.86% -0.91% -0.56% 4.45% -0.50% -0.37% -0.29%
Travelocity -0.34% -0.40% -0.17% -0.81% -0.87% -0.53% -0.49% 4.21% -0.34% -0.27%
Cheaptickets -0.29% -0.31% -0.13% -0.64% -0.63% -0.39% -0.38% -0.35% 3.32% -0.21%
Other OTAs -0.24% -0.27% -0.12% -0.52% -0.54% -0.34% -0.32% -0.31% -0.24% 2.90%
Display Ads/Referral Engines
Delta AA United
Other
Airlines Expedia Priceline Orbitz
Traveloc
-ity
Cheaptic
-kets
Other
OTAs
Delta 0.49% -0.05% -0.02% -0.11% -0.09% -0.06% -0.05% -0.05% -0.04% -0.03%
AA -0.05% 0.54% -0.02% -0.12% -0.10% -0.06% -0.06% -0.06% -0.04% -0.03%
United -0.02% -0.02% 0.23% -0.04% -0.04% -0.02% -0.02% -0.02% -0.02% -0.01%
Other Airlines -0.10% -0.11% -0.04% 0.97% -0.21% -0.13% -0.12% -0.11% -0.09% -0.06%
Expedia -0.08% -0.09% -0.04% -0.20% 0.90% -0.12% -0.12% -0.12% -0.08% -0.06%
Priceline -0.05% -0.06% -0.02% -0.13% -0.12% 0.62% -0.08% -0.07% -0.05% -0.04%
Orbitz -0.05% -0.06% -0.02% -0.12% -0.12% -0.08% 0.60% -0.07% -0.05% -0.04%
Travelocity -0.05% -0.06% -0.02% -0.12% -0.13% -0.08% -0.07% 0.61% -0.05% -0.04%
Cheaptickets -0.04% -0.04% -0.02% -0.09% -0.09% -0.06% -0.06% -0.05% 0.48% -0.03%
Other OTAs -0.03% -0.03% -0.01% -0.06% -0.07% -0.04% -0.04% -0.04% -0.03% 0.37%
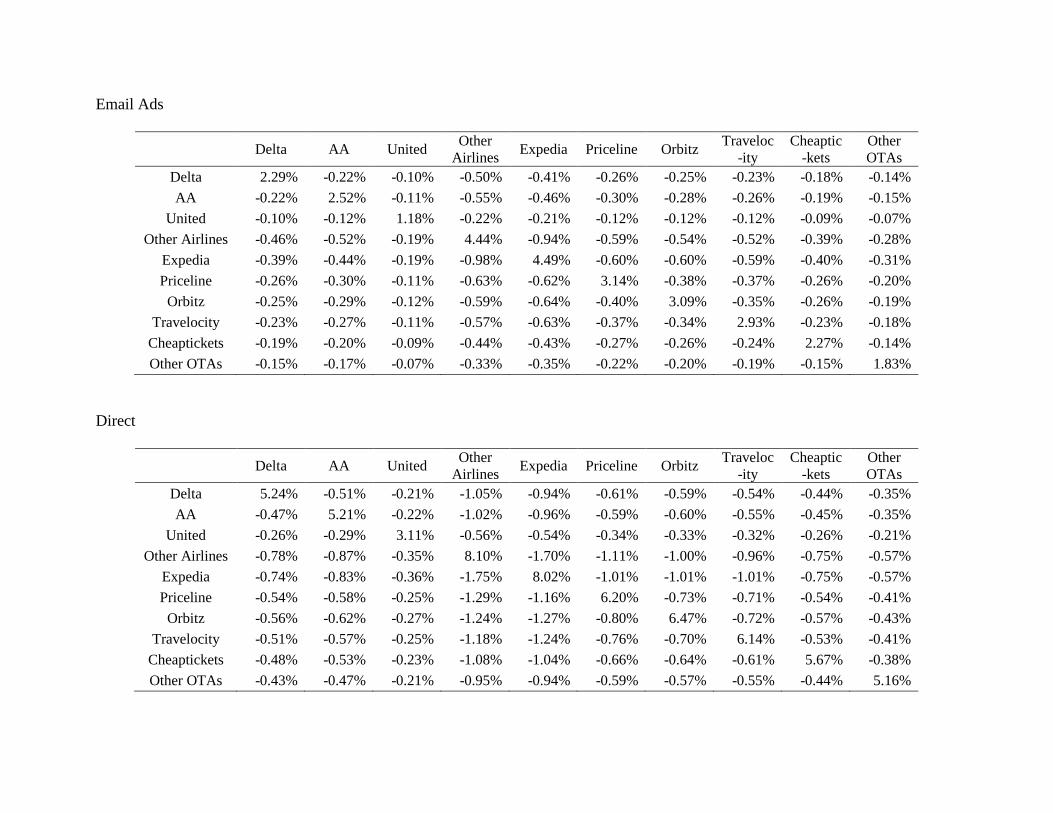
Email Ads
Delta AA United
Other
Airlines Expedia Priceline Orbitz
Traveloc
-ity
Cheaptic
-kets
Other
OTAs
Delta 2.29% -0.22% -0.10% -0.50% -0.41% -0.26% -0.25% -0.23% -0.18% -0.14%
AA -0.22% 2.52% -0.11% -0.55% -0.46% -0.30% -0.28% -0.26% -0.19% -0.15%
United -0.10% -0.12% 1.18% -0.22% -0.21% -0.12% -0.12% -0.12% -0.09% -0.07%
Other Airlines -0.46% -0.52% -0.19% 4.44% -0.94% -0.59% -0.54% -0.52% -0.39% -0.28%
Expedia -0.39% -0.44% -0.19% -0.98% 4.49% -0.60% -0.60% -0.59% -0.40% -0.31%
Priceline -0.26% -0.30% -0.11% -0.63% -0.62% 3.14% -0.38% -0.37% -0.26% -0.20%
Orbitz -0.25% -0.29% -0.12% -0.59% -0.64% -0.40% 3.09% -0.35% -0.26% -0.19%
Travelocity -0.23% -0.27% -0.11% -0.57% -0.63% -0.37% -0.34% 2.93% -0.23% -0.18%
Cheaptickets -0.19% -0.20% -0.09% -0.44% -0.43% -0.27% -0.26% -0.24% 2.27% -0.14%
Other OTAs -0.15% -0.17% -0.07% -0.33% -0.35% -0.22% -0.20% -0.19% -0.15% 1.83%
Direct
Delta AA United
Other
Airlines Expedia Priceline Orbitz
Traveloc
-ity
Cheaptic
-kets
Other
OTAs
Delta 5.24% -0.51% -0.21% -1.05% -0.94% -0.61% -0.59% -0.54% -0.44% -0.35%
AA -0.47% 5.21% -0.22% -1.02% -0.96% -0.59% -0.60% -0.55% -0.45% -0.35%
United -0.26% -0.29% 3.11% -0.56% -0.54% -0.34% -0.33% -0.32% -0.26% -0.21%
Other Airlines -0.78% -0.87% -0.35% 8.10% -1.70% -1.11% -1.00% -0.96% -0.75% -0.57%
Expedia -0.74% -0.83% -0.36% -1.75% 8.02% -1.01% -1.01% -1.01% -0.75% -0.57%
Priceline -0.54% -0.58% -0.25% -1.29% -1.16% 6.20% -0.73% -0.71% -0.54% -0.41%
Orbitz -0.56% -0.62% -0.27% -1.24% -1.27% -0.80% 6.47% -0.72% -0.57% -0.43%
Travelocity -0.51% -0.57% -0.25% -1.18% -1.24% -0.76% -0.70% 6.14% -0.53% -0.41%
Cheaptickets -0.48% -0.53% -0.23% -1.08% -1.04% -0.66% -0.64% -0.61% 5.67% -0.38%
Other OTAs -0.43% -0.47% -0.21% -0.95% -0.94% -0.59% -0.57% -0.55% -0.44% 5.16%
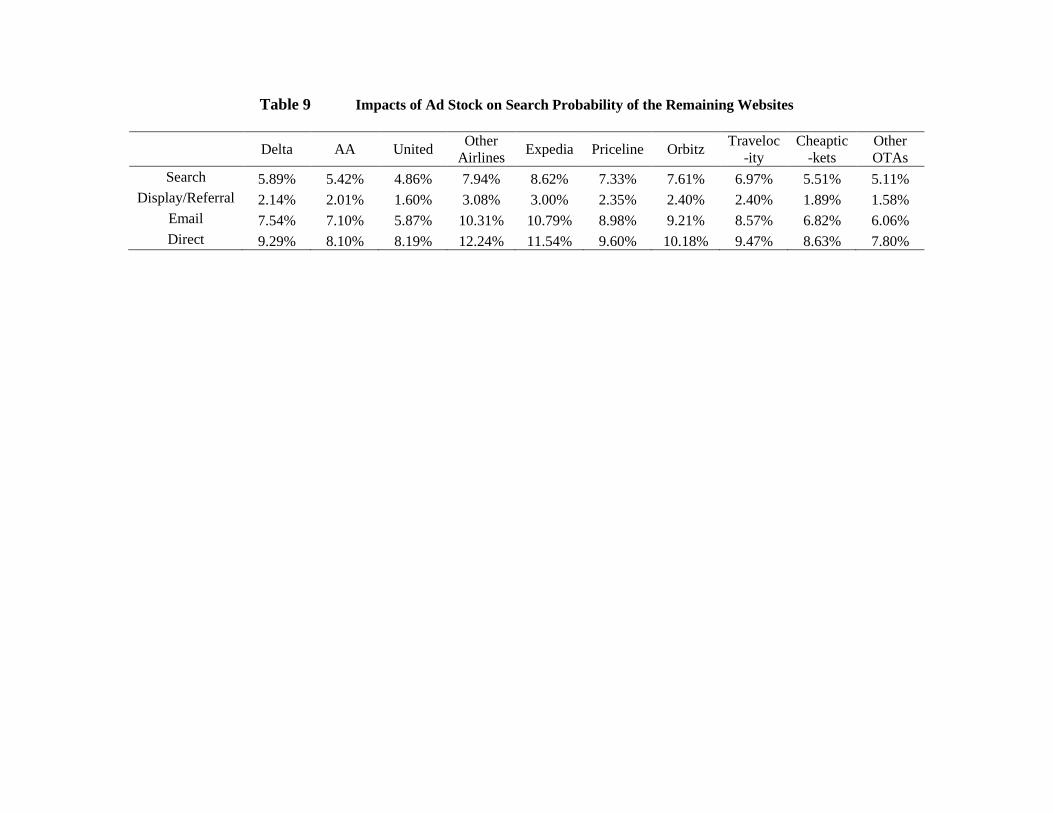
Table 9 Impacts of Ad Stock on Search Probability of the Remaining Websites
Delta AA United
Other
Airlines Expedia Priceline Orbitz
Traveloc
-ity
Cheaptic
-kets
Other
OTAs
Search 5.89% 5.42% 4.86% 7.94% 8.62% 7.33% 7.61% 6.97% 5.51% 5.11%
Display/Referral 2.14% 2.01% 1.60% 3.08% 3.00% 2.35% 2.40% 2.40% 1.89% 1.58%
Email 7.54% 7.10% 5.87% 10.31% 10.79% 8.98% 9.21% 8.57% 6.82% 6.06%
Direct 9.29% 8.10% 8.19% 12.24% 11.54% 9.60% 10.18% 9.47% 8.63% 7.80%
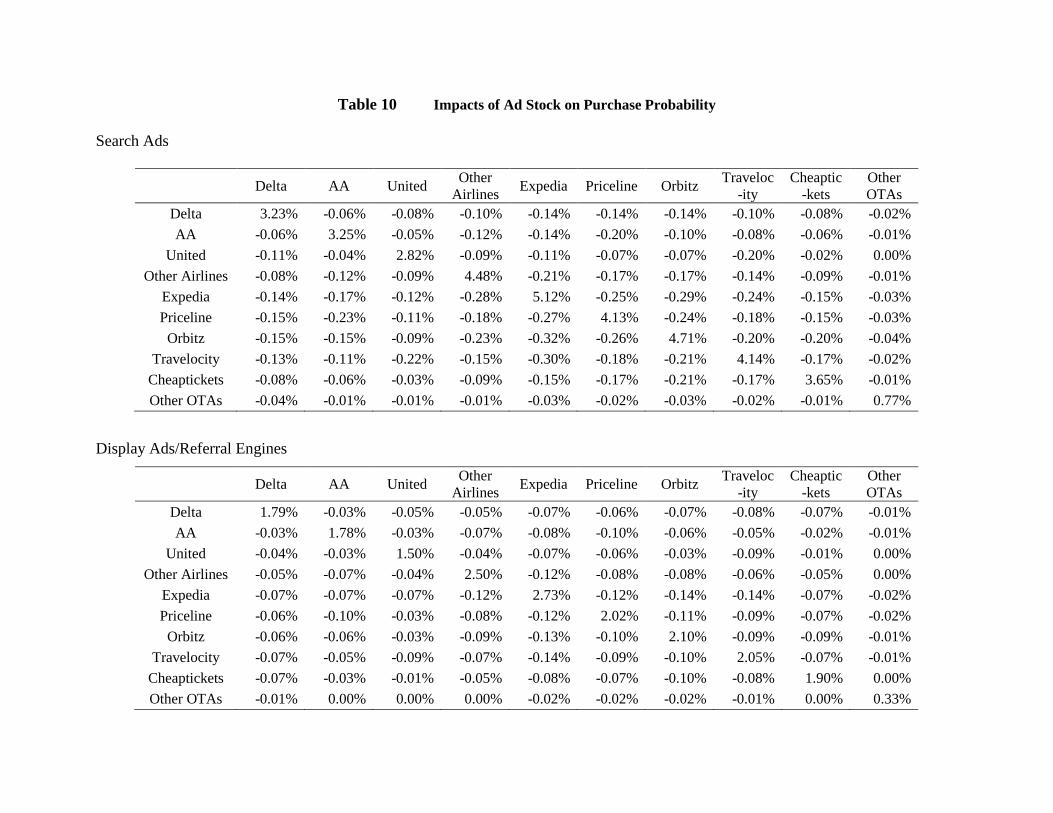
Table 10 Impacts of Ad Stock on Purchase Probability
Search Ads
Delta AA United
Other
Airlines Expedia Priceline Orbitz
Traveloc
-ity
Cheaptic
-kets
Other
OTAs
Delta 3.23% -0.06% -0.08% -0.10% -0.14% -0.14% -0.14% -0.10% -0.08% -0.02%
AA -0.06% 3.25% -0.05% -0.12% -0.14% -0.20% -0.10% -0.08% -0.06% -0.01%
United -0.11% -0.04% 2.82% -0.09% -0.11% -0.07% -0.07% -0.20% -0.02% 0.00%
Other Airlines -0.08% -0.12% -0.09% 4.48% -0.21% -0.17% -0.17% -0.14% -0.09% -0.01%
Expedia -0.14% -0.17% -0.12% -0.28% 5.12% -0.25% -0.29% -0.24% -0.15% -0.03%
Priceline -0.15% -0.23% -0.11% -0.18% -0.27% 4.13% -0.24% -0.18% -0.15% -0.03%
Orbitz -0.15% -0.15% -0.09% -0.23% -0.32% -0.26% 4.71% -0.20% -0.20% -0.04%
Travelocity -0.13% -0.11% -0.22% -0.15% -0.30% -0.18% -0.21% 4.14% -0.17% -0.02%
Cheaptickets -0.08% -0.06% -0.03% -0.09% -0.15% -0.17% -0.21% -0.17% 3.65% -0.01%
Other OTAs -0.04% -0.01% -0.01% -0.01% -0.03% -0.02% -0.03% -0.02% -0.01% 0.77%
Display Ads/Referral Engines
Delta AA United
Other
Airlines Expedia Priceline Orbitz
Traveloc
-ity
Cheaptic
-kets
Other
OTAs
Delta 1.79% -0.03% -0.05% -0.05% -0.07% -0.06% -0.07% -0.08% -0.07% -0.01%
AA -0.03% 1.78% -0.03% -0.07% -0.08% -0.10% -0.06% -0.05% -0.02% -0.01%
United -0.04% -0.03% 1.50% -0.04% -0.07% -0.06% -0.03% -0.09% -0.01% 0.00%
Other Airlines -0.05% -0.07% -0.04% 2.50% -0.12% -0.08% -0.08% -0.06% -0.05% 0.00%
Expedia -0.07% -0.07% -0.07% -0.12% 2.73% -0.12% -0.14% -0.14% -0.07% -0.02%
Priceline -0.06% -0.10% -0.03% -0.08% -0.12% 2.02% -0.11% -0.09% -0.07% -0.02%
Orbitz -0.06% -0.06% -0.03% -0.09% -0.13% -0.10% 2.10% -0.09% -0.09% -0.01%
Travelocity -0.07% -0.05% -0.09% -0.07% -0.14% -0.09% -0.10% 2.05% -0.07% -0.01%
Cheaptickets -0.07% -0.03% -0.01% -0.05% -0.08% -0.07% -0.10% -0.08% 1.90% 0.00%
Other OTAs -0.01% 0.00% 0.00% 0.00% -0.02% -0.02% -0.02% -0.01% 0.00% 0.33%

Email Ads
Delta AA United
Other
Airlines Expedia Priceline Orbitz
Traveloc
-ity
Cheaptic
-kets
Other
OTAs
Delta 4.16% -0.08% -0.10% -0.14% -0.19% -0.17% -0.17% -0.18% -0.16% -0.02%
AA -0.08% 4.20% -0.07% -0.17% -0.21% -0.25% -0.16% -0.10% -0.08% -0.01%
United -0.12% -0.08% 3.72% -0.10% -0.17% -0.14% -0.09% -0.21% -0.04% 0.00%
Other Airlines -0.13% -0.18% -0.10% 5.82% -0.28% -0.21% -0.22% -0.17% -0.13% -0.01%
Expedia -0.19% -0.20% -0.15% -0.29% 6.42% -0.33% -0.37% -0.34% -0.19% -0.04%
Priceline -0.17% -0.26% -0.12% -0.23% -0.34% 4.98% -0.26% -0.23% -0.16% -0.05%
Orbitz -0.17% -0.16% -0.09% -0.24% -0.38% -0.29% 5.43% -0.24% -0.26% -0.04%
Travelocity -0.19% -0.11% -0.20% -0.18% -0.37% -0.21% -0.24% 4.85% -0.19% -0.02%
Cheaptickets -0.17% -0.08% -0.03% -0.12% -0.20% -0.19% -0.27% -0.19% 4.45% -0.01%
Other OTAs -0.04% -0.02% -0.01% -0.01% -0.06% -0.05% -0.04% -0.02% -0.01% 0.91%
Direct
Delta AA United
Other
Airlines Expedia Priceline Orbitz
Traveloc
-ity
Cheaptic
-kets
Other
OTAs
Delta 2.60% -0.05% -0.06% -0.08% -0.14% -0.10% -0.09% -0.15% -0.09% -0.01%
AA -0.04% 2.46% -0.03% -0.12% -0.15% -0.11% -0.11% -0.06% -0.04% -0.01%
United -0.05% -0.08% 2.49% -0.06% -0.13% -0.07% -0.06% -0.07% -0.03% 0.00%
Other Airlines -0.08% -0.12% -0.05% 3.93% -0.19% -0.12% -0.15% -0.11% -0.08% -0.01%
Expedia -0.15% -0.11% -0.13% -0.17% 4.35% -0.17% -0.21% -0.17% -0.12% -0.03%
Priceline -0.08% -0.12% -0.06% -0.12% -0.17% 3.08% -0.10% -0.12% -0.10% -0.02%
Orbitz -0.13% -0.11% -0.07% -0.15% -0.25% -0.19% 3.68% -0.14% -0.15% -0.03%
Travelocity -0.14% -0.05% -0.05% -0.11% -0.21% -0.10% -0.12% 2.86% -0.09% -0.01%
Cheaptickets -0.09% -0.07% -0.01% -0.06% -0.11% -0.08% -0.17% -0.08% 2.50% -0.01%
Other OTAs -0.01% -0.01% -0.01% -0.01% -0.03% -0.02% -0.03% -0.01% -0.01% 0.51%
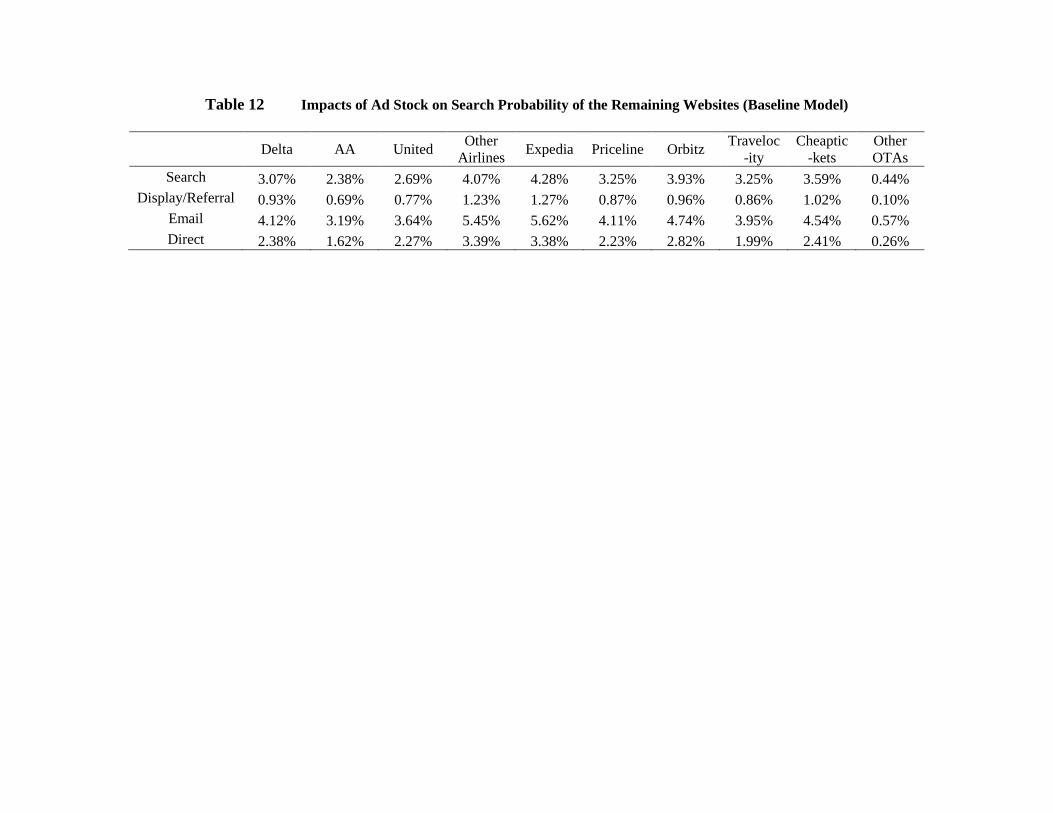
Table 12 Impacts of Ad Stock on Search Probability of the Remaining Websites (Baseline Model)
Delta AA United
Other
Airlines Expedia Priceline Orbitz
Traveloc
-ity
Cheaptic
-kets
Other
OTAs
Search 3.07% 2.38% 2.69% 4.07% 4.28% 3.25% 3.93% 3.25% 3.59% 0.44%
Display/Referral 0.93% 0.69% 0.77% 1.23% 1.27% 0.87% 0.96% 0.86% 1.02% 0.10%
Email 4.12% 3.19% 3.64% 5.45% 5.62% 4.11% 4.74% 3.95% 4.54% 0.57%
Direct 2.38% 1.62% 2.27% 3.39% 3.38% 2.23% 2.82% 1.99% 2.41% 0.26%