modeling of an optical diaphragm for human...
TRANSCRIPT
Modeling of an Optical Diaphragm for Human Pulse Pressure Detection
K. HASIKIN1, N. SOIN
2, F. IBRAHIM
1
1Department of Biomedical Engineering, Faculty of Engineering 2Department of Electrical Engineering, Faculty of Engineering
University of Malaya
Lembah Pantai, Kuala Lumpur
MALAYSIA
Abstract: - This paper presents the modeling of an optical diaphragm behavior for human pulse pressure detection. In
this study, the comparison between the performance of the polyimide and silicon nitride diaphragm has been
presented. The effects of diaphragm radius and diaphragm thickness on static and frequency response are also
investigated. The findings show that the polyimide diaphragm is more sensitive than the silicon nitride diaphragm. In
addition, deflection of both diaphragms has linear relationship with the applied pressure The diaphragm radius has
more effect on the deflection, sensitivity and resonance frequency as compared to the diaphragm thickness. It can be
concluded that the polyimide diaphragm achieves the optimum performance in terms of the deflection, sensitivity, and
resonance frequency for human pulse pressure detection. Thus, the polyimide diaphragm has been chosen as the best
model in designing an optical micro-diaphragm.
Key-Words: - Optical MEMS, Deflection, Resonance Frequency, Pressure Sensitivity, Pulse Pressure, Silicon nitride,
Polyimide, Biosensor
1 Introduction The shape of the arterial pressure waveform provides a
measure of the arterial stiffness [1]. The pulse pressure
waveform can be used to diagnose arterial stiffness.
Arterial stiffness is caused by the buildup of fatty
deposits (plaque) on the inside arteries walls. Plaques
will reduce the blood flow through the artery [2].
Arterial stiffness typically begins in early
adolescence, and is usually found in most major arteries
[3]. However, the arterial stiffness is asymptomatic and
cannot be detected by most diagnostic tools. It becomes
seriously symptomatic when arterial stiffness affects
coronary circulation or cerebral circulation. Furthermore,
the arterial stiffness can be considered the most
important underlying cause of strokes, heart attack, and
various heart diseases.
Commercial miniature sensors available,
regardless of their invasiveness can present only a
percentage of arterial occlusions. No information about
the degrees of sclerosis and stiffness of the arteries can
be directly gained from them [4,5]. To obtain parameters
such as distension and stiffness of the arteries, the
movement of the arteries walls during pulsation must be
accurately detected. Several techniques have been used
in recent years. This includes Magnetic Resonance
Imaging (MRI), angiography, Intravascular Ultrasound
(IVUS) and biomedical pressure sensor.
The MRI is an imaging technique used primarily
in medical settings to produce high quality images of the
inside of human body [6]. It provides detailed images of
the body in any plane. MRI is potentially useful and can
be used as an effective diagnostic tool in basic research,
clinical investigation and disease diagnosis [7]. It
provides both chemical and physiological information of
the tissue in human body [7,8]
However, many magnetic resonance signals face
the problem of low signal-to-noise ratio [7,9]. Due to
this complication, magnetic resonance image estimation
from noisy data is challenging.
The angiography technique is also used in the
diagnosis of the arterial stiffness. Angiography involves
looking inside the arteries to see if there is any blockage
in the arteries wall [10]. This is the most accurate way to
assess the presence and the severity of vascular diseases
[10]. However, angiography is invasive and relatively
high cost as compared to other diagnosis techniques.
The IVUS enables assessment of morphology
and distribution of in vivo plaque [11]. It uses a catheter
with a miniaturized ultrasound probe that can determine
plaque volume within the arterial wall. The IVUS can
visualize the lumen of the arteries. However, IVUS is
time consuming and can only be performed by a
technician who is trained in interventional cardiology
techniques [10]. In addition, there may be an additional
risk imposed by the use of the IVUS catheter.
The biomedical pressure sensor has shown its
potential in the diagnosis of arterial stiffness. Diagnosis
of arterial stiffness can be conducted by detecting the
pulse pressure on the radial artery. There are two
approaches in biomedical pressure measurements
WSEAS TRANSACTIONS on ELECTRONICS K. Hasikin, N. Soin, F. Ibrahim
ISSN: 1109-9445 447 Issue 11, Volume 5, November 2008
namely, direct and indirect pressure measurements. The
direct pressure measurement refers to the assessment of
the pressure using a sensor that is in contact with blood
or fluid in human body [12]. Through this invasive
techniques, the sensor experiences physical connection
with circulating blood or measured fluid.
However, indirect pressure measurement
involves a sensor that does not utilize any invasive
measurements. Advancement in semiconductor
technology has revolutionized the designing biomedical
pressure sensor. Nevertheless, there is critical need for a
miniature ultra-low pressure transducer [13]. Many
sensing principles such as piezoresistive, capacitive and
optical have been looked into biomedical pressure
sensing. Rapid expansion in Biological Micro-electro-
mechanical Systems (BioMEMS) has enabled sensor
miniaturization for arterial pressure measurements.
Sensing principles such as capacitive and
piezoresistive have shown good potential in biomedical
applications. However, a major problem associated with
the piezoresistive pressure sensor is its inherent
sensitivity to temperature [14-16].
In contrast to the piezoresistive pressure sensors,
it is well known that the capacitive detection principle
has a high sensitivity. However, electrical connections to
the sensor are very sensitive to noise. This is due to
small electrical capacitance. Therefore, electrical
connections have to be made as short as possible and this
makes the sensor packaging process a big challenge.
[14].
Optical sensor has the advantage of high
resolution, high sensitivity, intrinsic electrical passivity
and immunity to electromagnetic interference [17-19].
Optical sensor typically utilizes a sensor head that
consists of a diaphragm and optical fiber which in turn,
converts the light rays to electric signal. The diaphragm
is one of the most important parts in the optical sensor
because the sensitivity of the sensor is highly dependent
on its performance [13].
This paper presents the modeling of an optical
micro-diaphragm for human pulse pressure detection.
The effect of diaphragm material, radius and thickness
on static and frequency responses are analyzed.
2 Theory of a Circular diaphragm This section discussed the theory of circular diaphragm
on deflection, sensitivity and resonance frequency of the
diaphragm are presented.
2.1 Diaphragm deflection under applied
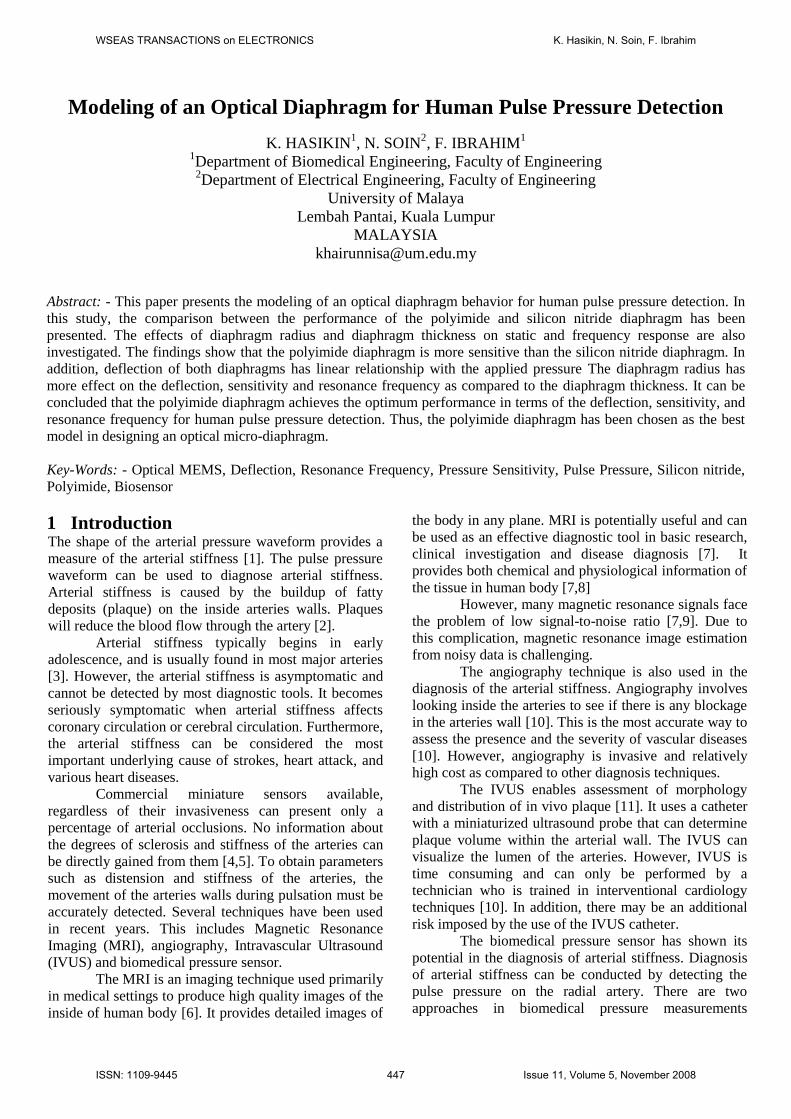
pressure Load-deflection method is used for elastic properties
measurement of thin films [14, 20-22]. In this technique,
the deflection of a fixed edge diaphragm is measured as
a function of applied pressure as shown in Figure 1.
Figure 1: Structure model for the circular diaphragm
The diaphragm will be deflected under a
uniform applied pressure. The out-of-plane deflection of
the diaphragm, y is a function of the pressure difference
and the radial distance [10-12]:
2)
22(
316
)2
1(3ra
Eh
Py (1)
where y is deflection, P is applied pressure, μ is
Poisson’s ratio, E is Young’s Modulus, h is diaphragm
thickness, a and r are effective diaphragm radius and
radial distance, respectively.
The maximum deflection, of the diaphragm as a
function of applied pressure can be written as [11]:
PEh
a
cy
316
4)
21(3
(2)
When the diaphragm is thick, the flexural
rigidity of the diaphragm will increase. Flexural rigidity
is defined as a force couple required to bend a rigid
structure and can be defined as:
)1(12 2
3
v
EhD (3)
The relationship between the flexural rigidity
and deflection is shown as in equation (4).
D
aPyc
64
)( 4
(4)
2.2 Pressure Sensitivity
The pressure sensitivity (Y) is defined as the ratio
between the deflection and the pressure difference [5,
11]. Sensitivity is normally used in evaluating the
performance of the diaphragm as it is a pressure
sensitive element. When the optical fiber is positioned
facing the center of the diaphragm, the maximum
deflection and pressure sensitivity will be analyzed.
As for silicon nitrite and polyimide
WSEAS TRANSACTIONS on ELECTRONICS K. Hasikin, N. Soin, F. Ibrahim
ISSN: 1109-9445 448 Issue 11, Volume 5, November 2008
diaphragms, their pressure sensitivity at the center of the
diaphragm is given by equations (5) and (6) respectively
[11]:
)/(10585.8)(3
411 mmHgm
h
aridesiliconnitYc
(5)
)/(10194.2)(3
411 mmHgm
h
apolyimideYc
(6)
where diaphragm radius (a) and diaphragm thickness (h)
are in microns.
2.3 Resonance Frequency Frequency response is another important issue in
modeling of the micro-diaphragm. In this study, the
diaphragm is defined as a free vibrating circular plate
clamped rigidly at the edge. Resonance frequency of the
diaphragm is given by [5, 11]:
22 )1(34 a
hEf mn
mn
(7)
where αmn and ρ are constants related to the vibrating
modes of the diaphragm and mass density of the
diaphragm material, respectively.
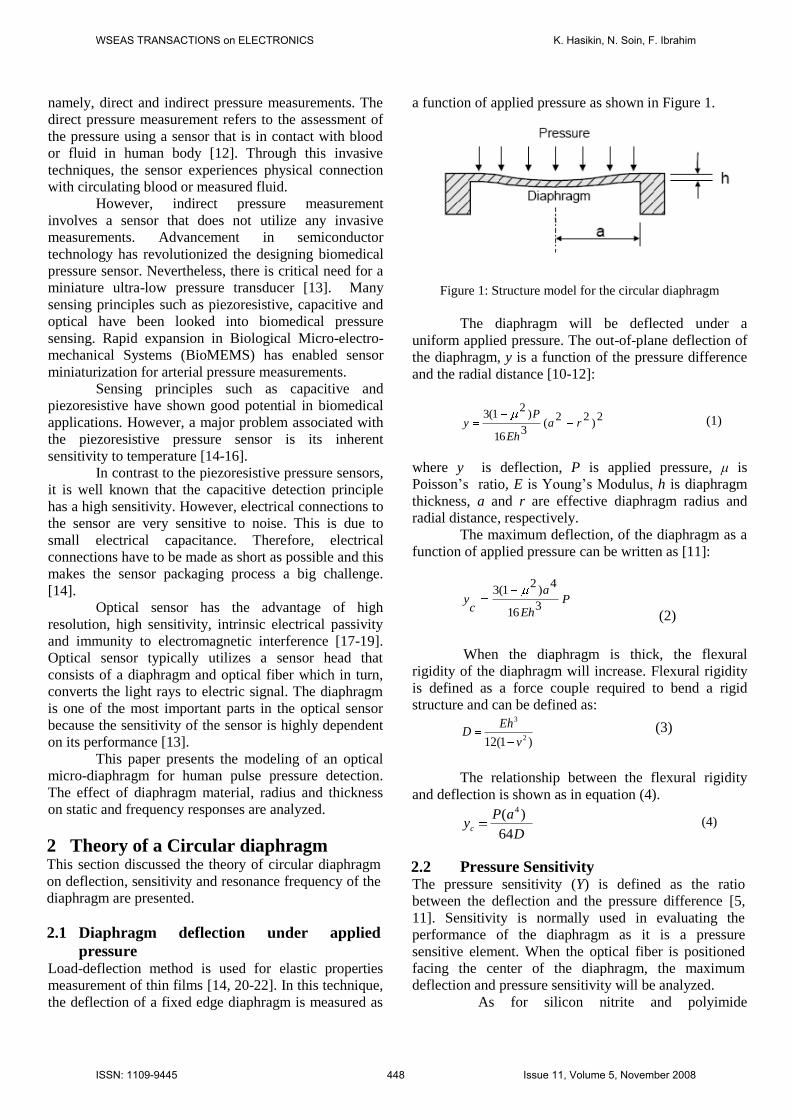
3 Principle of operation The optical pulse sensor consists of an optical fiber
and a micro-diaphragm structure as pressure transducer.
It is demodulated by detecting the shift of the reflected
or transmitted spectrum from the light source. Light
emitting diode (LED) is used as a light source and the
light emitted will then be transmitted via optical fibers.
Pulse pressure that is sensed from the surface of
radial artery, will cause deformation of the diaphragm.
This deformation will change the reflected or transmitted
spectrum. The diffused components of the reflected light
will strike the diaphragm which is in contact with the
skin on the radial artery.
From the reflected spectrum, the cavity length of
the sensor, deflection and corresponding pressure can be
measured. The reflected waveform will provide the
information on the arterial stiffness and elasticity of the
artery [1].
However, this study focuses on the modeling of
an optical micro-diaphragm for the human pulse
pressure detection. The modeling and analysis of the
diaphragm are presented in the next subsection. The
analysis includes the static and frequency response of
the diaphragm and the diaphragm material is chosen
based on this analysis.
Figure 2: Proposed design of the optical MEMS sensor [4].
4 Design Specifications The optical sensor is targeted to sense the pulse pressure
on the surface of human’s radial artery. According to
[23-25], the diameter of normal human artery is between
2.5 to 3mm. Therefore, the overall sensor system must
be smaller than the size of radial artery.
Since the sensor is externally attached to the
human wrist, the pulse pressure will not create the same
pressure as the blood exerts on the arteries wall [23].
The pressure will not be sufficient enough to displace
the diaphragm by more than 1μm [23]. Therefore,
miniature size diaphragm with maximum deflection of
1µm is needed.
In order to ensure the diaphragm operates in a
linear range, the resonance frequency of the diaphragm
should be at least 2.5 times larger than the applied
frequency [26]. For pulse pressure detection, the
diaphragm should be able to operate in the frequency
range from 0 to 50 kHz. The complete diaphragm
specifications are presented in Table 1.
Optical
Fiber
diaphragm
reflected
Light Source
WSEAS TRANSACTIONS on ELECTRONICS K. Hasikin, N. Soin, F. Ibrahim
ISSN: 1109-9445 449 Issue 11, Volume 5, November 2008
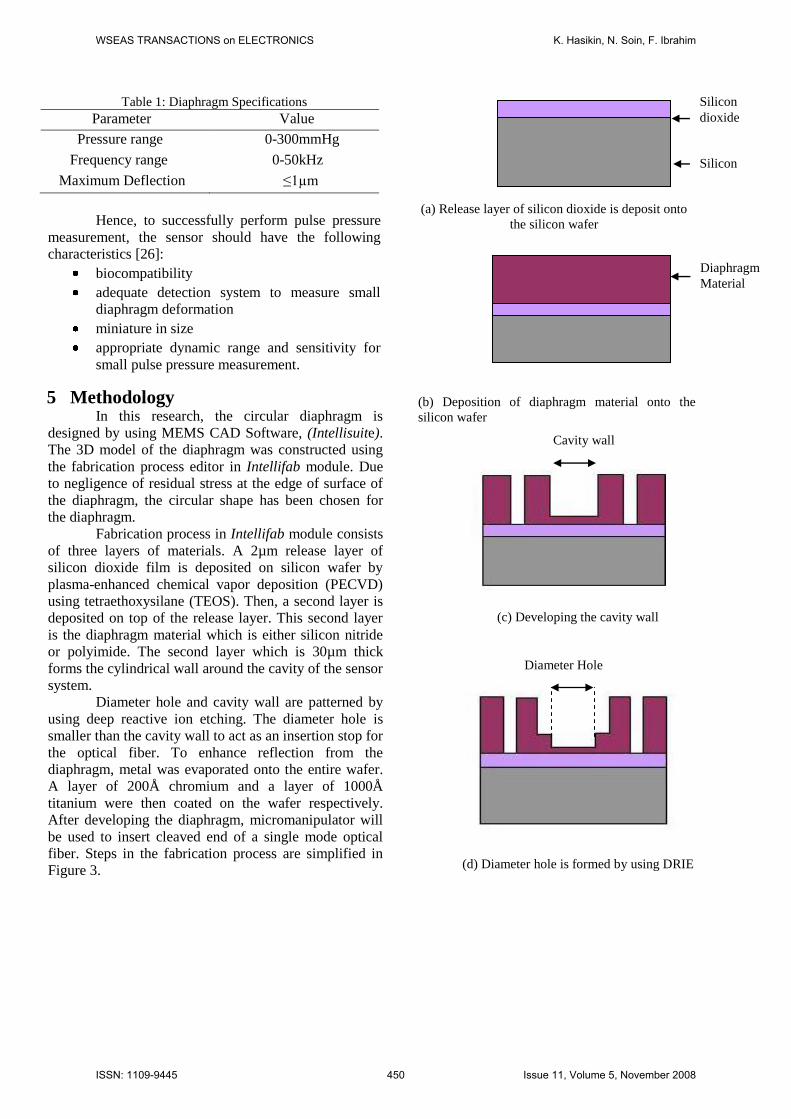
Table 1: Diaphragm Specifications
Parameter Value
Pressure range 0-300mmHg
Frequency range 0-50kHz
Maximum Deflection ≤1µm
Hence, to successfully perform pulse pressure
measurement, the sensor should have the following
characteristics [26]:
biocompatibility
adequate detection system to measure small
diaphragm deformation
miniature in size
appropriate dynamic range and sensitivity for
small pulse pressure measurement.
5 Methodology In this research, the circular diaphragm is
designed by using MEMS CAD Software, (Intellisuite).
The 3D model of the diaphragm was constructed using
the fabrication process editor in Intellifab module. Due
to negligence of residual stress at the edge of surface of
the diaphragm, the circular shape has been chosen for
the diaphragm.
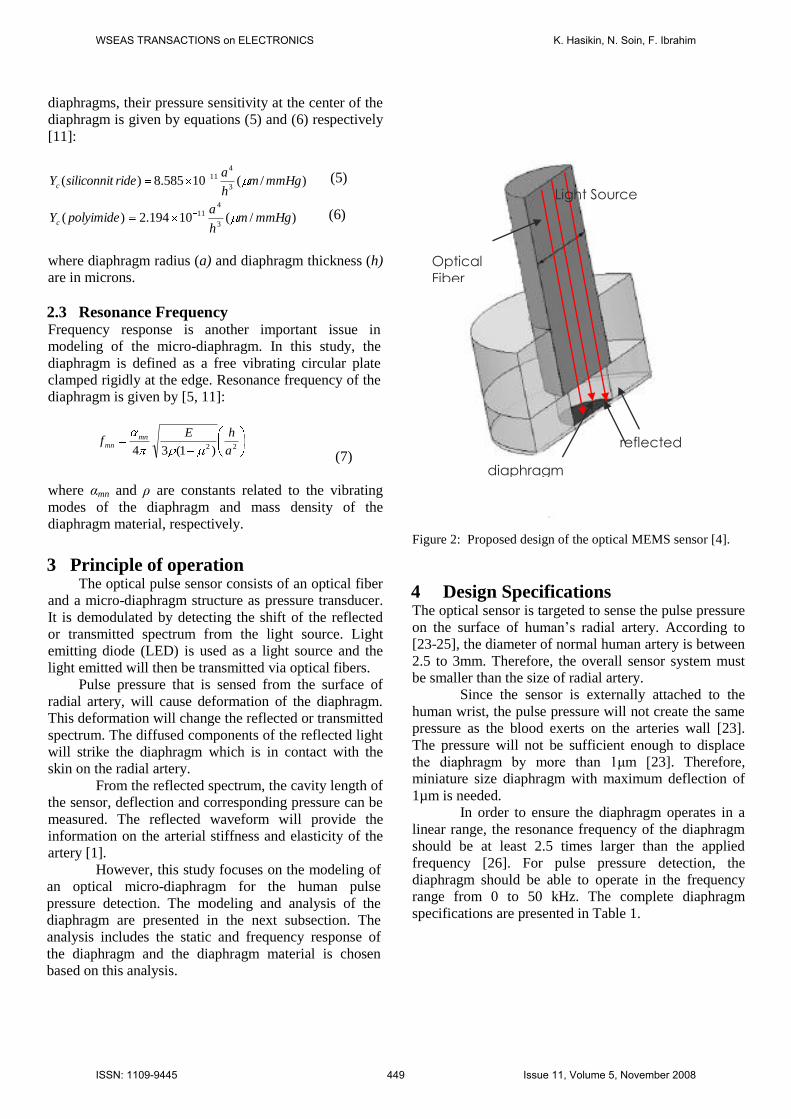
Fabrication process in Intellifab module consists
of three layers of materials. A 2µm release layer of
silicon dioxide film is deposited on silicon wafer by
plasma-enhanced chemical vapor deposition (PECVD)
using tetraethoxysilane (TEOS). Then, a second layer is
deposited on top of the release layer. This second layer
is the diaphragm material which is either silicon nitride
or polyimide. The second layer which is 30µm thick
forms the cylindrical wall around the cavity of the sensor
system.
Diameter hole and cavity wall are patterned by
using deep reactive ion etching. The diameter hole is
smaller than the cavity wall to act as an insertion stop for
the optical fiber. To enhance reflection from the
diaphragm, metal was evaporated onto the entire wafer.
A layer of 200Å chromium and a layer of 1000Å
titanium were then coated on the wafer respectively.
After developing the diaphragm, micromanipulator will
be used to insert cleaved end of a single mode optical
fiber. Steps in the fabrication process are simplified in
Figure 3.
(a) Release layer of silicon dioxide is deposit onto
the silicon wafer
(b) Deposition of diaphragm material onto the
silicon wafer
(c) Developing the cavity wall
(d) Diameter hole is formed by using DRIE
Cavity wall
Silicon
dioxide
Silicon
Diaphragm
Material
Diameter Hole
WSEAS TRANSACTIONS on ELECTRONICS K. Hasikin, N. Soin, F. Ibrahim
ISSN: 1109-9445 450 Issue 11, Volume 5, November 2008

(e) Reflective metal layer is evaporated
onto the whole wafer
Figure 3: Fabrication process for the circular diaphragm. (a)
Release layer (2μm silicon dioxide) is deposit onto the silicon
wafer. (b) Diaphragm material is deposit onto the wafer as
diaphragm layer. (c) Diameter hole is pattern by using deep
reactive ion etching (DRIE). (d) Etching process using DRIE
to form cavity walls. (e) 200Å chromium and 1000Å Titanium
will be evaporated onto the whole wafer as a reflective metal
layer.
The analysis of the diaphragm has been
performed by using Thermoelectromechanical module
once the realization of the diaphragm structure was
completed. The Thermoelectromechanical module is a
type of analysis which is based on the finite element
method.
The finite element analysis (FEA) also known as
finite element method is a computational technique used
to obtain approximate solutions of boundary condition
problems in engineering [27]. Before fabricating the
diaphragm, it is essential to do a theoretical analysis by
using the FEA. This analysis is helpful because FEA
gives close approximation of the actual prototype before
it is fabricated.
Enormous amount of time and money can be
saved by using the FEA because any difficulties that
may rise during designing of the diaphragm can be
detected and rectified at an early stage. Hence, trial and
error approaches which are in use today can be avoided
[27]. In addition, the FEA is a simulation technique that
can be used to analyze the behavior of MEMS devices
[28].
To design the diaphragm by using FEA, it is
necessary to define the type of construction elements,
mesh profile, material properties, boundary conditions
and loads [29-31]. The movable diaphragm in FEA
simulation must operate in a small deflection region and
must have a perfect boundary condition.
Boundaries of the diaphragm are fixed and
clamped at its edge as shown in Figure 4. Three-
dimensional model of the diaphragm in Figure 5 is
meshed and discretized into elements for FEA
simulation in Thermoelectromechanical module. Figure
5 shows the 3D model of the diaphragm before and after
meshed.
Figure 4: Diaphragm with fixed boundary
Figure 5: 3D diaphragm model (a) before meshed and (b) after
meshed
Two types of diaphragm materials are used to
compare the performance of the diaphragm. The
materials used are polyimide and silicon nitride. The
comparison of material properties between silicon nitride
and polyimide is shown in Table 2. Since the diaphragm
is designed to detect the pulse pressure, it is loaded with
the pressure range from 0 to 300mmHg as presented in
Table 1[2].
The diaphragm radius and diaphragm thickness
Reflective metal layer
Fixed
Boundary
M
E S
H
(a)
(b)
WSEAS TRANSACTIONS on ELECTRONICS K. Hasikin, N. Soin, F. Ibrahim
ISSN: 1109-9445 451 Issue 11, Volume 5, November 2008
are also varied in order to study their effects on
diaphragm’s behavior. The best model will be chosen.
Table 2: Material Properties of Silicon Nitride and Polyimide
Material Properties Silicon
Nitride
Polyimide
Young’s Modulus (GPa) 270 7.5
Poisson Ratio 0.27 0.35
Thermal Conductivity (W/cm/C) 0.032 8.06x10⁶
Specific Heat (J/gC) 0.71 4.21
Electrical Resistivity (Ωcm) 0.6 1x10¹⁶
Dielectric Constant 7.5 3.4
Density (g/cm3
) 3.44 1.33
Coefficient of Thermal Expansion
(/°C) 2810x10
7 810x10
7
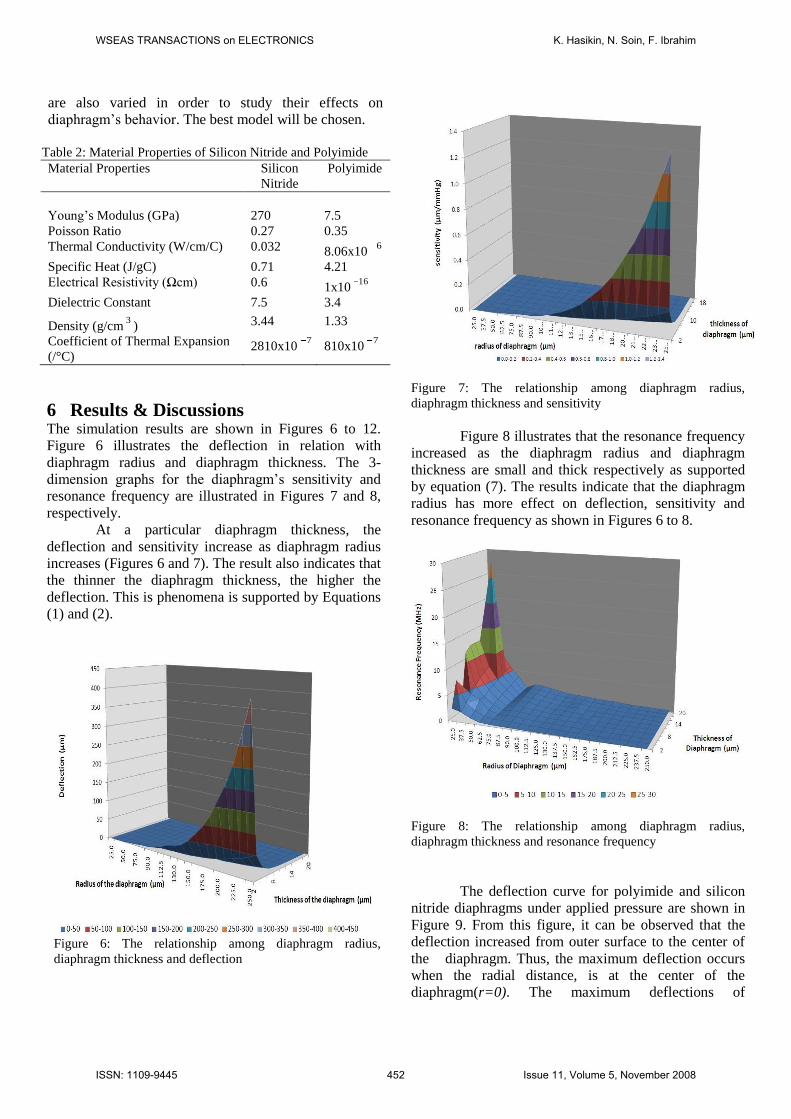
6 Results & Discussions The simulation results are shown in Figures 6 to 12.
Figure 6 illustrates the deflection in relation with
diaphragm radius and diaphragm thickness. The 3-
dimension graphs for the diaphragm’s sensitivity and
resonance frequency are illustrated in Figures 7 and 8,
respectively.
At a particular diaphragm thickness, the
deflection and sensitivity increase as diaphragm radius
increases (Figures 6 and 7). The result also indicates that
the thinner the diaphragm thickness, the higher the
deflection. This is phenomena is supported by Equations
(1) and (2).
Figure 6: The relationship among diaphragm radius,
diaphragm thickness and deflection
Figure 7: The relationship among diaphragm radius,
diaphragm thickness and sensitivity
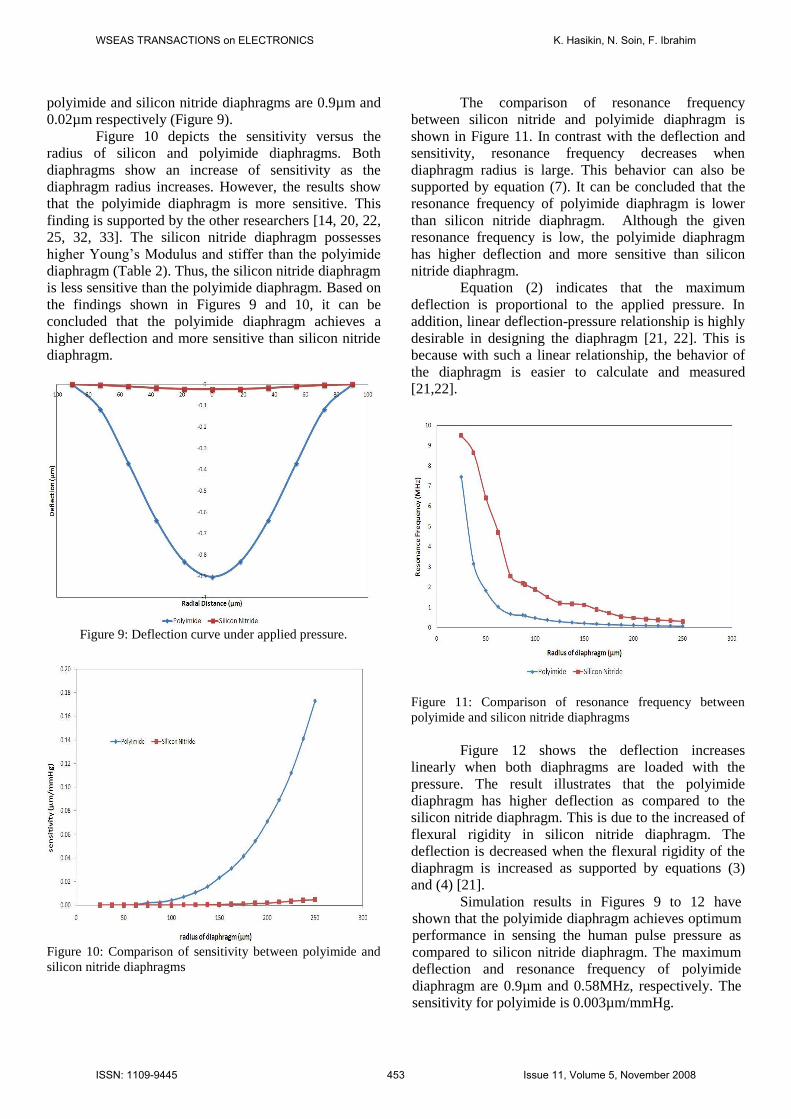
Figure 8 illustrates that the resonance frequency
increased as the diaphragm radius and diaphragm
thickness are small and thick respectively as supported
by equation (7). The results indicate that the diaphragm
radius has more effect on deflection, sensitivity and
resonance frequency as shown in Figures 6 to 8.
Figure 8: The relationship among diaphragm radius,
diaphragm thickness and resonance frequency
The deflection curve for polyimide and silicon
nitride diaphragms under applied pressure are shown in
Figure 9. From this figure, it can be observed that the
deflection increased from outer surface to the center of
the diaphragm. Thus, the maximum deflection occurs
when the radial distance, is at the center of the
diaphragm(r=0). The maximum deflections of
WSEAS TRANSACTIONS on ELECTRONICS K. Hasikin, N. Soin, F. Ibrahim
ISSN: 1109-9445 452 Issue 11, Volume 5, November 2008
polyimide and silicon nitride diaphragms are 0.9µm and
0.02µm respectively (Figure 9).
Figure 10 depicts the sensitivity versus the
radius of silicon and polyimide diaphragms. Both
diaphragms show an increase of sensitivity as the
diaphragm radius increases. However, the results show
that the polyimide diaphragm is more sensitive. This
finding is supported by the other researchers [14, 20, 22,
25, 32, 33]. The silicon nitride diaphragm possesses
higher Young’s Modulus and stiffer than the polyimide
diaphragm (Table 2). Thus, the silicon nitride diaphragm
is less sensitive than the polyimide diaphragm. Based on
the findings shown in Figures 9 and 10, it can be
concluded that the polyimide diaphragm achieves a
higher deflection and more sensitive than silicon nitride
diaphragm.
Figure 9: Deflection curve under applied pressure.
Figure 10: Comparison of sensitivity between polyimide and
silicon nitride diaphragms
The comparison of resonance frequency
between silicon nitride and polyimide diaphragm is
shown in Figure 11. In contrast with the deflection and
sensitivity, resonance frequency decreases when
diaphragm radius is large. This behavior can also be
supported by equation (7). It can be concluded that the
resonance frequency of polyimide diaphragm is lower
than silicon nitride diaphragm. Although the given
resonance frequency is low, the polyimide diaphragm
has higher deflection and more sensitive than silicon
nitride diaphragm.
Equation (2) indicates that the maximum
deflection is proportional to the applied pressure. In
addition, linear deflection-pressure relationship is highly
desirable in designing the diaphragm [21, 22]. This is
because with such a linear relationship, the behavior of
the diaphragm is easier to calculate and measured
[21,22].
Figure 11: Comparison of resonance frequency between
polyimide and silicon nitride diaphragms
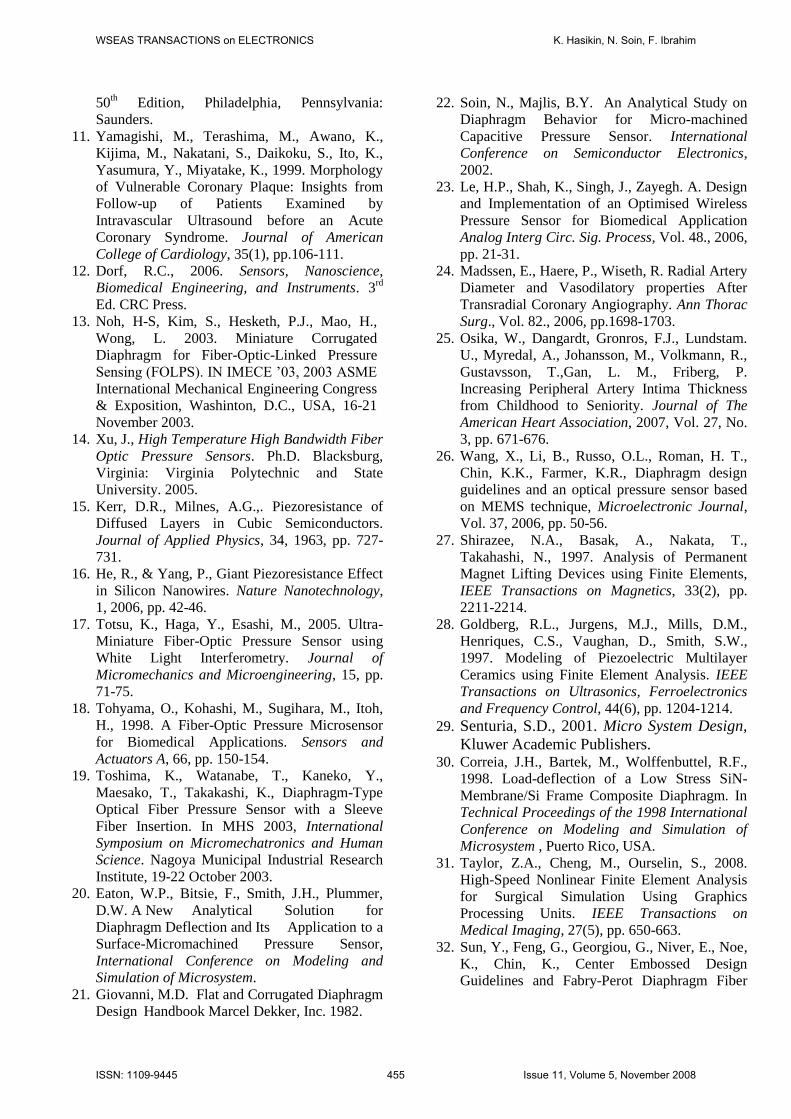
Figure 12 shows the deflection increases
linearly when both diaphragms are loaded with the
pressure. The result illustrates that the polyimide
diaphragm has higher deflection as compared to the
silicon nitride diaphragm. This is due to the increased of
flexural rigidity in silicon nitride diaphragm. The
deflection is decreased when the flexural rigidity of the
diaphragm is increased as supported by equations (3)
and (4) [21].
Simulation results in Figures 9 to 12 have
shown that the polyimide diaphragm achieves optimum
performance in sensing the human pulse pressure as
compared to silicon nitride diaphragm. The maximum
deflection and resonance frequency of polyimide
diaphragm are 0.9µm and 0.58MHz, respectively. The
sensitivity for polyimide is 0.003µm/mmHg.
WSEAS TRANSACTIONS on ELECTRONICS K. Hasikin, N. Soin, F. Ibrahim
ISSN: 1109-9445 453 Issue 11, Volume 5, November 2008
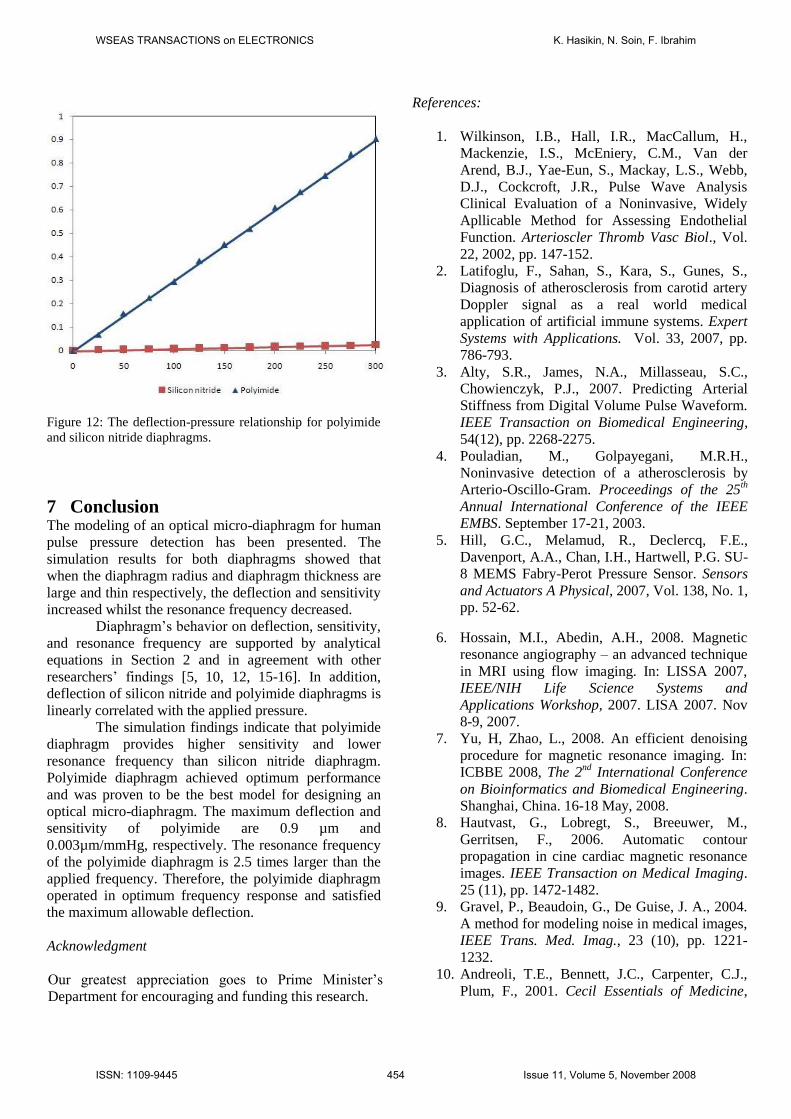
Figure 12: The deflection-pressure relationship for polyimide
and silicon nitride diaphragms.
7 Conclusion The modeling of an optical micro-diaphragm for human
pulse pressure detection has been presented. The
simulation results for both diaphragms showed that
when the diaphragm radius and diaphragm thickness are
large and thin respectively, the deflection and sensitivity
increased whilst the resonance frequency decreased.
Diaphragm’s behavior on deflection, sensitivity,
and resonance frequency are supported by analytical
equations in Section 2 and in agreement with other
researchers’ findings [5, 10, 12, 15-16]. In addition,
deflection of silicon nitride and polyimide diaphragms is
linearly correlated with the applied pressure.
The simulation findings indicate that polyimide
diaphragm provides higher sensitivity and lower
resonance frequency than silicon nitride diaphragm.
Polyimide diaphragm achieved optimum performance
and was proven to be the best model for designing an
optical micro-diaphragm. The maximum deflection and
sensitivity of polyimide are 0.9 µm and
0.003µm/mmHg, respectively. The resonance frequency
of the polyimide diaphragm is 2.5 times larger than the
applied frequency. Therefore, the polyimide diaphragm
operated in optimum frequency response and satisfied
the maximum allowable deflection.
Acknowledgment
Our greatest appreciation goes to Prime Minister’s
Department for encouraging and funding this research.
References:
1. Wilkinson, I.B., Hall, I.R., MacCallum, H.,
Mackenzie, I.S., McEniery, C.M., Van der
Arend, B.J., Yae-Eun, S., Mackay, L.S., Webb,
D.J., Cockcroft, J.R., Pulse Wave Analysis
Clinical Evaluation of a Noninvasive, Widely
Apllicable Method for Assessing Endothelial
Function. Arterioscler Thromb Vasc Biol., Vol.
22, 2002, pp. 147-152.
2. Latifoglu, F., Sahan, S., Kara, S., Gunes, S.,
Diagnosis of atherosclerosis from carotid artery
Doppler signal as a real world medical
application of artificial immune systems. Expert
Systems with Applications. Vol. 33, 2007, pp.
786-793.
3. Alty, S.R., James, N.A., Millasseau, S.C.,
Chowienczyk, P.J., 2007. Predicting Arterial
Stiffness from Digital Volume Pulse Waveform.
IEEE Transaction on Biomedical Engineering,
54(12), pp. 2268-2275.
4. Pouladian, M., Golpayegani, M.R.H.,
Noninvasive detection of a atherosclerosis by
Arterio-Oscillo-Gram. Proceedings of the 25th
Annual International Conference of the IEEE
EMBS. September 17-21, 2003.
5. Hill, G.C., Melamud, R., Declercq, F.E.,
Davenport, A.A., Chan, I.H., Hartwell, P.G. SU-
8 MEMS Fabry-Perot Pressure Sensor. Sensors
and Actuators A Physical, 2007, Vol. 138, No. 1,
pp. 52-62.
6. Hossain, M.I., Abedin, A.H., 2008. Magnetic
resonance angiography – an advanced technique
in MRI using flow imaging. In: LISSA 2007,
IEEE/NIH Life Science Systems and
Applications Workshop, 2007. LISA 2007. Nov
8-9, 2007.
7. Yu, H, Zhao, L., 2008. An efficient denoising
procedure for magnetic resonance imaging. In:
ICBBE 2008, The 2nd
International Conference
on Bioinformatics and Biomedical Engineering.
Shanghai, China. 16-18 May, 2008.
8. Hautvast, G., Lobregt, S., Breeuwer, M.,
Gerritsen, F., 2006. Automatic contour
propagation in cine cardiac magnetic resonance
images. IEEE Transaction on Medical Imaging.
25 (11), pp. 1472-1482.
9. Gravel, P., Beaudoin, G., De Guise, J. A., 2004.
A method for modeling noise in medical images,
IEEE Trans. Med. Imag., 23 (10), pp. 1221-
1232.
10. Andreoli, T.E., Bennett, J.C., Carpenter, C.J.,
Plum, F., 2001. Cecil Essentials of Medicine,
WSEAS TRANSACTIONS on ELECTRONICS K. Hasikin, N. Soin, F. Ibrahim
ISSN: 1109-9445 454 Issue 11, Volume 5, November 2008
50th Edition, Philadelphia, Pennsylvania:
Saunders.
11. Yamagishi, M., Terashima, M., Awano, K.,
Kijima, M., Nakatani, S., Daikoku, S., Ito, K.,
Yasumura, Y., Miyatake, K., 1999. Morphology
of Vulnerable Coronary Plaque: Insights from
Follow-up of Patients Examined by
Intravascular Ultrasound before an Acute
Coronary Syndrome. Journal of American
College of Cardiology, 35(1), pp.106-111.
12. Dorf, R.C., 2006. Sensors, Nanoscience,
Biomedical Engineering, and Instruments. 3rd
Ed. CRC Press.
13. Noh, H-S, Kim, S., Hesketh, P.J., Mao, H.,
Wong, L. 2003. Miniature Corrugated
Diaphragm for Fiber-Optic-Linked Pressure
Sensing (FOLPS). IN IMECE ’03, 2003 ASME
International Mechanical Engineering Congress
& Exposition, Washinton, D.C., USA, 16-21
November 2003.
14. Xu, J., High Temperature High Bandwidth Fiber
Optic Pressure Sensors. Ph.D. Blacksburg,
Virginia: Virginia Polytechnic and State
University. 2005.
15. Kerr, D.R., Milnes, A.G.,. Piezoresistance of
Diffused Layers in Cubic Semiconductors.
Journal of Applied Physics, 34, 1963, pp. 727-
731.
16. He, R., & Yang, P., Giant Piezoresistance Effect
in Silicon Nanowires. Nature Nanotechnology,
1, 2006, pp. 42-46.
17. Totsu, K., Haga, Y., Esashi, M., 2005. Ultra-
Miniature Fiber-Optic Pressure Sensor using
White Light Interferometry. Journal of
Micromechanics and Microengineering, 15, pp.
71-75.
18. Tohyama, O., Kohashi, M., Sugihara, M., Itoh,
H., 1998. A Fiber-Optic Pressure Microsensor
for Biomedical Applications. Sensors and
Actuators A, 66, pp. 150-154.
19. Toshima, K., Watanabe, T., Kaneko, Y.,
Maesako, T., Takakashi, K., Diaphragm-Type
Optical Fiber Pressure Sensor with a Sleeve
Fiber Insertion. In MHS 2003, International
Symposium on Micromechatronics and Human
Science. Nagoya Municipal Industrial Research
Institute, 19-22 October 2003.
20. Eaton, W.P., Bitsie, F., Smith, J.H., Plummer,
D.W. A New Analytical Solution for
Diaphragm Deflection and Its Application to a
Surface-Micromachined Pressure Sensor,
International Conference on Modeling and
Simulation of Microsystem.
21. Giovanni, M.D. Flat and Corrugated Diaphragm
Design Handbook Marcel Dekker, Inc. 1982.
22. Soin, N., Majlis, B.Y. An Analytical Study on
Diaphragm Behavior for Micro-machined
Capacitive Pressure Sensor. International
Conference on Semiconductor Electronics,
2002.
23. Le, H.P., Shah, K., Singh, J., Zayegh. A. Design
and Implementation of an Optimised Wireless
Pressure Sensor for Biomedical Application
Analog Interg Circ. Sig. Process, Vol. 48., 2006,
pp. 21-31.
24. Madssen, E., Haere, P., Wiseth, R. Radial Artery
Diameter and Vasodilatory properties After
Transradial Coronary Angiography. Ann Thorac
Surg., Vol. 82., 2006, pp.1698-1703.
25. Osika, W., Dangardt, Gronros, F.J., Lundstam.
U., Myredal, A., Johansson, M., Volkmann, R.,
Gustavsson, T.,Gan, L. M., Friberg, P.
Increasing Peripheral Artery Intima Thickness
from Childhood to Seniority. Journal of The
American Heart Association, 2007, Vol. 27, No.
3, pp. 671-676.
26. Wang, X., Li, B., Russo, O.L., Roman, H. T.,
Chin, K.K., Farmer, K.R., Diaphragm design
guidelines and an optical pressure sensor based
on MEMS technique, Microelectronic Journal,
Vol. 37, 2006, pp. 50-56.
27. Shirazee, N.A., Basak, A., Nakata, T.,
Takahashi, N., 1997. Analysis of Permanent
Magnet Lifting Devices using Finite Elements,
IEEE Transactions on Magnetics, 33(2), pp.
2211-2214.
28. Goldberg, R.L., Jurgens, M.J., Mills, D.M.,
Henriques, C.S., Vaughan, D., Smith, S.W.,
1997. Modeling of Piezoelectric Multilayer
Ceramics using Finite Element Analysis. IEEE
Transactions on Ultrasonics, Ferroelectronics
and Frequency Control, 44(6), pp. 1204-1214.
29. Senturia, S.D., 2001. Micro System Design,
Kluwer Academic Publishers. 30. Correia, J.H., Bartek, M., Wolffenbuttel, R.F.,
1998. Load-deflection of a Low Stress SiN-
Membrane/Si Frame Composite Diaphragm. In
Technical Proceedings of the 1998 International
Conference on Modeling and Simulation of
Microsystem , Puerto Rico, USA.
31. Taylor, Z.A., Cheng, M., Ourselin, S., 2008.
High-Speed Nonlinear Finite Element Analysis
for Surgical Simulation Using Graphics
Processing Units. IEEE Transactions on
Medical Imaging, 27(5), pp. 650-663.
32. Sun, Y., Feng, G., Georgiou, G., Niver, E., Noe,
K., Chin, K., Center Embossed Design
Guidelines and Fabry-Perot Diaphragm Fiber
WSEAS TRANSACTIONS on ELECTRONICS K. Hasikin, N. Soin, F. Ibrahim
ISSN: 1109-9445 455 Issue 11, Volume 5, November 2008

Optic Sensor. Microelectronic Journal, Vol. 39,
2008. pp. 711-716
33. Hasikin, K., Ibrahim, F., Soin, N.
Determination of design parameters for human
artery pulse wave detection, In IFMBE 4th
International Conference on Biomedical
Engineering, Kuala Lumpur, 25-28 June 2008.
34. Xiao-qi, N., Ming, W., Xu-xing C., Yi-xian, G
and Hua R., An Optical Fiber MEMS Pressure
Sensor Using Dual-Wavelength Interrogation.
Measurement science and technology, Vol. 17,
No. 9, 2006, pp 2401- 2404.
WSEAS TRANSACTIONS on ELECTRONICS K. Hasikin, N. Soin, F. Ibrahim
ISSN: 1109-9445 456 Issue 11, Volume 5, November 2008