modeling of hydrocarbon potential and … · sandstone and the overlying marine fika shale. ... it...
TRANSCRIPT
Oil Shale, 2012, Vol. 29, No. 2, pp. 151–172 ISSN 0208-189X doi: 10.3176/oil.2012.2.05 © 2012 Estonian Academy Publishers
MODELING OF HYDROCARBON POTENTIAL AND THERMAL MATURITY OF GONGILA SHALE, CHAD BASIN, NORTHEASTERN NIGERIA
ADEKUNLE ABRAHAM ADEPELUMI∗ , OLATUNBOSUN ADEDAYO ALAO, BANKOLE DAYO AKO, RITA EBERE OSEIKPE Department of Geology, Obafemi Awolowo University, Ile-Ife, Osun State, Nigeria
Abstract. The Bornu Basin, which represents a part of the Chad Basin in Nigeria, makes one-tenth of the total area of the Chad Basin that extends to the Republic of Niger, Chad and Cameroun. This basin is a sediment-filled broad depression straddling northeastern Nigeria and adjoining parts of the Republic of Chad. The cumulative thickness of the sedimentary rocks exceeds 3,600 metres. The Nigerian share of the Chad Basin is supposed to be a poten-tial hydrocarbon-producing basin. This is because commercial petroleum accumulations totalling over 120 billion barrels have been discovered in some parts of the basin outside Nigeria (largely in the Republic of Chad) in structurally related contiguous basins. The Gongila Formation (in the Chad Basin) is a transitional sequence between the underlying continental Bima sandstone and the overlying marine Fika shale. Determining whether the shale beds present in the Gongila Formation are matured enough to generate hydrocarbons, nine wells were used and the petro-physical parameters such as total organic carbon (TOC) and total organic matter (TOM) were calculated for each of the wells. The heat flow history of the basin was calculated by establishing the relationship between the modeled thermal maturity curve and the equivalent observed maturity parameter (vitrinite reflectance). Thereafter this calculated heat flow is used to predict thermal maturity of source rocks and the timing of hydrocarbon generation. The result obtained reveals that TOC and TOM of shale sequences in each well range from 3.58 to 27.48 wt% and from 1.15 to 8.79 wt%, respectively. Thus, TOC of the Gongila Formation exceeds the kerogen threshold of 0.5 wt% for the generation of hydrocarbons while TOM exceeds the kerogen threshold of 1 wt%. The heat flow was computed from the heat generation and was estimated to range between 33 and 75 mW/m2. The modeled vitrinite reflectance ranges between 0.56 and 0.76%Ro. It is concluded that the Gongila shale is a potential petroleum source rock. The temperature history is the factor controlling the maturation of organic compounds into fossil fuels. The Gongila Formation’s thermal maturity,
∗ Corresponding author: e-mail [email protected]

Adekunle Abraham Adepelumi et al.
152
assessed on the basis of vitrinite reflectance, indicates that the shale sequences in this formation are within the early oil window and thermally matured for hydrocarbon generation. Keywords: petrophysics, hydrocarbons, Gongila shale, Chad Basin, Nigeria.
1. Introduction
The Bornu Basin which represents the Chad Basin in Nigeria is one-tenth of the total areal of the Chad Basin that extends to the Republic of Niger, Chad and Cameroun. It is a part of the Western Central African Rift System (WCAS) that formed in response to the tectonic separation of the African crustal blocks in the Cretaceous [1]. This basin is a broad sediment-filled depression straddling northeastern Nigeria and adjoining parts of the Republic of Chad. The cumulative thickness of the sedimentary rocks exceeds 3,600 metres, and the rocks consist of a thick basal continental sequence of sandstone (Bima sandstone) overlaid by a transitional sequence of sandstone, shale and limestone beds (the Gongila Formation) followed by a thick succession of Quaternary limnic, fluviatile and eolian sands and clays (the Fika Formation). The Bima Formation is the oldest stratigraphic unit in the basin deposited under continental conditions. The formation consists of thin to thick beds of fine to coarse-grained sandstone of variable colour from white, brown, and reddish brown to grey. The coarse-grained textures are more common towards the bottom. Thin bands of clay and siltstone varying in colour from red to grey or brown occur as intercalations with the sand-stone. The formation is feldspathic towards the bottom. Also, this formation lies unconformably on the Basement Complex; it derived from the degrada-tion of the basement rocks and represents the upper part of the Continental Intercalaire in Nigeria. The formation is diachronous and probably of the Albian-Turonian Age. Furthermore, the Gongila Formation is a transitional sequence between the underlying continental Bima sandstone and the over-laying marine Fika shale [2]. The Gongila Formation is regarded as transi-tional deposits that accompanied marine incursions into the basin. The forma-tion consists of a sequence of sandstones, clays, shales and limestone layers. It varies laterally in lithology and contains massive grey limestones overlaid by sandstones, siltstones, mudstones, shales, thin limestones (the limestone horizons are richly fossiliferous) and shales with shelly limestones. The sand-stone texture varies from fine to coarse-grained. Volcanic intrusives which occurred as diorite sills are present at several horizons of the formation. The formation has been assigned to be of the Turonian Age [3].
According to [2], the marine transgression, which started in the late Albian, reached its peak in the Turonian, during which time the entire basin was inundated. However, during the Turonian bluish-black, ammonite-rich, open-marine shales (the Fika Formation) were deposited, and this sedimenta-tion extended into the late Senonian. The Fika Formation is a fully marine

Modeling of Hydrocarbon Potential and Thermal Maturity of Gongila Shale...
153
unit. This formation consists of blue-grey shale, occasionally gypsiferous, with intercalation of limestone horizons. Volcanic intrusives which occur as diorite sills are also present in several horizons of the formation. The formation is diachronous and has been assigned to be of the Turonian-Maastrichtian Age. The Turonian-Senonian was succeeded by a regressive phase.
The Nigerian area of the Chad Basin (especially the Gongila Formation) is supposed to be a prolific hydrocarbon-producing basin, because the Termit Basin in Chad and Niger republics, which has the same geology as that of the Bornu Basin, has been producing hydrocarbons for some time now.
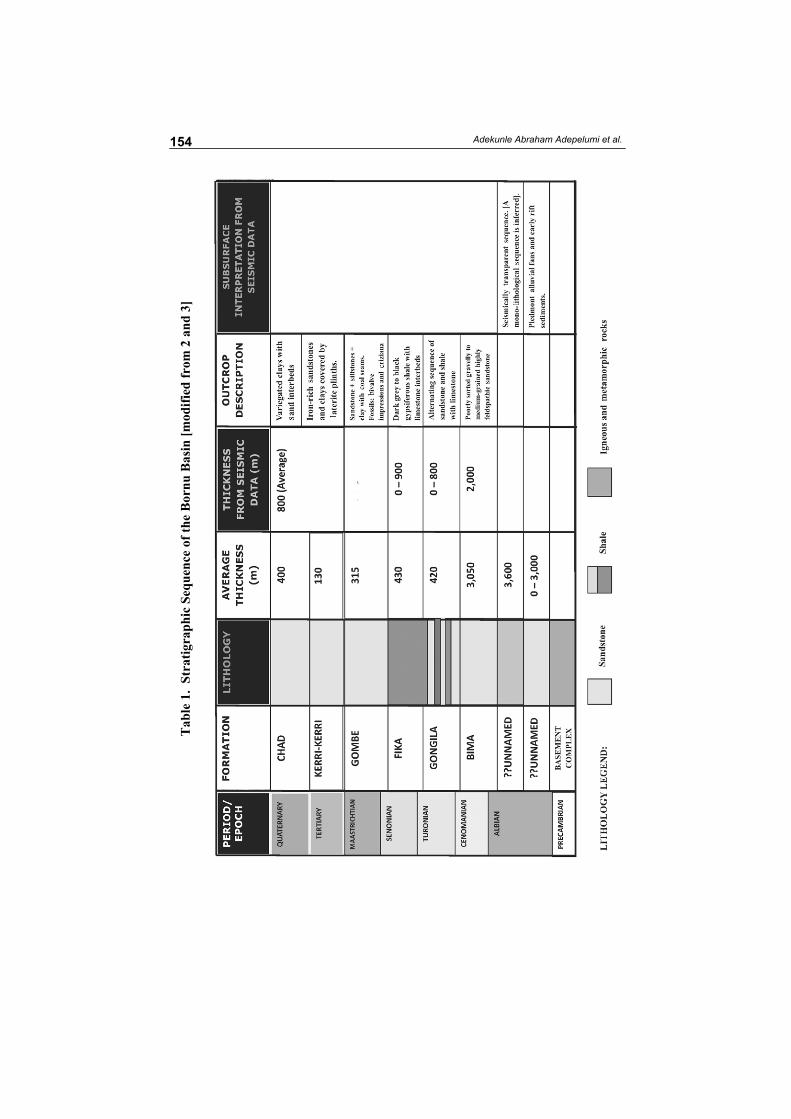
Amongst the six stratigraphic units recognized in this basin, the Gongila Formation is a transitional sequence between the underlying continental Bima sandstone and the overlying marine Fika shale (Table 1). The forma-tion consists of thin to moderately thick interbeds of shales, silty sandstone and sandstone. The shale is grey to dark grey while the sandstone is of variable color from brown, white, yellow, and purple to grey [3].
The Gongila Formation has been investigated using petrophysical techniques to estimate the hydrocarbon potential of the shales present in the formation.
A petroleum source rock is defined as a unit of rock that has generated or expelled oil or gas in sufficient quantity to form commercial accumula-tion. Source rocks are commonly shales and limestones that contain organic matter. The organic matter may be derived from aquatic organisms and bacteria [4], in which case it is commonly called kerogenous, or from land plants, in which case such material is referred to as humic [5]. The use of petrophysical techniques arises out of the need to assess source rocks for basin studies in various geological settings, where the database is restricted to basic log data and little or no geochemical information is available, and to provide an integrated “running” assessment of source capability for volu-metric determinations [6]. In source rock analysis, total organic carbon (TOC) present in a potential source rock is very important because it significantly affects the response of various well logs. The factor control-ling thermal maturation of organic compound into fossil fuels is tempera-ture [3].
Source rock formations generally show a lower density, a lower sonic transit time, and a higher resistivity than other sediments of equal compac-tion and comparable mineralogy. This phenomenon can be used to identify source rocks on wireline logs (e.g. density (FDC), sonic, resistivity and gamma ray logs) provided the source rocks have a minimum thickness within the resolution of the sondes used and are sufficiently rich in organic matter [7].
Since the most complete and readily available well data is the suite of logs comprised of density, sonic, resistivity and gamma ray logs, it seemed desirable to investigate the possibility that source rocks might be recogniz-able from these logs. In this work, the relation between rock density, gamma
Adekunle Abraham Adepelumi et al.
154
Tab
le 1
. St
ratig
raph
ic S
eque
nce
of th
e B
ornu
Bas
in [m
odifi
ed fr
om 2
and
3]

Modeling of Hydrocarbon Potential and Thermal Maturity of Gongila Shale...
155
ray and rock porosity logs as established by Schmoker [6] for determining the TOC value of a unit was employed for the investigation of the total organic matter (TOM) and TOC content of some intercalations of shale in the Gongila Formation, which is suspected to produce hydrocarbons in commercial quantity. The minimum concentration of organic carbon content required for a source rock to become a source of commercial hydrocarbon accumulations has frequently been stated to be 0.5 wt% [8].
Burial history and thermal maturity models of possible source rock sequences were obtained by using well logs to estimate heat generation. The best logs for estimating heat generation are derived from the natural gamma spectrometer (NGS) tool. Rybach [9] developed a simple relationship between heat generation and the natural gamma log (GR (API units)), to be used in case when electric well logs are available. Thermal maturity of source rock is modeled basing on heat flow and is expressed in terms of vitrinite reflectance. Vitrinite reflectance is an indicator of the cumulative time and temperature history of the sediments. Vitrinite reflectance can indicate whether hydrocarbon generation could have been occurred and suggest the types of hydrocarbons that may have been formed. Maturity inferences from vitrinite reflectance can help to identify which source rocks are potential contributors to a petroleum system. In addition, vitrinite reflectance can be used in basin modeling to tell whether the modeled thermal history is reasonable [10].
The success of any exploration activity depends on proper assessment of the presence of effective source rock and of the hydrocarbon volume generated and expelled in an area. Thus, modeling of the petroleum system is an effective way to examine the dynamics of sedimentary basins and of the fluids in them, as well as past conditions suitable for hydrocarbons’ generation and expulsion. In addition to understanding these phenomena, thermal maturity modeling can address questions relating to maturation tim-ing, transformation, migration and accumulation of hydrocarbons by con-sidering geologically plausible range of thermal and geochemical parameters [11–13].
2. Geology of the Chad Basin
The Nigerian sector of the Chad Basin, known locally as the Bornu Basin, is one of Nigeria’s inland basins occupying the northeastern part of the country. The Bornu Basin is a part of the Western Central African Rift System (WCAS) [10]. Gravimetric studies carried out on the Benue Trough and the Bornu Basin [14–16] have shown the presence of a NE-SW striking positive gravity anomaly.
The Bornu Basin is a sediment-filled broad depression straddling North-eastern Nigeria and adjoining parts of the Republic of Chad (Fig. 1). It is separated from the upper Benue Basin by the Zambuk Ridge. Cumulative

Adekunle Abraham Adepelumi et al.
156
thickness of the sedimentary rocks is over 3,600 meters, and rocks consist of a thick basal continental sequence overlaid by transitional beds followed by a thick succession of Quaternary limnic, fluviatile and eolian sands and clays. Outcrops of older beds are rare, as they are in most parts covered with desert-blown sediments. The oldest rocks in the Bornu Basin belong to Bima sandstone and the youngest to the Chad Formation (Table 1). The dominant folds in the Bornu Basin are the Dumbulwa anticline and the Mutwe syncline of NW-SE trend. The Nigerian National Petroleum Corporation (NNPC) has shot several kilometers of seismic lines and also drilled many wildcat wells for the exploration of hydrocarbons in the basin.
Fig. 1. Geological map of Nigeria showing the location of the Nigerian sector of the Chad Basin (Bornu Basin).
3. Methodology
This work is the first attempt to model thermal maturity of the Gongila Formation. It is aimed at reconstructing temporal evolution of the Bornu sedimentary basin in order to make quantitative assumptions of possible

Modeling of Hydrocarbon Potential and Thermal Maturity of Gongila Shale...
157
geological phenomena leading to hydrocarbons’ accumulation in the basin. For this purpose, 1-D modeling algorithm was used to simulate the thermal history and the maturation of the organic matter and the content of the Gongila Formation. In the context of a sedimentary basin, the 1-D approach is satisfactory for these purposes because thermal transfers were considered to be mostly vertical and thermal convective transfers are assumed to be negligible.
The correlation of the shale intervals across the selected wells and the computation of relevant petrophysical parameters needed for calculation of TOC were done using the Landmark Geographix software. TOM was then computed from TOC using a correction factor of 0.32 [17].
The TOC map over the study area was generated using the SurferTM soft-ware. The gamma ray log was used to compute heat generation (A) in the formation, which was then converted to heat flow (Q). The computed heat flow values were used as input parameters to model the Gongila Formation using the PetroModTM 1-D Express software. In this particular study, the EASY %Ro was used to compute profiles of the percentage of vitrinite reflectance (%Ro) with depth for all the well data and to optimize the thermal history models of the Gongila Formation. Because of its use as an indicator of thermal maturity, vitrinite reflectance has become a widely used tool in integrated basin analysis and in the exploration for oil and gas [5]. The Surfer TM software was further used to generate the map of maturity index of the area using the computed vitrinite reflectance maturation algorithm called EASY %Ro. The EASY %Ro may be applied over a range of vitrinite reflectance values (%Ro) of about 0.3 to 4.5%.
The data used for this study was obtained from the Nigerian National Petroleum Corporation database available in the Department of Geology, Obafemi Awolowo University, Ile-Ife. This data include a suite of well log data available from twenty-three (23) wells in the Bornu Basin, out of which nine wells – Kinasar, Kuchali, Faltu, Wadi, Ngamma-East, Tuma, Murshe, Krumta and Ziye – were selected for this study. These nine wells were selected because this research focused on the Gongila Formation located in the southern and northeastern part of the investigated area.
The composite logs used for this study consist of the following logs: lithologic logs (spontaneous potential and gamma ray), resistivity logs (induction and electrode logs), porosity logs (bulk density, neutron and sonic logs) and caliper logs. An example of the log is shown in Fig. 2.
The total organic carbon present in selected shale intervals in the Gongila Formation was calculated using the Schmoker and Hester’s equation [18] as follows:
154.497TOC(wt%) 57.261,bp
= −
(1)
where TOC is the total organic carbon percent weight, wt%, pb is the bulk formation density as measured by density logs.

Adekunle Abraham Adepelumi et al.
158
Fig.
2. T
ypic
al w
ell l
ogs u
sed
for t
his s
tudy
show
ing
the
gam
ma
ray
and
resi
stiv
ity lo
gs.

Modeling of Hydrocarbon Potential and Thermal Maturity of Gongila Shale...
159
The result obtained for TOC was then converted to TOM values by means of a correction factor of 0.32 (for ancient sediments), that is, the obtained TOC values were multiplied by 0.32 to give the TOM values for the points of interest. This methodology was proposed by Schmoker [6] and has been successfully applied for various sedimentary basins of the world.
Peters [8] classified the potential of source rocks on the basis of organic carbon content, as shown in Table 2 below:
Table 2. Interpretation of source richness basing on weight percent of TOC [8]
Richness TOC, wt.%
Poor 0.0–0.5 Fair 0.5–1.0 Good 1.0–2.0 Very good >2.0
3.1. Heat generation and heat flow
Generally, high heat generation results in a decrease in heat flow with the depth – a result similar to poor compaction modeling [19]. Till date, heat generation within sediments is poorly constrained, not well understood and not extensively investigated. Ryback [9] derived an empirical relationship between the fractional proportion of quartz in the matrix (FQ) and heat generation (A) measured in sedimentary rocks from the Labrador Shelf whose heat generation (A) equation is given as
0.96( ) 1.29,A FQ= − + (2)
where A is heat generation, µWm–3. Thus, in order to determine the applicability of Eq. 2 to the Bornu Basin,
A was plotted against RHOB × GR. Figure 2 shows a good linear fit between three parameters plotted. This presumes a good correlation between heat generation (A), a product of the formation bulk density (RHOB) in g/cc and the natural gamma log (GR) in the API unit. The cross-plot of A versus RHOB × GR of the Bornu Basin (Fig. 2) indicated that the gradient (m = 0.006) was relatively constant for all the wells. Therefore, heat generation equation for the Chad Basin can be re-written as Eq. 3 instead of the generalized Eq. 2:
0.006 RHOB×GR.A = × (3)
Since the cross-plot yields gradients very similar to East Yeeda 1, it supports the assumption that the relationship holds across the regional scale in the Bornu Basin.
The standard relationship between heat flow (Q), and heat generation (Ao) proposed by Rybach [9] for the petroliferous sedimentary basins around the

Adekunle Abraham Adepelumi et al.
160
world was adopted for this study and used to compute heat flow (Q) for the studied area in the Bornu Basin. This relationship is given as
o ,Q q A D= + (4)
where Q – is heat flow, Ao – heat generation, q and D – constant components of heat flow.
Globally, q averages about 27 mWm–2 and ranges from 18 to 33 mWm–2. D averages about 10 km and ranges from 4.5 to 16 km according to [9, 19, 20]. For all the wells investigated in this study, the heat generation (Ao) values obtained for each well using Eq. 3 were used as input into Eq. 4 to derive heat flow (Q), while the average values of D = 10 km and q = 27 mWm–2 were assumed for this study.
4. Results and discussion 4.1. Modeling of thermal maturity and burial history
The heat flow history of a basin is calculated by establishing an agreement between a calculated (or modeled) maturity curve and the equivalent determined maturity parameter (such as vitrinite reflectance). This calculated heat flow can then be used to presume thermal maturity of source rocks and timing of hydrocarbon generation (Table 3). Heat generation as well as heat flow were determined from the gamma ray log using Eq. 3 which is the modified version of the empirical relationship given by Bucker and Rybach [20]. The values of density from the RHOB log, and the gamma ray readings at the point of interest, multiplied by the proportionality constant, which is 0.006 for this study, gives the heat generation value for a specific point. The computed heat flow values which range from 47.95 to 65.64 mWm–2 were used as the input parameters for the PetroMod modeling software to model thermal maturity of the Gongila Formation and to ascertain the level of maturity of the shale intercalations present in the Gongila Formation as well as to determine the hydrocarbon generating potential of the formation.
The gamma-ray log was used to identify the shale interval present in the Gongila Formation and the intervals in the nine wells were compared to give an idea of the possible continuity of the potential source rocks at different
Table 3. Vitrinite reflectance and hydrocarbon generation [13]
Oil-prone generation Gas-prone generation
Generation stage Ro, % Generation stage Ro, %
Immature <0.6 Immature <0.8 Early oil 0.6–0.8 Early gas 0.8–1.2 Peak oil 0.8–1.0 Peak gas 1.2–2.0 Late oil 1.0–1.35 Late gas >2.0 Wet gas 1.35–2.0 Dry gas >2.0

Modeling of Hydrocarbon Potential and Thermal Maturity of Gongila Shale...
161
depths in the area. Petrophysical parameters were calculated for each shale interval in each selected well (Tables 4–12).
Table 4. Average petrophysical parameters for the well Faltu-1
Shale intervals Depth range Thickness, m IGR Vsh Ød TOC, wt% TOM, wt% Shale 1 1894–1959 65 0.504 0.230 0.221 10.935 3.499 Shale 2 2066–2103 37 0.595 0.285 0.200 10.193 3.261 Shale 3 2343–2353 10 0.696 0.509 0.194 9.168 2.933
Table 5. Average petrophysical parameters for the well Kinasar-1
Shale intervals Depth range Thickness, m IGR Vsh Ød TOC, wt% TOM, wt%
Shale 1 1807–1828 21 0.392 0.147 0.186 9.148 2.927 Shale 2 1844–1874 30 0.350 0.129 0.103 5.119 1.638 Shale 3 2148–2170 22 0.225 0.066 0.174 8.189 2.620
Table 6. Average petrophysical parameters for the well Krumta-1
Table 7. Average petrophysical parameters for the well Kutchali-1
Table 8. Average petrophysical parameters for the well Wadi-1
Table 9. Average petrophysical parameters for the well Ngamma-East-1
Shale intervals Depth range Thickness, m IGR Vsh Ød TOC, wt% TOM, wt%
Shale 1 1865–1950 85 0.6593 0.3898 0.1499 4.980 1.593 Shale 2 1972–2066 94 0.6547 0.3914 0.065 7.114 2.276 Shale 3 2084–2097 13 0.6279 0.3754 0.1542 5.251 1.680
Table 10. Average petrophysical parameters for the well Murshe-1
Shale intervals Depth range Thickness, m IGR Vsh Ød TOC, wt% TOM, wt%
Shale 1 1408–1440 32 0.350 0.135 0.186 9.638 3.084 Shale 2 1520–1609 89 0.421 0.162 0.103 5.097 1.631 Shale 3 1804–1847 43 0.534 0.254 0.237 11.658 3.73
Shale intervals Depth range Thickness, m IGR Vsh Ød TOC, wt% TOM, wt%
Shale 1 2167–2200 33 0.5422 0.2783 0.2308 11.553 3.697 Shale 2 2225–2261 36 0.5322 0.2454 0.1805 8.513 2.724 Shale 3 2409–2414 5 0.5454 0.2722 – –
Shale intervals Depth range Thickness, m IGR Vsh Ød TOC, wt% TOM, wt%
Shale 1 1923–2008 85 0.4383 0.1861 0.1151 5.739 1.836 Shale 2 2048–2106 58 0.5048 0.2308 0.2417 11.642 3.725 Shale 3 2221–2258 37 0.5172 0.2378 0.2189 10.823 3.463
Shale intervals Depth range Thickness, m IGR Vsh Ød TOC, wt% TOM, wt%
Shale 1 2499–2554 61 0.55713 0.2856 0.2446 12.875 4.120 Shale 2 2599–2621 22 – – 0.482 27.485 8.795 Shale 3 2831–2865 34 0.5549 0.2836 0.1268 6.201 1.984

Adekunle Abraham Adepelumi et al.
162
Table 11. Average petrophysical parameters for the well Ziye-1
Table 12. Average petrophysical parameters for the well Tuma-1
Three shale intervals labeled Shale 1, Shale 2, and Shale 3 were picked according to their relative thickness across the wells. These shale beds in the wells were compared, and formation tops and bottoms were assigned to these beds (Fig. 2 and 3). The correlation was based on their log signatures indicative of shale zone and gross thickness (Fig. 3).
Nine wells were analyzed and studied. Petrophysical parameters such as TOC content, TOM, density-derived porosity d( ),∅ volume of shale (Vsh), and gamma ray index (IGR) were calculated for the three identified shale units in the Gongila Formation. Only the average values of the parameters for each studied well are displayed in Tables 4 to 12.
The map of TOC in the studied area is shown in Fig. 4. The map shows a tight closure towards the south-eastern part of the map thus indicative of increasing maturity in that direction. Also, the observed closure might be related to the sparse data selection that was obtained mainly in the south-eastern corner of the basin. The TOC and TOM values calculated from density log indicate that the TOC of Gongila shale exceeds the kerogen threshold of 0.5 wt% (for a potential source rock) for generation of crude oil [5 21]. The result also shows that the TOM of the Gongila Formation exceeds the kerogen threshold of 1 wt%.
The cross-plots of heat generation versus the product of the bulk density (RHOB) and the gamma ray log values (GR) for all the wells (Fig. 5) show a similar gradient of 0.006, and this confirms that the region of interest con-tains sediments derived from the same source, thus showing the applicability of the equation presented in [20] for the Gongila Formation.
Heat production and heat flow were computed for each well studied. The data are given in Table 13.
From the given heat generation and heat flow values, it is obvious that the quantitative estimation of heat generation and heat flow for the nine wells studied yielded values that are slightly higher than given in [5, 22, 23] for sedimentary rocks. It will suffice to suggest that observed by us relatively high heat values may be due to widespread volcanic activity in the southern and central parts of the basin. Besides, the presence of ubiquitous intrusive
Shale intervals Depth range Thickness, m IGR Vsh Ød TOC, wt% TOM, wt%
Shale 1 1987–2057 70 0.5829 0.2987 0.2506 12.064 3.860 Shale 2 2087–2103 16 0.3259 0.1097 0.1495 7.210 2.307 Shale 3 2505–2517 12 0.3331 0.1271 0.1336 6.407 2.050
Shale intervals Depth range Thickness, m IGR Vsh Ød TOC, wt% TOM, wt%
Shale 1 2682–2706 24 0.6317 0.3802 0.1164 6.087 1.947 Shale 2 2715–2743 28 0.6498 0.3806 0.1103 5.588 1.788 Shale 3 3060–3075 15 0.3671 0.1414 0.0648 3.589 1.148

Modeling of Hydrocarbon Potential and Thermal Maturity of Gongila Shale...
163
Fig
. 3. C
orre
latio
n of
Gon
gila
shal
e in
terv
als (
N-S
) acr
oss t
he st
udie
d w
ells
in th
e B
ornu
Bas
in.

Adekunle Abraham Adepelumi et al.
164
Fig
.4. C
orre
latio
n of
Gon
gila
shal
e in
terv
als (
W-E
) acr
oss t
he st
udie
d w
ells
in th
e B
ornu
Bas
in.

Modeling of Hydrocarbon Potential and Thermal Maturity of Gongila Shale...
165
Fig. 5. Map of TOC values (wt%) distribution in the studied area.
Table 13. Heat production and heat flow of wells
Well Heat production, µWm–3 Heat flow, mW/m2
Faltu-01 0.8–3.7 35–64 Kinasar-01 0.8–4.4 35–71 Krumta-01 0.9–4.8 36–75 Kutchali-01 0.6–3.5 33–62 Murshe-01 0.9–2.5 36–52 Ngamma-East-01 0.9–3.8 36–65 Tuma-01 0.6–3.6 33–63 Wadi-01 0.8–3.3 35–60 Ziye-01 0.9–2.4 36–51
bodies that are either doleritic or gabbroic has been delineated in the Bornu Basin by Carter et al. [3] coupled with the fact that the basin is rimmed by crystalline basement rocks mainly of granitic and gneissic composition.
The heat flow was used to model thermal maturity of the Gongila Forma-tion. Interpretations of thermal maturity modeling for each well are shown in Fig. 6, and the generated maturity (EASY%Ro) maps of the shale beds present in the Gongila Formation, the Bornu Basin, are shown in Figures 7–9. One can see that the results of thermal maturity and the maturity index (EASY%Ro) obtained in this study depend on the distribution of the selected wells.

Adekunle Abraham Adepelumi et al.
166
Fig.
6. C
ross
plo
ts o
f A v
ersu
s RH
OB
x G
R fo
r all
nine
wel
ls u
sed
for t
he st
udy.

Modeling of Hydrocarbon Potential and Thermal Maturity of Gongila Shale...
167
Fig. 7. Thermal history of some of the wells in the study area.

Adekunle Abraham Adepelumi et al.
168
Fig. 7. Continues.
Modeling of Hydrocarbon Potential and Thermal Maturity of Gongila Shale...
169
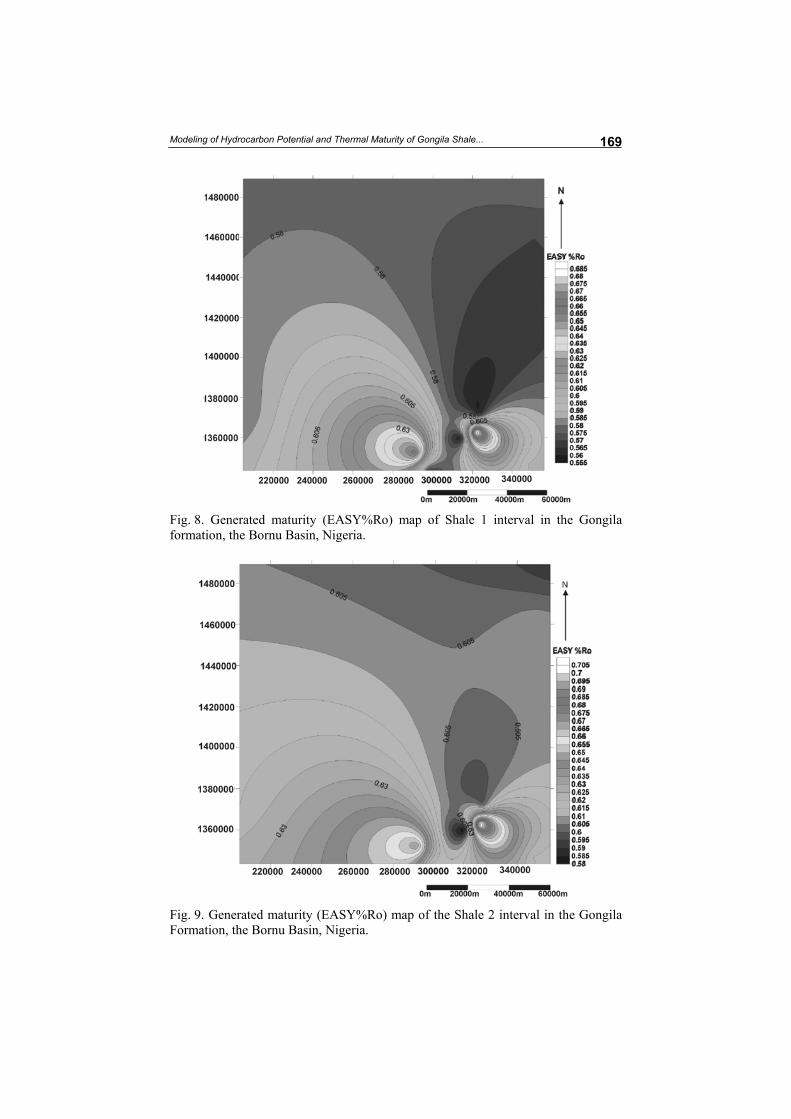
Fig. 8. Generated maturity (EASY%Ro) map of Shale 1 interval in the Gongila formation, the Bornu Basin, Nigeria.
Fig. 9. Generated maturity (EASY%Ro) map of the Shale 2 interval in the Gongila Formation, the Bornu Basin, Nigeria.
Adekunle Abraham Adepelumi et al.
170
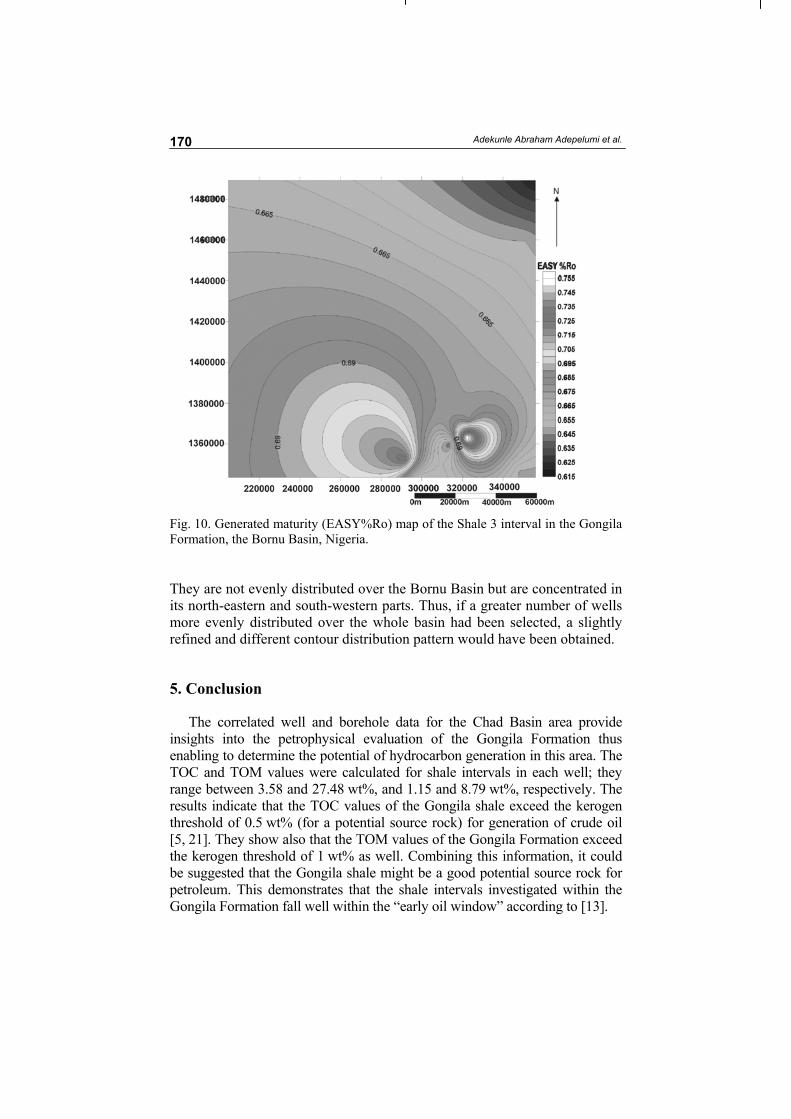
Fig. 10. Generated maturity (EASY%Ro) map of the Shale 3 interval in the Gongila Formation, the Bornu Basin, Nigeria.
They are not evenly distributed over the Bornu Basin but are concentrated in its north-eastern and south-western parts. Thus, if a greater number of wells more evenly distributed over the whole basin had been selected, a slightly refined and different contour distribution pattern would have been obtained.
5. Conclusion
The correlated well and borehole data for the Chad Basin area provide insights into the petrophysical evaluation of the Gongila Formation thus enabling to determine the potential of hydrocarbon generation in this area. The TOC and TOM values were calculated for shale intervals in each well; they range between 3.58 and 27.48 wt%, and 1.15 and 8.79 wt%, respectively. The results indicate that the TOC values of the Gongila shale exceed the kerogen threshold of 0.5 wt% (for a potential source rock) for generation of crude oil [5, 21]. They show also that the TOM values of the Gongila Formation exceed the kerogen threshold of 1 wt% as well. Combining this information, it could be suggested that the Gongila shale might be a good potential source rock for petroleum. This demonstrates that the shale intervals investigated within the Gongila Formation fall well within the “early oil window” according to [13].

Modeling of Hydrocarbon Potential and Thermal Maturity of Gongila Shale...
171
Also, the areas that could possibly serve as a good source for hydrocarbon generation were delineated basing on the TOC results obtained. It is inferred that maturity of the organic matter increases from the south-central part towards the north-east of the investigated area. Furthermore, for all the wells investigated, the cross-plots of heat generation versus RHOB × GR show that the gradient for the Bornu Basin is generally the same – 0.006. This value probably suggests that the basin contains sediments derived from the same source.
Quantitative estimation of heat generation and heat flow for the nine wells studied yielded values that are slightly higher than those observed by Tissot and Ulrich [5, 22] for sedimentary rocks. The only plausible explana-tion for these high heat values may be the occurrence of widespread volcanic activity in the basin coupled with the presence of intrusive bodies that are ubiquitous in the Bornu Basin as suggested earlier by Carter and others [3].
Generally, the combined result basing on maturity modeling and thermal maturity derived from the vitrinite reflectance varies from 0.56Ro% to 0.76Ro% for the Gongila Formation; these values possibly imply that the shale intervals studied within this formation are mature enough for hydro-carbon generation as suggested by Senftle and Landis [13].
Acknowledgements
Landmark and Shell Petroleum Development Company Nigeria made Land-mark GeographixTM software available for this work. The Department of Petroleum Resources, a subsidiary of the Nigerian National Petroleum Corporation (NNPC), is acknowledged for the provision of the well-logs dataset used for this work. The authors are also grateful to the anonymous reviewers for their suggestions that led to improving the paper. References
1. Genik, G. J. Regional framework, structural and petroleum aspects of rift basins in Niger, Chad and Central African Republic (C.A.R). Tectonophysics, 1992, 213(1), 169–185.
2. Avbovbo, A. A., Ayoola, E. O., Osahon, G. A. Depositional and structural styles in Chad Basin of Northeastern Nigeria. AAPG Bull., 1986, 70(12), 1787–1798.
3. Carter, J. D., Barber, W., Tait, E. A, Jones, G. P. The geology of parts of Adamawa, Bauchi and Bornu provinces in Northeastern Nigeria. Bull. Geol. Surv. Nigeria, 1963, 30, 1–108.
4. Lijmbach, G. W. M. On the origin of petroleum. In Proc. 9th World Petroleum Congress, Tokyo. Applied Sciences Publisher, London, 1975, 2, 357–369.
5. Tissot, B. P, Welte, D. H. Petroleum Formation and Occurrence: A New Approach to Oil and Gas Exploration. Springer Verlag, Berlin, 1978. 538 p.
6. Schmoker, J. W. Determination of organic-matter content of Appalachian Devonian shales from gamma-ray logs. AAPG Bull., 1981, 65(7), 1285–1298.

Adekunle Abraham Adepelumi et al.
172
7. Meyer, B. L., Nederlof, M. H. Identification of source rocks on wireline logs by density/resistivity and sonic transit time/resistivity crossplots. AAPG Bull., 1984, 68(2), 121–129.
8. Peters, K. E. Guidelines for evaluating petroleum source rock using programmed pyrolysis. AAPG Bull., 1986, 70(3), 318–329.
9. Rybach, L. Amount and significance of radioactive heat sources in sediments. In Collection Colloques et Seminares 44, Thermal Modeling of Sedimentary Basins (Burrus, J., ed). Paris: Paris Editions Technip., 1986, 311–322.
10. Dembicki, H. Jr., Horsfield, B., Ho, T. T. Y. Source rock evaluation by pyro-lysis-gas chromatography. AAPG Bull., 1983, 67(7), 1094–1103.
11. Schneider, F., Faure, J. L., Roure, F. Methodology for basin modeling in complex area: examples from Eastern Venezuelan and Canadian Foothills. AAPG Hedberg Conference “Deformation History, Fluid Flow Reconstruction and Reservoir Appraisal in Foreland Fold and Thrust Belts”, 2002.
12. Schneider, F., Devoitine, H., Faille, I., Flaraud, E., Willien, F. Ceres2D: A numerical prototype for HC potential evaluation in complex area. Oil Gas Sci. Technol., 2002, 57(6), 607–619.
13. Senftle, J. T., Landis, C. R. Vitrinite reflectance as a tool to assess thermal maturity. In Source and Migration Processes and Evaluation Techniques: AAPG Treatise of Petroleum Geology, Handbook of Petroleum Geology (Merrill, R. K., ed), 1991, 119–125.
14. Cratchley, C. R., Jones, G. P. An interpretation of the geology and gravity anomalies of the Benue valley, Nigeria. Overseas Geological Survey. Geo-physical Paper I, 1965, 26.
15. Ajakaiye, D. E., Burke, K. A Bouguer gravity map of Nigeria. Tectonophysics, 1973, 16(1-2), 103–115.
16. Benkhelil, J. L. Structure et evolution géodynamique du bassin intracontinental de la Benoue (Nigeria). B. Cent. Rech. Expl. 1988, 12(1), 29–128.
17. Fletcher, W. K. Analytical Methods in Geochemical Prospecting. Elsevier Sci. Pub., Amsterdam, 1981. P. 255.
18. Schmoker, J. W., Hester, T. C. Oil generation inferred from formation resistivity Bakken Formation, Williston Basin, North Dakota. In Trans. of the Thirtieth SPWLA Annule Logging Symp., Paper H, 1989.
19. Beardsmore, G. R. The Thermal History of the Browse Basin and its Implica-tions for Petroleum Exploration. Ph.D. dissertation, Monash University, Victoria, Australia, 1996.
20. Bucker, C., Rybach, I. A simple method to determine heat production from gamma logs. Mar. Petrol. Geol., 1996, 13(4), 373–375.
21. Hunt, J. M. Petroleum Geochemistry and Geology. Freeman and Company, San Francisco, 1979. P. 617.
22. Ritter, U., Zielinski, G. W., Weiss, H. M., Zielinski, R. L. B., Sættem, J. Heat flow in the Vøring Basin, Mid-Norwegian Shelf. Petrol. Geosci., 2004, 10(4), 353–365.
23. Slichter, L. B. Cooling of the Earth. Bull. Geol. Soc. Am., 1941, 52, P. 561–600. Presented by V. Kalm Received December, 2010