modeling of transportation of phyto- and zooplankton in the · 1 modeling of transportation of...
TRANSCRIPT

1
Modeling of transportation of Modeling of transportation of phytophyto-- and zooplankton in the and zooplankton in the Kuroshio and Kuroshio ExtensionKuroshio and Kuroshio Extension
Kosei KOMATSUNational Research Institute of Fisheries Science, JAPAN
CCCC W3 PID=2012
15/10/2004 13:30-14:1013th PICES

2
TodayToday’’s my talks my talkIntroductionIntroduction- Background- Objectives
•• Transportation of phytoTransportation of phyto-- and zooplanktonand zooplankton- NEMURO applied to 3D-OGCM with DA- Advective effects in the Kuroshio and KE- Size-dependent variation of plankton biomass
• Transportation of eggs, larvae and juvenilesTransportation of eggs, larvae and juveniles- Effect of eddies in the East China Sea- Effect of wind- and wave-induced currents
• Future planFuture plan

3
IntroductionIntroduction - Background - Objectives

4
BackgroundBackground• Necessity of developing 3-D numerical
model for understanding interaction between open ocean and coastal ecosystems - 3D structure of ocean environment
SST [ NOAA/AVHRR ] Chl. [ ADEOS/OCTS ]
JapanJapan
KuroshioKuroshioWestern North Pacific
136E 146E
40N
30N

5
Vertical section across 147E Vertical section across 147E in Jun. 1997 (Sasaki et al. 2004)in Jun. 1997 (Sasaki et al. 2004)
S N
0m
200m
NO3
Chl.
- Advective effect on distribution of plankton biomass and production around jets (e.g., GS: Anderson et al. 2001; Kuroshio: Komatsu et al. 2004)
front of KE jet

6
- Advective effect on feeding grounds and migration routes of larvae and juveniles* Kuroshio downstream: Pacific sardine, Pacific
saury, …
* Kuroshio upstream: Jack mackerel, Yellowtail, Ommastrephid squid, …
Watanabe et al. (1997) From Sasa (2003)
Pacific saury
Jack mackerel
Taiwan

7
• Recent progresses of numerical model- OGCM with data assimilation
JCOPE (JAMSTEC/FRCGC)NLOM (US Navy)…..
- Ecosystem modelNEMURO, NEMURO.FISH (PICES)ECOPATH/ECOSIM…..
• Coupling ecosystem model with 3D OGCM is ongoing.
8
ObjectivesObjectives• To clarify advective effects on spatial
distribution of phyto- and zooplankton biomass, coupling NEMURO with a 3D-OGCM
• To clarify effects of eddy and wind on transportation of eggs and larvae, coupling a tracer model with a 3D-OGCM
Western North Pacific

9
Transportation of phytoTransportation of phyto-- and zooplanktonand zooplanktonin the Kuroshio and Kuroshio Extensionin the Kuroshio and Kuroshio Extension
1. NEMURO applied to 3D-OGCM assimilated to satellite altimetry
2. Advective effects on the spatial distribution of plankton biomass
3. Size-dependent variation

10
Development of a lowerDevelopment of a lower--trophictrophiclevel ecosystem modellevel ecosystem model at NRIFSat NRIFS
Physics Biogeochemistry
Satellite altimetry
(TP, ERS-1/2, Jason-1)
C-HOPE
(MPI Me)
NEMURO
(PICES)
Data assimilation
u, v, w, S, T, Kv, KH
Driving force NCEP/NCAR
PARGMS-5/NASDA
1/16o resolution near the coast

11
Reproduction of Kuroshio by CReproduction of Kuroshio by C--HOPEHOPE
(Japan Coast Guard)
(20days later SST)

12
BiogeochemistryBiogeochemistryNEMURO (PICES): no ZP, no vertical migration of ZL
NSi
diatomLarge copepoda
Micro zooplanktonflagellate
Initial: Nut.←Climatology,Phyto←OA1,Zoo←Extrapolation
1. Anderson et al. (2000)
13
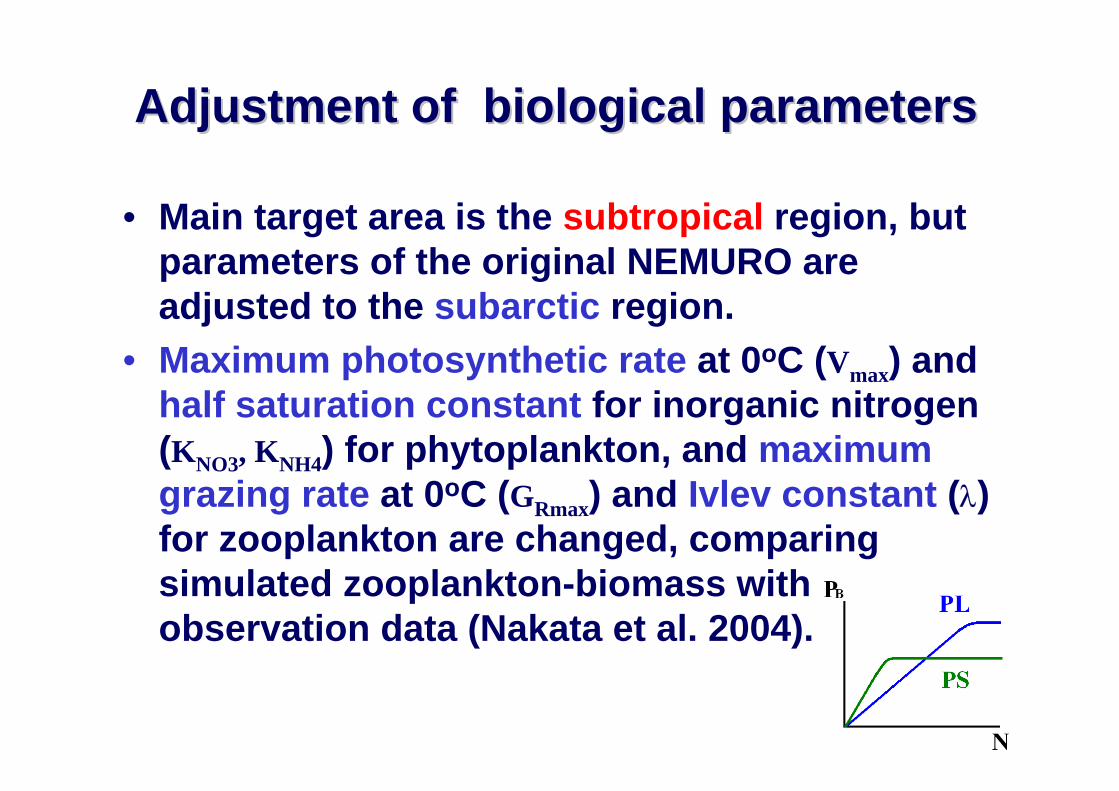
Adjustment of biological parametersAdjustment of biological parameters
• Main target area is the subtropical region, but parameters of the original NEMURO are adjusted to the subarctic region.
• Maximum photosynthetic rate at 0oC (Vmax) and half saturation constant for inorganic nitrogen (KNO3, KNH4) for phytoplankton, and maximum grazing rate at 0oC (GRmax) and Ivlev constant (λ) for zooplankton are changed, comparing simulated zooplankton-biomass with observation data (Nakata et al. 2004).

14
Comparison of zooplankton biomass Comparison of zooplankton biomass between model and observationbetween model and observation
0-200m biomass in KE
Model: ZL+ZS

15
Horizontal distribution of Horizontal distribution of plankton biomass in the plankton biomass in the
Kuroshio and KEKuroshio and KE
1997 April 1• Before the bloom in the subarctic region
• After the bloom in the subtropical region
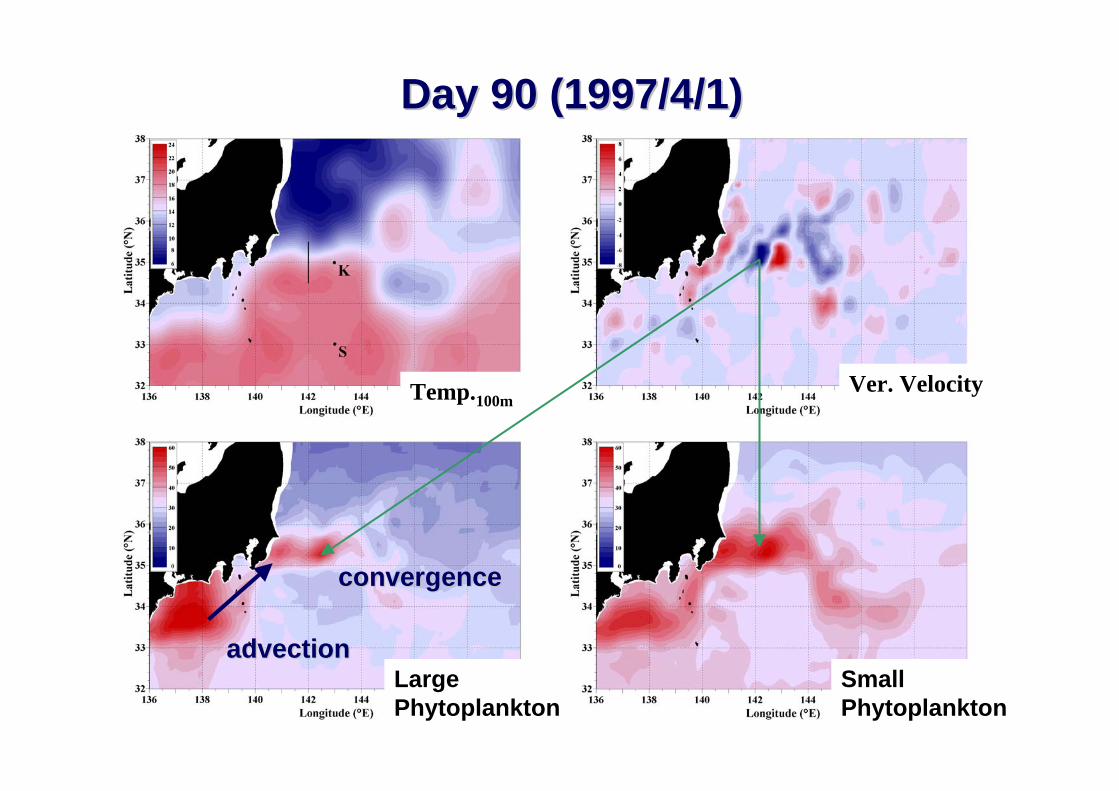
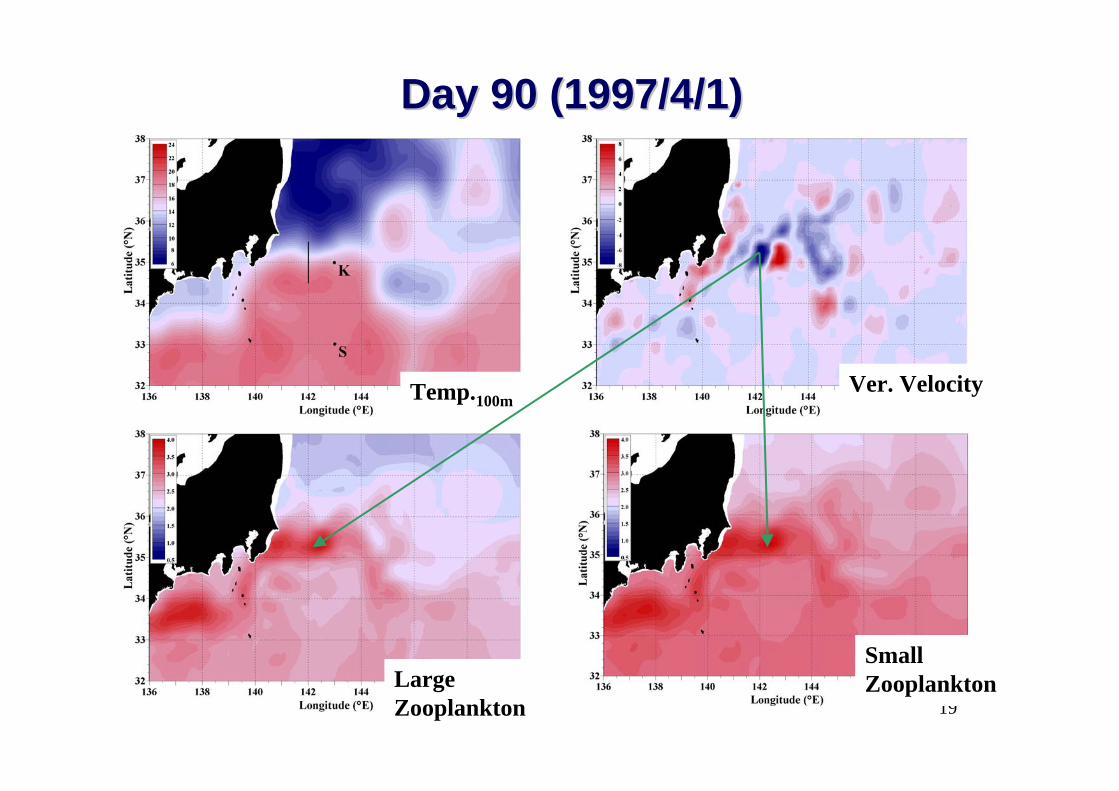
• Enhancement along the jet, particularly in the convergence zone

16
Day 90 (1997/4/1)Day 90 (1997/4/1)
Temp.100m
Ver. Velocity
Hor. Velocity
Nitrate
downwelling
upwelling
Japan
Western North Pacific

17
PV conservation (PV conservation (OnkenOnken, 1992), 1992)
Q=(ξ+f)/H, dQ=0 dH=dξ/Q
ξ < 0
ξ > 0
ξ < 0stretching stretching
compression
18
Temp.100mVer. Velocity
Large Phytoplankton
Small Phytoplankton
Day 90 (1997/4/1)Day 90 (1997/4/1)
convergenceconvergence
advectionadvection
19
Temp.100mVer. Velocity
Large Zooplankton
Small Zooplankton
Day 90 (1997/4/1)Day 90 (1997/4/1)

20
Vertical distribution of Vertical distribution of plankton biomass plankton biomass
across the Kuroshio jetacross the Kuroshio jet
• April 1: Discontinuity of maximum layer
across the Kuroshio front
• June 3: depletion in the subtropical region
• Downward shift of surface maximum

21
Day 90 (Apr.1)Day 90 (Apr.1)
Nitrate PL PS
ZL ZS
front
Subsurface maximum
Surface maximum
0m
200mS N

22
MVP observation in Mar. 2004 MVP observation in Mar. 2004 ((HiroeHiroe et al. 2004)et al. 2004)
Moving Vessel Profiler(Brooke Ocean Tech. Ltd.)
Fish: CTD, DOmeter, Fluorometer
KE front
0
20
40
60
80
100
120
140
160
180
200
0.000 0.050 0.100 0.150 0.200 0.250 0.300 0.350 0.400
KY045_chl
KY045_Feo
KY047_chl
KY047_Feo
KY048_chl
KY048_Feo
Subsurface max. in the subtropical region
NN
SS
NS

23
Nitrate PL PS
ZL ZS
Day 180 (Jun.3)Day 180 (Jun.3)
Depleted on the subtropical side
front

24
Downward advection along the jetDownward advection along the jet
PS
Temp.
Ridge Trough
PS

25
Downward shift of maximum layerDownward shift of maximum layerdue to downwellingdue to downwelling
Convergence/Downwelling
Temperature
Vertical velocity
Observation in KE in 1997 Jun. Observation in KE in 1997 Jun.
Ridge
TroughSasaki et al. (2004)

26
SizeSize--dependent characteristics dependent characteristics of temporal variation of of temporal variation of plankton biomassplankton biomass
• on K: Water abruptly changed due to
fluctuation of the Kuroshio path
• on S: all the time in the subtropical region
• Size-dependent variation
Fluctuation of the Kuroshio path
SS**** KK

27
on K (143oE, 35oN)
subtropical
subarctic
Start of bloom in subtropical
AdvectionEnd of bloom in subarctic
Subsurface max.
Nitrate
PL
Surface max.
PS
ZL
ZS
TT--Z distribution affected by Kuroshio pathZ distribution affected by Kuroshio path
subtropical

28
All the time in the All the time in the subtropical sidesubtropical side
on S (143oE, 33oN)on K (143oE, 35oN)
Affected by fluctuation of Affected by fluctuation of the Kuroshio paththe Kuroshio path
Kuroshio crossed
subtropical subarctic subtropical subtropical side
PL PL
PS PS

29
SizeSize--dependent temporal variationdependent temporal variationAverage biomass in the region (34.5-35.5N, 141-144E) at 0-200m
Small one indicated robust biomass against abrupt change of environment.
30
Summary 1Summary 1--1/21/2
• Advective effects in the Kuroshio and Kuroshio Extension- High concentration along the jet from the slope water- Enhancement in convergence zones- Downward shift of maximum layers by downwelling
• Size-dependent variation of plankton biomass- Daily change: Large < Small- Monthly change: Large > Small
Maximum photosynthetic rate: PL > PSHalf saturation constant: PL < PS

31
Summary 1Summary 1--2/22/2
• Small plankton biomass was relatively robustagainst abrupt changes of the environment by Kuroshio fluctuation
Small copepods show smaller annual change than large copepods (Nakata et al. 2001)
A possible reason for stability of resource of winter-spawned Pacific saury

32
Transportation of fish eggs, Transportation of fish eggs, larvae and juvenileslarvae and juveniles
1. Effect of eddies in the East China Sea- Bifurcation of transportation route
2. Effect of wind- and wave-induced currents- transportation across the jet

33
Bifurcation of transportation Bifurcation of transportation route of eggs and larvaeroute of eggs and larvae
-- interaction between jet and eddies interaction between jet and eddies --

34
East China SeaEast China Sea
• Mechanism of the Kuroshio bifurcation is unclear (e.g. Katoh et al. 2001, Ichikawa et al. 2001).
• Spawning ground of jack mackerel, Ommastrephid squid, yellowtail …
• Eggs and larvae are transported to the Pacific, the Japan Sea and coast.
Korea
Taiwan

35
FRECS2
Tracer experiment by CTracer experiment by C--HOPE HOPE 2004.3.112004.3.11--4.304.30
Animation Temperature & velocity at 20m
• 400 particles were drifted without death.
• Smagorinsky type diffusivity.
Deployed Deployed herehere

36
0-6days 7-16days 17-30days
Death by food shortage?
Tracer experiment compared with Tracer experiment compared with inin--situ sampling 2001.2.15situ sampling 2001.2.15
Death by cold water?
Distribution of larval jack mackerel (Sasa et al. 2002)

37
2001Feb.15-
0-6days
2月
< 3mmNL (Sasa et al. 2002)
Comparison of larval distribution in Feb. Comparison of larval distribution in Feb. between 2001 and 2002between 2001 and 2002
2002Feb.15-

38
2001Distributed along the northern edge of the front
2002Piling up on the northern side of Taiwan
MODEL 2/25 SST SSHStrong clockwise current
SSHA (CCAR)
2001/2/25
positive anomaly
A reason for the discrepancy between A reason for the discrepancy between 2001 and 20022001 and 2002

39
CrossCross--jet transportationjet transportation-- Effect of windEffect of wind-- and waveand wave--induced currents induced currents --
40
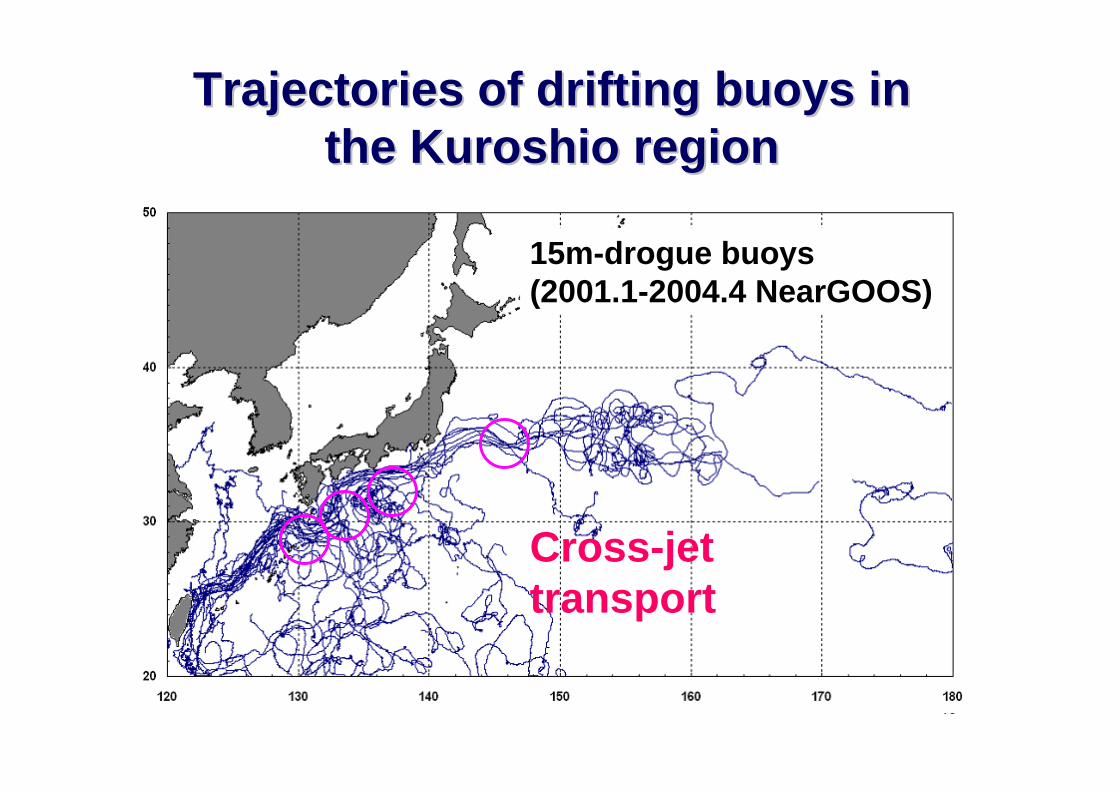
Trajectories of drifting buoys in Trajectories of drifting buoys in the Kuroshio regionthe Kuroshio region
15m-drogue buoys (2001.1-2004.4 NearGOOS)
Cross-jet transport

41
Trajectories of drifting buoys Trajectories of drifting buoys 2001.2.152001.2.15--3.93.9
Komatsu & Kawasaki (2003)
Drogued buoy
Non-droguedbuoy
42
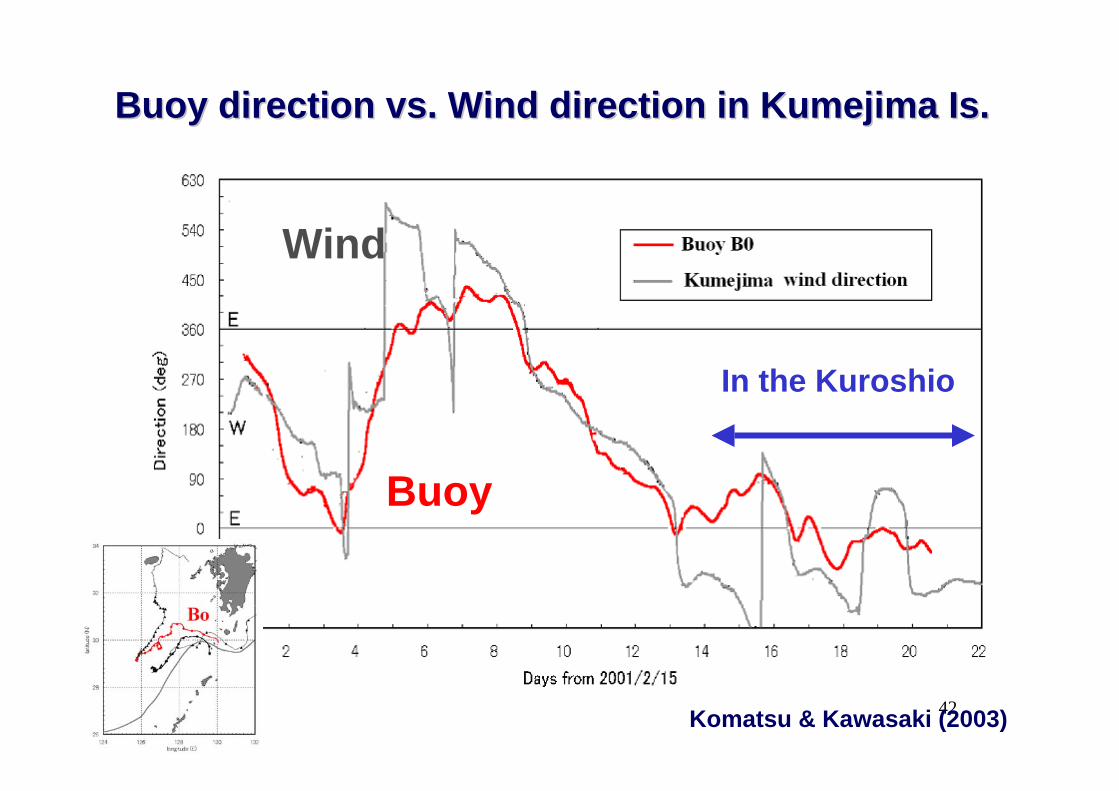
Buoy direction vs. Wind direction in Buoy direction vs. Wind direction in Kumejima Kumejima Is.Is.
In the Kuroshio
Komatsu & Kawasaki (2003)
Buoy
Wind

43
Buoy Observation in 2003Buoy Observation in 2003• Orbcomm GPS buoy (Zenilite buoy Co.)
• Data transmission by e-mail
• Position accuracy: 10m
• Period: 2003.3.05-5.22
• Data interval: 60min
• Drogue: none/10m

44
Buoy Trajectories in 2003.3.5Buoy Trajectories in 2003.3.5-- 4.134.13
Drogued
Non-drogued

45
Tracer experiment compared with Tracer experiment compared with drifting buoy observationdrifting buoy observation
• Number of pseudo-particles: 400• Velocity: JCOPE reanalysis (2days mean)• Period: 2003.3.05-5.29• Layer: 0m, 10m• Resolution: 1/12o
• Diffusion: Smagorinsky type

46
Tracer experiment for noTracer experiment for no--drogue buoydrogue buoy
Deployed here
Animation Temperature & velocity at surface

47
Tracer experiment vs. BuoyTracer experiment vs. Buoy
10m
0m
Discrepancy

48
A reason for discrepancy: Wind effectA reason for discrepancy: Wind effect
Buoy drift direction vs. Wind direction

49
Estimation of WindEstimation of Wind-- and Waveand Wave--drifting effectsdrifting effects
Buoy
Background current by JCOPE
WW drift
UB
UC
UD
UD= UB – UC
= FDWF: Fraction Matrix
D: Deflection Matrix
Wind vector by QuikSCAT
W
D
F

50
Seek Deflection angle Seek Deflection angle θθ and Fraction and Fraction ββas to makeas to make CorCor. between. between UUB B –– UUC C and FDW maximumand FDW maximum
+0.15 ββ= |U= |UD D | / | W|| / | W|

51
Tracer experiment with WW drift effectsTracer experiment with WW drift effects
no WW driftno WW drift

52
SummarySummary• Distribution of larval jack mackerel is
almost determined by current field, when it is critically affected by interaction between jet and eddies.
• Wind- and wave-induced currents possibly bifurcate transportation routes of surface matters (eggs, larvae, seaweeds,… ).
• A small difference of the horizontal(vertical) position of matters makes their routes drastically by eddy- (wind-) effect.

53
Future planFuture plan• Refinement and extension of 3D-NEMURO
- Utilizing e-NEMURO applicable to both the subarctic and subtropical regions (Yoshie& Yamanaka 2004)
- Coupling with NEMURO.FISH- Coupling with a tracer model with biological processes and wind- and wave-drifting effects
• Reaction experiment for the Pacific-wide climate change
- Effect of warming-up (changes of current and wind systems, change of hydrographic structure,…) on biomass change and species transition

54
Special thanks toSpecial thanks toM.J.Kishi, S. Ito, K. Nakata, T. Watanabe, Y.
Hiroe, U.Mikolajewicz, G. Brasseur, PICES model task team and VENFISH & ONDANKA members for developing a 3D-NEMURO, and
A.Kasai, Y.Miyazawa, Y.Konishi, C.Sasa, K.Kawsaki, T.Saito, H.Akiyama and FRECS1/2 members for developing a tracer model