modeling: optimizing resources using census data t
TRANSCRIPT
Modeling: Optimizing Resources using Census Data TEACHER NOTES
©2021 Texas Instruments Incorporated 1 education.ti.com
Lesson Overview
In this activity, students investigate how to optimize resources to maximize support for people in danger from flooding. The activity is based on the real situation involving Hurricane Sandy that hit the eastern part of the United States on October 2, 2012 and caused 70 billion dollars damage and was responsible for the deaths of at least 75 Americans. Students investigate data from Staten Island New York, one of the hardest hit areas: elevation above sea level and information from the census including the population and the number of older people. Using color to code spreadsheets and maps of the area according to certain criteria, the strategy used by the New York City administration, students identify where limited resources should be allocated.
Learning Goals
Students will be able to:
1. Understand and ways in which the US census is used. 2. Identify strategies for analyzing multivariate relationships 3. Recognize the role of assumptions in making a decision 4. Clarify probability statements such as “once in a hundred years”
About the Lesson and Possible Course Connections: The US Census is sometimes treated as an intrusion into people’s lives, and some are fearful that the government is prying into their personal business. This activity is designed to show that census data is an important part of governing, helping those in charge make decisions that will make things better for people. The activity can be used whenever students have a background in ratios and proportional relationships and modeling linear relationships. The lesson has three parts. The first analyzes data using spreadsheets; the second explores the relationship between two variables using scatterplots, and the third uses a program that colors areas on a map according to varying conditions. CCSS Standards
Ratio and Proportional Relationship Standards 7RP.A.1 Statistics and Probability Standards 7.SP.C.7 8.SP.A.1 HSS.ID.B.6 HSS.IC.D.6 HSS.MD.B.7
Mathematical Practice Standards
SMP.4

Modeling: Optimizing Resources using Census Data TEACHER NOTES
©2021 Texas Instruments Incorporated 2 education.ti.com
Lesson Materials
• Compatible TI Technologies:
TI-Nspire CX Graphing Calculators, TI-Nspire Apps for iPad®, TI-Nspire Software • Census Data_Teacher Notes.doc, pdf • Census Data_Data Sheet.doc, pdf • Map of Census Tracts.doc, pdf • Optimizing Resources.tns
Background
The eastern shore of Staten Island, a borough of New York City, on average has an elevation of 133 feet above sea level, but the terrain ranges from high bluffs to low lying areas on the shore and in some of its center. Before Hurricane Sandy in early October, 2012, weather forecasters predicted that rising water and tidal waves would flood areas of the Island with storm surges predicted to be from 11 to 13 feet above sea level. New York City administrators were concerned, among other things, because not all emergency shelters had generators, which were likely to be needed by older people, and they had to carefully plan where to send the limited number of evacuation fleet buses they had. The US Census divides the country into units called tracts, which are further broken into blocks sometimes but not always the same as city blocks, and collects data on the people living in each tract and block. Figure 1 shows the census tracts for the eastern shore of Staten Island. The tns file Optimizing _Resources.tns contains data about the population and elevation for those tracts (Figure 2). Use the data to decide 1) which census tracts on the eastern side of Staten Island should receive the generators and 2) where to send the 50 evacuation fleet buses. Be ready to justify your thinking.
Figure 1 Census tracts on Staten Island, New York City Borough. Data related to population and elevation for the checked tracts are in the tns file.
Modeling: Optimizing Resources using Census Data TEACHER NOTES
©2021 Texas Instruments Incorporated 3 education.ti.com
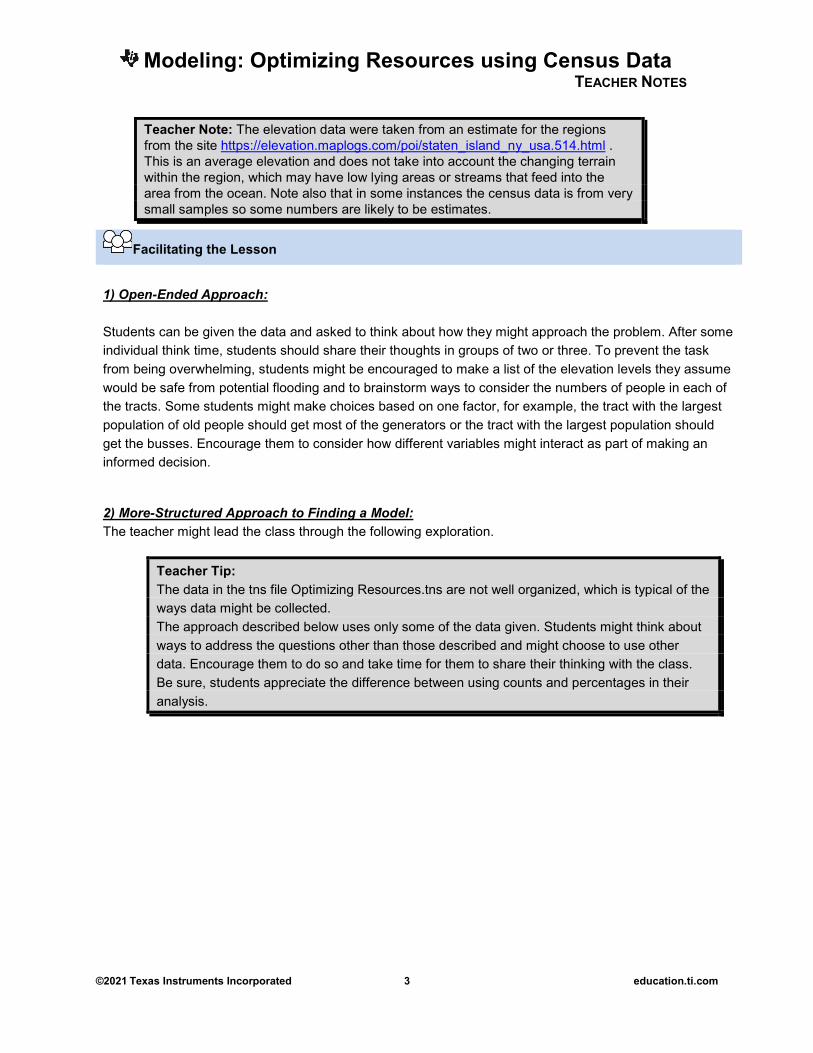
Teacher Note: The elevation data were taken from an estimate for the regions from the site https://elevation.maplogs.com/poi/staten_island_ny_usa.514.html . This is an average elevation and does not take into account the changing terrain within the region, which may have low lying areas or streams that feed into the area from the ocean. Note also that in some instances the census data is from very small samples so some numbers are likely to be estimates.
Facilitating the Lesson
1) Open-Ended Approach: Students can be given the data and asked to think about how they might approach the problem. After some individual think time, students should share their thoughts in groups of two or three. To prevent the task from being overwhelming, students might be encouraged to make a list of the elevation levels they assume would be safe from potential flooding and to brainstorm ways to consider the numbers of people in each of the tracts. Some students might make choices based on one factor, for example, the tract with the largest population of old people should get most of the generators or the tract with the largest population should get the busses. Encourage them to consider how different variables might interact as part of making an informed decision.
2) More-Structured Approach to Finding a Model: The teacher might lead the class through the following exploration.
Teacher Tip: The data in the tns file Optimizing Resources.tns are not well organized, which is typical of the ways data might be collected. The approach described below uses only some of the data given. Students might think about ways to address the questions other than those described and might choose to use other data. Encourage them to do so and take time for them to share their thinking with the class. Be sure, students appreciate the difference between using counts and percentages in their analysis.

Modeling: Optimizing Resources using Census Data TEACHER NOTES
©2021 Texas Instruments Incorporated 4 education.ti.com
What to Expect: Example Student Approaches Students may make different assumptions about the conditions; for example, what elevation would be high enough to escape the storm surges or given there are not enough generators to go to every area with older people, is there some number of elderly in an area that should be considered a minimum condition for sending a generator. Students might choose to work with different flood levels or with different thresholds for older people. They might also decide to seek other information they think would be useful in making a decision.
With technology: The tns file Optimizing Resources.tns contains data about the population and elevation for those tracts (Figure 2)
Figure 2 Census and elevation data
Students may look for all the tracts with elevation below a certain limit. For example, tracts with an elevation of 13 feet or less are highlighted in green in Figure 3.
Figure 3 Identifying tracts with elevations less
than or equal to 13 ft
Teacher tip: To color a row, arrow to the left to highlight the row number, press ctrl menu to get the context menu and select color> fill color.

Modeling: Optimizing Resources using Census Data TEACHER NOTES
©2021 Texas Instruments Incorporated 5 education.ti.com
Then students can look at the number of people over the age of 75 in a tract and see if it’s above a certain limit. For example, in the column for the number of people over the age of 75, change the text to orange for those with more than 200 people over the age of 75 and an elevation less than or equal to 13 ft (Figure 4).
Figure 4 Identifying tracts with more than 200
people over 75 years old
Scrolling down shows the intersection of the colors in tracts 244.02, 128.05, 128.06, 112.01, 112.02, and 6 which indicates areas in which the ventilators should be placed in the emergency shelters (Figure 5).
Figure 5 Tracts with elevation ≤ 13 ft with more
than 200 people over 75 years of age.
Increasing the elevation to 16 feet, adds two more tracts to those that should receive generators: 96.01, and 198 (Figure 6). Note that tract 96.01 is inland, and the two tracts between tract 96.01 and the water, tracts 70 and 74, have elevations 20 ft and 46 ft, which would be high enough to avoid flooding under the predicted storm surges.
Figure 6 Tracks with elevation ≤ 16 ft.
To answer the second question, students might explore the relationship between the tracts that are apt to flood and those with very large and dense populations. For example, dividing the population by the number of blocks in a tract gives a measure of the density of the tract (Figure 7).
Figure 7 Calculating population density per block
Modeling: Optimizing Resources using Census Data TEACHER NOTES
©2021 Texas Instruments Incorporated 6 education.ti.com
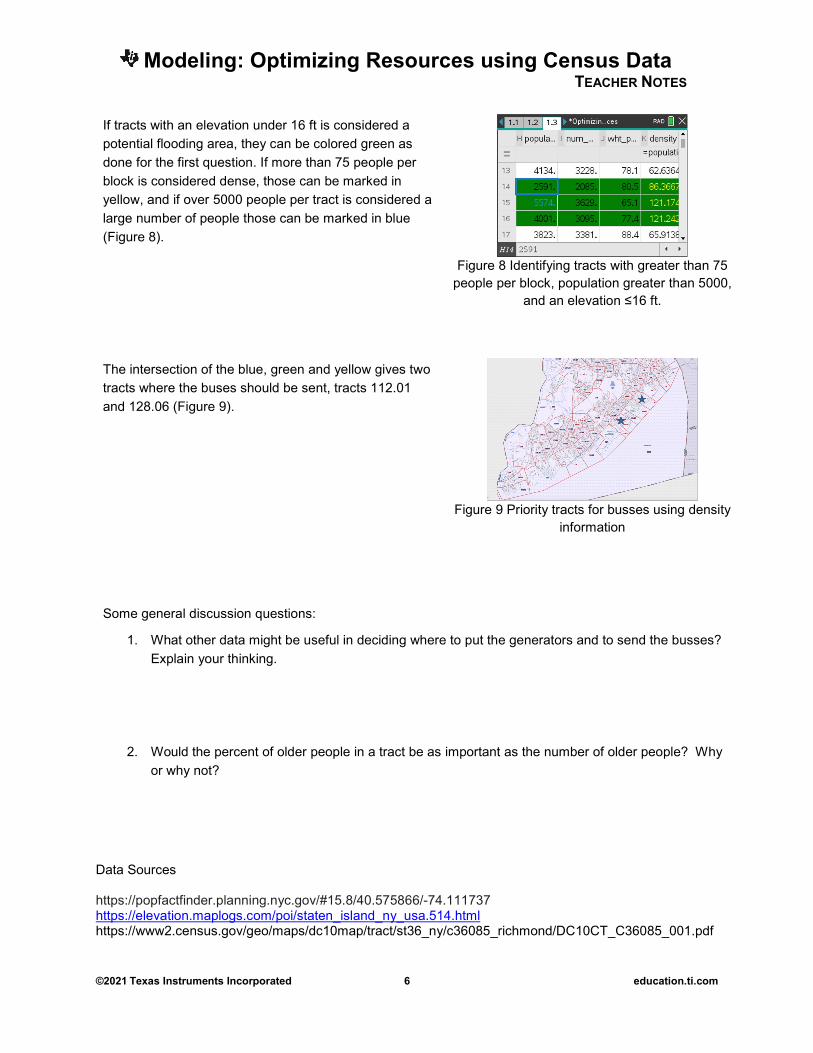
If tracts with an elevation under 16 ft is considered a potential flooding area, they can be colored green as done for the first question. If more than 75 people per block is considered dense, those can be marked in yellow, and if over 5000 people per tract is considered a large number of people those can be marked in blue (Figure 8).
Figure 8 Identifying tracts with greater than 75
people per block, population greater than 5000, and an elevation ≤16 ft.
The intersection of the blue, green and yellow gives two tracts where the buses should be sent, tracts 112.01 and 128.06 (Figure 9).
Figure 9 Priority tracts for busses using density
information
Some general discussion questions:
1. What other data might be useful in deciding where to put the generators and to send the busses? Explain your thinking.
2. Would the percent of older people in a tract be as important as the number of older people? Why or why not?
Data Sources https://popfactfinder.planning.nyc.gov/#15.8/40.575866/-74.111737 https://elevation.maplogs.com/poi/staten_island_ny_usa.514.html https://www2.census.gov/geo/maps/dc10map/tract/st36_ny/c36085_richmond/DC10CT_C36085_001.pdf
Modeling: Optimizing Resources using Census Data TEACHER NOTES
©2021 Texas Instruments Incorporated 7 education.ti.com
Part Il. Exploring simulations with a program
Part 2 Analyzing Relationships
1. Look at the data for all of the census tracts on Staten Island. a) What do you notice? What do you wonder? b) Use the online map from the link below to see if you can give any explanation for some of the
things you noticed or wondered about. https://www2.census.gov/geo/maps/dc10map/tract/st36_ny/c36085_richmond/DC10CT_C36085_001.pdf
2. Consider the relationship between the density and the number of white people living in the tracts in
the file. Look at the data for the number of white people living in each tract. a) What do you notice? b) Graph the data on a data and statistics page and find a model that expresses the number of
white people as a function of the density. Interpret the rate of change in terms of the context. c) Estimate the correlation coefficient. d) Does there seem to be an inequity in the way people are distributed in the tracts? Justify your
thinking. e) Would using the density vs the number of white people give a different picture than using the
density vs the percentage of white people? Explain your reasoning.
3. Investigate other relationships such as the relation between older people and population or population and elevation. Identify at least two observations you can make from your investigations.
Part IIl. Exploring an Interactive Map
Part 3 Coloring the Map
The tns file Optimizing_Resources displays a polygonal map of the census tracts on Staten Island. One slider on page 2.2 will adjust the maximum elevation level and the corresponding tracts will be colored in green, and the other adjusts the minimum number of people over the age of 75 living in a tract and the corresponding tract will be colored in orange. Where the two conditions overlap, the tract will be colored magenta.
Teacher tip: The tns file may run slowly on a handheld, in particular, page 3.2. Have students adjust the sliders one step at a time, waiting for the map to update. You may wish to use the software to demonstrate how the file works and to explore the questions as a class or to have students work in small groups on available software.

Modeling: Optimizing Resources using Census Data TEACHER NOTES
©2021 Texas Instruments Incorporated 8 education.ti.com
Students might investigate the following questions:
1. Use page 2.2 to decide which of the statements are true. Explain your reasoning. a) None of the tracts have more than 750 people over the age of 75. b) Two tracts have an elevation less than seven feet. c) Ten tracts have an elevation less than or equal to 20 feet. d) Every tract has some people living there over the age of 75.
2. Are there any inland tracts (no boundary on the ocean or river) that could be flooded because of an elevation less than or equal to 20 ft? Explain your reasoning.
The sliders on page 3.2 can be used to investigate the relationship among the total population, the population density and the elevation using the following color code:
• magenta: only above indicated population density • yellow: only above indicated total population • blue: only below indicated elevation • green: population and elevation criteria met • red: pop. density and elevation criteria met • orange: population and pop. density met • brown: ALL three criteria met • gray: none of the criteria met
Pages 4.2 and 4.3 displays the census tracts on Staten Island along with the tract numbers.
1. Use the color code to describe as much as you can about the population, population density and elevation for Staten Island, given the figure below:

Modeling: Optimizing Resources using Census Data TEACHER NOTES
©2021 Texas Instruments Incorporated 9 education.ti.com
2. Use page 3.2 and page 4.2 to answer each question. Explain your answer in each case. a) Which of the tracts seem to have very little, if any, population. b) Do any of the tracts have a low density and a high population? c) What parts of Staten Island have very high elevation?
3. Working in small groups, each person should choose one of the figures below and describe what
the colors indicate about Staten Island in terms of population, density and elevation. Check with each other to see if you all agree. i)
ii)
iii)
iv)

Modeling: Optimizing Resources using Census Data TEACHER NOTES
©2021 Texas Instruments Incorporated 10 education.ti.com
Once students are familiar with the tns file, students should return to the original questions and answer them using the information from the maps of the entire island.
1) Which census tracts should receive the generators?
2) Where should the city send the 50 evacuation fleet buses? Be ready to justify your thinking.
3) Does it make sense for the city to concentrate its resources on the eastern shore of the island? Why or why not?
Several formal terms are used in the discussion above.
• Census: the procedure of systematically enumerating, and acquiring and recording information about all members of a given population. https://en.wikipedia.org/wiki/Census
• Census tract: a geographic region roughly equivalent to a neighborhood established by the United States Bureau of Census for the purpose of taking a census. They generally encompass a population between 2,500 to 8,000 people. Sometimes these coincide with the limits of cities, towns or other administrative areas and several tracts commonly exist within a county. https://www2.census.gov/geo/pdfs/education/CensusTracts.pdf
• Census block: a statistical area contained within a Census tract, generally small. In a city, a census block may look like a city block bounded on all sides by streets. Census blocks in suburban and rural areas may be large, irregular, and bounded by a variety of features, such as roads, streams, and transmission lines. In remote areas, census blocks may encompass hundreds of square miles. https://www.census.gov/newsroom/blogs/random-samplings/2011/07/what-are-census-blocks.html
• Storm surge: maybe be called a storm flood, tidal surge, or storm tide, a coastal flood or tsunami-like phenomenon of rising water commonly associated with low-pressure weather systems, such as cyclones. It is measured as the rise in water level above the normal tidal level, and does not include waves. https://en.wikipedia.org/wiki/Storm_surge
Students should validate their models either by asking whether the models make sense in different scenarios related to the context or by finding other information to reflect against the model. The suggestions below might be useful in helping students think about whether their model was reasonable:
1. Students should compare their results to the results others found. If the results are quite different, students should reexamine what they did.
2. Students might research Hurricane Sandy to see which areas actually did flood during the hurricane and how these compared to the results of their work.

Modeling: Optimizing Resources using Census Data TEACHER NOTES
©2021 Texas Instruments Incorporated 11 education.ti.com
Extension
1. Research the history of the US census and write a short report that includes the original purpose, how the census was started, who was counted, and major shifts over the years.
2. Check with your local city or county government for how they make use of census data in managing the city.
3. A serious problem in the US census is the undercount. Why is this a problem? What are some of the strategies that have been (or might be) used to minimize the undercount.
4. The diagram below shows the community areas for Staten Island. Write a short report about one of the areas that is near one of the census tracts you identified as having flooded: describe the community (e.g., urban, suburban, commercial, the standard of living, educational institutions)
5. Explain what Donnelly, a Woods Hole sedimentary geologist, meant by the following statement: "In the last 200 years, we've built cities on barrier islands and wetlands, more people are living on the beach, and sea level is rising." Donnelly said. "We're much more vulnerable than we were almost 200 years ago." https://www.livescience.com/24616-hurricane-sandy-staten-island-effects.html
6. Investigate what is meant by a “100-year flood”. What are the chances you will have two “100-year floods” in a ten year period?
7. Joe Salvo, the director of the population division in New York City’s Department of City Planning said, “Turns out, you can really do well with 50 buses if you have the right data. Explain what he meant. (Subramanian, 2020)
References: Subramanian, S. (2020). Data Disappeared. Huff Post Highline https://highline.huffingtonpost.com/article/disappearing-data/#

Modeling: Optimizing Resources using Census Data TEACHER NOTES
©2021 Texas Instruments Incorporated 12 education.ti.com
Data Sheet:
Census Tract
# blocks
Elevation (ft)
%≥65 #≥65 #≥75 Population White % white
248 64 49 10.8 537 184 4985 4281 85.9 244.01 56 38 12.8 770 400 6131 5213 85 244.02 67 7 9.4 400 244 4654 4251 91.3 198 129 16 14.3 936 366 6538 5656 86.5 176 135 30 17.4 818 231 4770 4372 91.7 156.01 80 69 18 1159 487 6423 5715 85 156.02 51 39 20.7 693 363 3342 3168 94.8 156.03 57 13 12.5 594 149 4750 3903 82.6 154 8 10 0 0 0 0 0 0 132.03 58 79 22 1190 553 5604 4343 77.5 132.04 85 23 17.8 855 394 4793 4125 86.1 132.01 31 23 21.6 324 218 1497 1167 78.6 134 66 20 20.2 836 327 4134 3228 78.1 128.05 30 10 100 459 207 2591 2085 80.5 128.06 46 7 18.8 1048 560 5574 3629 65.1 128.04 33 10 12.6 506 184 4001 3095* 77.4 122 58 23 18.2 695 223 3823 3381 88.4 114.02 38 23 15.2 530 284 3496 2885 82.5 114.01 30 10 13.8 403 170 2913 1359 46.7 96.02 45 20 16.2 529 233 3262 2459 75.4 96.01 42 16 25.3 1069 584 4222 3075 72.8 64 34 56 12.5 415 161 3326 1794 53.9 20.02 41 85 18.9 656 336 3463 2718 78.5 20.01 39 89 13.4 365 144 2721 1679 61.7 36 26 46 11.3 301 149 2657 1187 44.7 40 79 49 10.6 1370 553 12897 1007 7.8 27 8 43 18.4 372 186 2025 613 30.3 29 34 46 11.8 550 191 4674 367* 7.9 112.02 85 3 100 1202 304 5479 2886 52.7 112.01 69 7 14.3 862 388 6045 4511 * 74.6 70 97 20 12.4 1121 664 9011 5658 * 62.8 74 36 46 13.3 636 236 4782 2854 59.7 18 39 98 3 18 3 603 374 * 62 6 27 13 26.9 633 375 2351 1382 58.8 8 53 56 14.2 772 249 5433 2747 50.6 21 54 72 8.2 331 116 4061 972 23.9 3 13 66 14.6 288 77 1967 634 42.2 7 17 138 12.3 638 339 5182 732 14.1 81 37 190 22.8 1094 595 4802 1206 25.1 36 26 46 11.3 301 151 2657 1187 44.7 17 14 187 13.8 196 67 1425 512 35.9 9 14 190 9.5 173 23 1826 406 22.2 97 46 174 12.1 511 129 4232 1477 34.9 181 50 20 32.4 995 468 3068 2538 82.7 279 45 108 31.3 689 409 2203 1806 82 146.04 38 79 13.2 814 287 6174 5567 92 146.05 49 105 19.6 780 363 3970 3351 84.4 138 94 154 24 1450 735 6054 4724 78 50 57 92 16.8 690 327 4118 2494 60.6 177 116 243 18.6 1160 561 6246 5254 84.1

Modeling: Optimizing Resources using Census Data TEACHER NOTES
©2021 Texas Instruments Incorporated 13 education.ti.com
11 20 161 8.3 283 43 3402 555 16.3 170.11 41 75 22.3 1034 432 4627 3962 85.6
*estimated https://popfactfinder.planning.nyc.gov/#15.8/40.575866/-74.111737 https://elevation.maplogs.com/poi/staten_island_ny_usa.514.html