modeling residential adoption of solar pv in qatar
TRANSCRIPT
Modeling Residential Adoption of Solar PV in Qatar
Marwa Al Fakhri†, Nassma Mohandes
‡, Antonio Sanfilippo
‡
†QRLP Program, Qatar Foundation; ‡Qatar Environment & Energy Research Institute, HBKU
{malfakhri, nsalim, asanfilippo}@qf.org.qa
Abstract. We present an agent-based model for residential adoption of photo-
voltaic (PV) systems in Qatar where agents are defined as households within
the Al Rayyan municipality in Doha. Each household corresponds to a villa-
type accommodation, which is either owned or rented. The objective of the
model is to evaluate PV adoption behaviors across these two household cohorts
under diverse regulatory and incentive scenarios. The study suggests that the
national goal of 20% electricity production through solar energy by 2030 can be
facilitated by using current electricity subsidies to incentivize PV adoption, in-
troducing a carbon tax, and extending the electricity tariff to all dwellers, citi-
zens and expatriates alike.
Keywords: PV adoption; energy cost; energy policy; agent based modeling.
1 Introduction
This study analyzes the impact of home ownership, electricity subsidies, the intro-
duction of a carbon tax, and the diffusion of innovation on the residential adoption of
solar photovoltaic technologies (PV) in Qatar. The integration of any significant
amounts of renewable energy into the power grid generates interconnected changes
with deep and long-lasting effects on the technical, economic and social fabric of a
nation. Designing the right policies to promote and regulate renewable energy is cru-
cial in ensuring that the ensuing changes will have positive outcomes. In this paper,
we take the first step towards developing a social simulation approach capable of
supporting policymakers and other stakeholders to examine alternative energy policy
scenarios in order to establish the optimal combination of incentives and regulations
for the integration of solar renewable energy in Qatar’s power grid.
Government institutions around the world have been developing financial incentive
and regulatory frameworks to encourage utility companies and end-users to adopt
solar and other renewable energy technologies. Financial incentives include measures
such as the solar Investment Tax Credit in the US, and the Feed-in Tariff currently
enforced in about 80 countries around the world [1]. Net Metering, Renewable Portfo-
lio Standard, Tendering/Auctioning, and Renewable Energy Certificates are the most
widely used regulations to promote the adoption of renewable energy technologies.
The right combination of incentives and regulations needs to be evaluated with ref-
erence to the governance, legal, economic and cultural context of each geopolitical
entity to maximize the adoption of solar and other renewable energy technologies.
For example, the Feed-in Tariff in combination with Net Metering has greatly benefit-
ted the adoption of renewable energy in several European countries, but its adoption
has been relatively slow in North America, where other forms of incentivization such
as the solar Investment Tax Credit have played a stronger role.
Qatar and other GCC countries have economic and energy policy regimes that are
rather different from those found in countries with significant renewable energy pene-
tration. Policies developed elsewhere may not be applicable or successful. For exam-
ple, tax credit incentives cannot be adopted in Qatar due to the absence of income tax.
Moreover, electricity is highly subsidized in all GCC countries and free for private
citizens in Qatar. According to the International Energy Agency (IEA), electricity
subsidies in Qatar averaged $2.1bn in the period 2012-14 (Table 1). Natural gas has
also been strongly subsidized, as shown in Table 1, and a significant part of natural
gas subsidies supports electricity costs since electricity is almost entirely produced
from gas in Qatar.
Table 1. Electricity and natural gas subsidies in Qatar (billion USD). Source: IEA [2].
Product 2012 2013 2014
Electricity 2.1 2.0 2.3
Gas 1.6 1.5 1.6
Home ownership status is also a determinant factor in modeling PV adoption in
Qatar since citizens do not pay for utilities and only citizens can buy properties in
most municipalities. Others living in these municipalities as renters tend to be expatri-
ates or long-term residents. Because each household type has different electricity
costs, incentives and regulations are likely to engender diverse PV adoption behav-
iors. In developing a PV adoption model for Qatar, our objective is to evaluate the
adoption behaviors of owner and renter households and explore how these may
change in alternative energy policy scenarios.
2 Background
Complex-systems approaches, including agent-based and system-dynamics model-
ing techniques, have been used successfully in the development of decision support
tools for policy evaluation of renewable energy generation systems in their geopoliti-
cal context. For example, Zhao et al. [3] propose a two-level simulation modeling
framework to analyze the effectiveness of incentive and regulation policies on the
growth rate of distributed PV systems. Paidipati et al. [4] describe a model of market
penetration of rooftop PV in each of the 50 US states which takes into account the
technical potential of rooftop PV and payback period for rooftop PV investments. The
SolarDS model [5] simulates PV adoption on residential and commercial rooftops in
the continental US through 2030 by aggregating regional PV adoption to the state and
national levels, where lower PV costs were fostered including net-metering incentives
and policies pricing carbon emissions of competing energy sources. Graziano & Gil-
lingham [6] examined the spatial pattern of rooftop PV adoption in Connecticut tak-

ing into account housing density, share of renters vs. home owners, and the “neighbor
effect” according to which adoptions increase in the vicinity of existing installations.
These and other simulation approaches to modeling the adoption of renewable en-
ergy represent important steps forward in understanding the impact of policy on solar
PV adoption. However, these efforts are typically based on systemic assumptions
about incentives and regulations for renewable energy such as tax credits, the Feed-in
Tariff and Net Metering. These incentives and regulations do not apply to Qatar since
there is no income tax, citizens have free electricity, the electricity tariff is strongly
subsidized, and the Feed-in Tariff and Net Metering have not been implemented.
3 Approach
Following [7, 8], we develop an agent-based modeling approach where PV adop-
tion is driven by cost. Agents represent two types of households: owners and renters.
The lower the cost of electricity from PV, the more likely are household agents to
adopt rooftop solar PV. Several factors can contribute to lower the cost of electricity
from PV in the Qatari context including:
the use of electricity subsidies and the portion of gas subsidies used for elec-
tricity production to incentivize PV adoption
the introduction of a carbon tax
the extension of electricity costs to Qatari citizens
a neighborhood effect, which implements the diffusion of PV innovation as a
percent discount on PV costs.
In the scenarios analyzed in this study, we assume the following settings for these
factors (see section 4 for details):
Redirection of 40% of electricity subsidies to renewable energy, which would
lower the cost of PV by $0.0232/ kilowatt hour (kWh)
Redirection of 40% of gas subsidies used for electricity production to renewa-
ble energy, which would lower the cost of PV by $0.0032/kWh
Introduction of a carbon tax, which would lower the cost of PV by
$0.0048/kWh
Extension of electricity costs to Qatari citizens, which would increase the elec-
tricity tariff for citizens from $0 to $0.02/kWh, in the timeframe addressed in
this study
A neighborhood effect, which implements the diffusion of PV innovation as a
percent discount on PV costs in the following manner:
15% discount on PV cost for a household that has not adopted yet and is
adjacent to a household that has already adopted and has the same home
ownership status (owned or rented)
7.5% discount on PV cost for a household that has not adopted yet and is
adjacent to a household with different home ownership status that has al-
ready adopted.
At the start of a simulation, the neighborhood effect is activated, and the base price
of electricity from rooftop solar PV (PV cost) of $0.1168/kWh (see section 4) is re-
duced as detailed in each of the following three scenarios:
1. Business as usual: no measures are introduced to incentivize PV, and the
neighborhood effect is active – Reductions on PV cost for new adopters:
Expatriates (renters) and citizens (owners): neighborhood effect (15% or
7.5% of the cost of PV)
Expatriates: cost of electricity ($0.02/kWh).
2. 40% of gas and electricity subsidies which currently support non-renewable
energy are used to incentivize PV, the carbon tax and the neighborhood ef-
fect are active, and citizens continue to have free electricity – Reductions on
PV cost for new adopters:
Expatriates and citizens: neighborhood effect, cost of carbon
($0.0048/kWh), electricity and gas subsidies ($0.0264/kWh)
Expatriates: cost of electricity.
3. 40% of gas and electricity subsidies which currently support non-renewable
energy are used to incentivize PV, the carbon tax and the neighborhood ef-
fect are active, and both citizens and expatriates pay for electricity – Reduc-
tions on PV cost for new adopters:
Expatriates and citizens: neighborhood effect, cost of carbon, electricity
and gas subsidies, cost of electricity.
To verify the relative impact of the neighborhood effect and the carbon tax, scenarios
are also simulated with the neighborhood effect and carbon tax active and deactivated.
Households adopt solar PV with a probability established by the logistic function
in (1), where is a scaling constant, is the natural logarithm, is the final cost of
PV, and is a parameter which determines the slope of the adoption curve. The final
cost of PV is obtained by subtracting the following costs from the non-discounted cost
of PV: (a) the electricity tariff; (b) the neighborhood effect, and (c) the carbon tax and
subsidies when these are active. Since all our quantities are probabilities, we set
. For the parameter, we select a value that in the business-as-usual scenario
yields a maximum PV market share of about 2.5% over 14 years ( . This
choice is motivated by the assumption that, in the absence of PV incentives and regu-
lations, only innovators are likely to adopt. Innovators correspond to 2.5% of the en-
tire market population according to Roger’s adoption/innovation curve [9].
(
(1)
At each simulation tick, each household agent that has not adopted yet, is presented
with the opportunity of doing so. Adoption is determined randomly according to the
output of the logistic function in (1): a random probability is generated, and if
( ( , adoption occurs. This process is detailed in the pseudo-code below,
where the cost of PV (nonDiscountedPVcost) and the utility tariff (UtilityTariff), the
carbon tax (CO2tax), and the k parameter are as set at the start of the simulation.
We simulated the three scenarios described above and their variants, using the Re-
past environment [10]. Each simulation was cycled for 14 years, with each simulation
tick corresponding to a year, so as to have PV adoption results relative to the 2030
Qatar target of 20% solar energy penetration [1].
if hasSolar(Household) = false
Pa = probabilityToAdopt
Pr = Random-float 1 % generate random number < 1
if Pa ≥ Pr
then hasSolar(Household) = true
else hasSolar(Household) = false.
probabilityToAdopt = 1 – (1 / (1 + e^-(k * finalPVcost))).
finalPVcost = nonDiscountedPVcost – UtilityTariff –
neighborhoodEffect – CO2tax – subsidies.
neighborhoodEffect =
if hasNeighborWithSolar(Household,Neighbor) = true
if sameOwnershipType(Household,Neighbor) = true
PVcost * 0.15
elseif sameOwnershipType(Household,Neighbor) = false
PVcost * 0.075
elseif hasNeighborWithSolar(Household,Neighbor) = false
0.
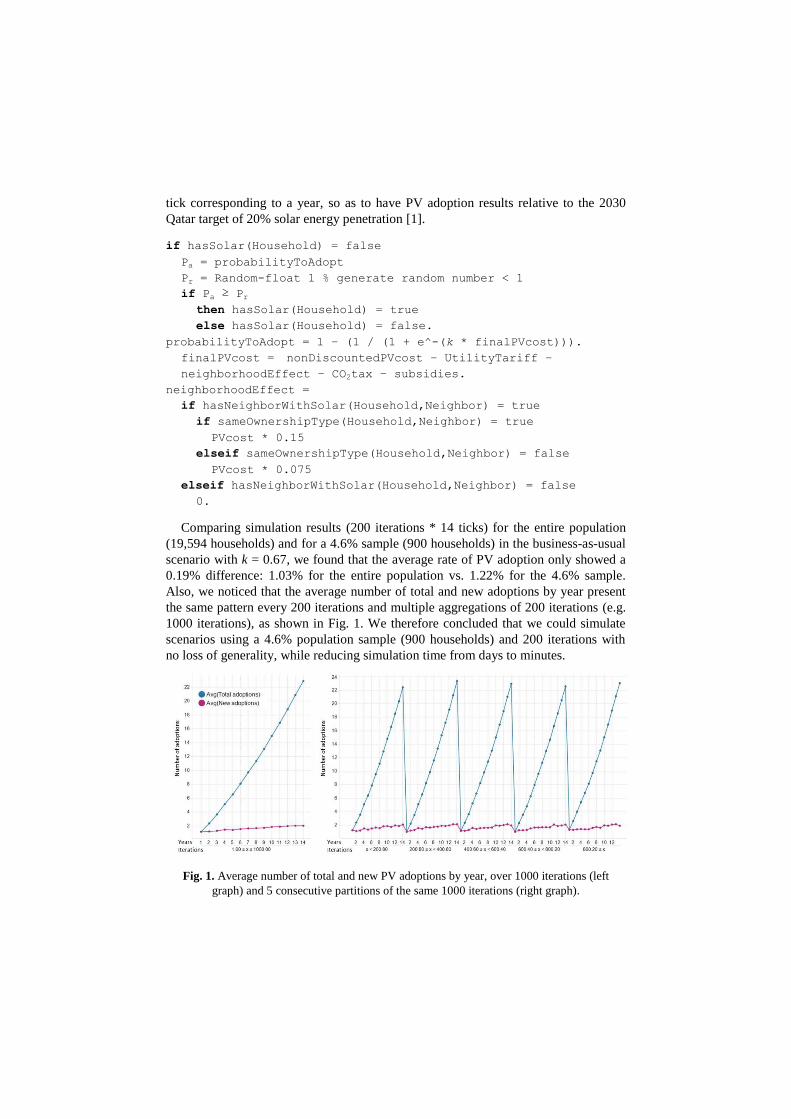
Comparing simulation results (200 iterations * 14 ticks) for the entire population
(19,594 households) and for a 4.6% sample (900 households) in the business-as-usual
scenario with k = 0.67, we found that the average rate of PV adoption only showed a
0.19% difference: 1.03% for the entire population vs. 1.22% for the 4.6% sample.
Also, we noticed that the average number of total and new adoptions by year present
the same pattern every 200 iterations and multiple aggregations of 200 iterations (e.g.
1000 iterations), as shown in Fig. 1. We therefore concluded that we could simulate
scenarios using a 4.6% population sample (900 households) and 200 iterations with
no loss of generality, while reducing simulation time from days to minutes.
Fig. 1. Average number of total and new PV adoptions by year, over 1000 iterations (left
graph) and 5 consecutive partitions of the same 1000 iterations (right graph).

4 Data
We used the household data from the most recent Qatar census [11], focusing on
villa accommodations in the Al Rayyan municipality. These include 19,594 units
housing 129,831 individuals, of which 21% were owned and 79% rented.
As base reference for PV costs, we used the recent award by the Dubai Electricity
and Water Authority to Acwa Power for a 200MW solar plant, at a fixed rate of
$0.0584/kWh over 25 years [12]. This level of PV cost for utility scale solar plants is
becoming a standard in the Middle East, as corroborated by an even lower recent
power purchase agreement secured by the Saudi Electric Company that will provide
solar energy at $0.049/kWh for a 50 megawatt PV plant [13].
We calculated the PV costs of rooftop solar by doubling the price of utility-scale
solar, following a recent study by the Brattle Group according to which the cost of
energy from a 300MW utility-scale PV solar plant is roughly one-half the cost energy
from an equivalent 300 MW of 5kW residential-scale systems [14]. The final cost of
rooftop solar PV was thus set at $0.1168/kWh.
We used data from 2013, since 2013 was the most recent year for which data about
total primary energy supply from natural gas and natural gas used for electricity pro-
duction in Qatar were available from IEA. Electricity costs and subsidies were calcu-
lated with reference to the following 2013 data from IEA, and Kahramaa (Qatar’s
utility transmission and distribution company):
Average electricity tariff for residential villas: $0.02/kWh
Electricity subsidies: $2,000,000,000 [2]
Gas subsidies: $1,500,000,000 [2]
Electricity production/output: 34,668,000,000 kWh [15]
Total primary energy supply from natural gas (production – exports):
39,233 Kilotonne of oil equivalent (KTOE) [16]
Natural gas used for electricity production: 7,329 KTOE [16].
Electricity subsidies per kWh were set at $0.058 by dividing electricity subsidies
by electricity production/output. Additional subsidies were calculated as the portion
of subsidies for natural gas used in electricity production. These subsidies were set at
$0.008/kWh by
1. Calculating the percentage of natural gas used for electricity production
(19%) as the quotient of natural gas used for electricity production divided
by total primary energy supply from natural gas
2. Taking the percentage of natural gas used for electricity production from the
total gas subsidies and dividing it by the number of kWh of electricity pro-
duced.
The resulting cost of electricity before subsidies is $0.086/kWh and consists of
$0.058/kWh of electricity subsidies, $0.008/kWh of gas subsidies, and the average
Kahramaa tariff of $0.02/kWh for residential villas.
The carbon tax was set to $8 per metric ton of carbon dioxide equivalent (tCO2e)
with reference to the spot market prices of EU Emission Allowances [17], according
to which the price of carbon has varied from €5.47-€8.63 per tCO2e in the last year.
The relative carbon tax per kWh was established as $0.0048 assuming that

10.11 cubic feet of natural gas are needed to generate 1 kWh [18]
10.11 cubic feet of natural gas are equivalent to 11,211.99 Btu [19]
Natural gas produces 0.000117lb of CO2 for each Btu generated [20].
We set the neighborhood effect as a maximum discount of 15% on PV costs fol-
lowing [8]. The dependence between discount rate and home ownership status is mo-
tivated by the fact that sharing the same home ownership status in the Al Rayyan
municipality implies some level of socioeconomic homogeneity (i.e. citizen vs. expat
or long-term resident). Socioeconomic homogeneity provides the basis for tighter
social network structures and shared belief systems that have been recognized as
promoting the extent of innovation diffusion [21, 22, 23].
5 Results
Table 2 provides the average percentage rates of total PV adoptions for each of the
three scenarios by owners, renters, and both. Average percentages were computed
across 200 iterations of each scenario simulation at the highest point of adoption (year
14). Results for the three scenarios are shown with the neighborhood effect (NE) ac-
tive (base scenario) and deactivated. Results for scenarios 2 and 3 are also given with
the carbon tax (CT) active (base scenario) and deactivated.
Table 2. Rates of PV adoptions at year 14 averaged over 200 iterations of each scenario for 900
households, of which 189 owned and 711 rented, in Doha’s municipality of Al Rayyan.
Scenarios % of total PV adop-
tions
% of PV adoptions by owners
% of own-ers who adopted
% of PV adoptions by renters
% of renters who adopt-
ed
1. Business as usual
Base scenario
NE deactivated
2.53% 1.75%
0.17% 0.11%
0.79% 0.52%
2.37% 1.64%
3.00% 2.08%
2. 40% of subsidies and CT for PV; free elec-tricity for citizens
Base scenario
NE deactivated
CT deactivated
75.16% 49.78% 68.98%
1.29% 0.67% 1.28%
6.14% 3.17% 6.08%
73.87% 49.12% 68.70%
93.51% 62.18% 89.97%
3. 40% of subsidies and CT for PV; citizens pay for electricity
Base scenario
NE deactivated
CT deactivated
93.43% 62.43% 86.76%
19.43% 13.14% 18.15%
92.52% 62.57% 86.44%
74.00% 49.29% 68.84%
93.68% 62.39% 86.84%
The expected rate of PV adoption is very low in the business-as-usual scenario,
while it increases dramatically when subsidies and the carbon tax are used to incentiv-
ize PV adoption (base scenarios 2 and 3). The extension of the electricity tariff to

citizens (base scenario 3) shows a strong impact raising the expected rate of adoption
from 75.16% (base scenario 2) to 93.43% (base scenario 3). The neighborhood effect
exhibits a strong impact across all scenarios. The use of the carbon tax ($8/tCO2e) to
incentivize PV adoption has a modest impact, as shown by the 7% decrease in ex-
pected adoption rates when the carbon tax is deactivated in scenarios 2 and 3 respec-
tively.
Figure 2 displays the expected market shares (total adoptions) and adoption curves
(new adoptions) for the three base scenarios in Table 2 as percentage averages by
year. With scenario 1, the market share and adoption curves display an overall trend
of slow continuous growth. With scenarios 2 and 3, the market share and adoption
curves display a pattern typical of innovation adoption (Rogers 1962): the adoption
curve rises quickly in early years reflecting the behavior of the early adopter and early
majority consumer cohorts, and then displays a downward trend in later years typical
of late adopters and laggards. The market share curve does not reach full saturation in
either scenario, but it displays a pattern that preannounces such an outcome in the
near future, especially in scenario 3 where market share achieves a 93.43% level of
saturation at year 14.
Fig. 2. Expected market shares (total adoptions) and adoption curves (new adoptions) for the
three base scenarios in Table 2 as percentage averages by year.
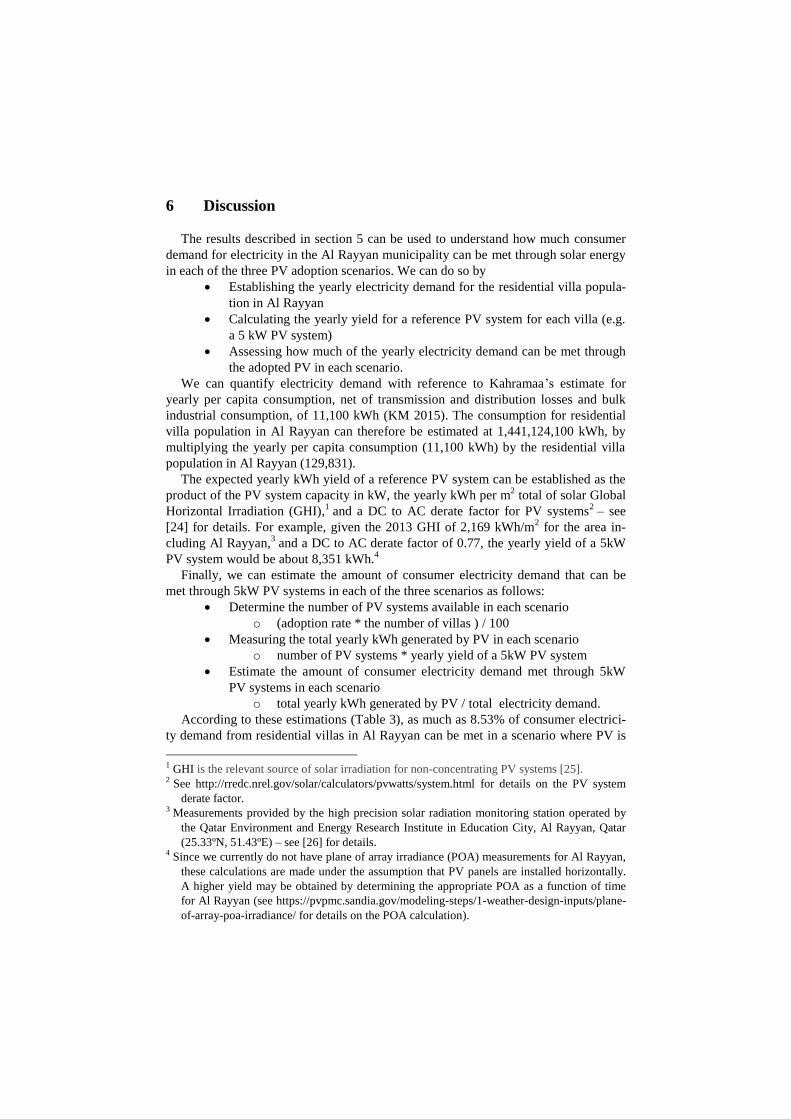
6 Discussion
The results described in section 5 can be used to understand how much consumer
demand for electricity in the Al Rayyan municipality can be met through solar energy
in each of the three PV adoption scenarios. We can do so by
Establishing the yearly electricity demand for the residential villa popula-
tion in Al Rayyan
Calculating the yearly yield for a reference PV system for each villa (e.g.
a 5 kW PV system)
Assessing how much of the yearly electricity demand can be met through
the adopted PV in each scenario.
We can quantify electricity demand with reference to Kahramaa’s estimate for
yearly per capita consumption, net of transmission and distribution losses and bulk
industrial consumption, of 11,100 kWh (KM 2015). The consumption for residential
villa population in Al Rayyan can therefore be estimated at 1,441,124,100 kWh, by
multiplying the yearly per capita consumption (11,100 kWh) by the residential villa
population in Al Rayyan (129,831).
The expected yearly kWh yield of a reference PV system can be established as the
product of the PV system capacity in kW, the yearly kWh per m2 total of solar Global
Horizontal Irradiation (GHI),1 and a DC to AC derate factor for PV systems
2 – see
[24] for details. For example, given the 2013 GHI of 2,169 kWh/m2 for the area in-
cluding Al Rayyan,3 and a DC to AC derate factor of 0.77, the yearly yield of a 5kW
PV system would be about 8,351 kWh.4
Finally, we can estimate the amount of consumer electricity demand that can be
met through 5kW PV systems in each of the three scenarios as follows:
Determine the number of PV systems available in each scenario
o (adoption rate * the number of villas ) / 100
Measuring the total yearly kWh generated by PV in each scenario
o number of PV systems * yearly yield of a 5kW PV system
Estimate the amount of consumer electricity demand met through 5kW
PV systems in each scenario
o total yearly kWh generated by PV / total electricity demand.
According to these estimations (Table 3), as much as 8.53% of consumer electrici-
ty demand from residential villas in Al Rayyan can be met in a scenario where PV is
1 GHI is the relevant source of solar irradiation for non-concentrating PV systems [25]. 2 See http://rredc.nrel.gov/solar/calculators/pvwatts/system.html for details on the PV system
derate factor. 3 Measurements provided by the high precision solar radiation monitoring station operated by
the Qatar Environment and Energy Research Institute in Education City, Al Rayyan, Qatar
(25.33ºN, 51.43ºE) – see [26] for details. 4 Since we currently do not have plane of array irradiance (POA) measurements for Al Rayyan,
these calculations are made under the assumption that PV panels are installed horizontally.
A higher yield may be obtained by determining the appropriate POA as a function of time
for Al Rayyan (see https://pvpmc.sandia.gov/modeling-steps/1-weather-design-inputs/plane-
of-array-poa-irradiance/ for details on the POA calculation).
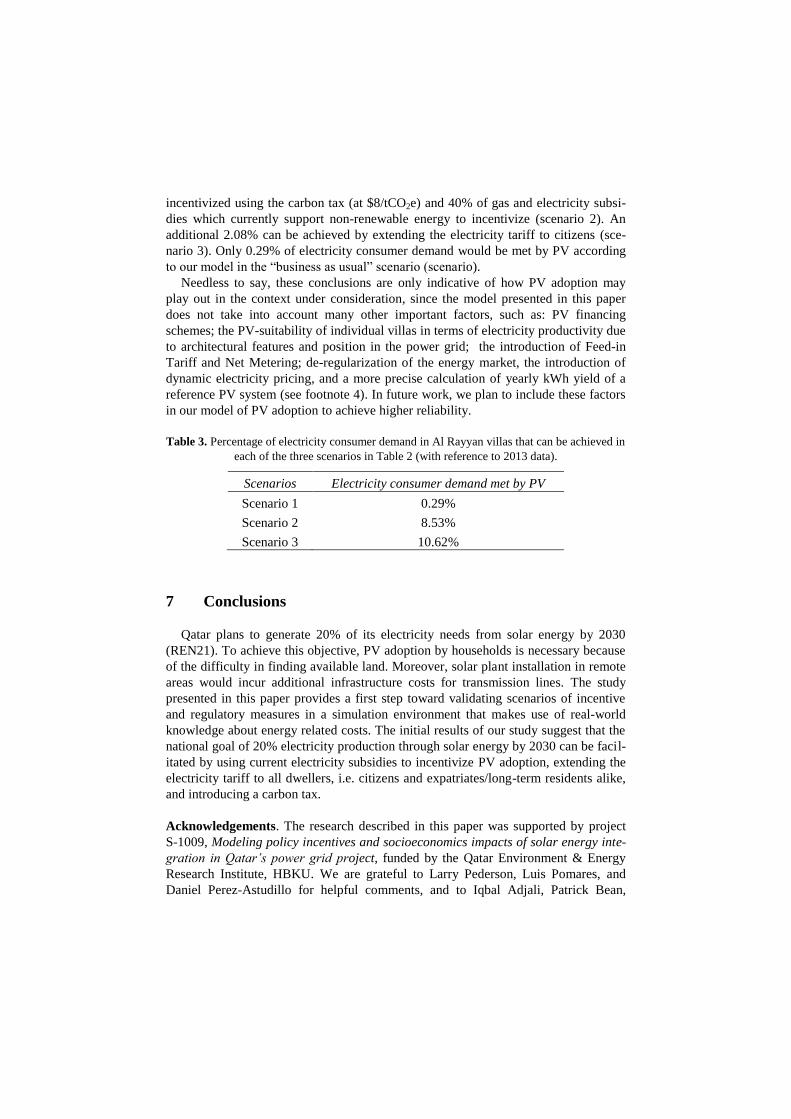
incentivized using the carbon tax (at $8/tCO2e) and 40% of gas and electricity subsi-
dies which currently support non-renewable energy to incentivize (scenario 2). An
additional 2.08% can be achieved by extending the electricity tariff to citizens (sce-
nario 3). Only 0.29% of electricity consumer demand would be met by PV according
to our model in the “business as usual” scenario (scenario).
Needless to say, these conclusions are only indicative of how PV adoption may
play out in the context under consideration, since the model presented in this paper
does not take into account many other important factors, such as: PV financing
schemes; the PV-suitability of individual villas in terms of electricity productivity due
to architectural features and position in the power grid; the introduction of Feed-in
Tariff and Net Metering; de-regularization of the energy market, the introduction of
dynamic electricity pricing, and a more precise calculation of yearly kWh yield of a
reference PV system (see footnote 4). In future work, we plan to include these factors
in our model of PV adoption to achieve higher reliability.
Table 3. Percentage of electricity consumer demand in Al Rayyan villas that can be achieved in
each of the three scenarios in Table 2 (with reference to 2013 data).
Scenarios Electricity consumer demand met by PV
Scenario 1 0.29%
Scenario 2 8.53%
Scenario 3 10.62%
7 Conclusions
Qatar plans to generate 20% of its electricity needs from solar energy by 2030
(REN21). To achieve this objective, PV adoption by households is necessary because
of the difficulty in finding available land. Moreover, solar plant installation in remote
areas would incur additional infrastructure costs for transmission lines. The study
presented in this paper provides a first step toward validating scenarios of incentive
and regulatory measures in a simulation environment that makes use of real-world
knowledge about energy related costs. The initial results of our study suggest that the
national goal of 20% electricity production through solar energy by 2030 can be facil-
itated by using current electricity subsidies to incentivize PV adoption, extending the
electricity tariff to all dwellers, i.e. citizens and expatriates/long-term residents alike,
and introducing a carbon tax.
Acknowledgements. The research described in this paper was supported by project
S-1009, Modeling policy incentives and socioeconomics impacts of solar energy inte-
gration in Qatar’s power grid project, funded by the Qatar Environment & Energy
Research Institute, HBKU. We are grateful to Larry Pederson, Luis Pomares, and
Daniel Perez-Astudillo for helpful comments, and to Iqbal Adjali, Patrick Bean,

Rolando Fuentes, Steve Kimbrough, Mohammed Muaafa, Fred Murphy, and Hisham
Akhonbay for insightful discussions on the PV adoption model used in the paper.
8 References
1. REN21 (2015) Renewables 2015 Global Status Report. http://www.ren21.net/status-of-
renewables/global-status-report/.
2. IEA (2015a) World Energy Outlook 2015. http://www.worldenergyoutlook.org/weo2015.
3. Zhao, J., Mazhari, E., Celik, N., and Son, Y.-J. (2011) Hybrid agent-based simulation for
policy evaluation of solar power generation systems. Simulation Modelling Practice and
Theory, 19(1):2189–2205.
4. Paidipati, J., Frantzis, L., Sawyer, H., Kurrasch, A. (2008) Rooftop Photovoltaics Market
Penetration Scenarios. National Renewable Energy Laboratory. NREL/SR-581-42306. Re-
trieved on July 26, 2015 from http://www.nrel.gov/docs/fy08osti/42306.pdf.
5. Drury, E., Denholm, P., & Margolis, R. (2010) Modeling the US rooftop photovoltaics
market. American Solar Energy Society, 1-7.
6. Graziano, M., Gillingham, K. (2014) Spatial patterns of solar photovoltaic system adop-
tion: the influence of neighbors and the built environment. Journal of Economic Geogra-
phy, pp. 1-25.
7. Bean, P., R. Fuentes, S. Kimbrough, and M. Muaafa (2015) Residential Solar PV Adoption
model, version 1.0. File: _Residential Solar PV Adoption Model 1.0.nlogo_,
http://modelingcommons.org/.
8. Adjali, I., Bean, P., Fuentes, R., Kimbrough, S., Muaafa, M., Murphy, F. (2016) Can
Adoption of Rooftop Solar PV Panels Trigger a Utility Death Spiral? A Tale of Two Cit-
ies. King Abdullah Petroleum Studies and Research Center, KS-1641-DP035A. Available
from https://www.kapsarc.org/?q=&all=publications.
9. Rogers, Everett M. (1962) Diffusion of innovations (1st ed.). New York: Free Press of
Glencoe.
10. North, M. J., Collier, N. T., Ozik, J., Tatara, E. R., Macal, C. M., Bragen, M., & Sydelko,
P. (2013). Complex adaptive systems modeling with Repast Simphony. Complex adaptive
systems modeling, 1(1), 1-26.
11. Q-Census (2010) Census of Population and Housing and Establishment 2010. Downloaded
on 29 June 2016 from http://www.qix.gov.qa/ on 04/18/2016.
12. Graves, L. (2015) UAE beats renewables cost hurdle with world’s cheapest price for solar
energy. TheNational, 18 January 2015. Consulted online on 29 June 2016 at
http://www.thenational.ae/business/energy/uae-beats-renewables-cost-hurdle-with-worlds-
cheapest-price-for-solar-energy.
13. Ayre, J. (2015) Another Low-Solar-Price Record: Saudi Electric Company Lands Solar
PPA Under 5¢/kWh. CleanTechnica, August 12th, 2015. Consulted online on 29 June
2016 at http://cleantechnica.com/2015/08/12/another-low-solar-price-record-saudi-electric-
company-lands-solar-ppa-5%C2%A2kwh/.
14. Tsuchida, B., Sergici, S., Mudge, B., Gorman, W., Fox-Penner, P., & Schoene, J. (2015).
Comparative Generation Costs of Utility-Scale and Residential-Scale PV in Xcel Energy
Colorado’s Service Area. The Brattle Group.
15. KM (2015) Statistics Report 2014. Downloaded 29 June 2016 from
https://www.km.com.qa/MediaCenter/Publications/Kahramaa_Statistics%20Report%2020
14.pdf.
16. IEA (2015b) Qatar: Balances 2013. Consulted online on 29 June 2016 at
https://www.iea.org/statistics/statisticssearch/report/?year=2013&country=Qatar&product
=Balances.
17. EUEA (2016) EU Emission Allowances. https://www.eex.com/en/market-data/emission-
allowances/spot-market/european-emission-allowances.
18. EIA (2016a) FREQUENTLY ASKED QUESTIONS: How much coal, natural gas, or pe-
troleum is used to generate a kilowatt-hour of electricity? Consulted online on 29 June
2016 at https://www.eia.gov/tools/faqs/faq.cfm?id=667&t=8.
19. ISU (2016) Natural Gas and Coal Measurements and Conversions. Iowa State University,
Consulted at https://www.extension.iastate.edu/agdm/wholefarm/html/c6-89.html on 29
June 2016.
20. EIA (2016b) FREQUENTLY ASKED QUESTIONS: How much carbon dioxide is pro-
duced when different fuels are burned? Consulted online on 29 June 2016 at
https://www.eia.gov/tools/faqs/faq.cfm?id=73&t=11.
21. Valente, T. W. (1996). Social network thresholds in the diffusion of innovations. Social
networks, 18(1), 69-89.
22. Abrahamson, E., & Rosenkopf, L. (1997). Social network effects on the extent of innova-
tion diffusion: A computer simulation. Organization science, 8(3), 289-309.
23. Janssen, M. A., & Jager, W. (2003). Simulating market dynamics: Interactions between
consumer psychology and social networks. Artificial Life, 9(4), 343-356.
24. NREL (2003) A Consumer’s Guide – Get Your Power from the Sun. Downloaded from
http://www.nrel.gov/docs/fy04osti/35297.pdf on 29 June 2016.
25. Pelland, S., Remund, J., Kleissl, J., Oozeki, T., De Brabandere, K. (2013) Photovoltaic and
solar forecasting: state of the art. IEA PVPS Task 14, Subtask 3.1. Report IEA-PVPS T14-
01: October 2013.
26. Perez-Astudillo, D., Bachour, D., 2014. DNI, GHI and DHI ground measurements in Do-
ha, Qatar. Energy Procedia 49, 2398–2404.