modeling revetment removal and implications for …
TRANSCRIPT
Modeling Revetment Removal: Technical Report
1
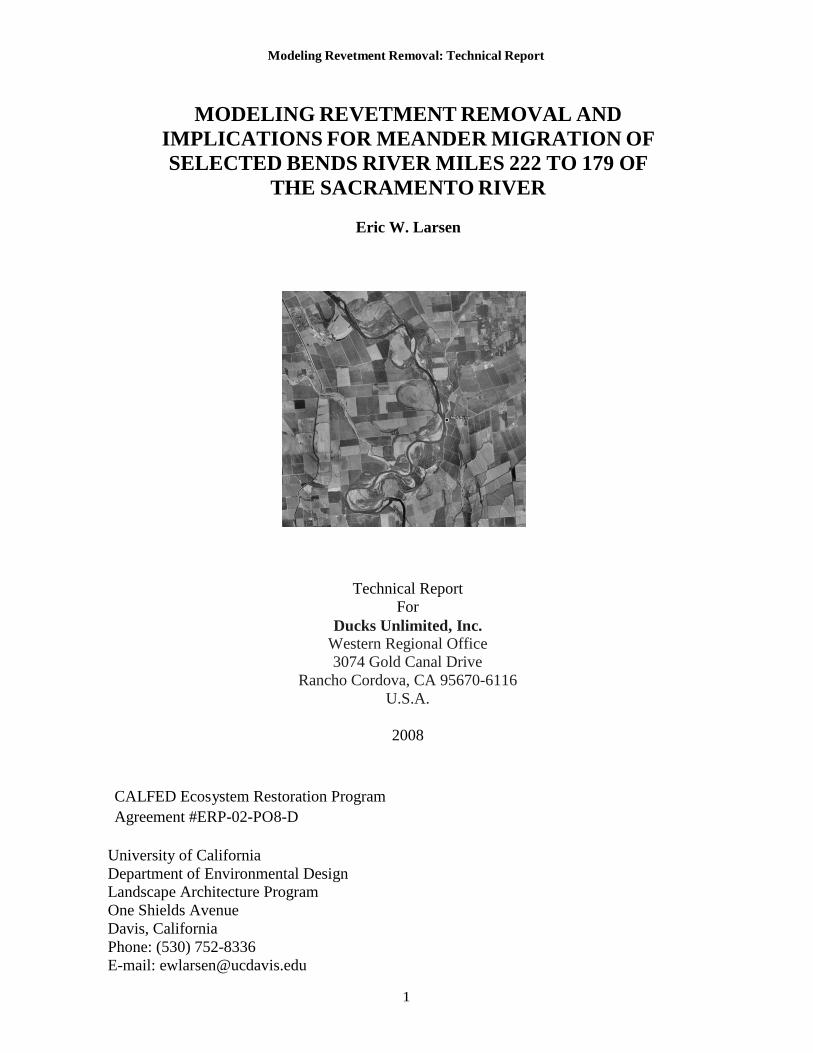
MODELING REVETMENT REMOVAL AND
IMPLICATIONS FOR MEANDER MIGRATION OF
SELECTED BENDS RIVER MILES 222 TO 179 OF
THE SACRAMENTO RIVER
Eric W. Larsen
Technical Report
For
Ducks Unlimited, Inc. Western Regional Office
3074 Gold Canal Drive
Rancho Cordova, CA 95670-6116
U.S.A.
2008
CALFED Ecosystem Restoration Program
Agreement #ERP-02-PO8-D
University of California
Department of Environmental Design
Landscape Architecture Program
One Shields Avenue
Davis, California
Phone: (530) 752-8336
E-mail: [email protected]
Modeling Revetment Removal: Technical Report
2
Contents
Executive summary........................................................................................................... 4 1.0 Introduction................................................................................................................ 5
2.0 Methods....................................................................................................................... 5
2.1 Site Description......................................................................................................... 5
2.1.1 Study Area: River Segments Modeled............................................................... 7
2.1.2 RM 201-222: Woodson Bridge Segment........................................................... 7 2.1.3 RM 185-201: Hamilton City Segment ............................................................... 7
2.1.3 RM 170-185: Ord Ferry Segment ...................................................................... 7
2.2 Individual bend sites ................................................................................................. 7
2.3 Input variables and Calibration................................................................................ 9
2.3.1 Model Parameters for Calibration and Prediction Runs .................................... 9
2.3.2 Heterogeneous erosion field ............................................................................ 12 2.3.3 Variable flow ................................................................................................... 12
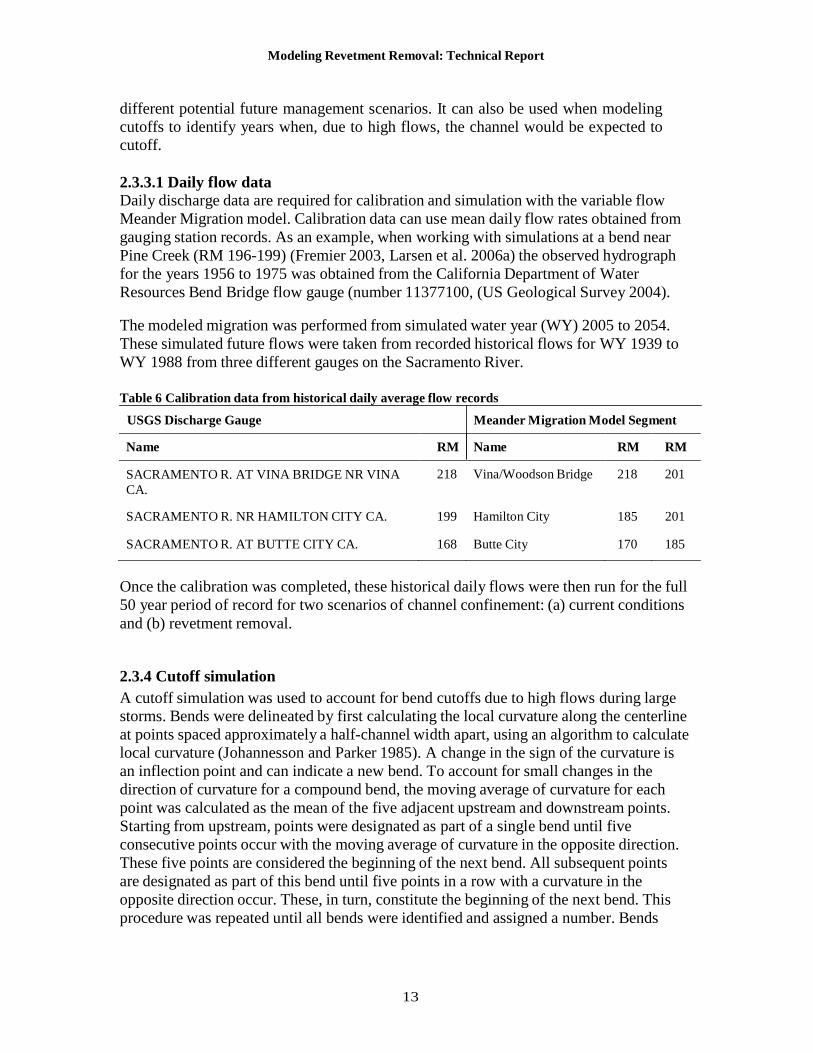
2.3.3.1 Daily flow data.......................................................................................... 13
2.3.4 Cutoff simulation ............................................................................................. 13
2.3.5 Calibrations: Centerline Agreement ................................................................ 15
2.3.5.1 Woodson Bridge Segment ........................................................................ 16
2.3.5.2 Hamilton City Segment............................................................................. 17
2.3.5.3 Ord Ferry Segment.................................................................................... 18 3.0 Results ........................................................................................................................ 19
3.1 Woodson Bridge Reach........................................................................................... 20
3.1.1 RM 221R.......................................................................................................... 20
3.1.2 RM 216L .......................................................................................................... 21
3.2 Hamilton City Reach............................................................................................... 22
3.2.1 RM 197-8R ...................................................................................................... 22
3.2.2 RM 196L .......................................................................................................... 23 3.2.3 RM 191-2R ...................................................................................................... 24
3.2.4 RM 191L .......................................................................................................... 25
3.2.5 RM 186L .......................................................................................................... 26
3.2.6 RM 186R.......................................................................................................... 27
3.3 Ord Ferry Reach ..................................................................................................... 28
3.3.1 RM 179R.......................................................................................................... 28 4.0 Discussion................................................................................................................... 29
5.0 References .................................................................................................................. 30
Modeling Revetment Removal: Technical Report
3
List of Figures Figure 1 Sacramento River Study segments ....................................................................... 6
Figure 2 Calibration Woodson Bridge segment................................................................ 16
Figure 3 Calibration Hamilton City segment.................................................................... 17
Figure 4 Calibration Ord Ferry segment ........................................................................... 18
Figure 5 Woodson Bridge Reach revetment at RM 221R ................................................ 20
Figure 6 Woodson Bridge Reach revetment at RM 216L ................................................ 21
Figure 7 Hamilton City revetment at RM 197-8R ............................................................ 22
Figure 8 Hamilton City revetment at RM 196L................................................................ 23
Figure 9 Hamilton City revetment at RM 191-2L ............................................................ 24
Figure 10 Hamilton City revetment at RM 191L.............................................................. 25
Figure 11 Hamilton City revetment at RM 186L.............................................................. 26
Figure 12 Hamilton City revetment at RM 186R ............................................................. 27
Figure 13 Ord Ferry Reach revetment at RM 179R ......................................................... 28
List of Tables
Table 1 Original list of potential bank revetment removal sites ......................................... 8
Table 2 Individual sites modeled ....................................................................................... 9
Table 3 Hydrologic and channel input values for migration model ................................... 9
Table 4 D50 particle size of the bed surface material......................................................... 9
Table 5 Model parameters for calibration and prediction runs ......................................... 11
Table 6 Calibration data from historical daily average flow records................................ 13
Modeling Revetment Removal: Technical Report
4
EXECUTIVE SUMMARY This report describes analyses to study the meander migration patterns 50 years into the
future when revetment is removed on selected bends of the Sacramento River between River
Miles (RM) 222 and 179. Previous studies have been done to document the channel
dynamics near the location of the M&T pumping plant near RM 192 (Larsen and Cui 2004,
Larsen 2005b, a, 2006). The current report describes modeling that can be used to understand
the patterns of migration at individual bends on a bend-by-bend basis, and to compare the
extent of migration when revetment is removed and when it is in place.
The modeled scenarios simulate meander migration patterns from a 2004 river planform to
50 years in the future. The simulation scenarios utilize calibration, a spatially variable
erosion field, and a variable hydrograph. River bends were identified where existing
revetment exists and could possibly be removed. Modeling was performed that first
simulated the future migration with the revetment in place, and then simulated the migration
with the revetment removed.
The details of modeling techniques, the background on the meander migration model, and
key assumptions are not repeated in this report and can be found in previous reports (Larsen
and Cui 2004, Larsen 2005b, a). The current study incorporated a variable flow algorithm
that relates yearly migration rates to the observed (or modeled) flow in that year. The
modeled migration was performed from simulated water year (WY) 2005 to 2054. These
simulated future flows were taken from recorded historical flows for WY 1939 to WY 1988
from three different gauges on the Sacramento River. In addition a prototype model for
channel cutoff was used to assess the potential for chute cutoff when revetment was removed.
For the purposes of calibration and modeling, the river was broken into three segments and a
total of nine modeling scenarios are described as shown in the following table, where the “R”
and “L” refer to left or right when looking downstream.
Reach name Modeled bends
Woodson Bridge 220-222R 216-217L
Hamilton City 197-198R 191-192R 186R 186.5L 191.5L 197.5R
Ord Ferry 179R
For each of the nine scenarios, maps were produced that show the migration patterns 50 years
into the future, with channel locations at 5-yr increments. When the nine sites are considered
as a whole, two of the sites have limited increase in migration when revetment is removed,
and one site experiences cutoff. Migration of the bend at RM 196L is limited by the natural
restraint to the east. Migration of the bend at RM 186R is modeled to move away from the
revetment. The bend at RM 179R cuts off when the revetment is removed. At the remaining
six sites, revetment removal results in significant increases in area reworked. At some sites,
there is also some change in the pattern and quantity of area reworked in the bend
immediately downstream. These findings, when considered in relation to other criterion, will
help consider the benefits, in terms of channel migration and area reworked, to be gained
when revetment removal is considered for mitigation or for other purposes, at the selected
sites on the Sacramento River.
Modeling Revetment Removal: Technical Report
5
1.0 INTRODUCTION This report describes analyses to study the meander migration patterns 50 years into the
future of selected bends of the Sacramento River between River Miles (RM) 222 and 179.
Previous studies have been done to document the channel dynamics near the location of the
M&T pumping plant near RM 192 (Larsen and Cui 2004, Larsen 2005b, a). The current
report describes modeling at individual bends that can be used to understand the patterns of
migration on a bend by bend basis, and to compare rates of migration between different bends.
The previous studies analyzed the meander migration dynamics 50 years into the future
starting with a channel location in 1997 (using data existing at that time) and reported
migration tendencies with a simulation of proposed groins in place (an eight dyke groin
field). Subsequent work used new data, consisting of a 2004 channel centerline, and also
simulated migration for 50 years into the future with and without simulation of the placement
of the eight dyke groin field, and with a newly proposed nine dyke groin field. The current
study incorporated a variable flow algorithm (Larsen et al. 2006a, Larsen et al. 2006b, Larsen
2007) that relates yearly migration rates to the observed (or modeled) flow in that year.
Simulation of future meander migration shows tendencies of the river dynamics at the scale
of approximately a meander bend or meander wavelength. Mathematical modeling of
geomorphic processes such as meander migration can provide information about tendencies.
Although such modeling can be accurate in predicting migration patterns, simulations are not
expected to produce precise point-by-point predictions of future channel locations. For this
reason, analyses results show patterns of meander migration, and can be effectively used to
compare patterns at different sites. In this study, the modeling is used to compare migration
rates at a number of individual bends. Such information can be used to consider effectiveness
of mitigation by estimating the amount of land reworked that would result from various
mitigation actions such as revetment removal.
The modeled scenarios simulate meander migration patterns from the 2004 river planform to 50 years in the future. The simulation scenarios utilize calibration and use a spatially
variable erosion field and a variable hydrograph. River bends were identified where existing revetment exists and could possibly be removed. Modeling was performed that first
simulated the future migration with the revetment in place, and then simulated the migration
with the revetment removed.
2.1 Site Description
2.0 METHODS
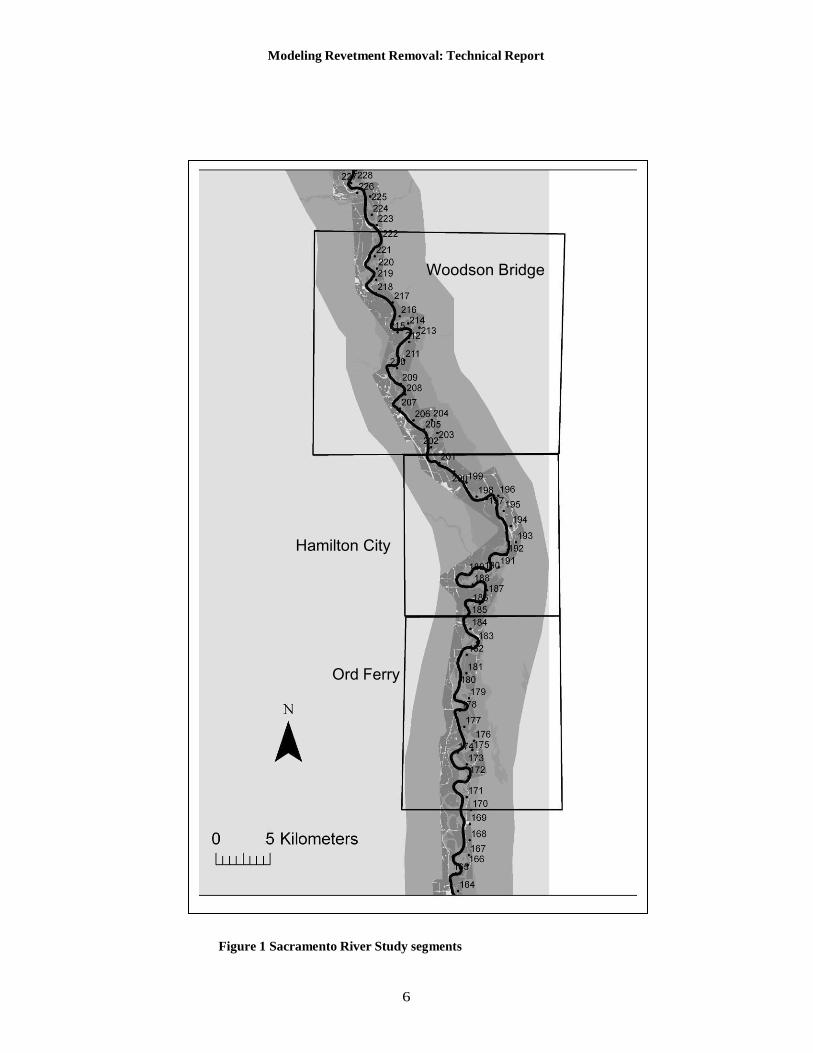
The individual bends of the Sacramento River that were modeled were located from River
Mile 222 to RM 179. This long reach of river was broken up into 3 segments based on
geomorphic similarities (Figure 1). The three reaches were then individually calibrated so
that the hydraulic (channel dimensions) and hydrologic (flow) characteristics were calibrated
for that segment (Larsen 2007).
Modeling Revetment Removal: Technical Report
6
Woodson Bridge
Hamilton City
Ord Ferry
Figure 1 Sacramento River Study segments
Modeling Revetment Removal: Technical Report
7
2.1.1 Study Area: River Segments Modeled
The segments of the Sacramento River where the meander migration was modeled were
based in part on previous studies that identified these segments as distinct separate
segments of roughly equal length that had roughly similar geomorphic characteristics. 2.1.2 RM 201-222: Woodson Bridge Segment
This segment includes Woodson Bridge State Recreation Area, which is an area near
which there is interest for possible removal of bank protection.
2.1.3 RM 185-201: Hamilton City Segment
This segment of the river includes the location of the M & T pumping plant. Previous
studies in this area have been performed (Larsen et al. 2002, Larsen and Cui 2004, Larsen
2005b, a, 2006, Larsen et al. 2006c). Some of these other studies have used a spatially
varied erosion field, and limited information on bank restraint, but did not incorporate
variable flows. Although some of the bends modeled in the current study were previously
modeled, the meander migration was remodeled for the current study so that the
modeling output would be done at similar conditions for all the bends modeled in all
three segments in order to ensure similar input conditions for comparing output. 2.1.3 RM 170-185: Ord Ferry Segment
This segment includes an important bend where there is a possibility to remove revetment
and allow a cutoff. Cutoff modeling was simulated at this bend.
2.2 Individual bend sites
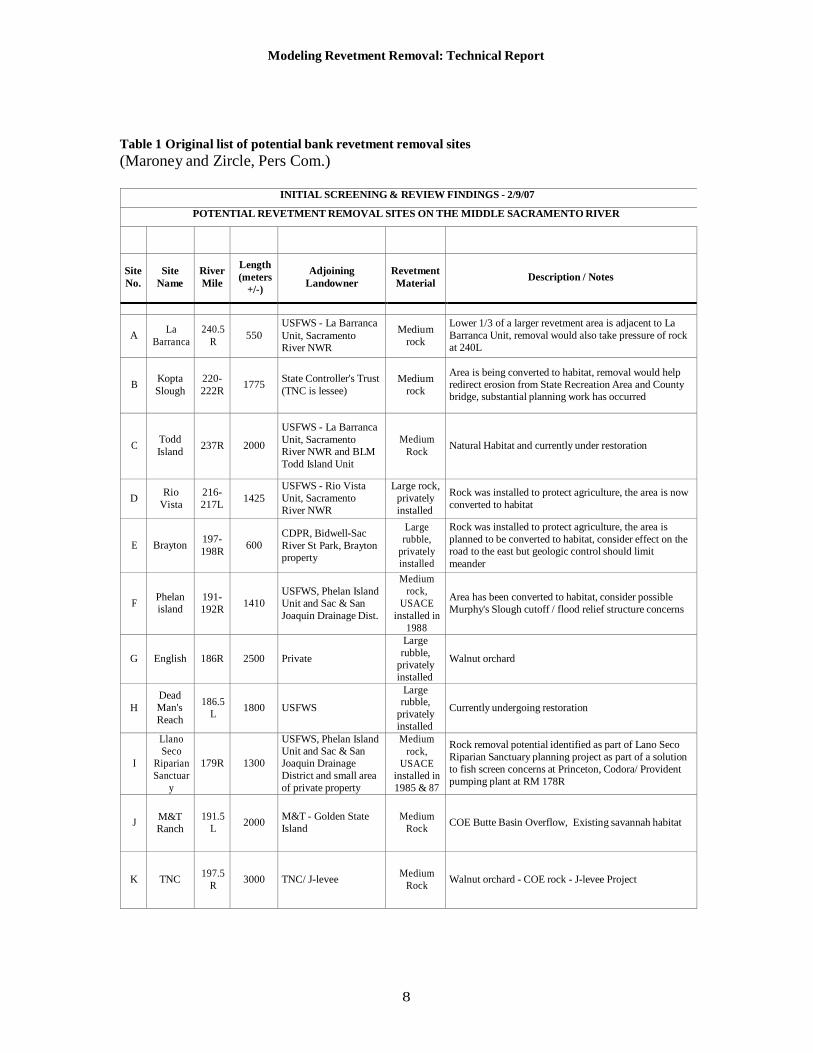
Eleven individual bend sites were selected by representatives of the USFWS and Duck’s
Unlimited (Pers. Com. Moroney and Zircle 2007) based on the potential for removing
revetment, and the list in Table 1 was provided.
Based on this list, discussions amongst team members resulted in nine sites being chosen
to model the effect of removing revetment. Two sites that were North of RM 235 were
judged to be outside the area of possible use for mitigation purposes. Although some of
these sites have been modeled in previous efforts for the M&T assessment, they were
redone using similar methods and comparable conditions and input across all nine sites.
Modeling Revetment Removal: Technical Report
8
Table 1 Original list of potential bank revetment removal sites
(Maroney and Zircle, Pers Com.)
INITIAL SCREENING & REVIEW FINDINGS - 2/9/07
POTENTIAL REVETMENT REMOVAL SITES ON THE MIDDLE SACRAMENTO RIVER
Site
No.
Site
Name
River
Mile
Length
(meters
+/-)
Adjoining
Landowner
Revetment
Material
Description / Notes
A
La
Barranca
240.5
R
550
USFWS - La Barranca
Unit, Sacramento River NWR
Medium
rock
Lower 1/3 of a larger revetment area is adjacent to La
Barranca Unit, removal would also take pressure of rock at 240L
B
Kopta
Slough
220-
222R
1775
State Controller's Trust
(TNC is lessee)
Medium
rock
Area is being converted to habitat, removal would help redirect erosion from State Recreation Area and County bridge, substantial planning work has occurred
C
Todd
Island
237R
2000
USFWS - La Barranca
Unit, Sacramento River NWR and BLM
Todd Island Unit
Medium
Rock
Natural Habitat and currently under restoration
D
Rio
Vista
216-
217L
1425
USFWS - Rio Vista
Unit, Sacramento
River NWR
Large rock,
privately
installed
Rock was installed to protect agriculture, the area is now
converted to habitat
E
Brayton
197-
198R
600
CDPR, Bidwell-Sac
River St Park, Brayton property
Large rubble,
privately installed
Rock was installed to protect agriculture, the area is
planned to be converted to habitat, consider effect on the road to the east but geologic control should limit
meander
F
Phelan island
191-
192R
1410
USFWS, Phelan Island Unit and Sac & San
Joaquin Drainage Dist.
Medium rock,
USACE
installed in
1988
Area has been converted to habitat, consider possible
Murphy's Slough cutoff / flood relief structure concerns
G
English
186R
2500
Private
Large
rubble, privately installed
Walnut orchard
H
Dead
Man's
Reach
186.5
L
1800
USFWS
Large rubble,
privately installed
Currently undergoing restoration
I
Llano Seco
Riparian
Sanctuar
y
179R
1300
USFWS, Phelan Island Unit and Sac & San Joaquin Drainage
District and small area
of private property
Medium
rock, USACE
installed in 1985 & 87
Rock removal potential identified as part of Lano Seco
Riparian Sanctuary planning project as part of a solution
to fish screen concerns at Princeton, Codora/ Provident
pumping plant at RM 178R
J
M&T Ranch
191.5
L
2000
M&T - Golden State
Island
Medium
Rock
COE Butte Basin Overflow, Existing savannah habitat
K
TNC
197.5
R
3000
TNC/ J-levee
Medium
Rock
Walnut orchard - COE rock - J-levee Project
Modeling Revetment Removal: Technical Report
9
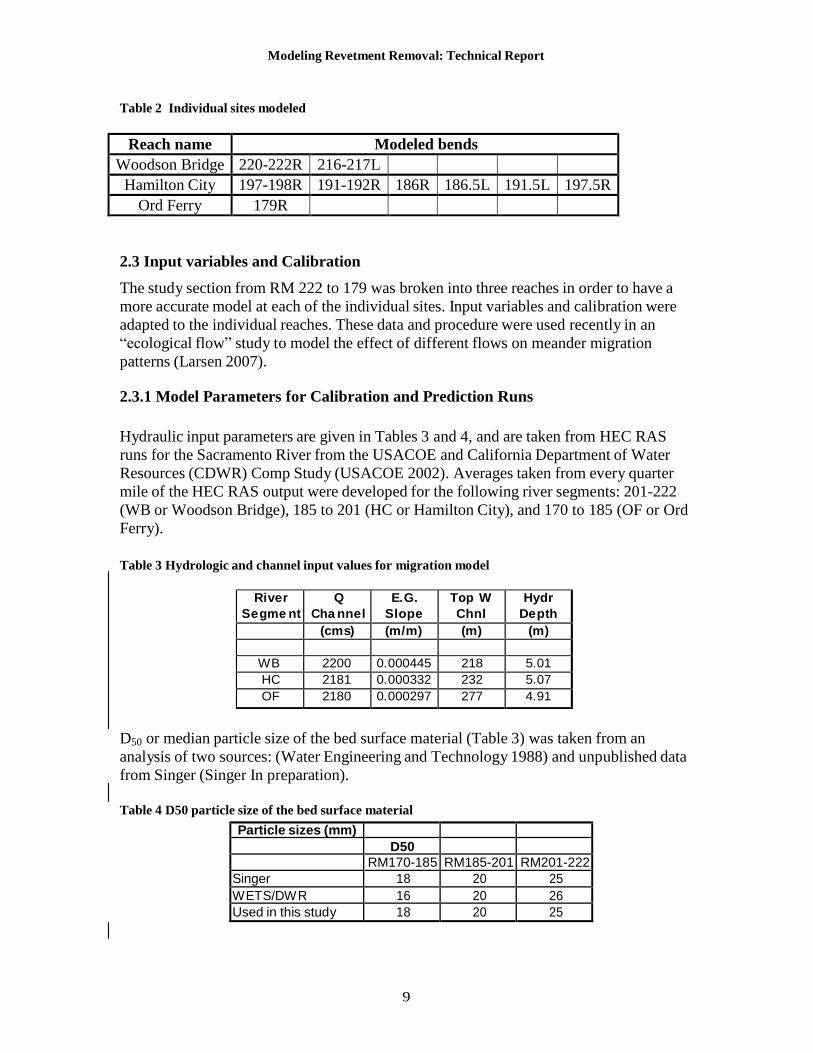
Table 2 Individual sites modeled
Reach name Modeled bends
Woodson Bridge 220-222R 216-217L
Hamilton City 197-198R 191-192R 186R 186.5L 191.5L 197.5R
Ord Ferry 179R
2.3 Input variables and Calibration
The study section from RM 222 to 179 was broken into three reaches in order to have a
more accurate model at each of the individual sites. Input variables and calibration were
adapted to the individual reaches. These data and procedure were used recently in an
“ecological flow” study to model the effect of different flows on meander migration
patterns (Larsen 2007).
2.3.1 Model Parameters for Calibration and Prediction Runs
Hydraulic input parameters are given in Tables 3 and 4, and are taken from HEC RAS
runs for the Sacramento River from the USACOE and California Department of Water
Resources (CDWR) Comp Study (USACOE 2002). Averages taken from every quarter
mile of the HEC RAS output were developed for the following river segments: 201-222
(WB or Woodson Bridge), 185 to 201 (HC or Hamilton City), and 170 to 185 (OF or Ord
Ferry).
Table 3 Hydrologic and channel input values for migration model
River
Se gme nt Q
Cha nne l E.G.
Slope Top W
Chnl Hydr
De pth
(cms) (m/m) (m) (m)
WB 2200 0.000445 218 5.01 HC 2181 0.000332 232 5.07 OF 2180 0.000297 277 4.91
D50 or median particle size of the bed surface material (Table 3) was taken from an
analysis of two sources: (Water Engineering and Technology 1988) and unpublished data
from Singer (Singer In preparation).
Table 4 D50 particle size of the bed surface material
Particle sizes (mm) D50 RM170-185 RM185-201 RM201-222 Singer 18 20 25 W ETS/DWR 16 20 26 Used in this study 18 20 25
Modeling Revetment Removal: Technical Report
10
The output of the migration model depends on local hydraulic conditions through the
hydraulic and geomorphic input variables, as well as the empirically-determined erosion
coefficient. In addition, the model uses calibrated values to conceptually simulate cutoff
processes (Avery et al. 2003). To calibrate the model, the channel planform centerlines
from 1952 and 1976 were used, 2 years for which centerlines could be accurately
delineated from digitized aerial photos, and a time period during which the existing bank
restraints were relatively easy to identify. The calibration process consists of adjusting the
erosion, hydraulic, and cutoff parameters in the meander migration model until the
simulated migration from 1952 to 1976 closely matches the observed migration during
the same time period. The erosion potential field is thus established by calibrating the
migration between the two time periods. The regions outside the calibration are assigned
erosion potentials based on the land-cover type from the GIS coverage. For example, if a
riparian area in the calibrated area had a calibrated value of 250, the riparian areas in the
GIS coverage were also assigned this value. In addition, the values for different land
cover types established in the calibration were subsequently used for predictions.
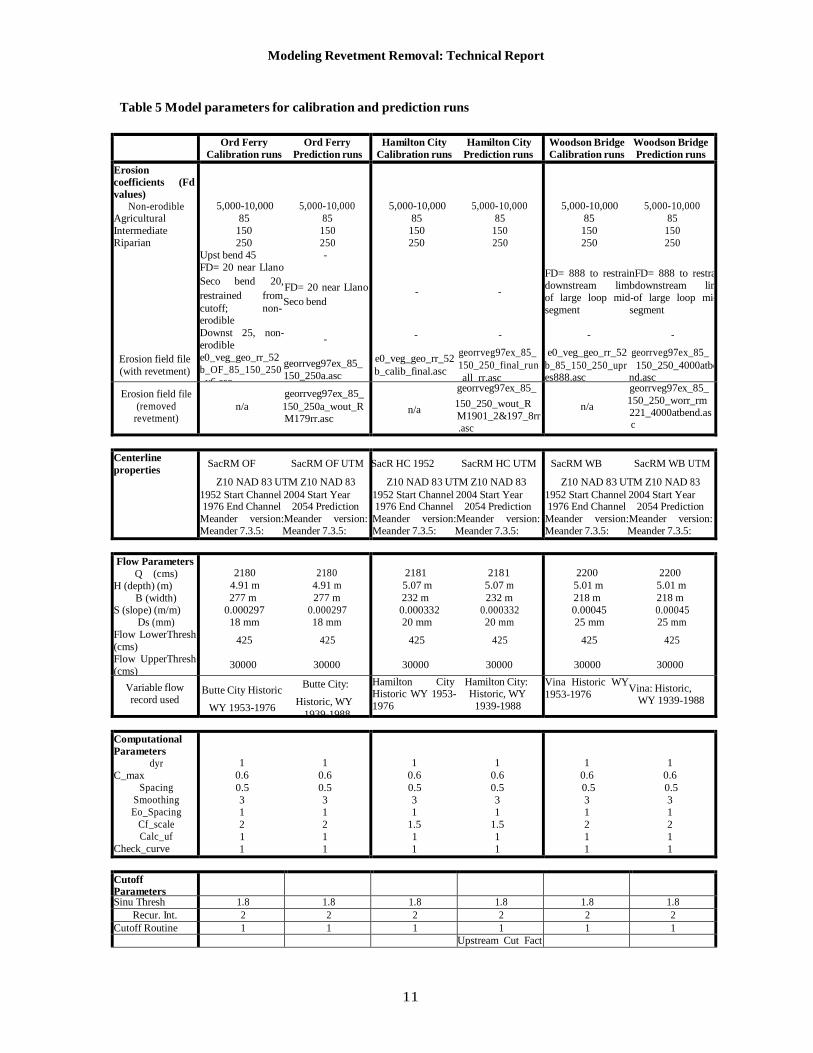
Some of the model parameters are internal to the model and are recorded as metadata.
“Erosion coefficients” are used to establish the erodibility of the erosion surface and are
described in other sources (e.g. Larsen and Greco 2002). “Centerline properties” record
the projections for geographic data (UTM zone 10 NAD 83), the starting and ending
channels for the modeled migration, and model version that was used.
“Flow parameters” are derived from acquired data. The discharge, width, depth, slope
and particle size were described above. The “Upper threshold” is a value set above which
flows may be neglected. It was not really used for this modeling, and was technically set
at a discharge that was above observed flows. Observed flows did not exceed roughly
9,000 cms. Setting the upper threshold at 30,000 establishes no upper threshold.
“Computational parameters”, “cutoff parameters” and “erosion algorithm parameters” are
parameters that are internal to the model, and are recorded as modeling metadata.
Modeling Revetment Removal: Technical Report
11
Table 5 Model parameters for calibration and prediction runs
Ord Ferry Ord Ferry Calibration runs Prediction runs
Hamilton City Hamilton City Calibration runs Prediction runs
Woodson Bridge Woodson Bridge Calibration runs Prediction runs
Erosion coefficients (Fd
values) Non-erodible
Agricultural
Intermediate Riparian
Erosion field file
(with revetment)
5,000-10,000 5,000-10,000
85 85
150 150
250 250 Upst bend 45 -
FD= 20 near Llano
Seco bend 20, FD= 20 near Llano
restrained from Seco bend
cutoff; non- erodible
Downst 25, non-
erodible -
e0_veg_geo_rr_52 georrveg97ex_85_
b_OF_85_150_250 150_250a.asc
_v6.asc
5,000-10,000 5,000-10,000
85 85
150 150
250 250
- -
- -
e0_veg_geo_rr_52 georrveg97ex_85_
b_calib_final.asc 150_250_final_run _all_rr.asc
5,000-10,000 5,000-10,000
85 85
150 150
250 250
FD= 888 to restrainFD= 888 to restrai downstream limbdownstream lim
of large loop mid-of large loop mid
segment segment
- -
e0_veg_geo_rr_52 georrveg97ex_85_
b_85_150_250_upr 150_250_4000atbe es888.asc nd.asc
Erosion field file
(removed revetment)
georrveg97ex_85_
n/a 150_250a_wout_R M179rr.asc
georrveg97ex_85_
n/a 150_250_wout_R
M1901_2&197_8rr .asc
georrveg97ex_85_
n/a 150_250_worr_rm 221_4000atbend.as c
Centerline
properties SacRM OF SacRM OF UTM
Z10 NAD 83 UTM Z10 NAD 83
1952 Start Channel 2004 Start Year 1976 End Channel 2054 Prediction
Meander version:Meander version: Meander 7.3.5: Meander 7.3.5:
SacR HC 1952 SacRM HC UTM
Z10 NAD 83 UTM Z10 NAD 83
1952 Start Channel 2004 Start Year 1976 End Channel 2054 Prediction
Meander version:Meander version: Meander 7.3.5: Meander 7.3.5:
SacRM WB SacRM WB UTM
Z10 NAD 83 UTM Z10 NAD 83
1952 Start Channel 2004 Start Year 1976 End Channel 2054 Prediction
Meander version:Meander version: Meander 7.3.5: Meander 7.3.5:
Flow Parameters
Q (cms) H (depth) (m)
B (width) S (slope) (m/m)
Ds (mm)
Flow LowerThresh
(cms) Flow UpperThresh
(cms)
2180 2180
4.91 m 4.91 m
277 m 277 m
0.000297 0.000297 18 mm 18 mm
425 425
30000 30000
2181 2181
5.07 m 5.07 m
232 m 232 m
0.000332 0.000332 20 mm 20 mm
425 425
30000 30000
2200 2200
5.01 m 5.01 m
218 m 218 m
0.00045 0.00045 25 mm 25 mm
425 425
30000 30000
Variable flow record used
Butte City Historic Butte City:
WY 1953-1976 Historic, WY
1939-1988
Hamilton City Hamilton City: Historic WY 1953- Historic, WY 1976 1939-1988
Vina Historic WY
1953-1976 Vina: Historic,
WY 1939-1988
Computational Parameters
dyr C_max
Spacing
Smoothing Eo_Spacing
Cf_scale Calc_uf
Check_curve
1 1
0.6 0.6
0.5 0.5
3 3 1 1
2 2
1 1
1 1
1 1
0.6 0.6
0.5 0.5
3 3 1 1
1.5 1.5
1 1
1 1
1 1
0.6 0.6
0.5 0.5
3 3 1 1
2 2
1 1
1 1
Cutoff Parameters Sinu Thresh 1.8 1.8 1.8 1.8 1.8 1.8
Recur. Int. 2 2 2 2 2 2 Cutoff Routine 1 1 1 1 1 1 Upstream Cut Fact
Modeling Revetment Removal: Technical Report
12
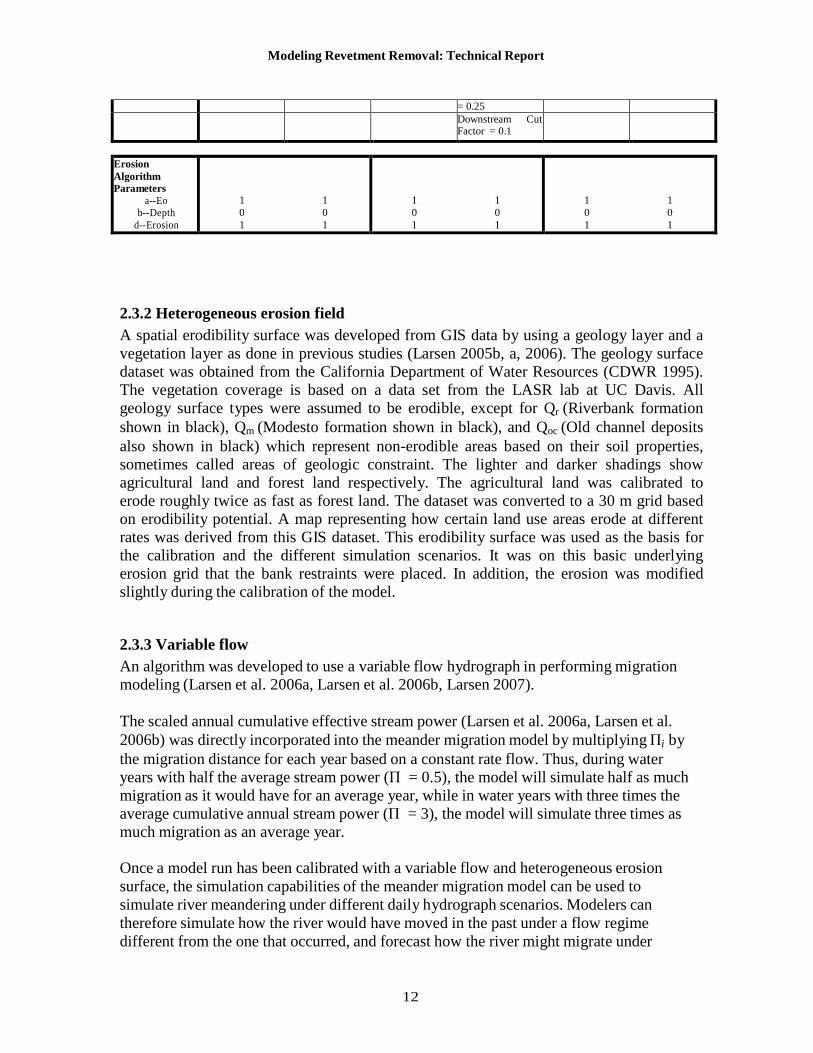
= 0.25 Downstream Cut
Factor = 0.1
Erosion
Algorithm Parameters
a--Eo b--Depth
d--Erosion
1 1
0 0
1 1
1 1
0 0
1 1
1 1
0 0
1 1
2.3.2 Heterogeneous erosion field
A spatial erodibility surface was developed from GIS data by using a geology layer and a
vegetation layer as done in previous studies (Larsen 2005b, a, 2006). The geology surface
dataset was obtained from the California Department of Water Resources (CDWR 1995).
The vegetation coverage is based on a data set from the LASR lab at UC Davis. All
geology surface types were assumed to be erodible, except for Qr (Riverbank formation
shown in black), Qm (Modesto formation shown in black), and Qoc (Old channel deposits
also shown in black) which represent non-erodible areas based on their soil properties,
sometimes called areas of geologic constraint. The lighter and darker shadings show
agricultural land and forest land respectively. The agricultural land was calibrated to
erode roughly twice as fast as forest land. The dataset was converted to a 30 m grid based
on erodibility potential. A map representing how certain land use areas erode at different
rates was derived from this GIS dataset. This erodibility surface was used as the basis for
the calibration and the different simulation scenarios. It was on this basic underlying
erosion grid that the bank restraints were placed. In addition, the erosion was modified
slightly during the calibration of the model.
2.3.3 Variable flow
An algorithm was developed to use a variable flow hydrograph in performing migration
modeling (Larsen et al. 2006a, Larsen et al. 2006b, Larsen 2007).
The scaled annual cumulative effective stream power (Larsen et al. 2006a, Larsen et al.
2006b) was directly incorporated into the meander migration model by multiplying Πi by
the migration distance for each year based on a constant rate flow. Thus, during water
years with half the average stream power (Π = 0.5), the model will simulate half as much
migration as it would have for an average year, while in water years with three times the
average cumulative annual stream power (Π = 3), the model will simulate three times as
much migration as an average year.
Once a model run has been calibrated with a variable flow and heterogeneous erosion
surface, the simulation capabilities of the meander migration model can be used to
simulate river meandering under different daily hydrograph scenarios. Modelers can
therefore simulate how the river would have moved in the past under a flow regime
different from the one that occurred, and forecast how the river might migrate under
Modeling Revetment Removal: Technical Report
13
different potential future management scenarios. It can also be used when modeling
cutoffs to identify years when, due to high flows, the channel would be expected to
cutoff.
2.3.3.1 Daily flow data Daily discharge data are required for calibration and simulation with the variable flow
Meander Migration model. Calibration data can use mean daily flow rates obtained from
gauging station records. As an example, when working with simulations at a bend near
Pine Creek (RM 196-199) (Fremier 2003, Larsen et al. 2006a) the observed hydrograph
for the years 1956 to 1975 was obtained from the California Department of Water
Resources Bend Bridge flow gauge (number 11377100, (US Geological Survey 2004).
The modeled migration was performed from simulated water year (WY) 2005 to 2054.
These simulated future flows were taken from recorded historical flows for WY 1939 to
WY 1988 from three different gauges on the Sacramento River.
Table 6 Calibration data from historical daily average flow records
USGS Discharge Gauge Meander Migration Model Segment
Name RM Name RM RM
SACRAMENTO R. AT VINA BRIDGE NR VINA
CA. 218 Vina/Woodson Bridge 218 201
SACRAMENTO R. NR HAMILTON CITY CA. 199 Hamilton City 185 201
SACRAMENTO R. AT BUTTE CITY CA. 168 Butte City 170 185
Once the calibration was completed, these historical daily flows were then run for the full
50 year period of record for two scenarios of channel confinement: (a) current conditions
and (b) revetment removal.
2.3.4 Cutoff simulation
A cutoff simulation was used to account for bend cutoffs due to high flows during large
storms. Bends were delineated by first calculating the local curvature along the centerline
at points spaced approximately a half-channel width apart, using an algorithm to calculate
local curvature (Johannesson and Parker 1985). A change in the sign of the curvature is
an inflection point and can indicate a new bend. To account for small changes in the
direction of curvature for a compound bend, the moving average of curvature for each
point was calculated as the mean of the five adjacent upstream and downstream points.
Starting from upstream, points were designated as part of a single bend until five
consecutive points occur with the moving average of curvature in the opposite direction.
These five points are considered the beginning of the next bend. All subsequent points
are designated as part of this bend until five points in a row with a curvature in the
opposite direction occur. These, in turn, constitute the beginning of the next bend. This
procedure was repeated until all bends were identified and assigned a number. Bends
Modeling Revetment Removal: Technical Report
14
were re-delineated each year after the channel centerline was moved by the meander
migration model.
To model cutoffs, discrete single bends were analyzed for sinuosity to determine their
cutoff potentials. The sinuosity of each bend was calculated by dividing the distance along
the channel for a bend by the straight-line distance between the start and end points
of the bend. A sinuosity of 1.8 was considered the threshold at which bends were allowed
to cut off. This is a value that was established through calibration and from considering
previous studies (Avery et al. 2003). The starting point of the cutoff was located at a
calibrated distance (typically one-quarter of the bend upstream from the cutoff bend) and
the ending point was established from calibration (e.g.: 10% along the length of the
downstream bend.) Finally, the cutoff was simulated only if the straight line between the
start and end points did not include revetment, levees, or geologic constraints to erosion. If
the cutoff conditions were met, the river channel centerline points of the cutoff bend were
simulated in a straight line between the start and end points. This procedure was
successfully used in assessing channel restraint set-back on the Sacramento River (Larsen
et al. 2006c).
Modeling Revetment Removal: Technical Report
15
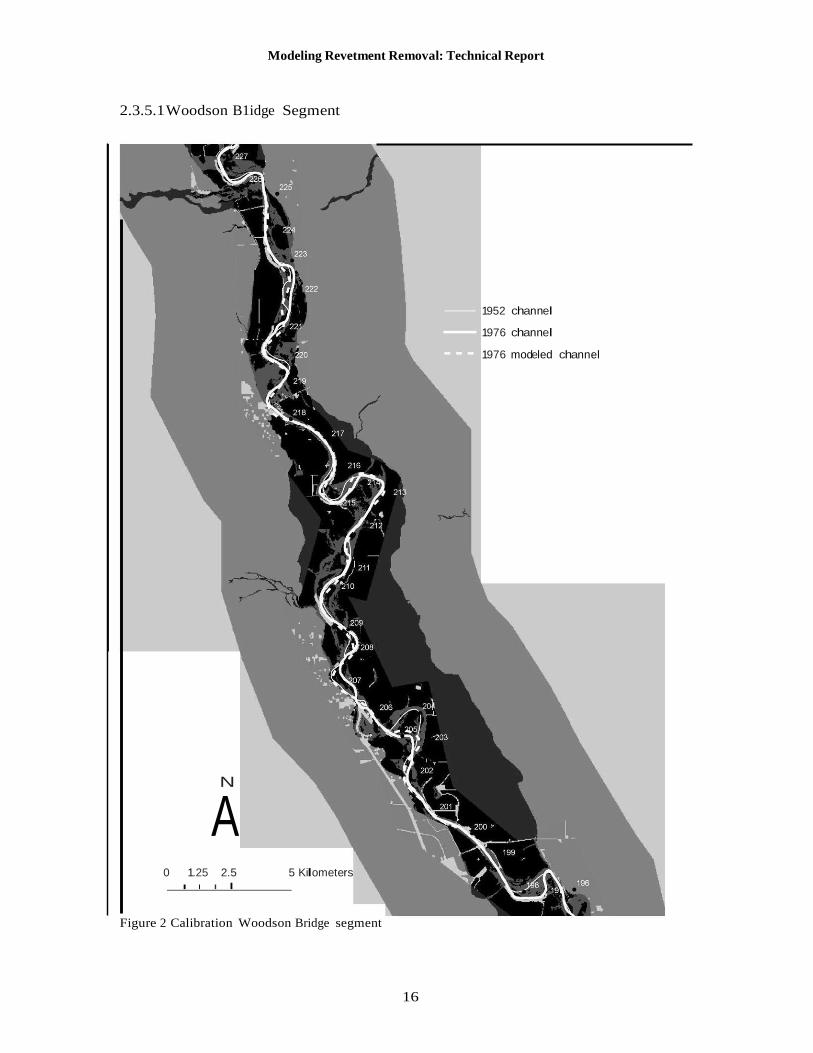
2.3.5 Calibrations: Centerline Agreement
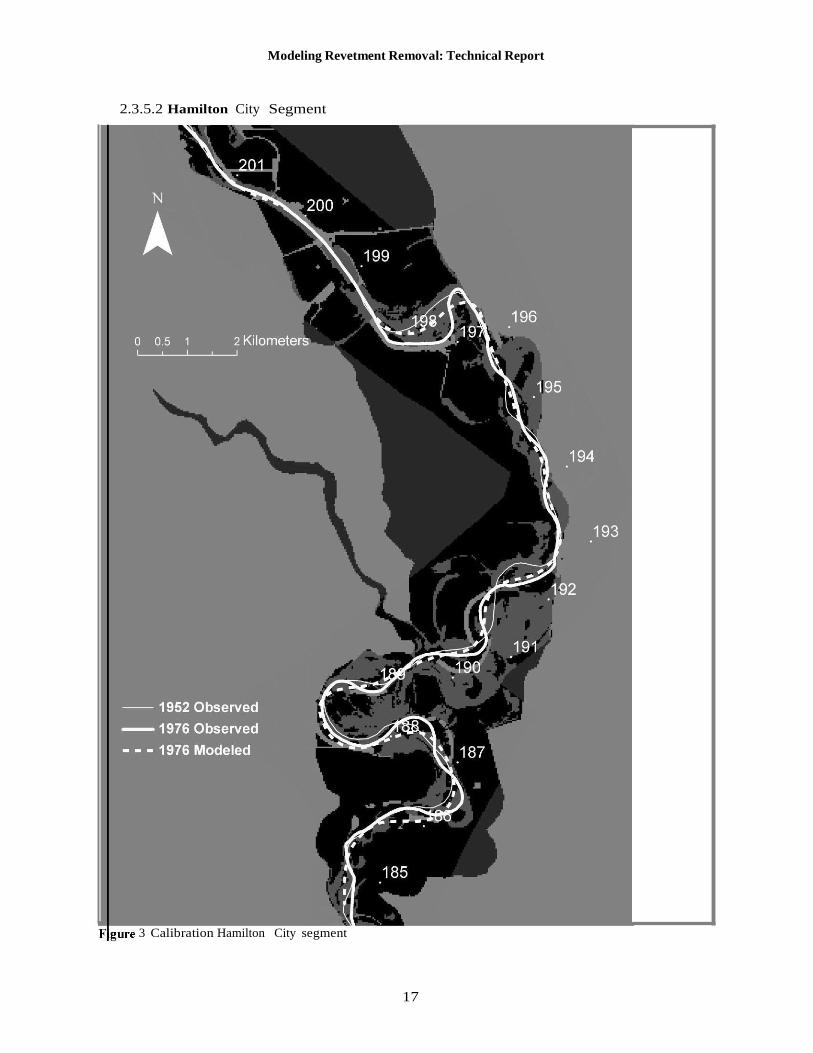
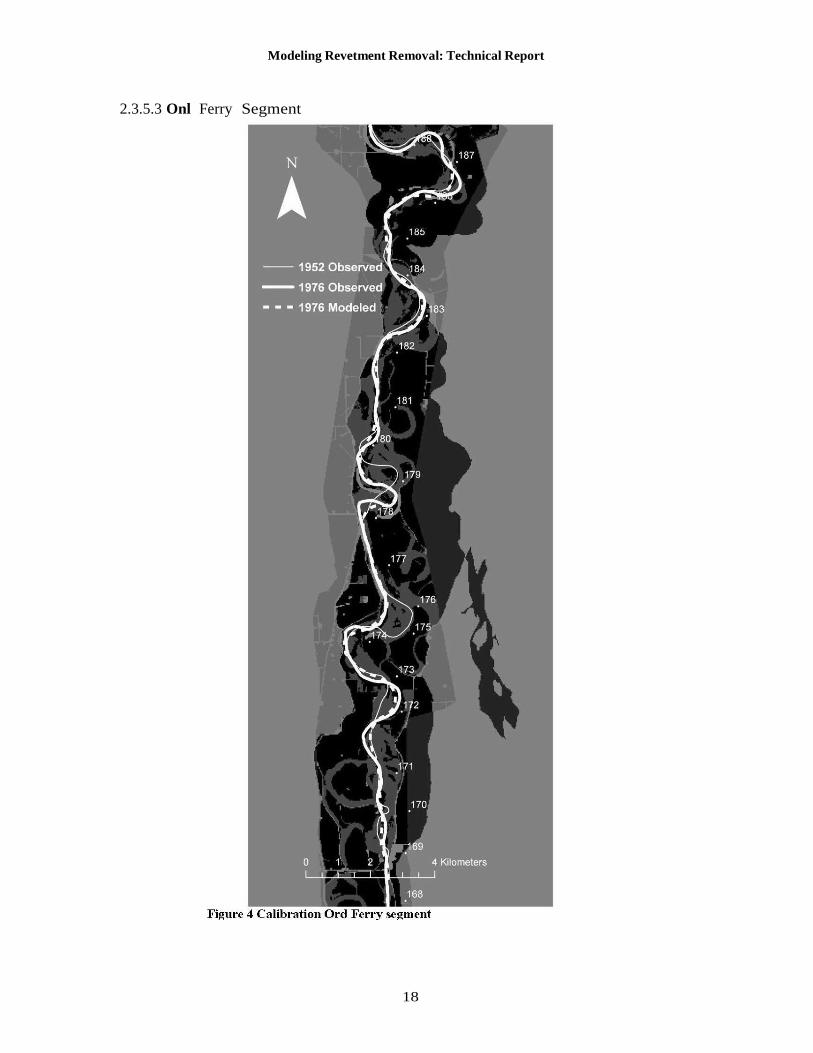
Calibration in the three segments (Figures 2, 3 and 4) was performed starting with the
observed 1952 and 1976 channel centerlines. The light solid line is the 1952 observed
channel centerline; the bold solid line is the 1976 observed channel centerline; the dashed
line is the 1976 modeled channel centerline. The agreement between the observed and
simulated 1976 channel was visually assessed as adequate. Although statistical methods
could be used to assess calibration agreement with observed migration, those methods
can “force” agreement in areas where migration patterns are not controlled by channel
planform and internal hydraulics, but by other factors such as anthropogenic changes.
Using a visual assessment has proven to be an effective means of calibration (Larsen and
Greco 2002).
The calibrations adequately model cutoffs that occurred in various river segments
Modeling Revetment Removal: Technical Report
16
2.3.5.1 Woodson B1idge Segment
1952 channel
1976 channel
1976 modeled channel
N
A
0 1.25 2.5 5 Kilometers I I I I
Figure 2 Calibration Woodson Bridge segment
Modeling Revetment Removal: Technical Report
17
2.3.5.2 Hamilton City Segment
3 Calibration Hamilton City segment
Modeling Revetment Removal: Technical Report
18
2.3.5.3 Onl Ferry Segment
19
Channel Migration Modeling Technical Report
.
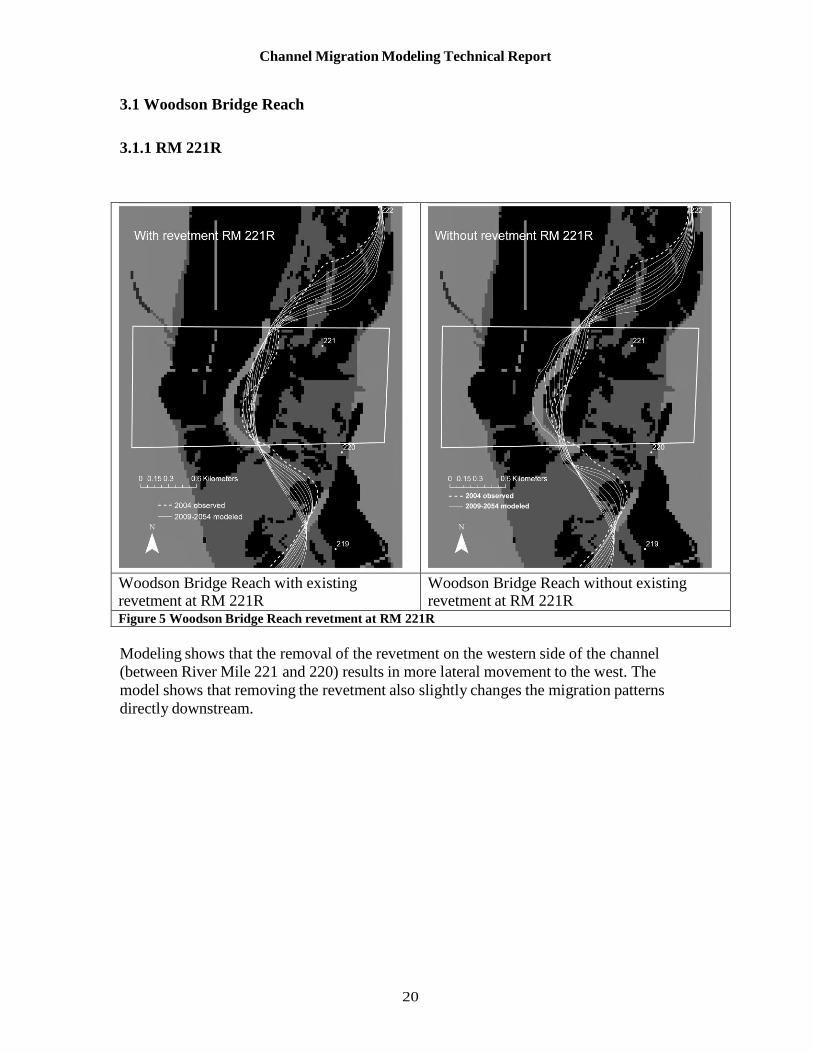
3.0 RESULTS Figures for each of the nine modeled bends are shown as pairs: the left hand side shows the modeled migration patterns from a 2004 channel centerline to a 2054 centerline with
the existing revetment in place. The right hand figure shows the same modeled migration
for the same time period, with the revetment removed. The 2004 channel centerline is
shown as a bold dashed line. The remaining white lines show the channel migration in 5-
year increments.
Following each figure is a brief description of the modeling results illustrated in the
figures.
20
Channel Migration Modeling Technical Report
3.1 Woodson Bridge Reach
3.1.1 RM 221R
Woodson Bridge Reach with existing revetment at RM 221R
Woodson Bridge Reach without existing revetment at RM 221R
Figure 5 Woodson Bridge Reach revetment at RM 221R
Modeling shows that the removal of the revetment on the western side of the channel
(between River Mile 221 and 220) results in more lateral movement to the west. The
model shows that removing the revetment also slightly changes the migration patterns
directly downstream.
21
Channel Migration Modeling Technical Report
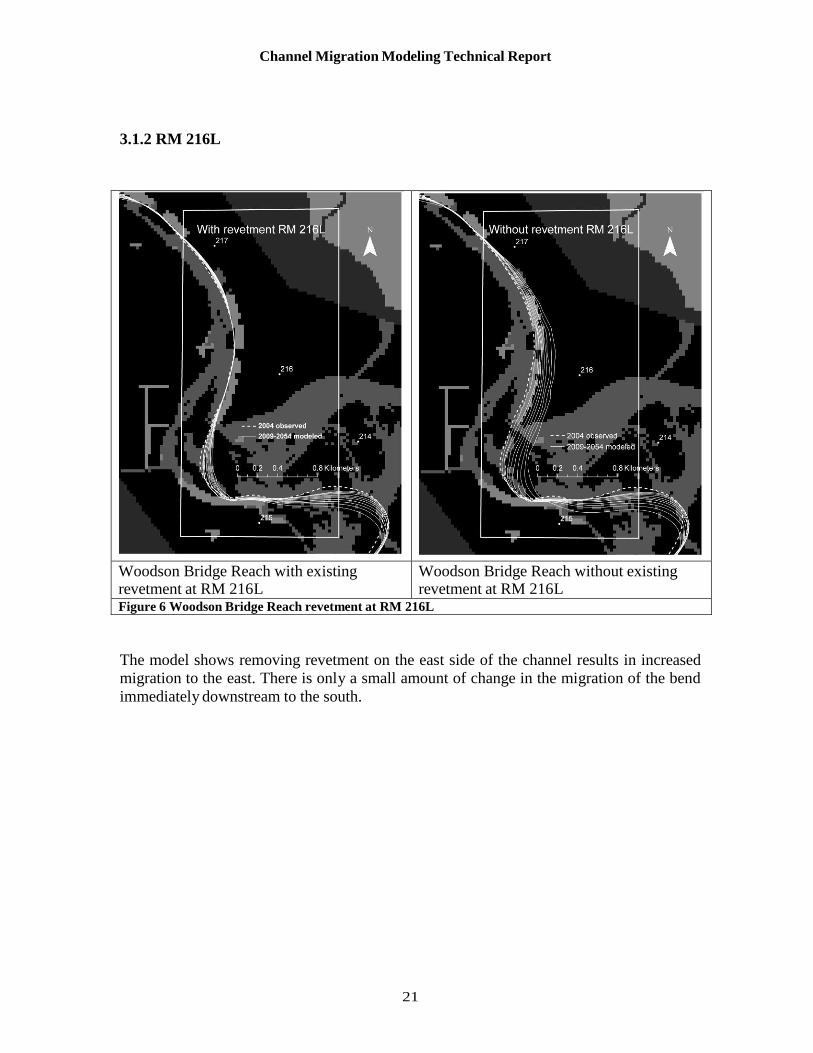
3.1.2 RM 216L
Woodson Bridge Reach with existing revetment at RM 216L
Woodson Bridge Reach without existing revetment at RM 216L
Figure 6 Woodson Bridge Reach revetment at RM 216L
The model shows removing revetment on the east side of the channel results in increased
migration to the east. There is only a small amount of change in the migration of the bend
immediately downstream to the south.
22
Channel Migration Modeling Technical Report
3.2 Hamilton City Reach
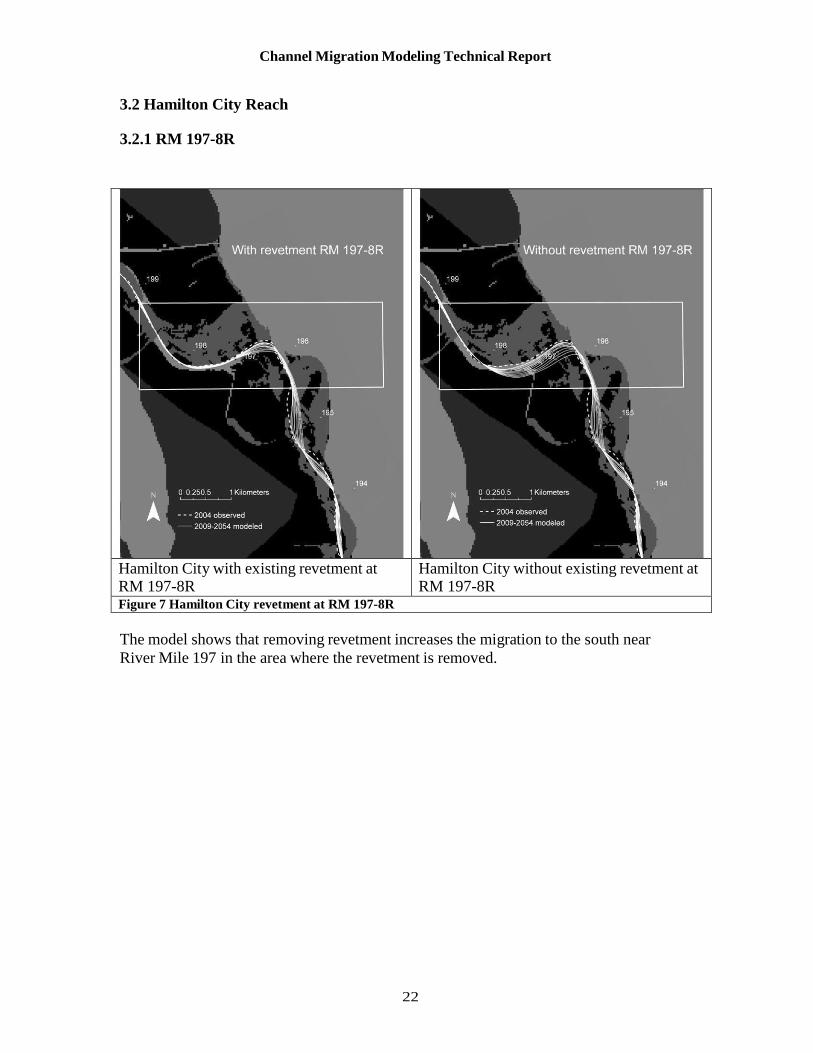
3.2.1 RM 197-8R
Hamilton City with existing revetment at RM 197-8R
Hamilton City without existing revetment at RM 197-8R
Figure 7 Hamilton City revetment at RM 197-8R
The model shows that removing revetment increases the migration to the south near
River Mile 197 in the area where the revetment is removed.
23
Channel Migration Modeling Technical Report
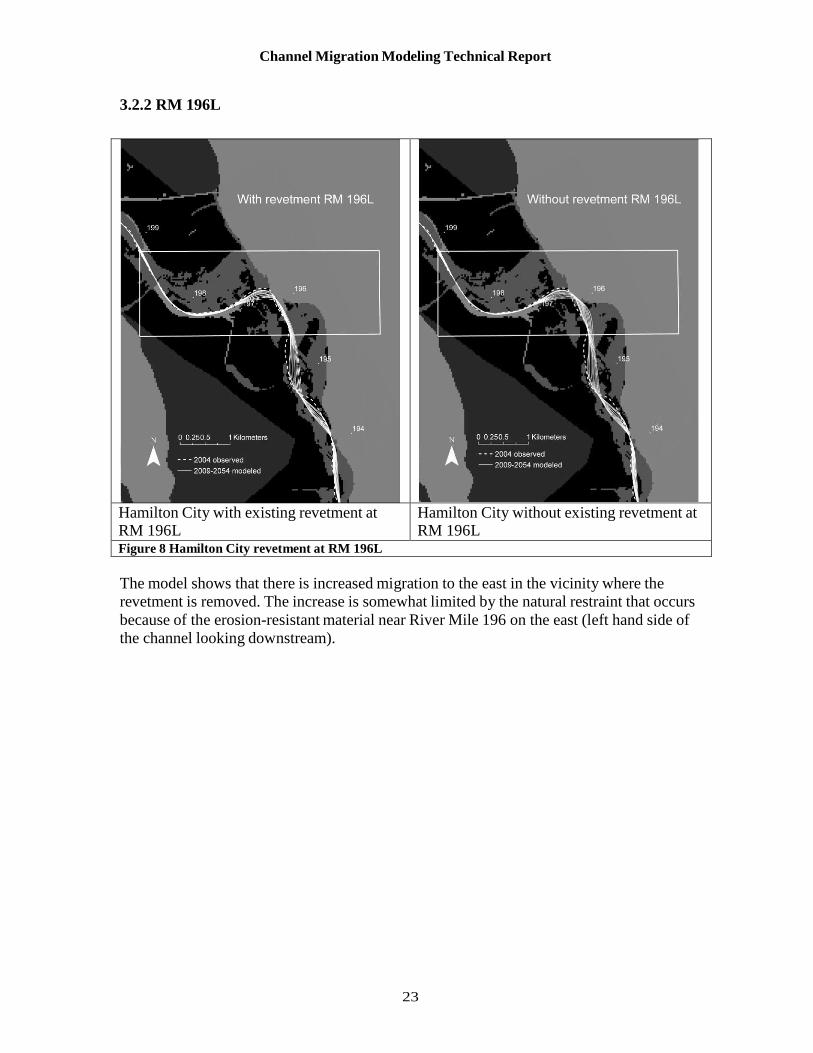
3.2.2 RM 196L
Hamilton City with existing revetment at RM 196L
Hamilton City without existing revetment at RM 196L
Figure 8 Hamilton City revetment at RM 196L
The model shows that there is increased migration to the east in the vicinity where the
revetment is removed. The increase is somewhat limited by the natural restraint that occurs
because of the erosion-resistant material near River Mile 196 on the east (left hand side of
the channel looking downstream).
24
Channel Migration Modeling Technical Report
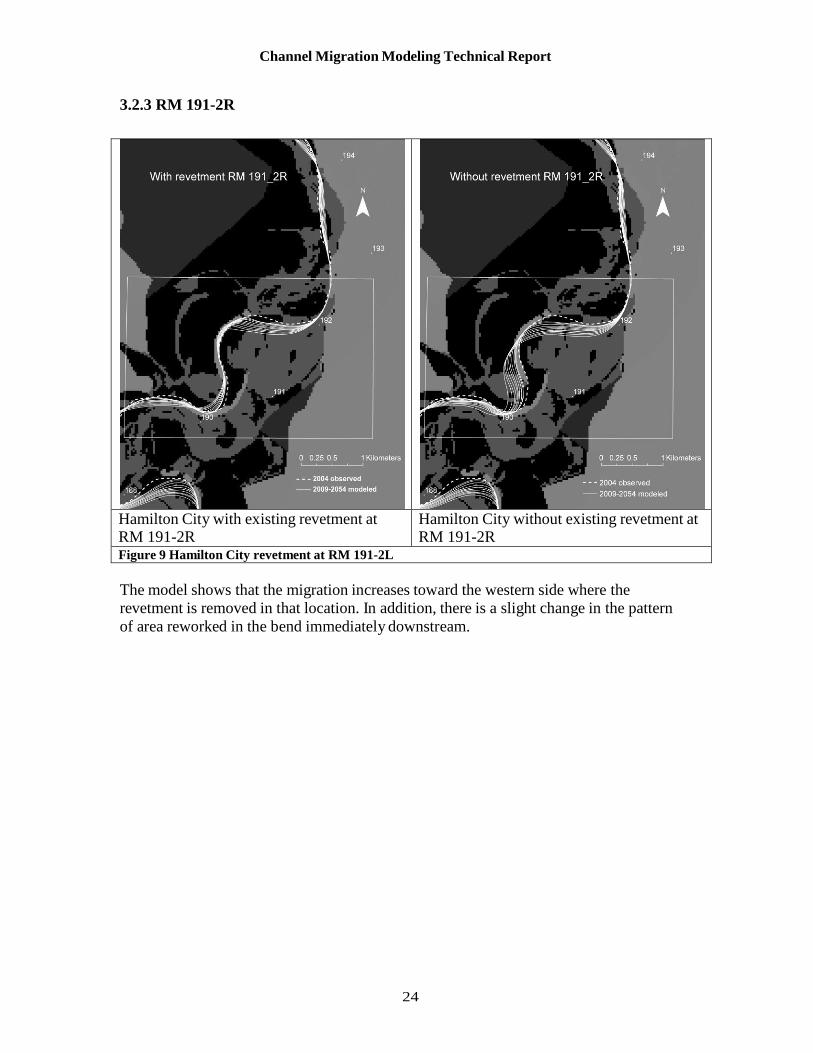
3.2.3 RM 191-2R
Hamilton City with existing revetment at RM 191-2R
Hamilton City without existing revetment at RM 191-2R
Figure 9 Hamilton City revetment at RM 191-2L
The model shows that the migration increases toward the western side where the
revetment is removed in that location. In addition, there is a slight change in the pattern
of area reworked in the bend immediately downstream.
25
Channel Migration Modeling Technical Report
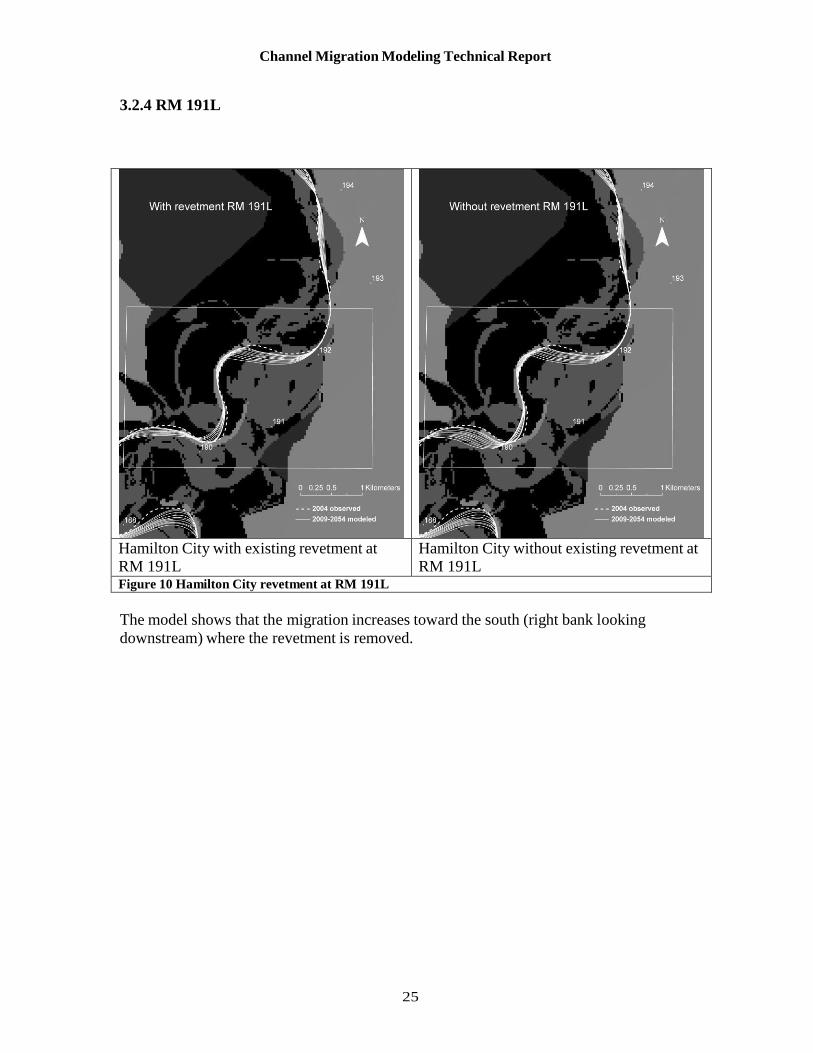
3.2.4 RM 191L
Hamilton City with existing revetment at RM 191L
Hamilton City without existing revetment at RM 191L
Figure 10 Hamilton City revetment at RM 191L
The model shows that the migration increases toward the south (right bank looking
downstream) where the revetment is removed.
26
Channel Migration Modeling Technical Report
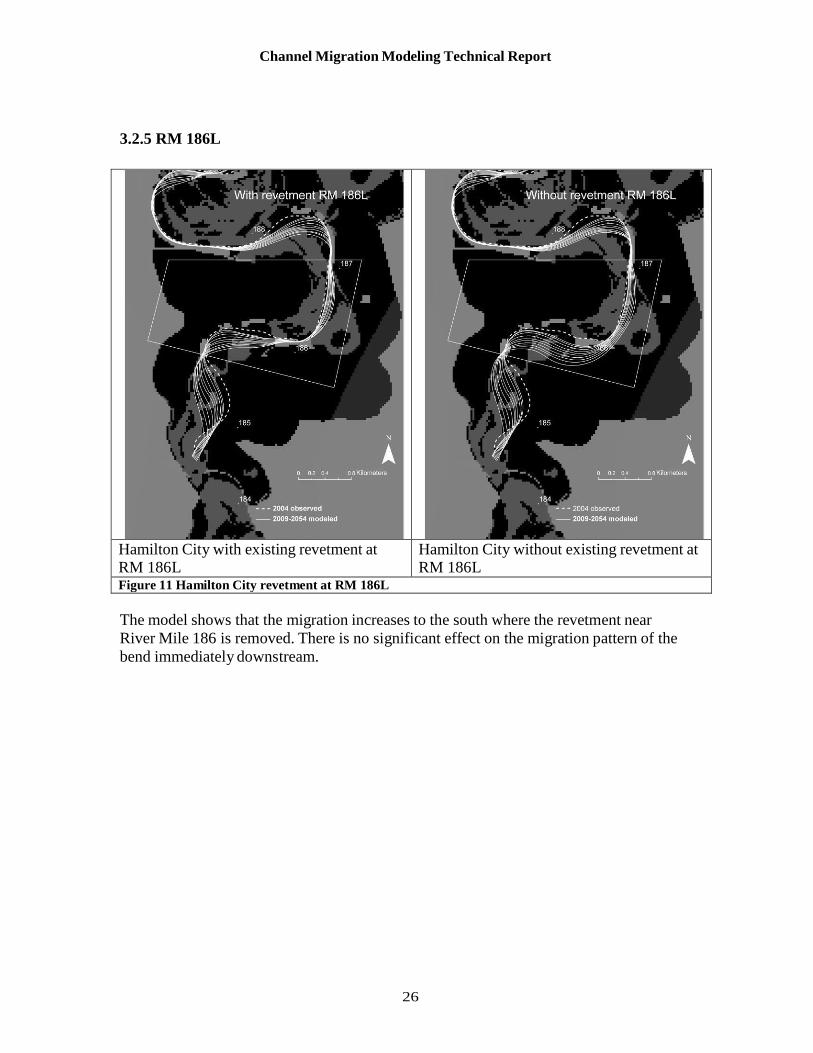
3.2.5 RM 186L
Hamilton City with existing revetment at RM 186L
Hamilton City without existing revetment at RM 186L
Figure 11 Hamilton City revetment at RM 186L
The model shows that the migration increases to the south where the revetment near
River Mile 186 is removed. There is no significant effect on the migration pattern of the
bend immediately downstream.
27
Channel Migration Modeling Technical Report
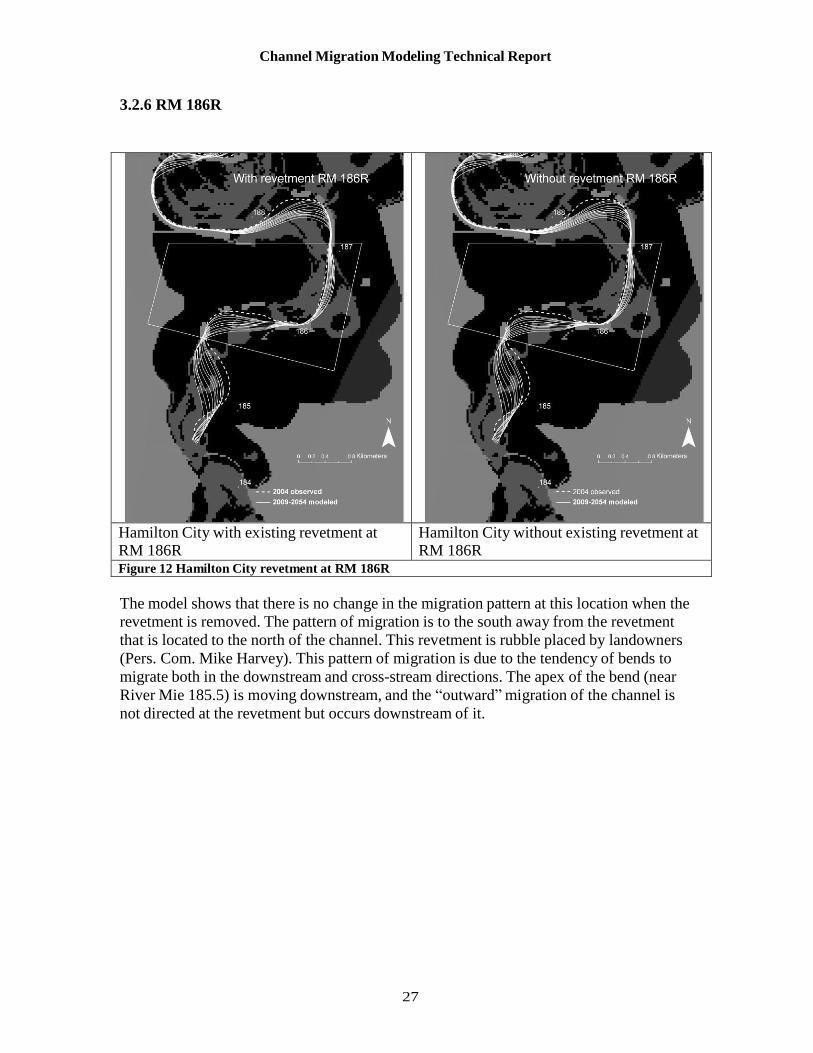
3.2.6 RM 186R
Hamilton City with existing revetment at RM 186R
Hamilton City without existing revetment at RM 186R
Figure 12 Hamilton City revetment at RM 186R
The model shows that there is no change in the migration pattern at this location when the
revetment is removed. The pattern of migration is to the south away from the revetment
that is located to the north of the channel. This revetment is rubble placed by landowners
(Pers. Com. Mike Harvey). This pattern of migration is due to the tendency of bends to
migrate both in the downstream and cross-stream directions. The apex of the bend (near
River Mie 185.5) is moving downstream, and the “outward” migration of the channel is
not directed at the revetment but occurs downstream of it.
28
Channel Migration Modeling Technical Report
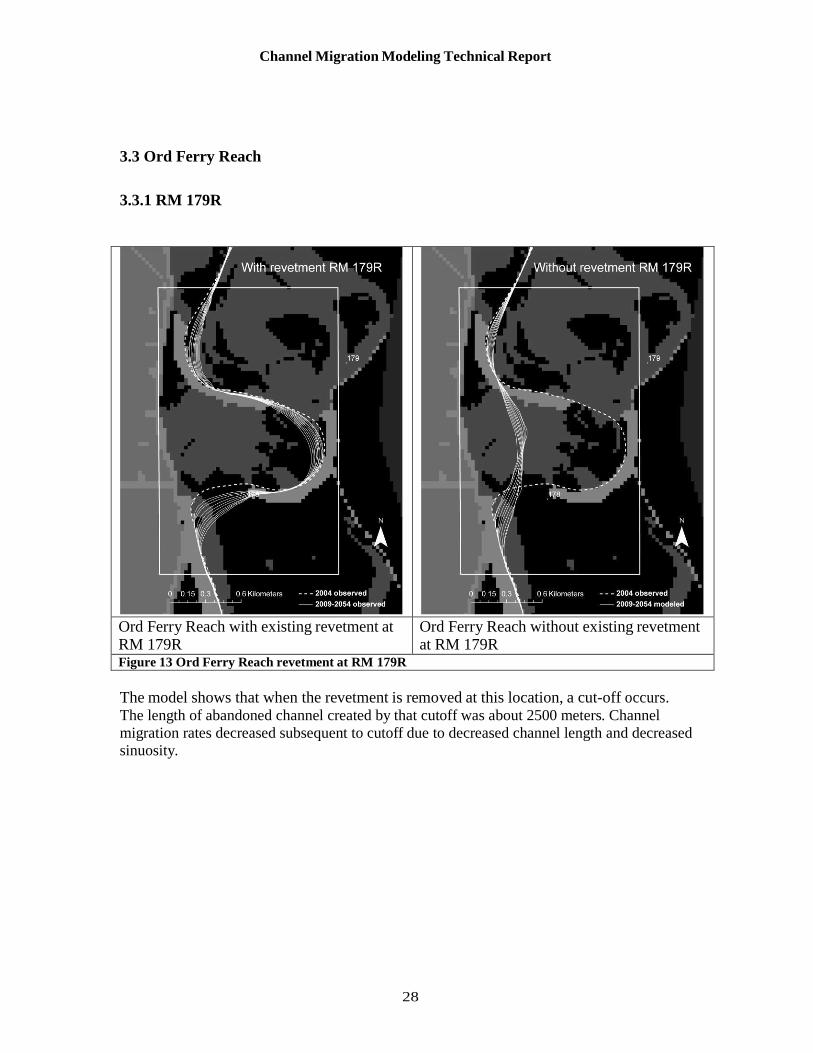
3.3 Ord Ferry Reach
3.3.1 RM 179R
Ord Ferry Reach with existing revetment at RM 179R
Ord Ferry Reach without existing revetment at RM 179R
Figure 13 Ord Ferry Reach revetment at RM 179R
The model shows that when the revetment is removed at this location, a cut-off occurs. The length of abandoned channel created by that cutoff was about 2500 meters. Channel
migration rates decreased subsequent to cutoff due to decreased channel length and decreased
sinuosity.
29
Channel Migration Modeling Technical Report
4.0 DISCUSSION The river meander migration modeling in this report shows the tendencies of migration patterns of selected bends with and without revetment in place. The migration
simulations in this report assume that the flows will be similar to the flows that were
observed between WY 1939 and WY 1988, which were used to simulate variable flow
conditions.
Migration modeling at all of the selected bends was performed with appropriate site-
specific conditions, and was done at all sites with similar hydrologic conditions, over the
same time period, using related simulated flows, and using related erosion fields. This
procedure was used so that the sites could be compared with each other. Therefore, these
simulations can be used for comparing the relative impact of removing revetment at
different sites.
In the Woodson Bridge Reach, there is increased area reworked of the bends for both
bends 221R and 216R when the revetment is removed. For bend 221R, the model shows
that removing the revetment also changes the migration patterns directly downstream and
decreases the total area reworked (in the downstream bend) when the upstream revetment
is removed. For bend 216R, removing revetment increases the local area reworked as
well as increases the area reworked for the bend immediately downstream.
In the Hamilton City Reach, six bends were modeled. At RM 197-8R the model shows
that removing revetment increases the migration to the south near River Mile 197 in the
area where the revetment is removed. At RM 196L the model shows that the increase in
migration when the revetment is removed is limited by the natural restraint that occurs
because of the erosion-resistant material near River Mile 196. The total change in area
reworked is comparatively small. At RM 191-2R the model shows that the migration
increases toward the western side when the revetment is removed in that location. In
addition, there is a slight change in the pattern of area reworked in the bend immediately
downstream. At RM 191L the model shows that the migration increases toward the south
(right bank looking downstream) where the revetment is removed. At RM 186L the model
shows that there is increased migration to the south when the revetment is
removed and no effect on the bend immediately downstream. At RM 186R the model
shows that there is no change in the migration pattern at this location when the revetment
is removed. The pattern of migration is to the south away from the revetment that is
located to the north of the channel.
In the Ord Ferry Reach, at RM 179R the model shows that when the revetment is
removed at this location, a cut-off occurs. The length of abandoned channel created by that
cutoff was about 2500 meters. Channel migration rates decreased subsequent to cutoff due to
decreased channel length and decreased sinuosity.
When the nine sites are compared with each other, two of the sites have limited increase
in migration when revetment is removed, and one site experiences cutoff. Migration of the
bend at RM 196L is limited by the natural restraint to the east. Migration of the bend at
RM 186R is modeled to move away from the revetment. The bend at RM 179R cuts
30
Channel Migration Modeling Technical Report
off when the revetment is removed. At the remaining six sites, revetment removal results
in significant increases in area reworked. At some sites, there is also some change in the
pattern and quantity of area reworked in the bend immediately downstream. These
findings, when considered together with other criterion, will help consider the benefits, in
terms of channel migration and area reworked, to be gained when revetment removal is
considered for mitigation or for other purposes, at the selected sites on the Sacramento
River.
5.0 REFERENCES
Avery, E. R., E. R. Micheli, and E. W. Larsen, 2003. River Channel Cut-Off Dynamics,
Sacramento River, California, USA. EOS Transactions, AGU 84 (46):Abstract
H52A-1181.
CDWR, 1995. Memorandum Report: Sacramento River Meander Belt Future Erosion
Investigation. DWR 155. The Resources Agency, Department of Water
Resources, Sacramento, CA.
Fremier, A. K., 2003. Floodplain Age Modeling Techniques to Analyze Channel
Migration and Vegetation Patch Dynamics on the Sacramento River, Ca. MA.
University of California, Davis, Davis.
Johannesson, H., and G. Parker. 1985. Computer Simulated Migration of Meandering
Rivers in Minnesota.
Larsen, E. W., 2005a. Future Meander Bend Migration and Floodplain Development
Patterns near River Miles 200 to 191 of the Sacramento River. 2005 Phase Iii
Report. Ducks Unlimited for CALFED Ecosystem Restoration Program,
Agreement #ERP-02-PO8-D, Amendment 2. Steering Committee Technical
Memorandum., Sacramento, California.
Larsen, E. W., 2005b. Meander Bend Migration and Floodplain Development Patterns
near River Miles 200 to 191 of the Sacramento River Phase Ii Report. Ducks
Unlimited for CALFED Ecosystem Restoration Program, Agreement #ERP-02-
PO8-D, Amendment 2. Steering Committee Technical Memorandum.,
Sacramento, Ca.
Larsen, E. W., 2006. Future Meander Bend Migration and Floodplain Development
Patterns near River Miles 200 to 191 of the Sacramento River. Phase 3 Report.
Ducks Unlimited.
Larsen, E. W., 2007. Sacramento River Ecological Flows Study: Meander Migration
Modeling. Report for the Nature Conservancy and Stillwater Sciences Ecological
Flows Study funded by California Bay-Delta Authority's Ecosystem Restoration
Program (CALFED grant ERP-02D0P61, Chico California.
Larsen, E. W., E. Anderson, E. Avery, and K. Dole, 2002. The Controls on and Evolution
of Channel Morphology of the Sacramento River: A Case Study of River Miles
201-185. Larsen, E. W., and Y. Cui, 2004. Meander Bend and Gravel Bar Migration near River
Mile 192.75 of the Sacramento River Phase I Report. Ducks Unlimited for
CALFED Ecosystem Restoration Program, Agreement #ERP-02-PO8-D,
Amendment 2. Steering Committee Technical Memorandum., Sacramento
California.
31
Channel Migration Modeling Technical Report
Larsen, E. W., A. K. Fremier, and E. H. Girvetz, 2006a. Modeling the Effects of Variable
Annual Flow on River Channel Meander Migration Patterns, Sacramento River,
Ca, USA. Journal of American Water Resources Association, 42(4):1063-1075.
Larsen, E. W., A. K. Fremier, and S. E. Greco, 2006b. Cumulative Effective Stream
Power and Bank Erosion on the Sacramento River, California, USA. Journal of
American Water Resources Association 42(4):1077-1097.
Larsen, E. W., E. H. Girvetz, and A. K. Fremier, 2006c. Assessing the Effects of
Alternative Setback Channel Constraint Scenarios Employing a River Meander
Migration Model. Environmental Management 37(6):880-897.
Larsen, E. W., and S. E. Greco, 2002. Modeling Channel Management Impacts on River
Migration: A Case Study of Woodson Bridge State Recreation Area, Sacramento
River, California, USA. Environmental Management 30:209-224.
Singer, M. B. In preparation. Downstream Patterns in Bed-Material Grain Size in a Large
Alluvial River.
US Geological Survey. 2004. Usgs Stream Flow Discharge.
http://water.usgs.gov/nwis/sw. US Geological Survey.
USACOE, 2002. Sacramento and San Joaquin River Basins Comprehensive Study.
Sacramento, California.
Water Engineering and Technology, I., 1988. Geomorphic Analysis of the Sacramento
River: Draft Report. DACWO5-87-C-0084, U.S. Army Corps of Engineers.