modeling socio-demography to capture tuberculosis transmission dynamics in a low burden setting
TRANSCRIPT

Journal of Theoretical Biology 289 (2011) 197–205
Contents lists available at SciVerse ScienceDirect
Journal of Theoretical Biology
0022-51
doi:10.1
n Corr
all’Econ
E-m
zhenhu
furlan@
journal homepage: www.elsevier.com/locate/yjtbi
Modeling socio-demography to capture tuberculosis transmissiondynamics in a low burden setting
Giorgio Guzzetta a,b,n, Marco Ajelli a, Zhenhua Yang c, Stefano Merler a,Cesare Furlanello a, Denise Kirschner d
a Fondazione Bruno Kessler, Trento, Italyb Dipartimento di Statistica e Matematica Applicata all’Economia, Universit �a di Pisa, via Ridolfi 10, 56124 Pisa, Italyc School of Public Health, University of Michigan, USAd Department of Microbiology and Immunology, University of Michigan Medical School, USA
a r t i c l e i n f o
Article history:
Received 3 March 2011
Received in revised form
27 June 2011
Accepted 25 August 2011Available online 3 September 2011
Keywords:
Individual based models
Epidemiological modeling
Endemic diseases
Latent TB infection
Contact network investigation
93/$ - see front matter & 2011 Elsevier Ltd. A
016/j.jtbi.2011.08.032
esponding author at: Dipartimento di Statis
omia, Universit�a di Pisa, via Ridolfi, 10, 5612
ail addresses: [email protected] (G. Guzzetta),
[email protected] (Z. Yang), [email protected] (S. Me
fbk.eu (C. Furlanello), [email protected] (D
a b s t r a c t
Evidence of preferential mixing through selected social routes has been suggested for the transmission
of tuberculosis (TB) infection in low burden settings. A realistic modelization of these contact routes is
needed to appropriately assess the impact of individually targeted control strategies, such as contact
network investigation of index cases and treatment of latent TB infection (LTBI).
We propose an age-structured, socio-demographic individual based model (IBM) with a realistic,
time-evolving structure of preferential contacts in a population. In particular, transmission within
households, schools and workplaces, together with a component of casual, distance-dependent contacts
are considered. We also compared the model against two other formulations having no social structure
of contacts (homogeneous mixing transmission): a baseline deterministic model without age structure
and an age-structured IBM.
The socio-demographic IBM better fitted recent longitudinal data on TB epidemiology in Arkansas, USA,
which serves as an example of a low burden setting. Inclusion of age structure in the model proved
fundamental to capturing actual proportions of reactivated TB cases (as opposed to recently transmitted) as
well as profiling age-group specific incidence. The socio-demographic structure additionally provides a
prediction of TB transmission rates (the rate of infection in household contacts and the rate of secondary
cases in household and workplace contacts).
These results suggest that the socio-demographic IBM is an optimal choice for evaluating current
control strategies, including contact network investigation of index cases, and the simulation of alternative
scenarios, particularly for TB eradication targets.
& 2011 Elsevier Ltd. All rights reserved.
1. Introduction
Tuberculosis (TB) is a major global health concern, with anestimated 9 million new cases and 1.7 million deaths worldwideeach year (World Health Organization, 2010). Most TB diseaseoccurs in resource-limited countries, and TB is among the mostdeadly infectious diseases in the world. The strong interaction ofTB with HIV dynamics, and the world-wide emergence of drug-resistant Mycobacterium tuberculosis (Mtb) strains all make TB animportant potential threat for high resource countries as well(World Health Organization, 2010).
ll rights reserved.
tica e Matematica Applicata
4 Pisa, Italy.
[email protected] (M. Ajelli),
rler),
. Kirschner).
TB is transmitted through airborne droplet nuclei, composed ofMtb organisms contained in saliva droplets, and emitted byactively infected hosts through sneezing, coughing, and talking.Uninfected individuals sharing the same environment can inhaledroplets that lead to the initiation of an immune response thatcan have one of the three different clinical outcomes: completeclearance of the pathogen (Roach et al., 2002; Bhatt and Salgame,2007), latent TB infection (LTBI) or progression to primary activedisease (about 10% of transmission cases Stead et al., 1985).Primary disease entails the uncontrolled growth of bacteria dueto an inadequate immune response by the host. LTBI is character-ized by containment of bacteria by the host immune response.Both outcomes, however, lead to the development of granulomasin lungs and other organs. The pathogen is physically containedand immunologically constrained by granulomas, often through-out the lifetime of the individual; however, containment canbreak down even as long as decades after infection (known as

Fig. 1. Epidemiological structure of the proposed models. S: susceptible,
E0: exposed for the first time, Ip: primary TB, L: latent infection, In: endogenously
reactivated TB, Es: re-exposed, Ix: exogenous re-infection resulted in TB. Exposed
here refers to individuals who have inhaled the pathogen but whose immunolo-
gical outcome is still undefined. Only individuals in compartments Ip ,In ,Ix can
transmit the disease. Gray arrows indicate either TB related mortality for the
infectious compartments, or the influx of newborns in the susceptible compart-
ment. All compartments also have an equal (age-specific) rate of natural mortality,
which is not shown for simplicity.
G. Guzzetta et al. / Journal of Theoretical Biology 289 (2011) 197–205198
endogenous reactivation), especially in immuno-compromised indi-viduals due to malnutrition, aging, or HIV infection (Kaufman, 2002).Latently infected individuals may also be re-infected and developactive disease (known as exogenous reinfection). Two billion peopleworldwide are estimated to be latently infected with Mtb andare thus at risk of reactivation (World Health Organization, 2010).TB can attack different physiological compartments, but the mainmanifestation in adults, and the only infectious type, is pulmonaryTB; therefore, it is this type of TB we focus on in this study.
There is an extensive literature for the past century of compart-mental ordinary differential equation (ODE) models describingtransmission dynamics of TB, mostly structured as variations ofthe standard SEIR type (S, susceptible, E exposed, I, infected andR recovered, see Anderson, 1992, for a review of SEIR models).Upon contact with an infectious host, most susceptible individualsmove to an exposed compartment (the latent state) before pro-gressing to symptomatic, infectious active disease. However, directprogression from the susceptible to the infectious compartment isoften allowed to mimic primary disease; recovery is possible dueto antibiotic treatment or natural cure. Recovered individuals canmove back to the latent compartment, since treatment is thoughtto not completely eliminate the bacteria nor to give protectionagainst future exposure. Mathematical models for TB have beenused for describing the natural history of the disease (Blower et al.,1995; Vynnycky and Fine, 1997), control strategy decisions at theglobal and local levels (Dye et al., 1998; Dye and Williams, 2008) aswell as for evaluating the potential effect of new clinical tools(Salomon et al., 2006; Abu-Raddad et al., 2009). Recently, the use ofindividual based models (IBMs, also termed agent based models,ABMs) is emerging in the field of epidemiological modeling(Longini, 2004; Ferguson et al., 2005; Merler and Ajelli, 2010).IBMs are particularly useful for investigating the role of spatialbehaviors and stochastic processes occurring in transmissiondynamics, and for capturing effects of individual variability indisease epidemiology. Few IBMs have to date been proposed forthe description of TB epidemiology (Murray, 2002; Cohen et al.,2007; France, 2008). While preferential transmission has beenempirically demonstrated (Marks et al., 2000; Davidow et al.,2003; Moran-Mendoza et al., 2007) at least in settings with a lowTB prevalence, few models have attempted to describe the pattern ofsocial contacts in a population for this disease. This feature isparticularly important to assess individually targeted control stra-tegies such as those based on tracing of close contacts of index cases.To this aim, we propose an age-structured, socio-demographic IBMwith a realistic, time-evolving structure of preferential contacts inthe population, and compare it with a simple compartmental ODEmodel and an age-structured IBM, both with homogeneous mixing.These three models have the same basic epidemiological structureand are parametrized and validated against data derived froma low burden setting. In particular, we focused on the state ofArkansas, representing approximately 1% of the total USA popula-tion and characterized by average socio-demographical and epide-miological characteristics and low immigration. This choice wasdictated by the availability of published data from a molecularepidemiology study on the proportion of endogenously reactivatedover the total TB cases in Arkansas in the years 1997–2003 (Franceet al., 2007).
2. Materials and methods
Among the several variants of the SEIR compartmental struc-ture proposed in the literature, we chose one, described in Fig. 1,largely inspired by Vynnycky and Fine (1997) and in agreementwith previous published IBMs (Murray, 2002; Cohen et al., 2007;France, 2008).
This structure has the advantage of distinguishing the threeforms of active TB (primary, endogenously reactivated and exo-genously re-infected). Moreover, it includes two exposed compart-ments, E0 and Es. Here, the term exposed refers to the subset ofclose contacts of an index case who have inhaled the dropletnuclei containing tubercle bacilli, known as adequate contacts inepidemiological modeling terminology (Hethcote, 2000). Thisterminology is not to be confused with that adopted in epide-miological studies, where all close contacts of an index case areconsidered exposed, since in practice it is impossible to detect theinhalation of droplets. In this study, exposed compartments trackthe first several months after acquisition of the pathogen, wherethe immune status of the individual is not yet clinically defined.The introduction of this compartment is based on the observationthat the risk of primary TB, while highest in the first year afterinfection is non-negligible over the first 5 years post-exposure(Styblo, 1991). More recently within-host models of the humanimmune response to TB infection (Wigginton and Kirschner,2001; Marino et al., 2004; Sud et al., 2006) show that the outcomeof infection (latency or primary TB) in a naive host is undeter-mined until a time of at least a hundred days after inhalation ofthe pathogen. From the exposed or re-exposed state, individualsmove to either the latent or the corresponding infectious com-partment; however, hosts who inhale the pathogen for the firsttime may also completely clear the pathogen and revert to a stateof susceptibility. Unsuccessful infections are a possible outcomeof Mtb inhalation (Roach et al., 2002; Bhatt and Salgame, 2007),but they are generally neglected in epidemiological models, sincetheir frequency is unknown. Therefore, most models estimate atransmissibility parameter that includes both the effect of socialencounters and that of individual immunological mechanisms. Inthis paper we acknowledge the distinction of the two effects inthe perspective of integrating immunological and epidemiologicaldynamics in future models. Since our goal is to capture transmis-sion in a low burden setting (in the USA) where the case detectionrate is close to 100%, we also need to account for treatment ofindividuals. It is not well understood whether treatment kills allbacteria in a host, or simply helps regain containment of bacteria(Gomez, 2004; Van Rie et al., 1999). Treated individuals have beenobserved to spontaneously reactivate TB (relapse) (Weis et al.,1994), giving some support to the hypothesis that bacteria may

G. Guzzetta et al. / Journal of Theoretical Biology 289 (2011) 197–205 199
not be completely cleared in treated individuals; on this basis, weassume that treated individuals will revert to a latent state.We also assume that case detection and effective treatmentoccurs randomly in a population: at each time step, all infectiousindividuals have the same fixed probability of being cured.
2.1. Modeling TB dynamics
We present three different models based on the describedepidemiological structure:
A.
An ODE model with homogeneous mixing, no age structure andconstant population size. The population is kept at steady statefor simplicity, by using a number of susceptible newborns peryear equal to the total number of yearly deaths. Model details areavailable in Section 1.1 of Supplementary material.B.
An age-structured stochastic version of the ODE model, imple-mented as an IBM where transitions between epidemiologicalstates for each individual are dictated by a probability. Homo-geneous mixing is still assumed in this model. Age-structureevolves over time as individuals grow older or die accordingto age-specific mortality rates; a given number of newborns isintroduced each year into the susceptible compartment accordingto estimated fertility rates. Thus, the population size is no longerassumed to be constant in time. Age-dependent risks of develop-ing TB disease have been assumed. Moreover, an age-dependentprobability of developing smear positive TB has been introducedto account for differential infectiousness related to smear status.The infectiousness of smear negative TB cases is assumed to beone fourth that of smear positive cases, as estimated from theliterature (Behr et al., 1999; Tostmann et al., 2008) and adopted inother models (Abu-Raddad et al., 2009).C.
A socio-demographic IBM, which builds on model B by addingpreferential transmission terms through social contacts of indi-viduals, using as reference the one proposed for influenza in(Merler and Ajelli, 2010). The population is allocated to a spatialgrid in such a way to account for observed spatial populationdensity. Each individual belongs to a household and can beassigned, with probability depending on age, to a school, aworkplace, or neither. We assume that there are six types ofschools representing different levels of education: day care,kindergarten, primary, secondary, high school, universities; andsix types of workplaces, depending on their size (from Merlerand Ajelli, 2010). Households, schools and workplaces have alocation on the spatial grid; assignment to schools or workplacesis done to capture the commuting pattern in the region beingmodeled (see Section 1.3.3 of Supplementary material). Infec-tious individuals can thus transmit the pathogen to othersusceptibles either at their home or at their school or workplace.A component of casual transmission to the general population isalso maintained, with a probability of contact that decreases withdistance between the residences of the infectious and susceptibleindividuals. In fact, it has been found that isolates from unrelatedindividuals have a higher probability to be genotypically identicalif the cases live at close distance, at least in urban settings(J.H. Bates, Arkansas Department of Health, unpublished obser-vations). This, as well as other published studies (Verver et al.,2004), supports the hypothesis that significant transmissionoccurs in public, closed environments such as theaters, publictransportation vehicles, bars, stores and so on. Since TB is endemicand has very long dynamics (Blower et al., 1995), we account forthe evolution in time of the population’s socio-demographicstructure. We followed the approach taken in Ajelli and Merler(2009), where an IBM for an endemic disease (Hepatitis A)accounting for socio-demography has been proposed for the firsttime. According to its rules, all individuals can die of natural deathwith an age-specific probability, and they can be born intohouseholds where a couple of individuals of suitable age forparenting are present; new households can be formed if anindividual moves out of its original household to a new residenceor to form a couple with another individual from another house-hold (marriage), or when a couple splits (divorce). Individuals inschool are re-assigned to a different school only when they changetheir educational level, according to their age. Individuals inworkplaces can become unemployed with a given probability,and unemployed individuals can be assigned to a new workplace.Assignments to a new school or workplace are done in such a wayto maintain known commuting patterns. An update of thepopulation is calculated at the end of each year. We refer thereaders to Sections 1.3 and 1.5 of Supplementary material forfurther details on model C implementation and Section 1.4 for avalidation of the socio-demographic evolution.
2.2. Transmission dynamics in models B and C
In models B and C, any susceptible or latently infected individuali at any time t has a probability pi ¼ 1�e�Dt�liðtÞ, (with Dt¼ 1 weekthe time step of the simulations) of inhaling pathogen and thusmoving to the corresponding exposed compartment. The probabilityof this event depends on the instantaneous risk of infection liðtÞ,computed at any time of the simulation (as in Ciofi degli Atti et al.,2008; Ajelli and Merler, 2009; Merler and Ajelli, 2010).
�
For model B, the risk of infection for each individual is defined asli ¼X
fk ¼ 1,...,Ng
bðBÞR
Iksk
N
whereJ bðBÞR (in years�1) is the transmission rate.J N is the total population at a given time.J Ik¼1 if individual k is infectious (has active TB), 0 otherwise.J sk is the relative infectiousness of individual k; in particular,
sk¼1 if the infectious individual is a smear-positive case,sk¼0.25 if it is smear-negative (Behr et al., 1999; Tostmannet al., 2008; Abu-Raddad et al., 2009).
�
For model C, the risk of infection for each individual is definedas the sum of the risk factors coming from the differentsources of infection considered, namely:1. contacts with infectious members of the household (firstterm in Eq. (1),2. contacts with infectious individuals attending the same
school or workplace, if any (second term in Eq. (1)),3. random contacts in the population (third term in Eq. (1)).
li ¼X
fk ¼ 1,...,N9Hk ¼ Hig
bH
Iksk
niþ
X
fk ¼ 1,...,N9Pk ¼ Pig
bP
Iksk
mi
þX
fk ¼ 1,...,Ng
bðCÞR
Ikskf ðdikÞPfk ¼ 1,...,Ngf ðdikÞ
ð1Þ
The terms in Eq. (1) are defined as follows:– bH (expressed in years�1) is the within-household trans-
mission rate.– Hi is the index of the household where individual i lives in
and ni is the household size.– bP (in years�1) is the within-school/workplace transmission
rate.– Pi is the index of the school/workplace where individual i
studies/works (depending on the employment of i) and mi
is the school/workplace size (if any).– bðCÞR (in years�1) is the transmission rate through casual
contacts.

G. Guzzetta et al. / Journal of Theoretical Biology 289 (2011) 197–205200
– f ðdikÞ is the function defined in Eq. (2) in Supplementarymaterial. It makes the casual transmission of TB in thegeneral community explicitly dependent on distance throughpatterns of commuting (Ferguson et al., 2005; Ciofi degliAtti et al., 2008; Ajelli and Merler, 2009; Merler and Ajelli,2010).
In both models B and C, individuals may become infectious byprogressing to primary disease or exogenous re-infection from theexposed compartments, or to endogenous reactivation TB from thelatent compartment, according to age-specific risks. Such risks wereall described as functions of age determined by two parameters:
�
the risk of primary disease following infection by age, p(a), wasassigned a functional form inspired by the piecewise linearused in Vynnycky and Fine (1997) and originally estimated onepidemiological data from Norway. It is assumed to have aconstant, low value, pc, in children (0–10 years), a constant,typically higher value, pa, in adults (Z20 years), and a lineargrowth in between, in such a way to be continuous (Fig. 9 inSupplementary material); � the protection from re-infection disease by age, sðaÞ wasassumed to have the same functional form, with analogousparameters sc and sa. The age-specific risk of progression toTB disease by exogenous re-infection for re-exposed indivi-duals is thus given by pðaÞð1�sðaÞÞ;
� the functional form for the risk of endogenous reactivation r(a)was assumed to be a class C1 function, growing linearly for thefirst 50 years and quadratically for the last 50 years (Fig. 10 inSupplementary material). Its two parameters modulate respec-tively the average reactivation risk over ages (r), and the slope ofthe linear growth in younger ages (rm). Given r, rm forces thevalue of concavity of the parabola in older ages, thus acting as ashape factor for the functional form. This ad hoc choice for thefunctional form of the reactivation risk is more plausible than thepiecewise linear used in Vynnycky and Fine (1997): in fact, thelatter form assumes a constant risk of reactivation after the ageof 20, in contrast with the biological hypothesis of an increasedrisk of reactivation with the decaying immunological response inaged individuals (Kaufman, 2002). Moreover, this functional formallowed us to better capture the age-specific TB incidence in themodeled setting (see Section 3).
� The age-dependent probability of developing smear positive TB,fþ ðaÞ, was approximated with another piecewise linear function(Fig. 12 in Supplementary material) following Vynnycky and Fine(1997) and using estimates from epidemiological data (Franceet al., 2007).
2.3. Parametrization
Parametrization of the models was obtained by searching forthe minimum of a score function F, calculated as the combinederror on the following variables:
�
Longitudinal estimates on the prevalence (p), incidence (i) andmortality (m) per 100,000 population of active TB in the USA inyears 2001–2007, available from the World Health Organiza-tion (WHO) (World Health Organization, 2009); � Average proportion of reactivated TB cases over the total (rf) inyears 2000–2003, as measured in a published molecularepidemiology study (France et al., 2007);
� (for models B and C only) Age-group specific incidences (ai) inyears 2001–2007 from U.S. born cases in Arkansas, provided bythe Online TB Information System (OTIS) of the U.S. Center for
Disease Control (U.S. Center for Disease Control and Prevention,2010).
The relative errors between model output (in capital letters)and data (lowercase letters) were combined according to Eq. (2),to produce the score function FA for model A:
FA ¼JP�pJ2
JPJ2þ
JI�iJ2
JIJ2þ
JM�mJ2
JMJ2þ
RF�rf
RF
�������� ð2Þ
Here, J � J2 represents the Euclidean norm of the corresponding array.For models B and C, we added to Eq. (2) a term accounting for
the error between the simulated and observed age-specificincidence profiles over five age groups, as shown in Eq. (3) (FB,C
is thus the score function for both model B and C):
FB,C ¼ FAþJAI�aiJ2
JAIJ2ð3Þ
2.4. Parameter space exploration
Some of the model parameters could be precisely estimated fromepidemiological data, and were kept fixed throughout all simulations(Table 1—see Sections 2.1 and 2.2 of Supplementary material fordetails on the estimation of these parameters). An exception isparameter w (proportion of cleared infections) for models B and C,affecting the number of latently infected individuals and therefore thenumber of reactivations; while no information are available from theliterature on this parameter, we expect it to have a negligible effect inthe time-span of 7 years considered in this study, since very fewrecently infected individuals will have the chance to reactivate.Therefore, we fix its value in models B and C to the best fitting valuesuggested by the calibration of model A (see Table 2).
All the other model parameters (in number of ZA¼7, ZB¼7 andZC¼9 for respectively models A, B and C) were left free to vary over arange during the parametrization procedure. For models B and C, weintroduce the following notation: we term P1 the subset of freeparameters whose ranges could be estimated from epidemiologicalobservations, and P2 the set of remaining free parameters, whichwere explored over a broad range. In particular, P2 includes the
transmissibilities (bðBÞR for model B and bH ,bP ,bðCÞR for model C) and
the shape factor of the reactivation risk by age (rm for both models).
Therefore, the cardinality of P2 is 9PðBÞ2 9¼ 2 for model B and 9PðCÞ2 9¼ 4
for model C. Sections 2.1 and 2.2 in Supplementary material report adetailed description of all model parameters, and the estimation oftheir ranges with the corresponding reference studies.
The parameter space was explored using the Latin HypercubeSampling (LHS) method (Marino et al., 2008). LHS allows anefficient sampling of the parameter space, as it requires a smallersample size Q than uniform sampling to achieve the sameaccuracy (Marino et al., 2008).
For model A, simulations were run with QA¼100,000 combi-nations of the ZA¼7 free parameters. The parameter set obtainingthe minimum score FA was selected (see Table 2).
IBMs are computationally more intensive than ODEs, andintrinsically stochastic. Several realizations of the model withthe same parameter set are required to obtain stable results withrespect to random variability: in fact, each result presented in thepaper for IBMs is based on 100 realizations of the same experi-ment. The large sample size used for model A is thus unfeasiblefor models B and C, and the search of best fitting parameters wasperformed according to the following scheme:
1.
Run a global LHS sampling with Q¼10,000 on all free para-meters of model B (ZB¼7).2.
Run a local LHS search around the best fitting parameter set, i.e.,fix model parameters from the subset P1 and search only on
Table 2Best fitting parameter sets for the three models.
Par Unit Description Model A Model B Model C
s % Protection from re-infection 28.1 –
p % Proportion of primary TB 15.5 –
w % Proportion of unsuccessful infections 68 68n
Subset P1
k yrs�1 Rate of progression to outcome 2.04 0.947
d yrs�1 Treatment rate 1.25 1.28
pc % Proportion of primary TB ðr10 yrsÞ – 9.99
pa % Proportion of primary TB (Z20 yrs) – 16.71
r yrs�1 Average reactivation rate 1.02�10�3 1.43�10�3
Subset P2
rm yrs�2 Slope of reactivation rate for r50 yrs – 1.34�10�5 1.21�10�5
bH yrs�1 Transmissibility (households) – – 4.27
bP yrs�1 Transmissibility (schools/workplaces) – – 3.51
bR yrs�1 Transmissibility (casual contacts) 1.54 17.29 6.26
n The values of w for models B and C were not obtained from the fit, but fixed to the best estimate from model A (see Section 2.4).
Table 1Values adopted for fixed parameters.
Par Model Unit Description Value Ref.
m A yrs�1 Natural death rate 1.25�10�2 n
b A yrs�1 Number of newborns per year 33,750 nn
mT A, B, C yrs�1 TB related death rate 0.133 World Health Organization (2009)
sc B,C % Protection from re-infection ðr10 yrsÞ 0 Vynnycky and Fine (1997)
sa B,C % Protection from re-infection ðZ20 yrsÞ 40 Vynnycky and Fine (1997)
f þc B,C % Proportion of smear positive cases ðr5 yrsÞ 0 France et al. (2007)
f þa B,C % Proportion of smear positive cases ðZ25 yrsÞ 29 France et al. (2007)
A B,C – Time-from-exposure-dependent relative risk
of primary TB, scaling factor 1.54 Vynnycky and Fine (1997)
g B,C yrs�1 Time-from-exposure-dependent relative risk
of primary TB, time constant 0.92 Vynnycky and Fine (1997)
w B, C % Proportion of cleared infections 68 nnn
n Corresponds to an average lifetime of m�1 ¼ 80 years.nn Chosen so to obtain a constant population of b=m¼ 2;700,000 individuals, close to Arkansas values in the considered period.nnn Fixed from best estimate of model A.
G. Guzzetta et al. / Journal of Theoretical Biology 289 (2011) 197–205 201
parameters from P2. Since model B is a special case of model C(with bH ,bP ¼ 0), a local search starting from the same minimumcan be done for model C as well. The resulting parameter spaceshave a dimension of respectively Zlocal
B ¼ 2 and ZlocalC ¼ 4 and are
explored with a sample size of Q local ¼ 500. The ranges of freeparameters in the local search are reduced, based on indicationsfrom best fitting simulations in the global search (see Section 2.4in Supplementary material for details).
The best fitting parameter set for both models B and C after thelocal searches are reported in Table 2 and discussed in Section 3.
2.5. Model initialization
The three models were initialized with prevalence data fromthe USA in 2000, the same epidemiological year as the census dataused for the socio-demographic initialization. The initial numberof prevalent cases was set to 5.61 per 100,000, as reported for theUSA by the World Health Organization (WHO) (World HealthOrganization, 2009). The initial number of individuals with LTBIwas estimated to an average 4.2% of the general USA populationin 1999–2000 (Bennett et al., 2008); age-specific latent preva-lences for five age groups (0–14, 15–24, 25–44, 45–64, 65–100)are also provided in the same study and were used as initialvalues in the age-structured IBMs. The initial number of latentcases was distributed randomly in the population, as no data is
available about their clustering with respect to households,schools or workplaces in low-burden settings. Finally, the initialnumber of exposed individuals was initialized in such a way togive a correct estimate of incidence at the end of year 2000 (seeSection 2.3 in Supplementary material), and the correspondingtimes since Mtb infection were chosen from a uniform distribu-tion with range 0–5 years.
3. Results
Table 2 reports the estimated best fitting parameter sets for thethree models. A discussion of variability of best fitting parametersfrom P1 and P2 in models B and C is given in Section 2.4 ofSupplementary material.
The estimated risk of primary disease upon infection p (average ofp(a) over age for the IBMs) was about 15% for all models, slightlyabove the 5–10% risk of primary disease widely suggested in theliterature (Stead et al., 1985; Vynnycky and Fine, 1997). Best fittingparameters of the reactivation rate for models B and C suggest anincreased risk (respectively 7.4 and 8.3 times) for individuals olderthan 50 years old, as compared to the general population. A 3.8-foldrisk was also found for the same age group in a longitudinal studywithin a small USA community (Horsburgh et al., 2010).
The transmissibility parameter, bR, of model A was signifi-cantly smaller than that of models B and C. Calculating the Annual

G. Guzzetta et al. / Journal of Theoretical Biology 289 (2011) 197–205202
Risk of TB Infection (ARI) in year 2000 by the formula:
ARIð2000Þ ¼ bðAÞR ð1�wÞIð2000Þ
model A predicts a value of 0.003%, which is remarkably lowwhen compared to the estimate of 0.03% in 1995 by Daniel andDebanne (1997), Salpeter and Salpeter (1998); although TBincidence and prevalence have constantly declined in the USAbetween 1995 and 2000 (U.S. Center for Disease Control andPrevention, 2010), a 10-fold reduction of the ARI in this short timewindow seems unrealistic. The underestimation of transmissionin model A can be attributed to the absence of an age structure. Infact, not accounting for the age-dependent heterogeneity in thereactivation risk produces an overestimation of reactivated inci-dent cases; therefore, in order to capture incidence values in thetime period considered, model A compensates by reducing theeffect of recent transmission.
For calculating ARI using model B, we need to consider thedifference in infectiousness related to smear status. The proportionof smear-negative TB cases in Arkansas is approximately f� ¼ 70%(France et al., 2007); considering the relative infectiousness of smearnegative and smear-positive individuals (s� ¼ 0:25, sþ ¼ 1), thepredicted ARI becomes
ARIð2000Þ ¼ bðBÞR ð1�wÞX
z ¼ þ ,�
fzszIð2000Þ
Fig. 2. Comparison of prevalence, incidence and mortality. Longitudinal prevalence, inc
model fits. Vertical lines in panels on the left represent 95% bootstrap confidence inte
(with fþ ¼ 1�f�), resulting in an estimated ARI of 0.014% in year2000, in the same order of magnitude of the cited value of 0.03%(Daniel and Debanne, 1997; Salpeter and Salpeter, 1998). A calcula-tion of the ARI in model C cannot be done due to the heterogeneousmixing introduced by the social structure. However, the best fittingtransmissibility values in the three routes, taken together, have thesame order of magnitude of model B: therefore, we expect the ARI inthis model to be close to actual values.
Data on prevalence, incidence and mortality per 100,000 indivi-duals in the years 2001–2007 for the USA show a steady, lineardecrease in the years considered. Prevalence drops from 3.96 to 3.15cases per 100,000 individuals, incidence from 5.29 to 4.22 new casesper 100,000 individuals per year and mortality from 0.53 to 0.42cases per 100,000 individuals, with an the average yearly percentagedrop of about 3.7% for all indicators (U.S. Center for Disease Controland Prevention, 2010). All models capture this pattern (Fig. 2), withrelative errors staying below 715% at all time points for allvariables. The improvement in fit between models C and B wasfound to be significant by means of an F-test for nested models(Lomax, 2007) (Fð2;17Þ ¼ 8:424, p¼ 2:87� 10�3). For the two IBMs,the average values over 100 runs with the 95% bootstrap confidenceintervals are plotted.
If we examine the proportions of endogenously reactivatedcases (Table 3), model A overestimates the reported proportionof 68.5% reactivated cases (France et al., 2007), confirming the
idence and mortality per 100,000 individuals in data (2001–2007) and in the three
rvals around average values for 100 simulations at each time point.

Table 3Comparison of reactivation fractions. Percentage of reactivated cases over total in
data (2000–2003) and as predicted by the three models.
Estimation method Reactivation fraction
Average (%) 95% CI
Data (France et al., 2007) 68.5 67.1–69.8
Model A 76.8 76.5–77.2
Model B 67.4 62.5–71.9
Model C 68.2 61.9–72.5
Fig. 3. Comparison of age specific incidences. Incidences per 100,000 individuals
for five age groups in data (average 2001–2007) and in the two IBMs. Vertical
lines represent 95% bootstrap confidence intervals around average values for 100
simulations.
Table 4Comparison of infected contacts and secondary active TB cases in households and
workplaces. Proportions of infected contacts and secondary active TB cases in
households and workplaces as estimated from large scale studies and predicted by
Model C.
Target variable Reference study Model C
(95% CI)
Marks
et al.
(2000)
Davidow
et al.
(2003)
Moran-Mendoza
et al. (2007)
Infection rates
(households) (%)
44 36.4 59.7 (59.4–60.0)
Infection rates
(workplaces) (%)
22 18.7 9.8 (9.6–9.9)
Secondary TB
(households) (%)
2.8 2.87 (2.78–2.97)
Secondary TB
(workplaces) (%)
0.63 0.46 (0.44–0.48)
Fig. 4. Infection rate by workplace size as predicted by model C. The red
background indicates 95% bootstrap confidence intervals around average values
for 100 simulations. (For interpretation of the references to color in this figure
legend, the reader is referred to the web version of this article.)
G. Guzzetta et al. / Journal of Theoretical Biology 289 (2011) 197–205 203
previous observation that the lack of age structure overpredictsnumbers of reactivations. Models B and C are equally able toaccount for the measured reactivation fraction, with confidenceintervals that overlap with data.
Fig. 3 compares data on age-specific incidences of U.S. borncases in Arkansas for years 2001–2007 (U.S. Center for DiseaseControl and Prevention, 2010) with corresponding predictions bymodels B and C (model A cannot account for this variable, sinceit lacks an age structure). Data show a growth in the specificincidence for older age groups, rising from 1.13 cases per 100,000in children under 14 to 9.32 per 100,000 in elderly people over 65.This trend can be explained with the observation that almost 70%of active TB cases in Arkansas are due reactivation (Table 3), andthat the reactivation risk increases with age. Both IBMs produce agood estimate of age-specific incidence.
In addition to the other two models, model C is able to trackdown patterns of transmission within households and work-places. We use data from three different large-scale studies wherecontacts of active TB cases were screened for TB infection bymeans of Tuberculin Skin Test (TST) administered at least 10weeks after the last contact with the index case. In Marks et al.(2000), 6225 contacts of 1080 cases diagnosed between July 1996and June 1997 in 11 U.S. based TB programs were investigated.About 2664 were household contacts and 747 were workplacecontacts. Another study (Davidow et al., 2003) investigated work-place transmission for 724 contacts of 42 cases occurring in 1996in five state TB control programs in the U.S. The largest studyavailable (Moran-Mendoza et al., 2007) involved 26,542 contactsof 3485 cases between 1990 and 2000 in British Columbia,Canada. The fraction of TST positive individuals was taken as aproxy of the proportion of adequate contacts for transmission ofthe pathogen; data from Marks et al. (2000), Moran-Mendozaet al. (2007) were used for household contacts and from Davidowet al. (2003), Moran-Mendoza et al. (2007) for workplace contacts.The fraction of secondary active TB cases was also reported inMoran-Mendoza et al. (2007). These data were not used to
calibrate best fitting parameters: instead, they are compared withmodel predictions as a validation of the plausibility of the model.Table 4 reports the estimated infection rates (proportions ofcontacts who developed LTBI or primary disease) and the propor-tion of secondary active TB cases for household and workplacecontacts in data and in the model. According to Moran-Mendozaet al. (2007), the rate of secondary cases in households is over fourtimes the rate in workplaces, whereas the ratio of infection ratesis approximately two times (see Table 4). Only contacts who didnot receive isoniazid treatment for LTBI are considered; thesecondary TB rate is expected to be lower in the presence of LTBItreatment. One explanation for the increased risk of secondarycases in households could be common susceptibility to TB diseasewithin households, due to shared genetic and environmental riskfactors (such as poor hygiene, malnutrition, passive smoking,etc.). Table 4 shows good agreement for all variables exceptfor the infection rate in workplaces, which is underestimated.Our model does not account explicitly for a differential risk ofinfection in households and in workplaces. This explains partly itsinability to capture all the variables in Table 4. For instance, if themodel predicted correctly the infection rate in workplaces, itwould also overestimate the rate of secondary cases in the samesetting due to the setting-independent risk of infection.
A significant difference ðpo10�2Þ in infection rates among
contacts of smear positive versus smear negative cases was foundin contact investigations at workplaces (Davidow et al., 2003).Model C predicts respectively an average 14% and 7% infectionsamong contacts of smear positive and smear negative cases inworkplaces (significantly different, p510�2).
G. Guzzetta et al. / Journal of Theoretical Biology 289 (2011) 197–205204
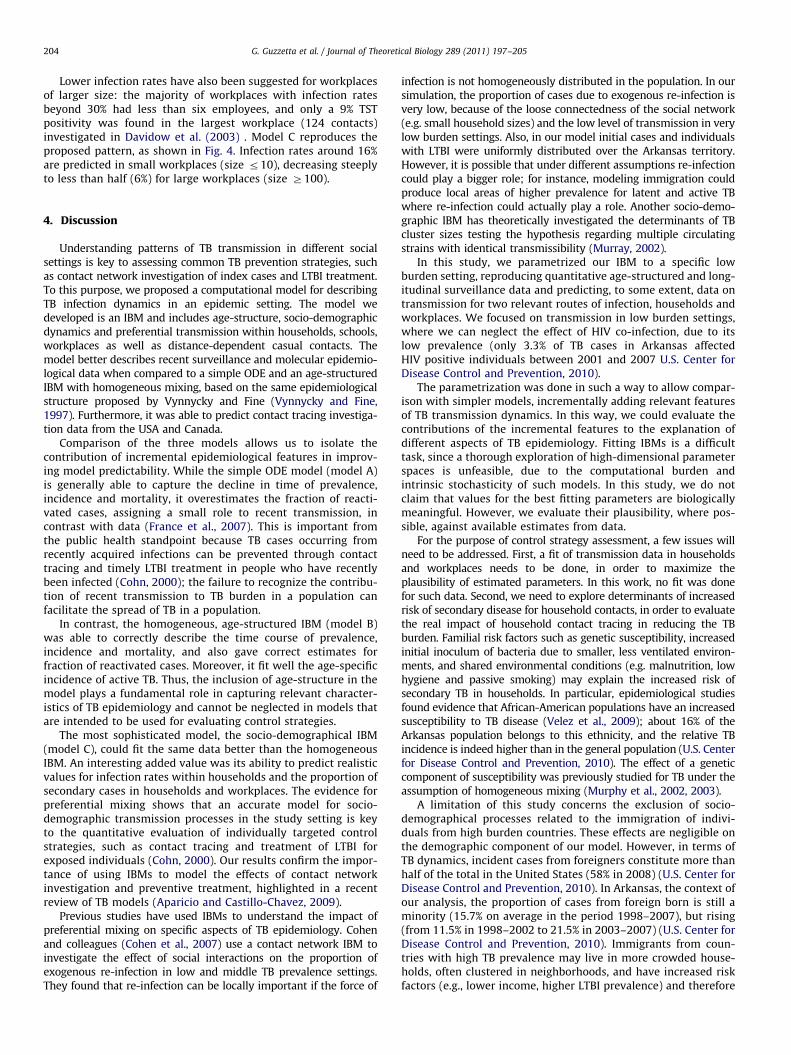
Lower infection rates have also been suggested for workplacesof larger size: the majority of workplaces with infection ratesbeyond 30% had less than six employees, and only a 9% TSTpositivity was found in the largest workplace (124 contacts)investigated in Davidow et al. (2003) . Model C reproduces theproposed pattern, as shown in Fig. 4. Infection rates around 16%are predicted in small workplaces (size r10), decreasing steeplyto less than half (6%) for large workplaces (size Z100).
4. Discussion
Understanding patterns of TB transmission in different socialsettings is key to assessing common TB prevention strategies, suchas contact network investigation of index cases and LTBI treatment.To this purpose, we proposed a computational model for describingTB infection dynamics in an epidemic setting. The model wedeveloped is an IBM and includes age-structure, socio-demographicdynamics and preferential transmission within households, schools,workplaces as well as distance-dependent casual contacts. Themodel better describes recent surveillance and molecular epidemio-logical data when compared to a simple ODE and an age-structuredIBM with homogeneous mixing, based on the same epidemiologicalstructure proposed by Vynnycky and Fine (Vynnycky and Fine,1997). Furthermore, it was able to predict contact tracing investiga-tion data from the USA and Canada.
Comparison of the three models allows us to isolate thecontribution of incremental epidemiological features in improv-ing model predictability. While the simple ODE model (model A)is generally able to capture the decline in time of prevalence,incidence and mortality, it overestimates the fraction of reacti-vated cases, assigning a small role to recent transmission, incontrast with data (France et al., 2007). This is important fromthe public health standpoint because TB cases occurring fromrecently acquired infections can be prevented through contacttracing and timely LTBI treatment in people who have recentlybeen infected (Cohn, 2000); the failure to recognize the contribu-tion of recent transmission to TB burden in a population canfacilitate the spread of TB in a population.
In contrast, the homogeneous, age-structured IBM (model B)was able to correctly describe the time course of prevalence,incidence and mortality, and also gave correct estimates forfraction of reactivated cases. Moreover, it fit well the age-specificincidence of active TB. Thus, the inclusion of age-structure in themodel plays a fundamental role in capturing relevant character-istics of TB epidemiology and cannot be neglected in models thatare intended to be used for evaluating control strategies.
The most sophisticated model, the socio-demographical IBM(model C), could fit the same data better than the homogeneousIBM. An interesting added value was its ability to predict realisticvalues for infection rates within households and the proportion ofsecondary cases in households and workplaces. The evidence forpreferential mixing shows that an accurate model for socio-demographic transmission processes in the study setting is keyto the quantitative evaluation of individually targeted controlstrategies, such as contact tracing and treatment of LTBI forexposed individuals (Cohn, 2000). Our results confirm the impor-tance of using IBMs to model the effects of contact networkinvestigation and preventive treatment, highlighted in a recentreview of TB models (Aparicio and Castillo-Chavez, 2009).
Previous studies have used IBMs to understand the impact ofpreferential mixing on specific aspects of TB epidemiology. Cohenand colleagues (Cohen et al., 2007) use a contact network IBM toinvestigate the effect of social interactions on the proportion ofexogenous re-infection in low and middle TB prevalence settings.They found that re-infection can be locally important if the force of
infection is not homogeneously distributed in the population. In oursimulation, the proportion of cases due to exogenous re-infection isvery low, because of the loose connectedness of the social network(e.g. small household sizes) and the low level of transmission in verylow burden settings. Also, in our model initial cases and individualswith LTBI were uniformly distributed over the Arkansas territory.However, it is possible that under different assumptions re-infectioncould play a bigger role; for instance, modeling immigration couldproduce local areas of higher prevalence for latent and active TBwhere re-infection could actually play a role. Another socio-demo-graphic IBM has theoretically investigated the determinants of TBcluster sizes testing the hypothesis regarding multiple circulatingstrains with identical transmissibility (Murray, 2002).
In this study, we parametrized our IBM to a specific lowburden setting, reproducing quantitative age-structured and long-itudinal surveillance data and predicting, to some extent, data ontransmission for two relevant routes of infection, households andworkplaces. We focused on transmission in low burden settings,where we can neglect the effect of HIV co-infection, due to itslow prevalence (only 3.3% of TB cases in Arkansas affectedHIV positive individuals between 2001 and 2007 U.S. Center forDisease Control and Prevention, 2010).
The parametrization was done in such a way to allow compar-ison with simpler models, incrementally adding relevant featuresof TB transmission dynamics. In this way, we could evaluate thecontributions of the incremental features to the explanation ofdifferent aspects of TB epidemiology. Fitting IBMs is a difficulttask, since a thorough exploration of high-dimensional parameterspaces is unfeasible, due to the computational burden andintrinsic stochasticity of such models. In this study, we do notclaim that values for the best fitting parameters are biologicallymeaningful. However, we evaluate their plausibility, where pos-sible, against available estimates from data.
For the purpose of control strategy assessment, a few issues willneed to be addressed. First, a fit of transmission data in householdsand workplaces needs to be done, in order to maximize theplausibility of estimated parameters. In this work, no fit was donefor such data. Second, we need to explore determinants of increasedrisk of secondary disease for household contacts, in order to evaluatethe real impact of household contact tracing in reducing the TBburden. Familial risk factors such as genetic susceptibility, increasedinitial inoculum of bacteria due to smaller, less ventilated environ-ments, and shared environmental conditions (e.g. malnutrition, lowhygiene and passive smoking) may explain the increased risk ofsecondary TB in households. In particular, epidemiological studiesfound evidence that African-American populations have an increasedsusceptibility to TB disease (Velez et al., 2009); about 16% of theArkansas population belongs to this ethnicity, and the relative TBincidence is indeed higher than in the general population (U.S. Centerfor Disease Control and Prevention, 2010). The effect of a geneticcomponent of susceptibility was previously studied for TB under theassumption of homogeneous mixing (Murphy et al., 2002, 2003).
A limitation of this study concerns the exclusion of socio-demographical processes related to the immigration of indivi-duals from high burden countries. These effects are negligible onthe demographic component of our model. However, in terms ofTB dynamics, incident cases from foreigners constitute more thanhalf of the total in the United States (58% in 2008) (U.S. Center forDisease Control and Prevention, 2010). In Arkansas, the context ofour analysis, the proportion of cases from foreign born is still aminority (15.7% on average in the period 1998–2007), but rising(from 11.5% in 1998–2002 to 21.5% in 2003–2007) (U.S. Center forDisease Control and Prevention, 2010). Immigrants from coun-tries with high TB prevalence may live in more crowded house-holds, often clustered in neighborhoods, and have increased riskfactors (e.g., lower income, higher LTBI prevalence) and therefore
G. Guzzetta et al. / Journal of Theoretical Biology 289 (2011) 197–205 205
feature a specific epidemiology. Identifying mixing patterns of theimmigrant and autochthonous population needs careful analysis,which we leave to a separate study. Transmission of Mtb in otherimportant social settings, such as within hospital wards, will alsobe addressed in future versions of the IBM.
Acknowledgments
We would like to thank Dr. Joseph H. Bates and Dr. LeonardN. Mukasa from the Arkansas Department of Health for theirassistance with data retrieval and interpretation, useful com-ments on the model, and careful reading of the manuscript.Additionally, we would like to thank Dr. Piero Manfredi fromthe University of Pisa for his remarks and suggestions. All authorswish to thank the anonymous reviewers for their valuablesuggestions. MA and SM thank the EU FP7 Epiwork project forresearch funding. Additionally, this work was supported byNational Institute of Health (NIH) grants R33 HL 092853-01,R01-HL-106804-01 and R01-EB-012579-04 awarded to DK.
Appendix A. Supplementary material
Supplementary data associated with this article can be foundin the online version at doi:10.1016/j.jtbi.2011.08.032.
References
Abu-Raddad, L.J., Sabatelli, L., Achterberg, J., Sugimoto, J., Longini, I., Dye, C.,Halloran, M., 2009. Epidemiological benefits of more-effective tuberculosisvaccines, drugs, and diagnostics. PNAS 106, 13980–13985.
Ajelli, M., Merler, S., 2009. An individual-based model of hepatitis A transmission.J. Theor. Biol. 259, 478–488.
Anderson, R.M., M.R.M., 1992. Infectious Diseases of Humans: Dynamics andControl, Oxford University Press.
Aparicio, J.P., Castillo-Chavez, C., 2009. Preventive treatment of tuberculosisthrough contact tracing. Math. Biosci. Eng. 6, 209–237.
Behr, M.D., Warren, S.A., Salamon, H., Hopewell, P.C., Ponce de Leon, A., Daley, C.L.,Small, P.M., 1999. Transmission of Mycobacterium tuberculosis from patientssmear-negative for acid-fast bacilli. Lancet 353, 444–449.
Bennett, D.E., Courval, J.M., Onorato, I., Agerton, T., Gibson, J.D., Lambert, L.,McQuillan, G.M., Lewis, B., Navin, T.R., Castro, K.G., 2008. Prevalence oftuberculosis infection in the United States population. Am. J. Respir. Crit. CareMed. 177, 348–355.
Bhatt, K., Salgame, P., 2007. Host innate immune response to mycobacteriumtuberculosis. J. Clin. Immunol. 27, 347–362.
Blower, S.M., McLean, A.R., Porco, T.C., Small, P.M., Hopewell, P.C., Sanchez, M.A.,Moss, A.R., 1995. The intrinsic transmission dynamics of tuberculosis epi-demics. Nat. Med. 1, 815–821.
Ciofi degli Atti, M., Merler, S., Rizzo, C., Ajelli, M., Massari, M., Manfredi, P.,Furlanello, C., Scalia Tomba, G., Iannelli, M., 2008. Mitigation measures forpandemic influenza in Italy: an individual based model considering differentscenarios. PLoS ONE 3, e1790.
Cohen, T., Colijn, C., Finklea, B., Murray, M., 2007. Exogenous re-infection and thedynamics of tuberculosis epidemics: local effects in a network model oftransmission. J. R. Soc. Interface 4, 523–531.
Cohn, D.L., 2000. Treatment of latent tuberculosis infection: renewed opportunityfor tuberculosis control. Clin. Infect. Dis. 31, 120–124.
Daniel, T.M., Debanne, S.M., 1997. Estimation of the annual risk of tuberculousinfection for white men in the United States. J. Infect. Dis. 175, 1535–1537.
Davidow, A.L., Mangura, B.T., Wolman, M.S., Bur, S., Reves, R., Thompson, V., Ford,J., Reichler, M.R., 2003. Workplace contact investigation in the United States.Int. J. Tubercul. Lung Dis. 7, S446–S452.
Dye, C., Garnett, G.P., Sleeman, K., Williams, B.G., 1998. Prospects for worldwidetuberculosis control under the WHO DOTS strategy. Lancet 352, 1886–1891.
Dye, C., Williams, B.G., 2008. Eliminating human tuberculosis in the twenty-firstcentury. J. R. Soc. Interface 5, 233–243.
Ferguson, N.M., Cummings, D.A.T., Cauchemez, S., Fraser, C., Riley, S., Meeyai, A.,Iamsirithaworn, S., Burke, D.S., 2005. Strategies for containing an emerginginfluenza pandemic in Southeast Asia. Nature 437, 209–214.
France, A.M., 2008. Integrating Molecular Typing into Routine TuberculosisSurveillance: An Assessment of the Strengths and Limitations of CurrentApproaches. Ph.D. Thesis, University of Michigan.
France, A.M., Cave, M.D., Bates, J.H., Foxman, B., Chu, T., Yang, Z., 2007. What’sdriving the decline in tuberculosis in arkansas? a molecular epidemiologicanalysis of tuberculosis trends in a rural, low-incidence population, 1997–2003.Am. J. Epidemiol. 166, 662–671.
Gomez, J.E., McKinney J.D., 2004. Tuberculosis persistence, latency, and drugtolerance. Tuberculosis 84, 29–44.
Hethcote, H.W., 2000. The mathematics of infectious diseases. SIAM Rev. 42,599–653.
Horsburgh, C.R., O’Donnell, M., Chamblee, S., Moreland, J.L., Johnson, J., Marsh, B.J.,Narita, M., Scoles Johnson, L., Fordham von Reyn, C., 2010. Revisiting rates ofreactivation tuberculosis. Am. J. Respir. Crit. Care Med. 182, 425.
Kaufman, S.H.E., 2002. Protection against tuberculosis: cytokines T cells andmacrophages. Ann. Rheum. Dis. 61, ii54–ii58.
Lomax, R.G., 2007. Statistical Concepts. Lawrence Erlbaum Assoc Inc.Longini, I.M., Halloran, M.E., Nizam, A., Yang, Y., 2004. Containing pandemic
influenza with antiviral agents. Am. J. Epidemiol. 159, 623–633.Marino, S., Pawar, S., Fuller, C.L., Reinhart, T.A., Flynn, J.L., Kirschner, D.E., 2004.
Dendritic cell trafficking and antigen presentation in the human immuneresponse to mycobacterium tuberculosis. J. Immunol. 173, 494–506.
Marino, S., Hogue, I.B., Ray, C.J., Kirschner, D.E., 2008. A methodology forperforming global uncertainty and sensitivity analysis in systems biology.J. Theor. Biol. 254, 178–196.
Marks, S.M., Taylor, Z., Qualls, N.L., Shrestha-Kuwahara, R.J., Wilce, M.A., Nguyen,C.H., 2000. Outcomes of contact investigation of infectious tuberculosispatients. Am. J. Respir. Crit. Care Med. 162, 2033–2038.
Merler, S., Ajelli, M., 2010. The role of population heterogeneity and humanmobility in the spread of pandemic influenza. Proc. R. Soc. B 277, 557–565.
Moran-Mendoza, O., Marion, S.A., Elwood, K., Patrick, D.M., FitzGerald, J.M., 2007.Tuberculin skin test size and risk of tuberculosis development: a largepopulation-based study in contacts. Int. J. Tubercul. Lung Dis. 11, 1014–1020.
Murphy, B.M., Singer, B.H., Anderson, S., Kirschner, D.E., 2002. Comparing epidemictuberculosis in demographically distinct heterogeneous populations. Math.Biosci. 180, 161–185.
Murphy, B.M., Singer, B.H., Kirschner, D.E., 2003. On the treatment of tuberculosisin heterogeneous populations. J. Theor. Biol. 223, 391–404.
Murray, M., 2002. Determinants of cluster distribution in the molecular epide-miology of tuberculosis. PNAS 99, 1538–1543.
Roach, D.R., Bean, A.G.D., Demangel, C., France, M.P., Briscoe, H., Britton, W.J., 2002.TNF regulates chemokine induction essential for cell recruitment, granulomaformation, and clearance of mycobacterial infection. J. Immunol. 168, 4620–4627.
Salomon, J.A., Lloyd-Smith, J.O., Getz, W.M., Resch, S., Sanchez, M., Porco, T.,Borgdorff, M.W., 2006. Prospects for advancing tuberculosis control effortsthrough novel therapies. PLoS Med. 3, e273.
Salpeter, E.E., Salpeter, S.R., 1998. Mathematical model for the epidemiology oftuberculosis, with estimates of the reproductive number and infection-delayfunction. Am. J. Epidemiol. 142, 398–406.
Stead, W.W., Lofgren, J.P., Warren, E., Thomas, C., 1985. Tuberculosis as an endemicand nosocomial infection among the elderly in nursing homes. N. Engl. J. Med.312, 1487.
Styblo, K., 1991. Epidemiology of Tuberculosis: Selected Papers, Royal NetherlandsTuberculosis Association.
Sud, D., Bigbee, C., Flynn, J.A.L., Kirschner, D.E., 2006. Contribution of CD8 T Cells tocontrol of Mycobacterium tuberculosis infection. J. Immunol. 176, 4296–4314.
Tostmann, A., Kik, S.V., Kalisvaart, N.A., Sebek, M.M., Verver, S., Boeree, M.J., vanSoolingen, D., 2008. Tuberculosis transmission by patients with smear-nega-tive pulmonary tuberculosis in a large cohort in the Netherlands. Clin. Infect.Dis. 47, 1135–1142.
U.S. Center for Disease Control and Prevention, 2010. Online TuberculosisInformation System, /http://wonder.cdc.gov/tb.htmlS, accessed November30.
Van Rie, A., Warren, R., Richardson, M., Victor, T.C., Gie, R.P., Enarson, D.E., Beyers,N., Van Helden, P., 1999. Exogenous reinfection as a cause of recurrenttuberculosis after curative treatment. N. Engl. J. Med. 341, 1174–1179.
Velez, D.R., Hulme, W.F., Myers, J.L., Weinberg, J.B., Levesque, M.C., Stryjewski,M.E., Abbate, E., Estevan, R., Patillo, S.G., Gilbert, J.R., Hamilton, W., Scott, C.D.,2009. NOS2A, TLR4, and IFNGR1 interactions influence pulmonary tuberculosissusceptibility in African-Americans. Hum. Genet. 126, 643–653.
Verver, S., Warren, R.M., Munch, Z., Richardson, M., van der Spuy, G.D., Borgdorff,M.W., Behr, M.A., Beyers, N., van Helden, P.D., 2004. Proportion of tuberculosistransmission that takes place in households in a high-incidence area. Lancet363, 212–214.
Vynnycky, E., Fine, P.E.M., 1997. The natural history of tuberculosis: the implica-tions of age-dependent risks of disease and the role of reinfection. Epidemiol.Infect. 119, 183–201.
Weis, S.E., Slocum, P.C., Blais, F.X., King, B., Nunn, M., Matney, G.B., Gomez, E.,Foresman, B.H., 1994. The effect of directly observed therapy on the rates ofdrug resistance and relapse in tuberculosis. N. Engl. J. Med. 330, 1179–1184.
Wigginton, J.E., Kirschner, D.E., 2001. A model to predict cell-mediated immuneregulatory mechanisms during human infection with mycobacterium tuber-culosis. J. Immunol. 166, 1951–1967.
World Health Organization, 2009. Global Tuberculosis Control: Epidemiology,Strategy, Financing. Report 2009, Technical Report, 2009.
World Health Organization, Global Tuberculosis Control, Technical Report, 2010.