modeling solidification phenomena in the...
TRANSCRIPT

6
Modeling Solidification Phenomena in the Continuous Casting of Carbon Steels
Panagiotis Sismanis SIDENOR SA
Greece
1. Introduction
In recent years the quest for advanced steel quality satisfying more stringent specifications by time has forced research in the development of advanced equipment for the improvement of the internal structure of the continuously cast steels. A relatively important role has played the better understanding of the solidification phenomena that occur during the final stages of the solidification. Dynamic soft-reduction machines have been placed in industrial practice with top-level performance. Nevertheless, the numerical solution of the governing heat-transfer differential equation under the proper initial and boundary conditions continues to play the paramount role for the fundamental approach of the whole solidification process. Steel properties are critical upon the solidification behaviour. Different chemical analyses of carbon steels alter the solidus and liquidus temperatures and therefore influence the calculated results. Shell growth, local cooling rates and solidification times, solid fraction, and secondary dendrite arm-spacing are some important metallurgical parameters that need to be ultimately computed for specific steel grades once the heat transfer problem is solved.
2. Previous work and current status
Solidification heat-transfer has been extensively studied throughout the years and there are numerous works on the subject in the academic and industrial fields. Towards the development of continuous casting machines adapted to the needs of the various steel grades a great deal of research work has been published in this metallurgical domain. In one of the early works (Mizikar, 1967), the fundamental relationships and the means of solution were described, but in a series of articles (Brimacombe, 1976) and (Brimacombe et al, 1977, 1978, 1979, 1980) some important answers to the heat transfer problem as well as to associated product internal structures and continuous-casting problems were presented in detail. The crucial knowledge-creation practice of combining experiments and models together was the main method applied to most of these works. In this way, the shell thickness at mold exit, the metallurgical length of the caster, the location down the caster where cracks initiate, and the cooling practice below the mold to avoid reheating cracks were some of the points addressed. At that time, the first finite-element thermal-stress models of solidification were applied in order to understand the internal stress distribution in the solidifying steel strand below the mold. The need for data with respect to the
www.intechopen.com

Two Phase Flow, Phase Change and Numerical Modeling
122
mechanical properties of steels and specifically creep at high temperatures as a means for controlling the continuous casting events was realized from the early years of analysis (Palmaers, 1978). In a similar study, the bulging produced by creep in the continuously cast slabs was analyzed (Grill & Schwerdtfeger, 1979) with a finite-element model. In order to simulate the unbending process in a continuous casting machine a multi-beam model was proposed (Tacke, 1985) for strand straightening in the caster. With the advent of the computer revolution more advanced topics relevant to the fluid flow in the mold were addressed. Unsteady-state turbulent phenomena in the mold were tackled using the large eddy simulation method of analysis (Sivaramakrishnan et al, 2000); in extreme cases, it was reported that the computer program could take up to a month to converge and come up with a solution. Nevertheless, computational heat-transfer programs have helped in the development of better internal structure continuously-cast steels mostly for two main reasons: [1] the online control of the casting process and, [2] the offline analysis of factors which are more intrinsic to the specific nature of a steel grade under investigation, i.e., chemical analysis and internal structure. Continuing the literature survey more focus will be given to selected published works relevant to the second [2] influential reason. The formation of internal cracks that influence the internal structure of slabs was
investigated from the early years (Fuji et al, 1976) of continuous casting. It was proven that
internal cracks are formed adjacent to the solid-liquid interface and greatly influenced by
bulging. As creep was critical upon bulging in continuously cast slabs a model was
proposed (Fujii et al, 1981) with adequate agreement between theory and practice for low
and medium carbon aluminum-killed steels. In another study (Matsumiya et al, 1984) a
mathematical analysis model was established in order to investigate the interdendritic
micro-segregation using a finite difference scheme and taking into consideration the
diffusion of a solute in the solid and liquid phases. As mechanical behavior of plain carbon
steel in the austenite temperature region was proven of paramount importance in the
continuous casting process a set of simple constitutive equations was developed (Kozlowski
et al, 1992) for the elastoplastic analysis used in finite element models. Chemical
composition of steel and specifically equivalent carbon content as well as the Mn/S ratio
were found to define a critical strain value above which internal structure problems could
appear (Hiebler et al, 1994). As analysis deepened into the internal structure and specifically
into micro- and macro-segregation, relationships between primary and secondary dendrite
arm spacing (Imagumbai, 1994) started to appear. In fact, first order analysis revealed that
secondary dendrite arm-spacing is about one-half of the primary one. The effect of cooling
rate on zero-strength-temperature (ZST) and zero-ductility-temperature (ZDT) was found to
be significant (Won et al, 1998) due to segregation of solute elements at the final stage of
solidification. The calculated temperatures at the solid fractions of 0.75 and 0.99
corresponded to the experimentally measured ZST and ZDT, respectively. Furthermore, a
set of relationships that take under consideration steel composition, cooling rate, and solid
fraction was proposed; the suggested prediction equation on ZST and ZDT was found in
relative agreement with experimental results. In a monumental work (Cabrera-Marrero et al,
1998), the dendritic microstructure of continuously-cast steel billets was analyzed and found
in agreement with experimental results. In fact, the differential equation of heat transfer was
numerically solved along the sections of the caster and local solidification times related to
microstructure for various steel compositions were computed. Based on the Clyne-Kurz
model a simple model of micro-segregation during solidification of steels was developed
www.intechopen.com

Modeling Solidification Phenomena in the Continuous Casting of Carbon Steels
123
(Won & Thomas, 2001). In this way, the secondary dendrite arm spacing can be sufficiently
computed with respect to carbon content and local cooling rates. In another study (Han et al,
2001), the formation of internal cracks in continuously cast slabs was mathematically
analyzed with the implementation of a strain analysis model together with a micro-
segregation model. The equation of heat transfer was also numerically solved along the
caster. Total strain based on bulging, unbending, and roll-misalignment attributed strains,
was computed and checked against the critical strain. Consequently, internal structure
problems could be identified and verified in practice. The unsteady bulging was found to be
(Yoon et al, 2002) the main reason of mold level hunching during thin slab casting. A finite
difference scheme for the numerical solution of the heat transfer equation together with a
continuous beam model and a primary creep equation were developed in order to match
experimental data. A 2D unsteady heat-transfer model (Zhu et al, 2003) was applied to
obtain the surface temperature and shell thickness of continuous casting slabs during the
process of solidification. Roll misalignment was proven to provoke internal cracks once total
strain at the solid/liquid interface exceeded the critical strain for the examined chemical
composition of steel slabs. As creep was proven to be important in the continuous casting of
steels, an evaluation of common constitutive equations was performed (Pierer at al, 2005)
and tested against experimental data. The proposed results could help in the development
of more sophisticated 2D finite element models. Once offline computer models are proven
correct they can be applied online in real-time applications and minimize internal defects
(Ma et al, 2008).
Consequently, very advanced types of continuous casting machines have appeared in the
international market as a result of these investigations. Different steel grades are classified
into groups which are processed in the continuous casters as heats cast with similar design
and operating parameters. Automation plays an important role supervising the whole
continuous casting process by running in two levels, i.e., controlling the process, and
computing the final solidification front as a real-time solution to the heat-transfer problem
case. The numerous steel products of excellent quality manifest the success of these
sophisticated casting machines.
3. Present work
In this work the modelling of the solidification phenomena for two slab casters installed in
different plants, one in Stomana, Pernik, Bulgaria, and the other in Sovel, Almyros, Greece,
is presented. Both plants belong to the SIDENOR group of companies. Simple design and
operating parameters together with the chemical analyses of the steel grades cast are the
basic data to approximate the heat transfer solution, compute the temperature distributions
inside the continuously cast slabs in every section of the caster, and investigate the
solidification phenomena from the metallurgical point of view. A 3D numerical solution of
the differential equation of heat transfer was developed and tested in a previous publication
(Sismanis, 2010) and is not to be presented in detail here. Some routines were also
implemented in the main core of that developed software in order to cover the extra
computational work required for the metallurgical analysis of the solidification phenomena.
Furthermore, strain analysis for any slab bulging and for the straightening positions was
implemented as well. The methodology applied for tackling the continuous casting
problem for different carbon steel grades from the metallurgical point of view is maybe
www.intechopen.com

Two Phase Flow, Phase Change and Numerical Modeling
124
what makes this purely computational study more intriguing and specific in nature. Critical
formulas that bind the heat transfer problem with the various solidification parameters and
strains in the slab are presented and discussed.
3.1 The heat transfer model applied
The general 3D heat transfer equation that describes the temperature distribution inside the
solidifying body is given by the following equation (Carslaw & Jaeger, 1986) and (Incropera
& DeWitt, 1981):
P
TC k T S
tρ
∂= ∇ ⋅ ∇ +
∂ (1)
The source term S, in units W· m-3, may be considered (Patankar, 1980) to be of the form:
C PS S S T= + ⋅ (2)
that is, by a constant term and a temperature dependent term and can be related to
correspond to the latent heat of phase change. Furthermore, T is the temperature, and ρ, Cp,
and k are the density, heat capacity, and thermal conductivity of steel, respectively. The heat
transfer equation in Cartesian coordinates may be written as:
p
T T T TC k k k S
t x x y y z zρ
∂ ∂ ∂ ∂ ∂ ∂ ∂ = + + +
∂ ∂ ∂ ∂ ∂ ∂ ∂ (3)
The solidification problem in the continuous casting may be considered as such of studying
the advance of the solidification front by means of mathematical solution of the global heat
transfer involved in the specific geometry, and the local heat transfer in the mushy zone. In
the present study, the heat conduction along the casting direction is considered to be
negligible. So, (3) can be written as:
P
T T TC k k S
t x x y yρ
∂ ∂ ∂ ∂ ∂ = + +
∂ ∂ ∂ ∂ ∂ (4)
The boundary conditions applied in order to solve (4) are as follows: Heat flux in the mold is equalized to the empirical equation used by other researchers (Lait
et al, 1974),
m dq t6 52.67 10 2.21 10= × − × (5)
The mold heat-flux (qm) is given in W/m2, and td (in seconds) is the dwell time of the strand
inside the mold. Involving an expression for the local heat-transfer coefficient inside the
mold (Yoon et al, 2002) a more realistic formula was derived that exhibited good results in
the present study:
m mh z q31.35 10 (1 0.8 )−= ⋅ ⋅ − ⋅ (6)
The heat fluxes due to water spraying and radiation of the strand in the secondary cooling zones were calculated using the following expressions:
www.intechopen.com

Modeling Solidification Phenomena in the Continuous Casting of Carbon Steels
125
( )s s w q h T T 0= ⋅ − (7)
( ) envr r env r
env
T Tq h T T with h
T T
4 4
σε−
= ⋅ − = ⋅−
(8)
( )c c envq h T T= ⋅ − (9)
where hs, hr, and hc are the heat transfer coefficients for spray cooling, radiation, and
convection, respectively, Tw0 is the water temperature, Tenv is the ambient temperature, σ is
the Stefan-Boltzmann constant, and ┝ is the steel emissivity (equal to 0.8 in the present
study). Natural convection was assumed to prevail at the convection heat transfer as
stagnant air-flow conditions were considered due to the low casting speeds of the strand
applied in practice. The strand was assumed to be a long horizontal cylinder with an
equivalent diameter of a circle having the same area with that of the strand cross-sectional
area, and a correlation valid for a wide Rayleigh number range proposed by (Churchill &
Chu, 1975) was applied, written in the form proposed by (Burmeister, 1983):
D DNu B B Ra B < )
16/99/16
1/6 5 130.5590.60 0.387 1 (10 10
Pr−
= + = + < (10)
where Nu, Ra, and Pr are the dimensionless Nusselt, Rayleigh, and Prandtl numbers, respectively. In this way, hc is calculated by means of the NuD number. It is worth mentioning, however, that the radiation effects are more pronounced than the convection ones in the continuous casting of steels. From various expressions proposed in the literature for the heat transfer coefficient in water-spray cooling systems the following formula was applied as approaching the present casting conditions:
ws
Th W 0.55 01 0.0075
15704
−= ⋅ ⋅ (11)
where W is the water flux for any secondary spray zone in liters/m2/sec, and hs is in
W/m2/K. At any point along the secondary zones (starting just below the mold) of the
caster the total flux qtot is computed according to the following formula, taking into account
that qs may be zero at areas where no sprays are applied:
tot s rq q q q= + + (12)
In mathematical terms, considering a one-fourth of the cross-section of a slab assuming
perfect symmetry, the aforementioned boundary conditions can be written as:
m x y m
tot x y m
q at x W , y W 0 z L Tk
x q at x W , y W z L
0 ,
0 ,
= ≤ ≤ ≤ ≤∂ − =
∂ = ≤ ≤ > (13)
m y x m
tot y x m
q at y W x W z L Tk
y q at y W x W z L
, 0 , 0
, 0 ,
= ≤ ≤ ≤ ≤∂ − =
∂ = ≤ ≤ > (14)
www.intechopen.com
Two Phase Flow, Phase Change and Numerical Modeling
126
where z follows the casting direction starting from the meniscus level inside the mold;
consequently, the mold has an active length of Lm. Wx and Wy are the half-width and the
half-thickness of the cast product, respectively. Due to symmetry, the heat fluxes at the
central planes are considered to be zero:
y
Tk at x y W , z
x0 0, 0 0
∂− = = ≤ ≤ ≥
∂ (15)
x
Tk at y x W z
y0 0, 0 , 0
∂− = = ≤ ≤ ≥
∂ (16)
Finally, the initial temperature of the pouring liquid steel is supposed to be the temperature
of liquid steel in the tundish:
x y
T T t z x W y W0 at 0 (and 0), 0 , 0 = = = < < < < (17)
The thermo-physical properties of carbon steels were obtained from the published work of
(Cabrera-Marrero et al, 1998); the properties were given as functions of carbon content for
the liquid, mushy, solid, and transformation temperature domain values. The liquidus and
solidus temperatures were obtained from the work of (Thomas et al, 1987):
LT C Si Mn P S
Ni Cr Cu Mo V Ti
1537 88(% ) 8(% ) 5(% ) 30(% ) 25(% )
4(% ) 1.5(% ) 5(% ) 2(% ) 2(% ) 18(% )
= − − − − −
− − − − − − (18)
ST C Si Mn P S
Ni Cr Al
1535 200(% ) 12.3(% ) 6.8(% ) 124.5(% ) 183.9(% )
4.3(% ) 1.4(% ) 4.1(% )
= − − − − −
− − − (19)
At any time step the simulating program computes whether a given nodal point is at a
lower or higher temperature than the liquidus or solidus temperatures for a given steel
composition. Consequently, the instantaneous position of the solidification front is derived,
and therefore, in the solidification direction the last solidified nodal point at the solidus
temperature.
3.1.1 Strain analysis computations
Bulging strain ┝B was computed based on the analysis by (Fujii et al, 1976) in which primary
creep was taken under consideration. Equations (20) through (27) contain the necessary
formulas used in these computations:
B B PS 21600 /ε δ= ⋅ ⋅ (20)
B P P P Ct S and t u3/ /δ β= = (21)
P PA2 45 012(1 )β ν σ α= − ⋅ ⋅ ⋅ ⋅ (22)
( )
( ) ( ){ } x
P
W and =5 5
22 cosh tanh 2
cosh
πα ψ ψ ψ ψ
π ψ= − −
(23)
www.intechopen.com
Modeling Solidification Phenomena in the Continuous Casting of Carbon Steels
127
Some important parameters are included in the expressions: ℓP is the roll pitch in the part of the caster under consideration, uC is the casting speed, tP is time in seconds, S is the thickness of the solidified shell at the point of analysis along the caster, and ν is the Poisson ratio for steel which is related to steel according to the following relationship (Uehara et al, 1986):
( )P P S SurfT and T T T5 10.278 8.23 10
2ν −= + × ⋅ = + (24)
The TP value (in ºC) is taken as the average value between the solidus and the surface temperature of the slab. Primary creep data were taken from the work of (Palmaers, 1978) and applied with good results mostly for low and medium carbon steel slabs produced at Sovel. Table 1 presents the data used. Equation (25) illustrates the expression used for the calculation of the primary creep strain and σP (in MPa) resembles the ferro-static pressure (26) at a point along the caster which has a distance H5 measured along the vertical axis from the meniscus level; it is clarified that the maximum value of H5 can be around the caster radius (27).
n m CC P P
QA t
RT0 exp( )ε σ= ⋅ ⋅ ⋅ − (25)
P gH5σ ρ= (26)
CH R5,max = (27)
For the steel slabs produced at Stomana, the constitutive equations for model II (Kozlowski et al, 1992) were applied after integration (T in Kelvin=TP+273.16):
n mP C K P PC Q T t,exp( / )ε σ= ⋅ − ⋅ ⋅ (28)
where, QC,K = 17160 and:
C C C 20.3091 0.2090 (% ) 0.1773 (% )= + ⋅ + ⋅ (29)
n T T3 6 26.365 4.521 10 1.439 10− −= − ⋅ ⋅ + ⋅ ⋅ (30)
m T T4 8 21.362 5.761 10 1.982 10− −= − + ⋅ ⋅ + ⋅ ⋅ (31)
So, after appropriate integration of the strain rate (28), the following expression was applied for the primary creep that exhibited better results than the correlations of (Palmaers, 1978) specifically for the Stomana slabs, probably due to their much larger size compared to the size of the slabs produced at Sovel:
( ) n mP C K PC m Q T t 1
,/( 1) exp( / )ε σ += + ⋅ − ⋅ ⋅ (32)
The unbending strain was computed according to equation (33) where Rn-1, Rn are the unbending radii of the caster, (Uehara et al, 1986) and (Zhu et al, 2003).
S y
n n
W SR R1
1 1100 ( )ε
−
= ⋅ − ⋅ − (33)
www.intechopen.com

Two Phase Flow, Phase Change and Numerical Modeling
128
Any caster misalignment of value ├M can be computed according to (34), as described in the works of (Han et al, 2001) and (Zhu et al, 2003):
M M PS 2300 /ε δ= ⋅ ⋅ (34)
The total strain ┝tot that a slab may undergo at a specific point along the caster is the sum of all the aforementioned strains:
tot B S Mε ε ε ε= + + (35)
The total strain should never exceed the value for the critical strain ┝Cr which is a function of the carbon equivalent value (36) and the Mn/S ratio, as this could cause internal cracks during casting (Hiebler et al, 1994). It should be pointed out that low carbon steels with high Mn/S (>25) ratios are the least prone for cracking during casting.
eq C C C Mn Ni Si Cr Mo, (% ) 0.02(% ) 0.04(% ) 0.1(% ) 0.04(% ) 0.1(% )= + + − − − (36)
%Carbon Temperature range, ºC
A0 m n QC (kJ/mol)
0.090 (low carbon) < 1000 0.349 0.35 3.1 150.6
0.090 (low carbon) 1000-1250 2.422 0.33 2.5 146.4
0.090 (low carbon) > 1250 6.240 0.21 1.6 123.4
0.185 (medium carbon) < 1000 141.1 0.36 3.1 211.3
0.185 (medium carbon) 1000-1250 1.825 0.37 2.5 144.3
0.185 (medium carbon) > 1250 1.342 0.25 1.5 102.5
Table 1. Data used for primary creep
3.1.2 Solid fraction analysis
The solid fraction values fS are very important especially at the final stages of solidification in which soft reduction is applied in many slab casters in an attempt to reduce or minimize any internal segregation problems. The following expressions extracted from the work of (Won et al, 1998) were used:
( )( )S
jj
Tf
f C
1 1536 1 21 2 1 and
1
κκ
κ
Λ
−
− − Ω = − Ω − Λ =
−′ (37)
( )jj
f C C Si Mn P S 67.51(% ) 9.741(% ) 3.292(% ) 82.18(% ) 155.8(% )′ = + + + + (38)
1
(1 exp( 1 / )) exp( 1 /(2 ))2
α α αΩ = − − − − (39)
www.intechopen.com

Modeling Solidification Phenomena in the Continuous Casting of Carbon Steels
129
RC 0.24433.7α −= ⋅ (40)
L L/ /0.265 and =( ) / 2δ γκ κ κ κ= + (41)
As described by equations (37) through (41), considering an average equilibrium partition
coefficient ┢=0.265 for carbon at the delta/liquid and gamma/liquid phase transformations,
respectively, and a local cooling rate CR, solid fraction values can be computed as a function
of mushy-zone temperatures and specific chemical analysis of steel. Dendrites are
characterized by means of the primary ┣PRIM and secondary ┣SDAS dendritic arm spacing. The
dependence of both ┣PRIM and ┣SDAS spacing on the chemical composition and solidification
conditions is needed for a correct microstructure prediction whose results can be employed
for micro- and macro-segregation appraisal. Primary dendrite arm spacing is related to the
solidification rate r and thermal gradient G in the mushy zone according to the following
formula (Cabrera-Marrero et al, 1998):
PRIM rgn r G1 1
4 2λ− −
= ⋅ ⋅ (42)
Solidification rate r is actually the rate of shell growth:
dS
rdt
= (43)
and the thermal gradient G is defined as:
L ST TG
w
( )−= (44)
where w is the width of the mushy zone. It is interesting to note that local solidification
times TF are related to the local cooling rates with the expressions:
L S L S L SF
R
T T T T T TT
dSC rGG
dt
− − −= = =
(45)
Furthermore, ┣SDAS is an important parameter as it plays a great role in the development of
micro-segregation towards the final stage of solidification. For this reason it has received
more attention than ┣PRIM. Consequently, recalling the work of (Won & Thomas, 2001)
secondary dendrite arm spacing ┣SDAS (in μm) was computed using the following equation:
R
SDAS CR
C C C
C C C
0.4935
(0.5501 1.996 (% ))0.3616
(169.1 720.9 (% )) for 0 (% ) 0.15
143.9 (% ) for (% ) 0.15λ
−
− ⋅−
− ⋅ ⋅ < ≤=
⋅ ⋅ > (46)
4. Results and discussion
For the Stomana slab caster that normally casts slab sizes of 220x1500 mm x mm two
chemical analyses for steel were examined depending on the selected carbon concentrations,
as presented on Table 2.
www.intechopen.com

Two Phase Flow, Phase Change and Numerical Modeling
130
%C %Si %Mn %P %S %Cu %Ni %Cr %Al Tliq(°C) Tsol(°C)
0.100 0.30 1.20 0.025 0.015 0.35 0.30 0.10 0.03 1515 1495
0.185 0.30 1.20 0.025 0.015 0.35 0.30 0.10 0.03 1508 1479
Table 2. Steel chemical analyses examined for Stomana
Fig. 1. Temperature distribution in sections of a 220 x 1500 mm x mm Stomana slab, at 5.1 m for part (a) and 10 m for part (b) from the meniscus, respectively. %C = 0.10; casting speed: 0.80 m/min; SPH: 20 K; solidus temperature = 1495ºC; (all temperatures in the graph are in ºC)
In addition to this, two levels for superheat SPH (=Tcast-TL) were selected at the values of 20K and 40K. Two levels for the casting speed uc were also examined at the 0.6 and 0.8 m/min. Fig. 1 presents the temperature distribution till solidus temperature inside a slab at two different positions in the caster; parts (a) and (b) show results at about 5.1 m and 10.0 m from the meniscus level in the mold, respectively. The dramatic progress of the solidification front is illustrated. The following casting parameters were selected in this case: %C=0.10, SPH= 20K, and uc = 0.8 m/min. It is interesting to note that the shell grows faster along the direction of the smaller size, i.e., the thickness than the width of the slab. Fig. 2 presents some more typical results for the same case. The temperature in the centre is presented by line 1, and the temperature at the surface of the slab is presented by line 2. The shell thickness S and the distance between liquidus and solidus w are presented by dotted lines 3 and 4, respectively. In part (b) of Fig. 2 the rate of shell growth (dS/dt), the cooling rate (CR), and the solid fraction (fS) in the final stages of solidification are presented. Finally, in part (c) the local solidification time TF, and secondary dendrite arm spacing ┣SDAS are also presented. It is interesting to note that the rate of shell growth is almost constant for the major part of solidification. Computation results show that solid fraction seems to significantly increase towards solidification completion. Apart from unclear fluid-flow phenomena that may adversely affect the uniform development of dendrites in the final stages of solidification
www.intechopen.com

Modeling Solidification Phenomena in the Continuous Casting of Carbon Steels
131
and influence the local solid-fraction values, the shape of the fS curve at the values of fS above 0.8 seem to be influenced by the selected set of equations (37)-(41). Fig. 3 depicts computed strain results along the caster.
Fig. 2. Results with respect to distance from the meniscus: In part (a), lines (1) and (2) illustrate the centreline and surface temperatures of a 220 x 1500 mm x mm Stomana slab; lines (3) and (4) depict the shell thickness and the distance between the solidus and liquidus temperatures; in part (b), the solid fraction fS, the local cooling-rate CR, and the rate of shell growth dS/dt are presented; in part (c), the local solidification time and secondary dendrite arm spacing are depicted, as well. Casting conditions: %C = 0.10; casting speed: 0.80 m/min; SPH: 20 K; solidus temperature = 1495ºC; (all temperatures in the graph are in ºC)
In part (a) of Fig. 3 line 1 depicts the bulging strain along the caster with the aforementioned
formulation. Left-hand-side (LHS) axis is used to present the bulging strain which is also
presented by dashed line 2 with the means of another formulation (Han et al, 2001) which is
presented by the following equations:
P PB P
e
tE S
4
,2 332
σδ =
(47)
where most parameters were defined in the appropriate section and Ee is an equivalent
elastic modulus that was calculated using the following equation:
S Pe
S
T TE
T410 in MPa
100
−= ×
− (48)
www.intechopen.com

Two Phase Flow, Phase Change and Numerical Modeling
132
Consequently, the bulging strain is computed by equation (20) in which ├B is substituted by
├B,2. It seems that the computed results in the latter case are much higher than the ones
computed with the generally applied method as described in 3.1.1. Furthermore, the
recently presented formulation (47)-(48) was proven to be of limited applicability in most
cases for the Sovel slab caster and in some cases in the Stomana caster as it gave rise to
extremely high values for the bulging strain. Coming back to Fig. 3, the right-hand-side
(RHS) axis in part (a) presents the misalignment and unbending strains in a smaller scale. In
order to emphasize the misalignment effect upon the strain two different values, 0.5 mm
and 1.0 mm of rolls misalignment were chosen at two positions, about 8.9 m and 13.4 m,
respectively, along the caster. In this way, these values are depicted by lines 3 and 4 in part
(a) of Fig. 3. The caster radius is 10.0 m while two unbending points with radii 18.0 m and
30.0 m at the 13.5 m and 18.0 m positions along the caster were selected in order to simulate
the straightening process. Line 8 in part (a) of Fig. 3 actually presents the strain from the first
unbending point. The LHS axis in part (b) of Fig. 3 represents the total strains as computed
by the two methods for bulging strain and illustrated by lines 5 and 6. In this case, the total
strain is less than the critical strain (as measured on the RHS axis and illustrated by straight
line 7) throughout the caster.
Fig. 3. In part (a), bulging strain (LHS axis), and misalignment and unbending strains (RHS axis) are illustrated. Bulging strain is depicted by two lines (1) and (2) depending on the applied formulation: line (1) is based on the formulation presented in section 3.1.1, and line (2) is based on the formulation described by equations (47) & (48). Lines (3) and (4) depict the strains resulting from 0.5 mm and 1.0 mm rolls-misalignment, respectively. Line (8) shows the strain from unbending at this position of the caster. In a similar manner, the total strains (LHS axis) are presented in part (b); the critical strain (RHS axis) is also, included. Casting conditions: 220 x 1500 mm x mm Stomana slab;%C = 0.10; casting speed: 0.80 m/min; SPH: 20 K; solidus temperature = 1495ºC
www.intechopen.com

Modeling Solidification Phenomena in the Continuous Casting of Carbon Steels
133
Fig. 4. Temperature distribution in sections of a 220 x 1500 mm x mm Stomana slab, at 8.0 m for part (a) and 16 m for part (b) from the meniscus, respectively. %C = 0.185; casting speed: 0.80 m/min; SPH: 20 K; solidus temperature = 1479ºC; (all temperatures in the graph are in ºC)
Fig. 5. Results with respect to distance from the meniscus: In part (a), lines (1) and (2) illustrate the centreline and surface temperatures of a 220 x 1500 mm x mm Stomana slab; lines (3) and (4) depict the shell thickness and the distance between the solidus and liquidus temperatures; in part (b), the solid fraction fS, the local cooling-rate CR, and the rate of shell growth dS/dt are presented; in part (c), the local solidification time and secondary dendrite arm spacing are depicted, as well. Casting conditions: %C = 0.185; casting speed: 0.80 m/min; SPH: 20 K; solidus temperature = 1479ºC; (all temperatures in the graph are in ºC)
www.intechopen.com

Two Phase Flow, Phase Change and Numerical Modeling
134
Fig. 4 presents the temperature distribution till solidus temperature inside a slab at two different positions in the caster; parts (a) and (b) show results at about 8.0 m and 16.0 m from the meniscus level in the mold, respectively. The following casting parameters were selected in this case: %C=0.185, SPH= 20K, and uc = 0.8 m/min. It is interesting to note that the shell grows faster along the direction of the smaller size, i.e., the thickness than the width of the slab. Fig. 5 presents some more typical results for the same case. The temperature in the centre is presented by line 1, and the temperature at the surface of the slab is presented by line 2. The shell thickness S and the distance between liquidus and solidus w are presented by dotted lines 3 and 4, respectively. In part (b) of Fig. 2 the rate of shell growth (dS/dt), the cooling rate (CR), and the solid fraction (fS) in the final stages of solidification are presented. Finally, in part (c) the local solidification time TF, and secondary dendrite arm spacing ┣SDAS are also presented. It is interesting to note that the rate of shell growth is almost constant for the major part of solidification. In part (a) of Fig. 6 line 1 depicts the bulging strain along the caster with the aforementioned formulation. LHS axis is used to present the bulging strain, while the RHS axis in part (a) presents the misalignment and unbending strains in a smaller scale. The strains due to the applied misalignment values are depicted by lines 2 and 3 in part (a) of Fig. 6. Line 4 presents the strain from the first unbending point. The LHS axis in part (b) of Fig. 6 represents the total strain and is illustrated by line 5. In this case, the total strain is less than the critical strain (as measured on the RHS axis and illustrated by straight line 6) throughout the caster.
Fig. 6. In part (a), bulging strain (LHS axis), and misalignment and unbending strains (RHS axis) are illustrated. Bulging strain is depicted by line (1); lines (2) and (3) depict the strains resulting from 0.5 mm and 1.0 mm rolls-misalignment, respectively; line (4) shows the strain from unbending at this position of the caster. In a similar manner, the total strain (LHS axis) is presented in part (b); the critical strain (RHS axis) is also, included. Casting conditions: 220 x 1500 mm x mm Stomana slab; %C = 0.185; casting speed: 0.80 m/min; SPH: 20 K; solidus temperature = 1479ºC
www.intechopen.com

Modeling Solidification Phenomena in the Continuous Casting of Carbon Steels
135
Fig. 7 presents the temperature distribution till solidus temperature inside a slab at two different positions in the caster; parts (a) and (b) show results at about 9.3 m and 20.0 m from the meniscus level in the mold, respectively. The following casting parameters were selected in this case: %C=0.185, SPH=40K, and uc = 0.8 m/min. It is interesting to note that the shell grows faster along the direction of the smaller size, i.e., the thickness than the width of the slab. Fig. 8 presents some more typical results for the same case. The temperature in the centre is presented by line 1, and the temperature at the surface of the slab is presented by line 2. The shell thickness S and the distance between liquidus and solidus w are presented by dotted lines 3 and 4, respectively. In part (b) of Fig. 2 the rate of shell growth (dS/dt), the cooling rate (CR), and the solid fraction (fS) in the final stages of solidification are presented. Finally, in part (c) the local solidification time TF, and secondary dendrite arm spacing ┣SDAS are also presented. It is interesting to note that the rate of shell growth is almost constant for the major part of solidification.
Fig. 7. Temperature distribution in sections of a 220 x 1500 mm x mm Stomana slab, at 9.3 m for part (a) and 20 m for part (b) from the meniscus, respectively. %C = 0.185; casting speed: 0.80 m/min; SPH: 40 K; solidus temperature = 1479ºC; (all temperatures in the graph are in ºC)
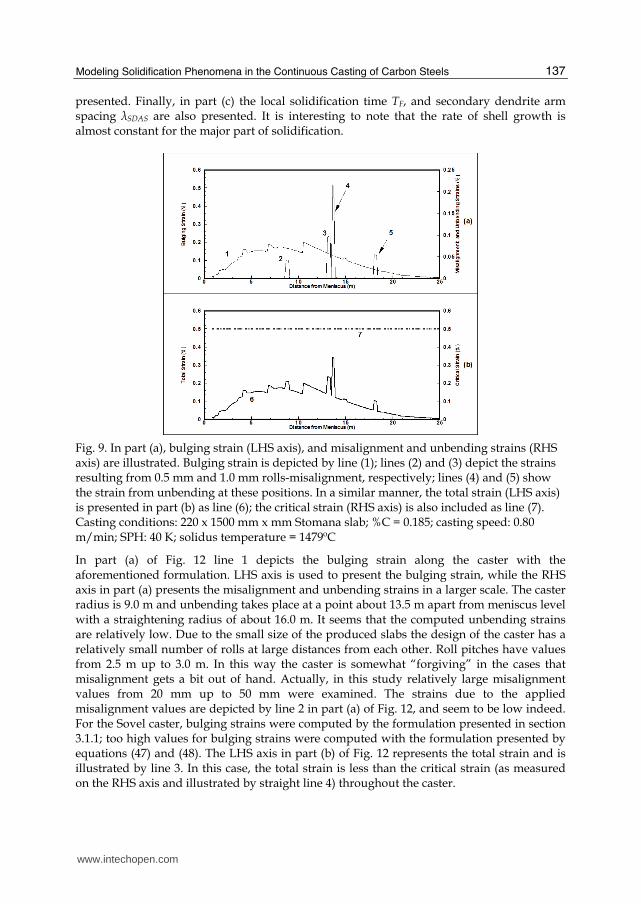
In part (a) of Fig. 9 line 1 depicts the bulging strain along the caster with the aforementioned formulation. LHS axis is used to present the bulging strain, while the RHS axis in part (a) presents the misalignment and unbending strains in a smaller scale. The strains due to the applied misalignment values are depicted by lines 2 and 3 in part (a) of Fig. 9. Line 4 presents the strain from the first unbending point, while line 5 presents the strain from the second unbending point. The LHS axis in part (b) of Fig. 9 represents the total strain and is illustrated by line 6. In this case, the total strain is less than the critical strain (as measured on the RHS axis and illustrated by straight line 7) throughout the caster. For the Sovel slab caster that normally casts slab sizes of 130x390 and 130x360 (mm x mm) two chemical analyses for steel were examined depending on the selected carbon
www.intechopen.com

Two Phase Flow, Phase Change and Numerical Modeling
136
concentrations, as presented on Table 3. For the cases presented in this study only the slab size of 130x390 was examined.
%C %Si %Mn %P %S %Cu %Ni %Cr %V %Al Tliq(°C) Tsol(°C)
0.100 0.25 1.20 0.025 0.010 0.28 0.30 0.10 0.05 0.04 1516 1497
0.165 0.25 1.20 0.025 0.010 0.28 0.30 0.10 0.05 0.04 1511 1484
Table 3. Steel chemical analyses examined for Sovel
Fig. 8. Results with respect to distance from the meniscus: In part (a), lines (1) and (2) illustrate the centreline and surface temperatures of a 220 x 1500 mm x mm Stomana slab; lines (3) and (4) depict the shell thickness and the distance between the solidus and liquidus temperatures; in part (b), the solid fraction fS, the local cooling-rate CR, and the rate of shell growth dS/dt are presented; in part (c), the local solidification time and secondary dendrite arm spacing are depicted, as well. Casting conditions: %C = 0.185; casting speed: 0.80 m/min; SPH: 40 K; solidus temperature = 1479ºC; (all temperatures in the graph are in ºC)
Fig. 10 presents the temperature distribution till solidus temperature inside a slab at two different positions in the caster; parts (a) and (b) show results at about 3.3 m and 6.0 m from the meniscus level in the mold, respectively. The following casting parameters were selected in this case: %C=0.10, SPH= 20K, and uc = 1.1 m/min. It is interesting to note that the shell grows faster along the direction of the smaller size, i.e., the thickness than the width of the slab. Fig. 11 presents some more typical results for the same case. The temperature in the centre is presented by line 1, and the temperature at the surface of the slab is presented by line 2. The shell thickness S and the distance between liquidus and solidus w are presented by dotted lines 3 and 4, respectively. In part (b) of Fig. 11 the rate of shell growth (dS/dt), the cooling rate (CR), and the solid fraction (fS) in the final stages of solidification are
www.intechopen.com
Modeling Solidification Phenomena in the Continuous Casting of Carbon Steels
137
presented. Finally, in part (c) the local solidification time TF, and secondary dendrite arm spacing ┣SDAS are also presented. It is interesting to note that the rate of shell growth is almost constant for the major part of solidification.
Fig. 9. In part (a), bulging strain (LHS axis), and misalignment and unbending strains (RHS axis) are illustrated. Bulging strain is depicted by line (1); lines (2) and (3) depict the strains resulting from 0.5 mm and 1.0 mm rolls-misalignment, respectively; lines (4) and (5) show the strain from unbending at these positions. In a similar manner, the total strain (LHS axis) is presented in part (b) as line (6); the critical strain (RHS axis) is also included as line (7). Casting conditions: 220 x 1500 mm x mm Stomana slab; %C = 0.185; casting speed: 0.80 m/min; SPH: 40 K; solidus temperature = 1479ºC
In part (a) of Fig. 12 line 1 depicts the bulging strain along the caster with the aforementioned formulation. LHS axis is used to present the bulging strain, while the RHS axis in part (a) presents the misalignment and unbending strains in a larger scale. The caster radius is 9.0 m and unbending takes place at a point about 13.5 m apart from meniscus level with a straightening radius of about 16.0 m. It seems that the computed unbending strains are relatively low. Due to the small size of the produced slabs the design of the caster has a relatively small number of rolls at large distances from each other. Roll pitches have values from 2.5 m up to 3.0 m. In this way the caster is somewhat “forgiving” in the cases that misalignment gets a bit out of hand. Actually, in this study relatively large misalignment values from 20 mm up to 50 mm were examined. The strains due to the applied misalignment values are depicted by line 2 in part (a) of Fig. 12, and seem to be low indeed. For the Sovel caster, bulging strains were computed by the formulation presented in section 3.1.1; too high values for bulging strains were computed with the formulation presented by equations (47) and (48). The LHS axis in part (b) of Fig. 12 represents the total strain and is illustrated by line 3. In this case, the total strain is less than the critical strain (as measured on the RHS axis and illustrated by straight line 4) throughout the caster.
www.intechopen.com

Two Phase Flow, Phase Change and Numerical Modeling
138
Fig. 10. Temperature distribution in sections of a 130 x 390 mm x mm Sovel slab, at 3.3 m for part (a) and 6.0 m for part (b) from the meniscus, respectively. %C = 0.10; casting speed: 1.1 m/min; SPH: 20 K; solidus temperature = 1497ºC; (all temperatures in the graph are in ºC)
Fig. 11. Results with respect to distance from the meniscus: In part (a), lines (1) and (2) illustrate the centreline and surface temperatures of a 130 x 390 mm x mm Sovel slab; lines (3) and (4) depict the shell thickness and the distance between the solidus and liquidus temperatures; in part (b), the solid fraction fS, the local cooling-rate CR, and the rate of shell growth dS/dt are presented; in part (c), the local solidification time and secondary dendrite arm spacing are depicted, as well. Casting conditions: %C = 0.10; casting speed: 1.1 m/min; SPH: 20 K; solidus temperature = 1497ºC; (all temperatures in the graph are in ºC)
www.intechopen.com

Modeling Solidification Phenomena in the Continuous Casting of Carbon Steels
139
Fig. 12. In part (a), bulging strain (LHS axis), and misalignment and unbending strains (RHS axis) are illustrated by lines (1) and (2), respectively. In a similar manner, the total strain (LHS axis) is presented in part (b) as line (3); the critical strain (RHS axis) is also included as line (4). Casting conditions: 130 x 390 mm x mm Sovel slab; %C = 0.10; casting speed: 1.1 m/min; SPH: 20 K; solidus temperature = 1497ºC
Fig. 13. Temperature distribution in sections of a 130 x 390 mm x mm Sovel slab, at 4.0 m for part (a) and 7.7 m for part (b) from the meniscus, respectively. %C = 0.165; casting speed: 1.1 m/min; SPH: 20 K; solidus temperature = 1484ºC; (all temperatures in the graph are in ºC)
www.intechopen.com

Two Phase Flow, Phase Change and Numerical Modeling
140
Fig. 13 presents the temperature distribution till solidus temperature inside a slab at two different positions in the caster; parts (a) and (b) show results at about 4.0 m and 7.7 m from the meniscus level in the mold, respectively. The following casting parameters were selected in this case: %C=0.165, SPH= 20K, and uc = 1.1 m/min. It is interesting to note that the shell grows faster along the direction of the smaller size, i.e., the thickness than the width of the slab. Fig. 14 presents some more typical results for the same case. The temperature in the centre is presented by line 1, and the temperature at the surface of the slab is presented by line 2. The shell thickness S and the distance between liquidus and solidus w are presented by dotted lines 3 and 4, respectively. In part (b) of Fig. 14 the rate of shell growth (dS/dt), the cooling rate (CR), and the solid fraction (fS) in the final stages of solidification are presented. Finally, in part (c) the local solidification time TF, and secondary dendrite arm spacing ┣SDAS are also presented. It is interesting to note that the rate of shell growth is almost constant for the major part of solidification.
Fig. 14. Results with respect to distance from the meniscus: In part (a), lines (1) and (2) illustrate the centreline and surface temperatures of a 130 x 390 mm x mm Sovel slab; lines (3) and (4) depict the shell thickness and the distance between the solidus and liquidus temperatures; in part (b), the solid fraction fS, the local cooling-rate CR, and the rate of shell growth dS/dt are presented; in part (c), the local solidification time and secondary dendrite arm spacing are depicted, as well. Casting conditions: %C = 0.165; casting speed: 1.1 m/min; SPH: 20 K; solidus temperature = 1484ºC; (all temperatures in the graph are in ºC)
In part (a) of Fig. 15, line 1 depicts the bulging strain along the caster with the aforementioned formulation. LHS axis is used to present the bulging strain, while the RHS axis in part (a) presents the misalignment and unbending strains in the same scale. The strains due to the applied misalignment values are depicted by line 2 in part (a) of Fig. 15, and seem to be low indeed. The LHS axis in part (b) of Fig. 15 represents the total strain and is illustrated by line 3. In this case, the total strain is less than the critical strain (as measured on the RHS axis and illustrated by straight line 4) throughout the caster.
www.intechopen.com

Modeling Solidification Phenomena in the Continuous Casting of Carbon Steels
141
Fig. 15. In part (a), bulging strain (LHS axis), and misalignment and unbending strains (RHS axis) are illustrated by lines (1) and (2), respectively. In a similar manner, the total strain (LHS axis) is presented in part (b) as line (3); the critical strain (RHS axis) is also included as line (4). Casting conditions: 130 x 390 mm x mm Sovel slab; %C = 0.165; casting speed: 1.1 m/min; SPH: 20 K; solidus temperature = 1484ºC
Fig. 16. Temperature distribution in sections of a 130 x 390 mm x mm Sovel slab, at 7.3 m for part (a) and 9.5 m for part (b) from the meniscus, respectively. %C = 0.165; casting speed: 1.1 m/min; SPH: 40 K; solidus temperature = 1484ºC; (all temperatures in the graph are in ºC)
www.intechopen.com
Two Phase Flow, Phase Change and Numerical Modeling
142
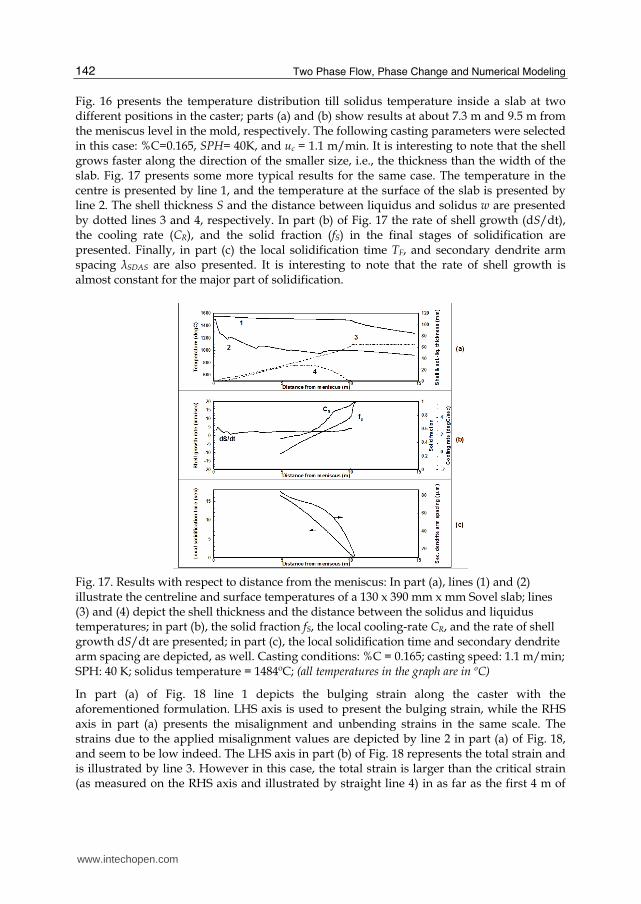
Fig. 16 presents the temperature distribution till solidus temperature inside a slab at two different positions in the caster; parts (a) and (b) show results at about 7.3 m and 9.5 m from the meniscus level in the mold, respectively. The following casting parameters were selected in this case: %C=0.165, SPH= 40K, and uc = 1.1 m/min. It is interesting to note that the shell grows faster along the direction of the smaller size, i.e., the thickness than the width of the slab. Fig. 17 presents some more typical results for the same case. The temperature in the centre is presented by line 1, and the temperature at the surface of the slab is presented by line 2. The shell thickness S and the distance between liquidus and solidus w are presented by dotted lines 3 and 4, respectively. In part (b) of Fig. 17 the rate of shell growth (dS/dt), the cooling rate (CR), and the solid fraction (fS) in the final stages of solidification are presented. Finally, in part (c) the local solidification time TF, and secondary dendrite arm spacing ┣SDAS are also presented. It is interesting to note that the rate of shell growth is almost constant for the major part of solidification.
Fig. 17. Results with respect to distance from the meniscus: In part (a), lines (1) and (2) illustrate the centreline and surface temperatures of a 130 x 390 mm x mm Sovel slab; lines (3) and (4) depict the shell thickness and the distance between the solidus and liquidus temperatures; in part (b), the solid fraction fS, the local cooling-rate CR, and the rate of shell growth dS/dt are presented; in part (c), the local solidification time and secondary dendrite arm spacing are depicted, as well. Casting conditions: %C = 0.165; casting speed: 1.1 m/min; SPH: 40 K; solidus temperature = 1484ºC; (all temperatures in the graph are in ºC)
In part (a) of Fig. 18 line 1 depicts the bulging strain along the caster with the aforementioned formulation. LHS axis is used to present the bulging strain, while the RHS axis in part (a) presents the misalignment and unbending strains in the same scale. The strains due to the applied misalignment values are depicted by line 2 in part (a) of Fig. 18, and seem to be low indeed. The LHS axis in part (b) of Fig. 18 represents the total strain and is illustrated by line 3. However in this case, the total strain is larger than the critical strain (as measured on the RHS axis and illustrated by straight line 4) in as far as the first 4 m of
www.intechopen.com

Modeling Solidification Phenomena in the Continuous Casting of Carbon Steels
143
the caster are concerned. The effect of high SPH is affecting the internal slab soundness in a negative way.
Fig. 18. In part (a), bulging strain (LHS axis), and misalignment and unbending strains (RHS axis) are illustrated by lines (1) and (2), respectively. In a similar manner, the total strain (LHS axis) is presented in part (b) as line (3); the critical strain (RHS axis) is also included as line (4). Casting conditions: 130 x 390 mm x mm Sovel slab; %C = 0.165; casting speed: 1.1 m/min; SPH: 40 K; solidus temperature = 1484ºC
As of figures 1, 4, 7, 10, 13, and 16 it is obvious that the temperature distribution is presented only for the one-quarter of the slab cross-section, the rest one is omitted as redundant due to symmetry. It is interesting to note that due to the values of the shape factors, i.e., 1500/220 = 6.818, and 390/130 = 3.0 for the Stomana and Sovel casters, respectively, the shell proceeds faster across the largest size (width) than across the smallest one (thickness). This is well depicted with respect to the plot of the temperature distributions in the sections till the solidus temperatures for the specific chemical analyses under study. It should be pointed out that due to this, macro-segregation phenomena occasionally appear at both ends and across the central region of slabs. These defects appear normally as edge defects later on at the plate mill once they are rolled. Comparing figures 2 and 5, it becomes evident that the higher the carbon content the more it takes to solidify downstream the Stomana caster. For the Sovel caster similar results can be obtained by comparing the graphs presented by figures 11 and 14. Comparing figures 5 and 8, it is interesting to note that the higher the superheat the more time it takes for a slab to completely solidify in the caster at Stomana. Similar results have been obtained for the Sovel caster, just by comparing the results presented in figures 14 and 17. Furthermore, the higher the casting speed the more it takes to complete solidification in both casters, although computed results are not presented at different casting speeds. For productivity reasons, the maximum attainable casting speeds are selected in normal
www.intechopen.com

Two Phase Flow, Phase Change and Numerical Modeling
144
practice, so to avoid redundancy only results at real practice casting speeds were selected for presentation in this study. The ratio of the shape factors for the two casters, i.e., 6.818/3.0 = 2.27 seems to play some role for the failure of the application of the second formulation presented by equations (47) and (48) for the Sovel caster compared with the formulation for the bulging calculations presented in 3.1.1. In addition to this, even for the Stomana caster the computed bulging results were too high and not presented at higher carbon and superheat values. Low carbon steel grades seem to withstand better any bulging, misalignment, and unbending strains for both casters as illustrated by figures 3 and 6 for Stomana, and figures 12 and 15 for Sovel, respectively. The higher critical strain values associated with low carbon steels give more “room” for higher superheats and any caster design or maintenance problems. Another critical aspect that is worth mentioning is the effect of SPH upon strains for the same steel grade and casting speed. For the Stomana caster, comparing the results presented in figures 6 and 9 it seems that by increasing the superheat from 20K to 40K the bulging and misalignment strains increase by an almost double value; furthermore, the unbending strain at the second straightening point becomes appreciable and apparent in figure 9. In the case of the Sovel caster, higher superheat gives rise to such high values for bulging strains that may create significant amount of internal defects in the first stages of solidification, as presented in Fig. 18 compared with Fig. 15. Consequently, although Sovel’s caster is more “forgiving” than Stomana’s one with respect to unbending and misalignment strains it gets more prone to create defects due to bulging strains at higher superheats. In Fig. 19, an attempt to model static soft reduction is presented for the Stomana caster. In fact, statistical analysis was performed based upon the overall computed results and the following equation was developed from regression analysis giving the solidification point (SP) in meters, that is, the distance from meniscus at which the slab is completely solidified:
CSP SPH C u0.16 37.5 % 19.7 8.5= × + × + × − (49)
Equation (49) is statistically sound with a correlation coefficient R2=0.993, an F-test for the regression above 99.5%, and t-test for every coefficient above 99.5%, as well. In general, industrial practice has revealed that in the range of solid fraction from 0.3 up to 0.7 is the most fruitful time to start applying soft reduction. In the final stages of solidification, internal segregation problems may appear. In the Stomana caster, the final and most critical segments are presented in Fig. 19 with the numbers 5, 6, and 7. A scheme for static soft reduction (SR) is proposed with the idea of closing the gaps of the rolls according to a specific profile. In this way, the reduction of the thickness of the final product per caster length in which static soft reduction is to be applied will be of the order of 0.7 mm/m, which is similar to generally applied practices of the order of 1.0 mm/m. At the same time, for the conditions presented in Fig. 19, the solid fraction will be around 0.5 at the time soft reduction starts. Consequently, the point within the caster at which static soft reduction can be applied (starting fS ≈ 0.5) is given by:
start
SR SP 5.5− (50)
where, SRstart designates the caster point in meters at which static soft reduction may prove very promising.
www.intechopen.com

Modeling Solidification Phenomena in the Continuous Casting of Carbon Steels
145
Fig. 19. Suggested area for static soft reduction (SR) in the Stomana caster: Casting conditions: 220x1500 mm x mm slab; %C = 0.185; SPH = 30 K; uC = 0.8 m/min. Lines 1 and 2 depict the centreline and surface temperature, respectively. Lines 3 and 4 illustrate the shell growth and solid fraction, respectively. The borders of the final casting segments 5, 6, and 7 are also presented
Closing the discussion it should be added that the proper combination of low superheat and high casting speed values satisfies a proper slab unbending in the caster. The straightening process is successfully carried out at slab temperatures above 900°C without any surface defects for the products.
5. Conclusion
In this computational study the differential equation of heat transfer was numerically solved along a continuous caster, and results that are interesting from both the heat-transfer and the metallurgical points of view were presented and discussed. The effects of superheat, casting speed, and carbon levels upon slab casting were examined and computed for Stomana and Sovel casters. Generally, the higher the superheat the more difficult to solidify and produce a slab product that will be free of internal defects. Carbon levels are related to the selected steel grades, and casting speeds to the required maximum productivities so both are more difficult to alter under normal conditions. In order to tackle any internal defects coming from variable superheats from one heat to another, dynamic soft reduction has been put into practice by some slab casting manufacturers worldwide. In this study,
www.intechopen.com

Two Phase Flow, Phase Change and Numerical Modeling
146
some ideas for applying static soft reduction in practice at the Stomana caster have been proposed; in this case, more stringent demands for superheat levels from one heat to another are inevitable.
6. Acknowledgment
The continuous support from the top management of the SIDENOR group of companies is greatly appreciated. Professor Rabi Baliga from McGill University, Montreal, is also acknowledged for his guidelines in the analysis of many practical computational heat-transfer problems. The help of colleague and friend, mechanical engineer Nicolas Evangeliou for the construction of the graphs is also greatly appreciated.
7. References
Brimacombe J.K. (1976). Design of Continuous Casting Machines based on a Heat-Flow Analysis : State-of-the-Art Review. Canadian Metallurgical Quarterly, CIM, Vol. 15, No. 2, pp. 163-175
Brimacombe J.K., Sorimachi K. (1977). Crack Formation in the Continuous Casting of Steel. Met. Trans.B, Vol. 8B, pp. 489-505
Brimacombe J.K., Samarasekera I.V. (1978). The Continuous-Casting Mould. Intl. Metals Review, Vol. 23,No. 6, pp. 286-300
Brimacombe J.K., Samarasekera (1979). The Thermal Field in Continuous Casting Moulds. CanadianMetallurgical Quarterly, CIM, Vol. 18, pp. 251-266
Brimacombe J.K., Weinberg F., Hawbolt E.B. (1979). Formation of Longitudinal, Midface Cracks inContinuously Cast Slabs. Met. Trans. B, Vol. 10B, pp. 279-292
Brimacombe J.K., Hawbolt E.B., Weinberg F. (1980). Formation of Off-Corner Internal Cracks inContinuously-Cast Billets, Canadian Metallurgical Quarterly, CIM, Vol. 19, pp. 215-227
Burmeister L.C. (1983). Convective Heat Transfer. John Wiley & Sons, p. 551 Cabrera-Marrero, J.M., Carreno-Galindo V., Morales R.D., Chavez-Alcala F. (1998). Macro-
Micro Modeling of the Dendritic Microstructure of Steel Billets by Continuous Casting. ISIJ International, Vol. 38, No. 8, pp. 812-821
Carslaw, H.S, & Jaeger, J.C. (1986). Conduction of Heat in Solids. Oxford University Press. New York
Churchill, S.W., & Chu, H.H.S. (1975). Correlating Equations for Laminar and Turbulent Free Convection from a Horizontal Cylinder. Int. J. Heat Mass Transfer, 18, pp. 1049-1053
Fujii, H., Ohashi, T., & Hiromoto, T. (1976). On the Formation of Internal Cracks in Continuously Cast Slabs. Tetsu To Hagane-Journal of the Iron and Steel Institute of Japan, Vol. 62, pp. 1813-1822
Fujii, H., Ohashi, T., Oda, M., Arima, R., & Hiromoto, T. (1981). Analysis of Bulging in Continuously Cast Slabs by the Creep Model. Tetsu To Hagane-Journal of the Iron and Steel Institute of Japan, Vol. 67, pp. 1172-1179
Grill A., Schwerdtfeger K. (1979). Finite-element analysis of bulging produced by creep in continuously cast steel slabs. Ironmaking and Steelmaking, Vol. 6, No. 3, pp. 131-135
www.intechopen.com

Modeling Solidification Phenomena in the Continuous Casting of Carbon Steels
147
Han, Z., Cai, K., & Liu, B. (2001). Prediction and Analysis on Formation of Internal Cracks in Continuously Cast Slabs by Mathematical Models. ISIJ International, Vol. 41, No. 12, pp. 1473-1480
Hiebler, H., Zirngast, J., Bernhard, C., & Wolf, M. (1994). Inner Crack Formation in Continuous Casting: Stress or Strain Criterion? Steelmaking Conference Proceedings, ISS, Vol. 77, pp. 405-416
Imagumbai, M. (1994). Relationship between Primary- and Secondary-dendrite Arm Spacing of C-Mn Steel Uni-directionally Solidified in Steady State. ISIJ International, Vol. 34, No. 12, pp. 986-991
Incropera, F.P., & DeWitt, D.P. (1981). Fundamentals of Heat Transfer. John Wiley & Sons, p. 49
Kozlowski, P.F., Thomas, B.G., Azzi, J.A., & Wang, H. (1992). Simple Constitutive Equations for Steel at High Temperature. Metallurgical Transactions A, Vol. 23A, (March 1992), pp. 903-918
Lait, J.E., Brimacombe, J.K., Weinberg, F. (1974). Mathematical Modelling of Heat Flow in the Continuous Casting of Steel. Ironmaking and Steelmaking, Vol. 1, No.2, pp. 90-97
Ma, J., Xie, Z., & Jia G. (2008). Applying of Real-time Heat Transfer and Solidification Model on the Dynamic Control System of Billet Continuous Casting. ISIJ International, Vol. 48, No. 12, pp. 1722-1727
Matsumiya, T., Kajioka, H., Mizoguchi, S., Ueshima, Y., & Esaka, H. (1984). Mathematical Analysis of Segregations in Continuously-cast Slabs. Transactions ISIJ, Vol. 24, pp. 873-882
Mizikar, E.A. (1967). Mathematical Heat Transfer Model for Solidification of Continuously Cast Steel
Slabs. Trans. TMS-AIME, Vol. 239, pp. 1747-1753 Palmaers, A. (1978). High Temperature Mechanical Properties of Steel as a Means for
Controlling Casting. Metall. Report C.R.M., No. 53, pp. 23-31 Patankar, S.V. (1980). Numerical Heat Transfer and Fluid Flow. Hemisphere Publishing
Corporation, Washington Pierer, R., Bernhard, C., & Chimani, C. (2005). Evaluation of Common Constitutive
Equations for Solidifying Steel. BHM, Vol. 150, No. 5, pp. 1-13 Sismanis P.G. (2010). Heat transfer analysis of special reinforced NSC-columns under severe
fire conditions. International Journal of Materials Research (formerly: Zeitschrift fuer Metallkunde), Vol. 101, (March 2010), pp. 417-430, DOI 10.3139/146.110290
Sivaramakrishnan S., Bai H., Thomas B.G., Vanka P., Dauby P., & Assar M. (2000). Ironmaking Conference Proceedings, Pittsburgh, PA, ISS, Vol. 59, pp. 541-557
Tacke K.-H. (1985). Multi-beam model for strand straightening in continuous caster. Ironmaking and Steelmaking, Vol. 12, No. 2, pp. 87-94
Thomas, B.G., Samarasekera, I.V., Brimacombe, J.K. (1987). Mathematical Model of the Thermal Processing of Steel Ingots: Part I. Heat Flow Model. Metallurgical Transactions B, Vol. 18B, (March 1987), pp. 119-130
Uehara, M., Samarasekera, I.V., Brimacombe, J.K. (1986). Mathematical modeling of unbending of continuously cast steel slabs. Ironmaking and Steelmaking. Vol. 13, No. 3, pp. 138-153
www.intechopen.com

Two Phase Flow, Phase Change and Numerical Modeling
148
Won, Y-M, Kim, K-H, Yeo, T-J, & Oh, K. (1998). Effect of Cooling Rate on ZST, LIT and ZDT of Carbon Steels Near Melting Point. ISIJ International, Vol. 38, No. 10, pp. 1093-1099
Won, Y-M, & Thomas, B. (2001). Simple Model of Microsegregation during Solidification of Steels. Metallurgical and Materials Transactions A, Vol. 32A, (July 2001), pp. 1755-1767
Yoon, U-S., Bang, I.-W., Rhee, J.H., Kim, S.-Y., Lee, J.-D., & Oh, K.-H. (2002). Analysis of Mold Level Hunching by Unsteady Bulging during Thin Slab Casting. ISIJ International, Vol. 42, No. 10, pp. 1103-1111
Zhu, G., Wang, X., Yu, H., & Wang, W. (2003). Strain in solidifying shell of continuous casting slabs. Journal of University of Science and Technology Beijing, Vol. 10, No. 6, pp. 26-29
www.intechopen.com

Two Phase Flow, Phase Change and Numerical ModelingEdited by Dr. Amimul Ahsan
ISBN 978-953-307-584-6Hard cover, 584 pagesPublisher InTechPublished online 26, September, 2011Published in print edition September, 2011
InTech EuropeUniversity Campus STeP Ri Slavka Krautzeka 83/A 51000 Rijeka, Croatia Phone: +385 (51) 770 447 Fax: +385 (51) 686 166www.intechopen.com
InTech ChinaUnit 405, Office Block, Hotel Equatorial Shanghai No.65, Yan An Road (West), Shanghai, 200040, China
Phone: +86-21-62489820 Fax: +86-21-62489821
The heat transfer and analysis on laser beam, evaporator coils, shell-and-tube condenser, two phase flow,nanofluids, complex fluids, and on phase change are significant issues in a design of wide range of industrialprocesses and devices. This book includes 25 advanced and revised contributions, and it covers mainly (1)numerical modeling of heat transfer, (2) two phase flow, (3) nanofluids, and (4) phase change. The firstsection introduces numerical modeling of heat transfer on particles in binary gas-solid fluidization bed,solidification phenomena, thermal approaches to laser damage, and temperature and velocity distribution. Thesecond section covers density wave instability phenomena, gas and spray-water quenching, spray cooling,wettability effect, liquid film thickness, and thermosyphon loop. The third section includes nanofluids for heattransfer, nanofluids in minichannels, potential and engineering strategies on nanofluids, and heat transfer atnanoscale. The forth section presents time-dependent melting and deformation processes of phase changematerial (PCM), thermal energy storage tanks using PCM, phase change in deep CO2 injector, and thermalstorage device of solar hot water system. The advanced idea and information described here will be fruitful forthe readers to find a sustainable solution in an industrialized society.
How to referenceIn order to correctly reference this scholarly work, feel free to copy and paste the following:
Panagiotis Sismanis (2011). Modeling Solidification Phenomena in the Continuous Casting of Carbon Steels,Two Phase Flow, Phase Change and Numerical Modeling, Dr. Amimul Ahsan (Ed.), ISBN: 978-953-307-584-6,InTech, Available from: http://www.intechopen.com/books/two-phase-flow-phase-change-and-numerical-modeling/modeling-solidification-phenomena-in-the-continuous-casting-of-carbon-steels