modeling supreme court strategic decision making:...
TRANSCRIPT

247Supreme Court Decision Making
LEGISLATIVE STUDIES QUARTERLY, XXVIII, 2, May 2003 247
MARIO BERGARACentral Bank of Uruguay
and University of UruguayBARAK RICHMAN
University of California, BerkeleyPABLO T. SPILLER
University of California, Berkeley
Modeling Supreme CourtStrategic Decision Making:The Congressional Constraint
This paper addresses the contradictory results obtained by Segal (1997) andSpiller and Gely (1992) concerning the impact of institutional constraints on the U.S.Supreme Court’s decision making. By adapting the Spiller and Gely maximum likeli-hood model to the Segal dataset, we find support for the hypothesis that the Courtadjusts its decisions to presidential and congressional preferences. Data from 1947 to1992 indicate that the average probability of the Court being constrained has beenapproximately one-third. Further, we show that the results obtained by Segal are theproduct of biases introduced by a misspecified econometric model. We also discuss howour estimation highlights the usefulness of Krehbiel’s model of legislative decision making.
Introduction
The Supreme Court’s power as a policy maker is evident fromthe effort that politicians devote to the selection of justices. Recently, adebate has emerged over whether or not the Court’s contribution topolicy making can be understood without a comprehensive understandingof how justices interact with other political institutions and amongthemselves.
On one side of the debate lies the strategic school, whose modernform first emerged from the nonstrategic approach developed by Marks(1988). This camp has since moved on to develop simple but empiri-cally implementable models of the separation of powers1 (Epstein andWalker 1995; Gely and Spiller 1990; Spiller and Gely 1992) and later torefine and extend the model to games within the Court (Epstein andKnight 1998; Schwartz 1992).2 The explicit assumption in all thesemodels is that justices, like all economic actors, are forward-looking
Bergara, Richman, and Spiller.p65 4/3/03, 11:25 AM247

248 Bergara, Richman, and Spiller
players with well-defined and stable policy preferences. In their inter-actions with other policy actors, justices are strategic; when formulatingtheir actions, they consider the potential reactions of their policy com-petitors—namely Congress, the president, the agencies, and the lowercourts.3 Thus, the ideological composition of Congress, the agencies,the lower courts, and the president’s preferences can all be relevantfactors in predicting the Court’s final decisions.
On the other side of the debate lies the attitudinal approach tojudicial decision making, which enjoys a long and distinguished historyin political science. The central hypothesis in this approach is that justicesmake their decisions by relying exclusively on their individual ideologi-cal preferences. They are unmoved by the preferences of either theirfellow justices or other political actors and thus do not act strategi-cally.4 The attitudinal approach can be traced back to the work ofPritchett (1941, 1948) and Schubert (1965) and has continued in theresearch of Segal and Cover (1989), Segal and Spaeth (1993), andSegal et al. (1995). Employing a comprehensive dataset reflectingcongressional and Supreme Court ideologies and Supreme Courtdecisions, Segal (1997) finds that individual justices act unconstrainedby Congress’s and the president’s policy preferences and sincerelyvote their policy preferences. His conclusion challenges the basic foun-dation of the strategic separation-of-powers model. In particular, it ques-tions whether or not the results found by Spiller and Gely (1992), con-cerning the Supreme Court’s decisions in the National Labor RelationsBoard cases, can be generalized to other domains of policy making.5
Like Spiller and Gely, Segal attempts to determine if the SupremeCourt strategically adapts to the constraints imposed by the prefer-ences of other relevant political actors and correspondingly adjusts itsdecisions. It is difficult to resolve such a debate employing contrastingdatasets and empirical methodologies. Here, we move towards resolvingsuch inconsistent results by employing the econometric model developedby Spiller and Gely (1992) to analyze Segal’s data (1997). In doing so,we find that justices do adjust their decisions to presidential and con-gressional preferences. We also show that Segal’s conclusions result,in part, from a misspecified econometric model that is biased againstthe finding of strategic behavior.
Rational Choice Models
Both the strategic and the attitudinal approaches to judicial decisionmaking sharply contrast with the perspective employed in traditionallegal studies. Whereas traditional legal scholarship looks to formulaic
Bergara, Richman, and Spiller.p65 4/3/03, 11:25 AM248

249Supreme Court Decision Making
legal interpretations to predict Court outcomes, the attitudinal andstrategic approaches emphasize the role of the justices’ ideologicalpreferences. Similar to microeconomic theory, which assumes thatindividuals have stable but differing preferences, these rational choicetheories argue that justices have an assortment of stable but contrastingideologies. When on the Court, justices vote on cases with the aim ofenacting policies that best reflect their ideological preferences. Inessence, justices’ preferences can be characterized by a well-behavedideological utility function that obtains a maximum at a particular policyoutcome and decreases monotonically as outcomes move away fromthat maximum (the individual’s ideal policy).
More specifically, the attitudinal approach posits that justices votestrictly according to their individual ideologies—no strategic or institu-tional considerations enter into justices’ calculi. Decisions are unfil-tered reflections of the Court’s ideology and, accordingly, justices’ideologies should be the only significant predictors of Supreme Courtrulings (Segal 1997; Segal and Cover 1989; Segal and Spaeth 1993).
The strategic approach departs from the attitudinal approach inthe regard that it views justices as far-sighted individuals who are waryof their counterpart players in American policy making. Justices areassumed to hold a sophisticated understanding of both the legislativeprocess and congressional policy preferences. Consequently, justiceswould not want to pass down a decision that would be overturned byan act of Congress if Congress would replace the decision with a policythat, in the view of a majority of the Court, led to an inferior outcome.Accordingly, the Court makes decisions that, in general, Congress wouldnot overturn.6 Thus, the strategic approach incorporates congressional(and presidential) preferences as additional variables.
It is easy to imagine situations where the attitudinal and the stra-tegic models would generate different predictions. Consider a scenarioin which the Supreme Court can make decisions that implement policieslocated at any point along a continuous one-dimensional ideologicalspectrum, as is presented in Figure 1.7 The figure contains the idealpoints of three justices (A, B, and C) and those of the House (H) andSenate (S). For simplicity’s sake, we assume that the preferences ofthe House and the Senate can be represented by single points in theideological spectrum (perhaps the ideal point of each chamber’s medianvoter) and we assume away the ability of the president to veto legisla-tion. A majority of justices—who, according to the median voter theorem,are collectively represented by the median justice—would prefer theideal point for justice B. Thus, the attitudinal model would predict thatthe policy outcome would be at justice B’s ideal point. Forward-looking
Bergara, Richman, and Spiller.p65 4/3/03, 11:25 AM249

250 Bergara, Richman, and Spiller
justices would realize, however, that the House and Senate would acttogether to replace such a policy outcome since there are several pointsalong the policy spectrum that both H and S would prefer over the policyB. Justice B, supported by a majority of the justices, would thus prefer topass down a decision that the House and Senate will not overturn but thatis as close as possible to her ideal point.8 In this figure, such a point is theSenate’s ideal point. Since the Senate prefers S to all other outcomes, it willblock any alternative policy proposal, so the Court’s ruling is secure. Insum, the Court chooses to implement policy S since it maximizes the utilityof the Court’s majority (represented by the ideal point of its median justice)subject to the constraints imposed by congressional preferences.9
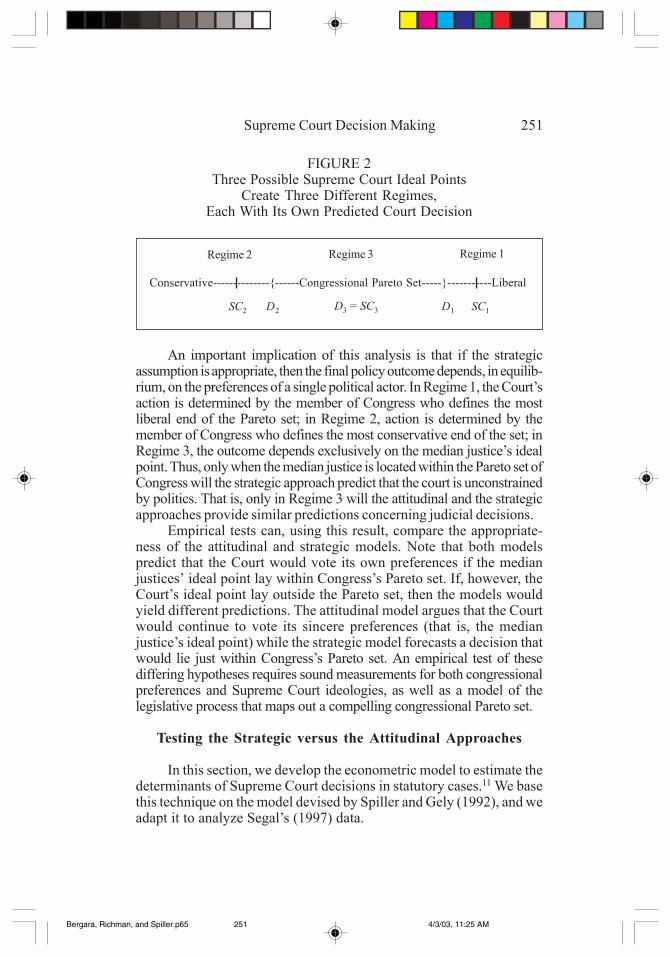
The strategic model’s prediction for the Court’s decision fallsweakly within the congressional Pareto set.10 Consequently, constructionof that set is a critical element of the model since it functionally representsCongress’s preferences. The Supreme Court’s relationship with Congressis determined by where the median justice’s ideal point is in relation toCongress’s Pareto set. If the median justice’s ideal point, which we here-after call “the Court’s ideal point” and represent with SCi, lay outsideCongress’s Pareto set—which is the case in both Regime 1 and Regime 2,as shown in Figure 2—then any decision that reflected the Court’s sincerepreferences would be overturned by Congress. Consequently, in these cases,the Court, if acting strategically, would pass decisions—such as D1 or D2—that lay within the congressional Pareto set but were as close to its idealpoint as possible. If, however, the median justice’s ideal point fell withinCongress’s Pareto set, as is the case in Regime 3, then the Court would beunconstrained and could vote its own preferences, i.e., its decisions wouldreflect the median justice’s ideal point. Thus, under Regime 3, the attitudi-nal and strategic approaches yield the same predictions.
Conservative--------A-----------------------B-----S----------H--------C-----Liberal
Predicted Outcome: Pa Ps
FIGURE 1Three Justices (A, B, C), the House (H), and the Senate (S)
Along an Ideological Spectrum with aContinuum of Policy Outcomes
Note: Attitudinal and strategic models generate different predictions, Pa and Ps,respectively.
Bergara, Richman, and Spiller.p65 4/3/03, 11:25 AM250
251Supreme Court Decision Making
An important implication of this analysis is that if the strategicassumption is appropriate, then the final policy outcome depends, in equilib-rium, on the preferences of a single political actor. In Regime 1, the Court’saction is determined by the member of Congress who defines the mostliberal end of the Pareto set; in Regime 2, action is determined by themember of Congress who defines the most conservative end of the set; inRegime 3, the outcome depends exclusively on the median justice’s idealpoint. Thus, only when the median justice is located within the Pareto set ofCongress will the strategic approach predict that the court is unconstrainedby politics. That is, only in Regime 3 will the attitudinal and the strategicapproaches provide similar predictions concerning judicial decisions.
Empirical tests can, using this result, compare the appropriate-ness of the attitudinal and strategic models. Note that both modelspredict that the Court would vote its own preferences if the medianjustices’ ideal point lay within Congress’s Pareto set. If, however, theCourt’s ideal point lay outside the Pareto set, then the models wouldyield different predictions. The attitudinal model argues that the Courtwould continue to vote its sincere preferences (that is, the medianjustice’s ideal point) while the strategic model forecasts a decision thatwould lie just within Congress’s Pareto set. An empirical test of thesediffering hypotheses requires sound measurements for both congressionalpreferences and Supreme Court ideologies, as well as a model of thelegislative process that maps out a compelling congressional Pareto set.
Testing the Strategic versus the Attitudinal Approaches
In this section, we develop the econometric model to estimate thedeterminants of Supreme Court decisions in statutory cases.11 We basethis technique on the model devised by Spiller and Gely (1992), and weadapt it to analyze Segal’s (1997) data.
Conservative--------------{------Congressional Pareto Set-----}-----------Liberal
SC2 D2 D3 = SC3 SC1D1
Regime 1Regime 2 Regime 3
FIGURE 2Three Possible Supreme Court Ideal Points
Create Three Different Regimes,Each With Its Own Predicted Court Decision
Bergara, Richman, and Spiller.p65 4/3/03, 11:25 AM251

252 Bergara, Richman, and Spiller
We begin by establishing a one-dimensional policy space, assigningall possible policy outcomes a value between 0–100, where 0 repre-sents the most conservative possible outcome and 100 represents themost liberal. The dependent variable is the Supreme Court’s percent ofpro-liberal decisions in statutory cases for a given year, and theexplanatory variables are Congress’s ideologies, guided and filtered bythe legislative process, and the Court’s ideology.
Preferred Judicial Decisions
It is reasonable to assume that there is positive correlation betweenan individual’s ideology measure, whether he is a member of Congressor a Supreme Court justice, and his tendency to cast pro-liberal votes.We use this ideology measure to indicate a preference for a certainpercent of pro-liberal judicial decisions for a given year.12 What is notreasonable, however, is to assume that a given measure of politicalpreferences, like that formulated by the Americans for DemocraticAction (ADA), maps exactly onto the preferred probability of a pro-liberal judicial decision for a given year. Were that the case, a legislatorwith an ADA score of, say, 60, would optimally prefer a 60% probabilityfor a pro-liberal outcome.13 This assumption, although testable, is tooextreme. We therefore characterize the preferences of an individual,in either body, for pro-liberal judicial decisions with the equation
kaka bPqE +=* , (1)
where *kaE represents individual a’s most desired percent of pro-liberal
decisions by the Court during time period k, Pka reflects that individual’sideology (with rising values for increasingly liberal ideologies) duringthat period, and q and b are parameters to be estimated. Since theworking assumption is that the more liberal an individual’s ideology, thehigher the percent of pro-liberal Court decisions that individual willprefer, we should observe that b > 0. Thus, our model estimates anindividual’s preferences for pro-liberal judicial decisions, which areunobservable, using their observable generic ideologies. Note that theparameters q and b are “structural” parameters, simply reflecting basicpreferences. Since in Equation (1) we assume linearity, we can con-struct for any b the whole game in the “probability” rather than the“political” space. The linear transformation allows us to treat repre-sentations of the probability or political spaces in the same dimension.
Let the actual percent of pro-liberal decisions during period k berepresented by Ek, and let individual a be the decisive member of the
Bergara, Richman, and Spiller.p65 4/3/03, 11:25 AM252

253Supreme Court Decision Making
House, Senate, or Supreme Court who, depending on the pertinentregime, determines the Court’s outcome during that period.14 Then therelationship between the Court’s judicial outcomes during a given periodand the relevant individual’s preferences is represented by
kkak eEE += * , (2)
where a reflects the relevant political player in period k, and ek is anindependently distributed error with a mean of zero.
Substituting Equation (1) into (2), we obtain Ek = q + bPka + ek, (3)
where Pka represents the (observable) political ideology of the relevantplayer during the given period. In order to accommodate Segal’s data,which bundles Supreme Court decisions into yearly observations, weconvert the periods in Equation (3) to individual years and arrive at
Et = q + bPta + et, (4)
where t identifies the year. The compositions of the Court and Congressusually vary year by year, but they are generally stable within a givenyear. Accordingly, the value of Pta should be stable throughout the year.15
Regime Selection
We now turn to the regime selection problem. Note again that Etis the Supreme Court’s actual percent of pro-liberal decisions duringyear t, and Pta is the ideology measure of the relevant political player inyear t. A key component of the strategic model is its identification ofwho the relevant political player is at each point in time. When theSupreme Court’s ideal point is more liberal than all points withinCongress’s Pareto set (Regime 1), then the decisive player is the memberof Congress who determines the uppermost boundary of the Paretoset. When the Court’s ideal point is less liberal than all points withinCongress’s Pareto set (Regime 2), then the key player is the memberof Congress who determines the lowermost boundary of the Paretoset. When the Court’s ideal point lies within Congress’s Pareto set(Regime 3), the Court is free to act on its true ideology and the medianjustice becomes the key player.
Consequently, each regime produces a different value for thepolitical variable Pta. When we substitute the different political vari-ables into Equation (4), our econometric model articulates the threeregimes as follows:
Bergara, Richman, and Spiller.p65 4/3/03, 11:25 AM253

254 Bergara, Richman, and Spiller
(5a) Regime 1: Et = q + b*Max (Ht, St) + et when SCt > Max (Ht, St),
(5b) Regime 2: Et = q + b*Min (Ht, St) + et when SCt < Min (Ht, St), and
(5c) Regime 3: Et = q + b*SCt + et when Min (Ht, St) < SCt < Max (Ht, St).
Ht and St represent the decisive players during year t in the House andSenate, respectively.
Comparing Congressional and Judicial Preferences
As previously indicated, applying this model requires appropriatemeasures for both congressional and judicial preferences. We use ADAcongressional ratings (despite their well-known problems) to reflectcongressional ideologies, and we employ Segal’s “constitutional scores”to reflect the Supreme Court’s ideologies.16 Segal derives his constitu-tional scores by collecting data from Supreme Court decisions from1947 to 1992 and then performing four steps. First, he selects thejustices’ votes only in non-unanimous constitutional cases. Second, hefurther refines his data by considering only cases where the Courtdecided a matter regarding civil liberties. Segal acknowledges that thisstep may limit his model’s generality but explains that it adds a certain“cleanness” to his data, since civil liberties cases have easily definableconservative and liberal positions. Indeed, votes in civil liberties caseshave proven to be accurate measures of ideological preferences androbust predictors of other judicial behavior (see Segal and Spaeth 1993).Third, Segal calculates the percent of pro-liberal votes each justicecasts in these non-unanimous civil liberties cases for each year he orshe is on the bench. Lastly, he performs a time-series regression onthese annual pro-liberal percents and thus transforms a justice’s “raw”liberal percent scores from each year into flattened values across years.These predicted values for each year then serve as his constitutionalscores.17
Segal arrives at constitutional scores for individual justices thatrange from 5 (Rehnquist) to 93.3 (Douglas).18 Since these constitu-tional scores, like the ADA scores, are on a 0–100 scale, it is temptingto place them, as Segal does, along the same dimension as the ADAscores and use this same dimension to compare Congress’s and theCourt’s ideologies. This method would give a justice with a constitu-tional score of 25 the same ideological preferences as a member ofCongress with an ADA score of 25. But the ADA and the constitu-tional scores are derived from fundamentally different data. ADA scoresare a percent of pro-liberal votes cast by each member of Congress on
Bergara, Richman, and Spiller.p65 4/3/03, 11:25 AM254

255Supreme Court Decision Making
nonconstitutional issues that are specifically selected by the ADA.19
On the other hand, Segal’s constitutional scores are an index based onthe percent of pro-liberal votes cast by each Supreme Court justice inconstitutional cases. Furthermore, ADA ratings and Supreme Courtvotes have very different statistical distributions and come under verydifferent institutional pressures, so their scores would naturally reflectideology differently. Indeed, ADA scores are heavily bimodal, whereasSegal’s constitutional scores are unimodal (see Snyder 1992). Makinga direct comparison, as Segal does, requires that both scores be drawnfrom the same statistical distribution, which is not the case, or that bothbe translated into a common space, which is what we do here.20
The ADA and the averages of constitutional judicial votes arenot easily comparable. In principle, one could imagine a transformationthat brings one score into the dimension of the other (after all, both areliberal-conservative scores), but the selection of such a transformationis not an arbitrary decision. There is no reason why the final constitu-tional scores should span the entire ADA ideological spectrum from 0to 100 instead of occupying a small slice from, say, 50 to 75. Forexample, Segal transforms his raw scores by undertaking a linear trans-formation but, in principle, any arbitrary transformation is appropriateas long as it is “one to one.”21
On the other hand, which particular transformation of justices’scores onto the ADA scale is used has important econometric conse-quences. Recall that if a justice is to the left of the Pareto set, then thejustice is in a different regime than those who are to the right of orwithin the Pareto set. So the transformation of constitutional scoresonto the ADA scale affects both the regime in which each justice islocated, which determines the value of the constraint variable, as wellas the independent variables used to measure strategic behavior. Thus,inappropriately selecting the transformation will necessarily bias theresults against a finding of strategic behavior. Segal acknowledges thesedifficulties and reports having consulted with public law scholars toconfirm that the constitutional scores created an accurate ideologicalspectrum (1997, 36). Although approval from these scholars shouldindeed be comforting, and although there genuinely is no ex-ante methodto conform the two scores to each other, the simple linear one-to-onetranslation invites a search for a more precise transformation.
We model the true Supreme Court preferences in the samedimension as congressional ADA scores as a latent variable, ( SC t),which is related to Segal’s constitutional scores by the following equation:
uSCdgSC +*+= . (6)
Bergara, Richman, and Spiller.p65 4/3/03, 11:25 AM255

256 Bergara, Richman, and Spiller
Here, SC represents Segal’s constitutional scores, g and d areparameters to be estimated, and u is a normally independently distrib-uted error. SC is a latent variable that represents the ideal point of thejustice in the ADA dimension and, as such, can be used in defining therelevant regimes in the econometric model.22 This equation essentiallylets the data perform the transformation from judicial constitutionalscores to ADA scores. So, while the constitutional scores still serve asa basis for determining the ideologies of Supreme Court justices, themodel overcomes the basic problem of reconciling the constitutionalscores with the ADA ratings by a stochastic transformation of consti-tutional scores into ADA ratings.
A Switching Regression Modelwith Uncertain Separation Criteria
The introduction of a latent variable to represent the Court’s pref-erences in the ADA domain implies that we cannot perfectly observethe exact location of the Court’s ideal point vis-à-vis congressionalpreferences. As a consequence, the switching-regimes model (5a–5c)has an unknown separation criteria. Let su be the standard deviation ofu and Φ(.) be the standard normal cumulative distribution function.23
We can then use Equations (5) and (6) to characterize the probabilitiesof observing Regimes 1, 2, and 3 in year t (L1t, L2t, and L3t) so as todetermine the likelihood function for the model (see Spiller and Gely1992). These probabilities are respectively ( )[ ]uttttttt sSCdgSHMaxSHMaxSCL /*--),(Φ-1=)),(>(Pr=1 , (7a)
( )[ ]uttttttt sSCdgSHMinSHMinSCL /*--),(Φ=)),(<(Pr=2 , and (7b)
( )[ ] ( )[ ] ./*--),(Φ -/*--),(Φ
=)),(<<),((Pr=3
utttuttt
tttttt
sSCdgSHMinsSCdgSHMax
SHMaxSCSHMinL (7c)
The likelihood function for the model is then
L = Π (L1kφ
1 + L2kφ
2 + L3kφ
3), (8) where
( ) ( )( )[ ]ettte sSHMaxbqEφsφ /,*--/1=1 ,
( ) ( )( )[ ]ettte sSHMinbqEφsφ /,*--/1=2 and
( )( ) +/*+--)+/1(= 2222223 euteu ssbSCdgbqEφssbφ
with φ (.) representing the standard normal density function and sereflecting the standard deviation of the error term e.
T
t=1
[ ][ ]
[ ],
Bergara, Richman, and Spiller.p65 4/3/03, 11:25 AM256

257Supreme Court Decision Making
Our analysis applies standard maximum likelihood techniques toEquation (8), where b is the coefficient that measures the significanceof the ideology belonging to the relevant political player in each regime,and g and d reflect the transformation of judicial constitutional prefer-ences into judicial ADA preferences. This analysis yields some impor-tant econometric and substantive implications. First, note that the ideologyof an individual player—whether the median justice or key member ofCongress—is significant in predicting the Court’s decisions only undercertain regimes. Second, our model implies that the coefficient b shouldbe positive, which is a refutable empirical hypothesis. If b were estimatedto be zero, then neither politics nor ideology would be significant in theCourt’s statutory decisions. The Court, essentially, would be makingdecisions based not on ideology but rather on the merits and specificsof the case. A nonpositive b would reject not only the strategic but alsothe attitudinal approach, since both approaches require that justicescast votes based on their ideologies. Third, the model implies that ifconstitutional scores are a reasonable proxy for judicial preferences,then d should be positive. Finally, the model endogenously determinesprobabilities of each regime (Equations 7a through 7c). Thus, if the prob-ability of Regime 3 is close to one, then the strategic framework can bediscarded in favor of the more parsimonious attitudinal model. Althoughwe will not be able to reject the strategic model formally in this case, wewould reject it de facto since it would lack both political (since the Court isnever constrained) and empirical relevance. If, however, the probabilitiesof Regimes 1 or 2 are sufficiently distant from zero, then we can adequatelytest the strategic model, and a positive estimate for b suggests that thestrategic approach is superior to the attitudinal model. Indeed, the essenceof the attitudinal model is that justices do not pay attention to institutionalconstraints, either because they are naïve or because the constraintsare not binding. Positive probabilities for Regimes 1 and 2, combinedwith a positive estimate for b, reject both of these explanations.
Segal and Wang (2001) provide an overidentification test for thestrategic model. Equations (5a) and (5b) imply that if the attitudinalmodel is false, then, conditional on being in Regime 1 or 2, the probabilityof a pro-liberal decision should be independent of the Court’s ideology.To confirm this speculation, we add a term to (5a) and (5b) representingthe Court’s ideology, and we hypothesize that the coefficient for thatideology term is zero. In contrast, if the strategic model is false, thenthe coefficient of that term should be positive—and identical to thecoefficient of the Court in Regime 3—and the coefficient of the politicalvariable should be zero. This specification presents another test forboth the attitudinal and strategic models.
Bergara, Richman, and Spiller.p65 4/3/03, 11:25 AM257

258 Bergara, Richman, and Spiller
Segal (1997) Revisited
We apply our regime-switching methodology to the data used bySegal (1997). But before we discuss our findings, it is important todiscuss Segal’s (1997) approach.
The core of Segal’s test of the strategic approach is an econo-metric analysis of individual justices’ votes on nonconstitutional casesfor the period 1947–92. His framework is based on the construction ofa constraint variable that is supposed to measure whether or not ajustice is constrained from voting her own preferences when casting avote. The variable is defined by the following equation:
>>0<->-
=MaxSCMinif
MinSCifSCMinMaxSCifSCMax
Constraint
i
ii
ii. (9)
Max is the upper (most liberal) boundary of Congress’s Pareto set,Min is the lower (most conservative) boundary, and SCi is justice i’sconstitutional score.
Segal’s claim is that the constraint variable reflects the degree towhich justices are constrained by Congress’s ideologies. He posits thatan acceptable test of the strategic model is whether or not the con-straint variable is statistically significant in predicting justices’ votes onstatutory cases. The regression model Segal uses is represented byEquation (10):
eintConstrapaPL +*+= . (10)
Here, PL is the probability of casting a pro-liberal vote on a statutorycase, a and p are parameters to be estimated, and e is an error term.Segal argues that if the strategic model holds, then the parameter pshould be positive and statistically significant.
Although intuitively feasible, this approach has methodologicalflaws that bias the results toward a finding of statistical insignificanceof the p coefficient. First, the construction of the constraint set is inap-propriate: even though the position of the justice in relation to the Paretoset may be constant, changes in the justice’s preferences influence theconstraint variable, thus biasing the coefficient of p towards zero.24
Second, the unit of analysis is the individual judge when the strategictheory only has predictions for the median judge, thus again biasing thecoefficient of p toward zero.25 Third, the constraint variable is built by
{
Bergara, Richman, and Spiller.p65 4/3/03, 11:25 AM258

259Supreme Court Decision Making
directly comparing ADA ratings to judicial preferences, which, as wediscussed before, introduces a serious measurement error, potentiallybiasing p toward zero.
Finally, and most problematic, Segal uses various congressionalmodels—the Committee Gatekeeping model (CGK), the Multiple Vetomodel (MV), and the Party Caucus model (PC)—to derive congres-sional Pareto sets. Unfortunately, given his preference symmetryassumption, these models tend to generate Pareto sets that extendbeyond the 0–100 range. Recall that the whole ideological space mustlie strictly in the 0–100 range; the excessive boundaries of these legis-lative models point to some important failings.26 (See Figures A1–A3in Appendix I for the political constraints imposed by the CGK, MV,and PC models.) This observation has several implications. First, sinceSegal’s analysis only examines the voting behavior of justices that lieoutside the constraint set, an overly broad constraint set will excludesome moderate justices who may act strategically. Instead, his analysisonly captures the “extreme” justices, who are unlikely to be the medianjustice and thus will vote their sincere preferences even according tothe strategic theory. Second, the method may be assigning observa-tions to the wrong regimes and hence using improperly measured right-hand-side variables.27 Both of these problems—which are present foreach of the three legislative models—bias the estimate coefficient of ptoward zero.
A particularly compelling alternative to the legislative models dis-cussed above has been offered by Krehbiel (1998). Building upon hisprior emphasis on the power of the floor, Krehbiel constructs a Paretoset that stresses the roles of the presidential veto and the Senate’sfilibuster. His model views the veto and the filibuster as the two chiefhurdles to congressional action, and any legislative initiative must mustersufficient support to overcome both. This Filibuster-Veto (F-V) modelis readily translated into a one-dimensional policy space, and the impactsof both the presidential veto and the filibuster can be modeled.
A bill can override a presidential veto if it has support from two-thirds of both the House and the Senate, so Congress would confi-dently be able to overturn Supreme Court decisions if two-thirds ofmembers of both chambers preferred an alternative policy. This fractionis the relevant boundary when Congress tries to overturn a decisionthat the president supports and is defined by the member at 67th per-centile of the ideological position shared by the president. The filibusterboundary is similarly delimited, but only for the Senate. Since three-fifths of the Senate is required to bring cloture to a debate, any legislativeaction that has the president’s support must also receive support from
Bergara, Richman, and Spiller.p65 4/3/03, 11:25 AM259

260 Bergara, Richman, and Spiller
three-fifths of the Senate. It follows that the filibuster’s boundaries aredefined by the senator at the 40th percentile with the ideological posi-tion opposite the president. The Pareto sets generated by the F-V modelsfor the period under consideration, 1947–92, have more reasonableranges than the three other legislative models discussed here, and, as aconsequence, the F-V model becomes a reasonable one on which totest the attitudinal versus the strategic hypotheses. We add Krehbiel’sframework to those selected by Segal in our testing of the attitudinaland strategic approaches.
Data and Empirical Results
Our model requires measurements reflecting congressional pref-erences, Supreme Court preferences, and Supreme Court decisions.For congressional preferences, we use the pro-liberal scores computedevery year by the ADA.28 For each legislative model, we then deter-mine the bounds for the congressional Pareto set. For Supreme Courtpreferences, we use the constitutional scores Segal assigns to individualSupreme Court justices, which reflect the percent of pro-liberal votes ajustice casts each year in constitutional cases.29 Our model is designedto predict the Supreme Court’s percent pro-liberal decisions in statutorycases for a given year. In the same way that we use the median justice’sconstitutional scores to measure the Court’s ideology, we employ themedian justice’s percent pro-liberal votes as a proxy for the Court’sstatutory decisions.30 From these data, our model employs four chiefvariables: the median justice’s constitutional scores that reflect her ideo-logical preferences (and thus the ideology of the Court), two congres-sional constraint values representing the upper and lower boundariesof Congress’s Pareto set, and the median justice’s percent pro-liberalvotes in statutory cases. The first three parameters are independentand explanatory variables, and the lattermost is the dependent variable.31
Our analysis begins with ordinary least-squares regressions usingthe political constraints defined by Krehbiel’s Filibuster-Veto model,the Committee Gatekeeping model, the Multiple Veto model, and theParty Caucus model.
One result that carries across all models is that the Court’s ideol-ogy has a significant impact on its decisions, a finding consistent withboth the attitudinal and strategic approaches. The effect of politics isstill unclear, but recall that ordinary least squares is an inappropriatemethod for testing for strategic behavior. OLS presumes that the threepotentially relevant political players—the median justice and the twodeterminative members of Congress—all simultaneously influence the
Bergara, Richman, and Spiller.p65 4/3/03, 11:25 AM260

261Supreme Court Decision Making
TABLE 1Linear Probability Models across Alternative Legislative Modelsa
(t-statistics in parentheses)
Variable F-V CGK MV PC
Constant 18.51 16.79 8.87 9.75(2.44) (2.44) (1.09) (1.35)
SC 0.71 0.72 0.68 0.67(6.92) (7.47) (6.90) (7.01)
Max 0.03 0.21 0.06 0.07(0.19) (0.26) (1.15) (1.18)
Min 0.18 –0.15 –0.03 0.05(–1.02) (–0.96) (–0.48) (0.64)
R2 0.58 0.58 0.59 0.59
F-stat. 19.65 19.48 19.93 20.25
Standard Error 0.0874 0.0877 0.0871 0.0867
Akaike ICb –83.69 –83.37 –84.00 –84.43
Number of Observations: 46
aWe normalized the data by dividing all of the values by 100; this step was necessary inorder to perform the maximum likelihood function. Normalizing does not at all affectthe estimated coefficients or our substantive results, but it does change the interceptsand the standard error. For example, an intercept (constant) value of 0.185 represents ascore on the ADA scale of 18.5.bThe Akaike Information Criterion [(AIC) Akaike 1974; Harvey 1981] is commonlyused to compare non-nested models fit to the same data. The AIC, for maximumlikelihood estimators, is computed as –2ln(L) + 2k, where L is the value of the likelihoodfunction and k is the number of parameters to be estimated. For OLS estimations, theAIC is computed as N[Log(2πσ2) + 1] + 2(k+1) (Chi and Russell 1999). The modelwith the smaller information criterion is said to fit the data better.
Court’s outcomes. Consequently, the measurement of political con-straints (which, incidentally, is diluted into two separate OLS coeffi-cients) is for constraints throughout the period 1947–92, including thoseyears when the Court is in Regime 3. This simultaneous analysis biasesthe parameters toward zero.
Bergara, Richman, and Spiller.p65 4/3/03, 11:25 AM261

262 Bergara, Richman, and Spiller
The strategic approach, however, requires switching regressionsand, in particular, switching regressions with uncertain separationcriteria. Thus, we now discuss the results of the regime-switching econo-metric methodology described in the section above. Table 2 containsthe results for the maximum likelihood estimation applied to each of thefour legislative models.32
Table 2 shows that both ideology and politics matter, as theparameters d and b are highly significant.33 In particular, for a 10-pointincrease in the relevant player’s ideological score (ADA for a memberof Congress and imputed ADA score for the median justice), the pro-liberal percent of annual decisions increases about 3% for the MultipleVeto model and 6% for the other models.34 From this finding, we con-clude that the ideologies of the relevant players across regimes is sig-nificant, not just the Court’s ideology. In other words, when in Regime1 or 2, the Court does seem to adhere to the relevant political con-straints.35 Moreover, these models all fit the data better than therespective OLS estimates presented in Table 1. Indeed, the AkaikeInformation Criterion shows lower values for the switching regressionmodels in Table 2 than for the OLS models of Table 1.
Comparison of the results from the F-V and other legislative modelsreveals further insights. All models measure the total effect of ideol-ogy, d*b, to be significant, but the F-V model ascribes more of thiseffect to the political variable. Meanwhile, the Multiple Veto, far morethan any of the other models, generates a high value for the ideologyparameter, d, and a low value for the political parameter, b. The reasonfor this imbalance is that the Multiple Veto model generates far toomany observations that violate the 0–100 ideological range constraint,thus grossly overstating congressional gridlock. As a consequence, itwould overestimate the likelihood that a Supreme Court would have itsideal point within Congress’s Pareto set, i.e., in Regime 3, and thuspredict that the Court can act unconstrained. Consequently, thepredictive power that the Multiple Veto model ascribes to ideology maybe overstated by the SC variable and understated by the politicalconstraints.
For the F-V model, alternatively, the maximum likelihood tech-nique estimates that the Court is more frequently constrained by Con-gress. Our results indicate that the probability the Court is constrainedunder the F-V model is, on average, 33%, compared to 18% under theMultiple Veto model or 14% under the Party Caucus model. The CGKmodel, which has fewer observations that violate the 0–100 constraint,predicts a 29% probability of constrained decision making.36 Theseresults are significant because the F-V and CGK models, with fewer
Bergara, Richman, and Spiller.p65 4/3/03, 11:25 AM262

263Supreme Court Decision Making
TABLE 2The Econometric Model
Maximum Likelihood Estimation(t-statistics in parentheses)
Parameter Variable F–V CGK MV PC
g CONSTANT –12.85 –15.65 –60.97 –11.53(–0.82) (–0.70) (–1.46) (–0.84)
d SC 1.10 1.22 2.69 1.37(3.60) (2.64) (3.01) (3.48)
q CONSTANT 0.23 0.25 0.32 0.21(3.87) (3.16) (5.83) (3.55)
b POLITICS 0.66 0.60 0.28 0.55(4.42) (3.38) (3.72) (3.59)
se 0.0531 0.0569 0.0553 0.0834(2.54) (2.31) (2.57) (11.71)
su 0.113 0.119 0.230 0.019(3.08) (2.92) (2.42) (1.75)
Log-Likelihood 50.26 48.75 50.97 48.68
Akaike IC –88.52 –85.50 –89.94 –85.36
Pr. Regime 1 0.09 0.12 0.11 0.08
Pr. Regime 2 0.24 0.17 0.07 0.06
Pr. Regime 3 0.67 0.71 0.82 0.86
Number of Observations: 46
observations violating the 0–100 range, put a much more rigorous testto the hypothesis for strategic behavior. Because the estimated bparameters are still so highly significant (and, in fact, statistically differentthan the one estimated under the MV model and slightly higher than forthe PC version), the conclusion that the Court thinks strategically cannotbe rejected.
Bergara, Richman, and Spiller.p65 4/3/03, 11:25 AM263

264 Bergara, Richman, and Spiller
In Figure 3, we plot the Max (F-V) and Min (F-V) boundaries ofCongress’s Pareto set with the Court’s predicted ideal point. Similarinformation for the other three models is presented in Figures A1–A3in Appendix I.37 Figure 3 shows that the Court’s predicted SC , ascomputed by the F-V estimation, generally rises and falls withcongressional preferences, which explains why the average probabilityfor Regime 3 is about two-thirds. Note, however, that there are alsoperiods when the Court’s ideology presses against Congress’s con-straints. Specifically, the Court was close to the conservative boundaryof the congressional Pareto set through most of the 1950s, indicating asignificant probability that it was in Regime 2 during that period. TheCourt then became more liberal in relation to Congress in the late 1960s,thus suggesting a significant probability that it was in Regime 1. For thelate 1980s and early 1990s, the Court again approached the conserva-tive boundary of the congressional Pareto set and again produced agrowing likelihood that it was in Regime 1. Thus, although the Courtappears to be mostly unconstrained throughout the 1947–92 period, itactually underwent periods when it was likely to be under Congress’spolitical constraints.38
FIGURE 3Predicted SC and F-V Constraints
0
10
20
30
40
50
60
70
80
90
100
1947 1952 1957 1962 1967 1972 1977 1982 1987 1992
SC SC + 2*su SC - 2*su Max (F-V) Min (F-V)
Bergara, Richman, and Spiller.p65 4/3/03, 11:25 AM264

265Supreme Court Decision Making
Figure 4 provides the estimated probabilities of each regime for eachyear (always summing to 1.0), thereby illustrating this point. As the pre-dicted SC approaches the upper Pareto boundary, as it did in the late1960s, the probability of Regime 1 increases. Similarly, as SC approachesthe lower Pareto boundary, as it did throughout the 1950s and 1980s, theprobability of Regime 2 increases. Consequently, the results indicate thatthe likelihood of each regime is sufficiently robust as to pose a real test tothe econometric model, and for several years, the probabilities of Regimes1 and 2 were high enough to pose political constraints on the Court.
An additional feature of Krehbiel’s model is that it gives somesupport to Segal’s linear transformation of judicial preferences into the0–100 ADA scale. Under the maximum likelihood estimation, the F-Vmodel generates a value for the parameter d that is fairly close to 1,thus giving balanced weight to the original constitutional scores and theADA ratings.39 So, although methodologically suspect, Segal’s directcomparison of justices constitutional scores and legislators’ ADA ratingsreceives support from the F-V estimation.40
In sum, results from both Tables 1 and 2 illustrate that ideologymatters because the justices’ ideologies substantially influence theirfinal decisions. The results in Table 2 show that politics also matter,since the political constraints contribute substantially to predicting theCourt’s outcomes and indicate that justices exercise their ideology in a
������������������������������������������������������������������������������������������������������������������������������������������������������������������������������������������������������������������������������������������������������������������������������������������������������������������������������������������������������������������������������������������������������������������������������������������������������������������������������������������������������������������������������������������������������������������������������������������������������������������������������������������������������������������������������������������������������������������������������������������������������������������������������������������������������������������������������������������������������������������������������������������������������������������������������������������������������������������������������������������������������������������������������������������������������������������������������������������������������������������������������������������������������������������������������������������������������������������������������������������������������������������������������������������������������������������������������������������������������������������������������������������������������������������������������������������������������������������������������������������������������������������������������������������������������������������������������������������������������������������������������������������������������������������������������������������������������������������������������������������������������������������������������������������������������������������������������������������������������������������������������������������������������������������������������������������������������������������������������������������������������������������������������������������������������������������������������������������������������������������������������������������������������������������������������������������������������������������������������������������������������������������������������������������������������������������������������������������������������������������������������������������������������������������������������������������������������������������������������������������������������������������������������������������������������������������������������������������������������������������������������������������������������������������������������������������������������������������������������������������������������������������������������������������������������������������������������������������������������������������������������������������������������������������������������������������������������������������������������������������������������������������������������������������������������������������������������������������������������������������������������������������������������������������������������������������������������������������������������������������������������������������������������������������������������������������������������������������������������������������������������������������������������������������������������������������������������������������������������������������������������������������������������������������������������������������������������������������������������������������������������������������������������������������������������������������������������������������������������������������������������������������������������������������������������������������������������������������������������������������������������������������������������������������������������������������������������������������������������������������������������������������������������������������������������������������������������������������������������������������������������������������������������������������������������������������������������������������������������������������������������������������������������������������������������������������������������������������������������������������������������������������������������������������������������������������������������������������������������������������������������������������������������������������������������������������������������������������������������������������������������������������������������������������������������������������������������������������������������������������������������������������������������������������������������������������������������������������������������������������������������������������������������������������������������������������������������������������������������������������������������������������������������������������������������������������������������������������������������������������������������������������������������������������������������������������������������������������������������������������������������������������������������������������������������������������������������������������������������������������������������������������������������������������������������������������������������������������������������������������������������������������������������������������������������������������������������������������������������������������������������������������������������������������������������������������������������������������������������������������������������������������������������������������������������������������������������������������������������������������������������������������������������������������������������������������������������������������������������������������������������������������������������������������������������������������������������������������������������������������������������������������������������������������������������������������������������������������������������������������������������������������������������������������������������������������������������������������������������������������������������������������������������������������������������������������������������������������������������������������������������������������������������������������������������������������������������������������������������������������������������������������������������������������������������������������������������������������������������������������������������������������������������������������������������������������������������������������������������������������������������������������������������������������������������������������������������������������������������������������������������������������������������������������������������������������������������������������������������������������������������������������������������������������������������������������������������������������������������������������������������������������������������������������������������������������������������������������������������������������������������������������������������������������������������������������������������������������������������������������������������������������������������������������������������������������������������������������������������������������������������������������������������������������������������������������������������������������������������������������������������������������������������������������������������������
������������������������������������������������������������������������������������������������������������������������������������������������������������������������������������������������������������������������������������������������������������������������������������������������������������������������������������������������������������������������������������������������������������������������������������������������������������������������������������������������������������������������������������������������������������������������������������������������������������������������������������������������������������������������������������������������������������������������������������������������������������������������������������������������������������������������������������������������������������������������������������������������������������������������������������������������������������������������������������������������������������������������������������������������������������������������������������������������������������������������������������������������������������������������������������������������������������������������������������������������������������������������������������������������������������������������������������������������������������������������������������������������������������������������������������������������������������������������������������������������������������������������������������������������������������������������������������������������������������������������������������������������������������������������������������������������������������������������������������������������������������������������������������������������������������������������������������������������������������������������������������������������������������������������������������������������������������������������������������������������������������������������������������������������������������������������������������������������������������������������������������������������������������������������������������������������������������������������������������������������������������������������������������������������������������������������������������������������������������������������������������������������������������������������������������������������������������������������������������������������������������������������������������������������������������������������������������������������������������������������������������������������������������������������������������������������������������������������������������������������������������������������������������������������������������������������������������������������������������������������������������������������������������������������������������������������������������������������������������������������������������������������������������������������������������������������������������������������������������������������������������������������������������������������������������������������������������������������������������������������������������������������������������������������������������������������������������������������������������������������������������������������������������������������������������������������������������������������������������������������������������������������������������������������������������������������������������������������������������������������������������������������������������������������������������������������������������������������������������������������������������������������������������������������������������������������������������������������������������������������������������������������������������������������������������������������������������������������������������������������������������������������������������������������������������������������������������������������������������������������������������������������������������������������������������������������������������������������������������������������������������������������������������������������������������������������������������������������������������������������������������������������������������������������������������������������������������������������������������������������������������������������������������������������������������������������������������������������������������������������������������������������������������������������������������������������������������������������������������������������������������������������������������������������������������������������������������������������������������������������������������������������������������������������������������������������������������������������������������������������������������������������������������������������������������������������������������������������������������������������������������������������������������������������������������������������������������������������������������������������������������������������������������������������������������������������������������������������������������������������������������������������������������������������������������������������������������������������������������������������������������������������������������������������������������������������������������������������������������������������������������������������������������������������������������������������������������������������������������������������������������������������������������������������������������������������������������������������������������������������������������������������������������������������������������������������������������������������������������������������������������������������������������������������������������������������������������������������������������������������������������������������������������������������������������������������������������������������������������������������������������������������������������������������������������������������������������������������������������������������������������������������������������������������������������������������������������������������������������������������������������������������������������������������������������������������������������������������������������������������������������������������������������������������������������������������������������������������������������������������������������������������������������������������������������������������������������������������������������������������������������������������������������������������������������������������������������������������������������������������������������������������������������������������������������������������������������������������������������������������������������������������������������������������������������������������������������������������������������������������������������������������������������������������������������������������������������������������������������������������������������������������������������������������������������������������������������������������������������������������������������������������������������������������������������������������������������������������������������������������������������������������������������������������������������������������������������������������������������������������������������������������������������������������������������������������������������������������������������������������������������������������������������������������������������������������������������������������������������������������������������������������������������������������������������������������������������������������������������������������������������������������������������������������������������������������������������������������������������������������������������������������������������������������������������������������������������������������������������������������������������������������������������������������������������
0.0
0.1
0.2
0.3
0.4
0.5
0.6
0.7
0.8
0.9
1.0
1947 1952 1957 1962 1967 1972 1977 1982 1987 1992�������������� Regime 2 Regime 3
���������������� Regime 1Regime 2 Regime 3 Regime 1
FIGURE 4Probabilities of Regimes 1, 2, and 3 under F-V Model
Bergara, Richman, and Spiller.p65 4/3/03, 11:25 AM265

266 Bergara, Richman, and Spiller
TABLE 3Model with Overidentification Parameters
Maximum Likelihood Estimation(t–statistics in parentheses)
Parameter Variable F–V CGK MV PC
g CONSTANT –16.40 –0.938 –6.38 –4.41(–0.81) (–0.19) (–0.57) (–0.70)
d SC 1.43 0.83 0.94 0.95(3.64) (5.51) (3.27) (5.61)
q CONSTANT 0.28 0.19 0.25 0.22(6.53) (3.15) (3.15) (3.22)
b3 IDEOLOGY REGIME 3 0.32 0.80 0.67 0.71(3.06) (4.13) (2.86) (3.70)
su 0.15 0.11 0.13 0.11(2.95) (5.29) (2.75) (3.82)
se 0.04 0.01 0.01 0.01(5.17) (3.42) (1.98) (2.10)
b1/2 POLITICS REGIMES 1 & 2 0.45 –0.93 –0.98 –1.02(2.40) (–15.44) (–6.24) (–9.81)
c1/2 IDEOLOGY REGIMES 1 & 2 0.13 1.58 1.52 1.54(0.98) (6.50) (5.31) (5.86)
Log-Likelihood –51.98 –57.47 –56.59 –57.98Chi-Square Test 3.44 11.23 18.60
Pr. Regime 1 0.27 0.06 0.01 0.03Pr. Regime 2 0.14 0.15 0.08 0.17Pr. Regime 3 0.59 0.79 0.91 0.80
Number of observations: 46
sophisticated and strategic manner. Furthermore, Congress imposespalpable political constraints on the Court, and the constraints derivedfrom Krehbiel’s model and, to a lesser degree, the CGK model seem tocapture the political game more than the other models discussed.
Table 3 provides the results of estimating the model with theoveridentification parameters suggested by Segal and Wang (2001).Table 3 shows that for the F-V model the overidentification restrictionscannot be rejected at standard significance levels.41 Indeed, the parameterc1/2, which reflects the impact of the Court ideology in Regimes 1 and 2, isstatistically insignificant and b1/2, which reflects the role of politics inRegimes 1 and 2, is not statistically different from b3, the parameter for
Bergara, Richman, and Spiller.p65 4/3/03, 11:25 AM266

267Supreme Court Decision Making
ideology in Regime 3. Thus, for the F-V model, the findings fail toreject the overidentification restrictions. These restrictions, however,can be rejected at the 1% level for the other three models.
Under closer examination, Table 3 provides further evidence ofthe misspecification of the CGK, MV, and PC models. First, the coef-ficients of politics in Regimes 1 and 2 are all negative, large, and signifi-cantly different from zero. The attitudinal model would predict them tobe zero, whereas the strategic approach would predict them to bepositive. Second, the estimated ideology parameters for Regimes 1 and2 are all positive, highly significant, and much larger than the ideologyparameter for Regime 3, yet the attitudinal model predicts that theideology parameters for each regime should be the same and the stra-tegic approach predicts them to be statistically insignificant. Finally, asto be expected given their large Pareto sets, the three regimes providesmall estimates of probabilities for Regimes 1 and 2.
In sum, the results reported in Table 3 fail to provide support to theattitudinal model. Although estimates under the CGK, MV, and PC modelsreject the overidentification restrictions, they fail to reject those restrictionsin the way that the attitudinal model predicts (i.e., the coefficient of b1/2should be zero, which it is not, and the coefficients b1/2 and b3 should beequal, which they are not). On the other hand, the F-V model fails to rejectthe overidentification restriction, and the resulting parameters under thismodel are all as expected. We find these results to lend strong support both to thesuperiority of the strategic model over the attitudinal model and to the superiorityof the F-V legislative model over the models used by Segal (1997).
Conclusions
While the journey to develop accurate predictions for SupremeCourt decisions does not end here, this paper supports a sophisticatedunderstanding of the Court’s decision making, one where justices an-ticipate possible congressional action and adjust their actions accordingly.
The results within this paper reconcile, in a way, the long-runningdispute between the attitudinal and the strategic approaches. First, weshow that justices’ ideologies do matter. Second, we show that the Court isoften, but not always, constrained by Congress and the extent to which theCourt is constrained by politics varies significantly over time. And third,when the Court is constrained, it seems to respond strategically.Considering the numerous important policy debates that engage ourbranches of government, we think applying this approach to other politicalgames to understand how different political players exercise theirauthority and how policy outcomes emerge offers a rich research agenda.
Bergara, Richman, and Spiller.p65 4/3/03, 11:25 AM267

268 Bergara, Richman, and Spiller
Mario Bergara is Director, Unidad Reguladora de Servicios deComunicaciones (URSEC), Uruguay 988, CO 11300, Montevideo,Uruguay, Professor of Economics, University of Uruguay, andSenior Economist, Central Bank of Uruguay. Barak Richman is aPh.D. student in Business and Public Policy, Haas School of Business,University of California–Berkeley and is currently a law clerk forJudge Bruce M. Selya, Federal Courthouse Room 311, One ExchangeTerrace, Providence, RI 02903. Pablo T. Spiller is the Joe ShoongProfessor of International Business and Public Policy, Haas Schoolof Business, University of California– Berkeley, Berkeley, CA 94720-1900 and serves as Special Advisor, Bureau of Economics, FederalTrade Commission.
APPENDIX IThe computed values for the Court arising from the other legislative models are
presented in Figures A1, A2, and A3. As in Figure 3, the interval [SC – 2su , SC + 2su]is also plotted, where su is the standard deviation of u. This step is to capture the likelyrange of values for SC.
Figures A1, A2, and A3 illustrate the problems with the other three legislativemodels. Specifically, the models construct Pareto sets that reach beyond the feasible0–100 scale and, as a consequence, tend to impose no palpable constraints on the SupremeCourt. (In some instances, Court ideological scores also violate the 0–100 restriction.) TheMultiple Veto and Party Caucus models are especially problematic. The CommitteeGatekeeping model only briefly extends beyond the 0–100 range and generally imposesreasonable constraints. This model, however, reflects congressional preferences as beingrather chaotic in relation to the Supreme Court’s ideology, whereas it is striking howfluidly the Supreme Court’s preferences match the flow of F-V constraints. The CommitteeGatekeeping model also imposes constraints of very different “widths” during different years.
-20
0
20
40
60
80
100
120
1947 1952 1957 1962 1967 1972 1977 1982 1987 1992
Pred icted S C~ S C~ + 2*s u S C~ - 2 *s u
Hig h(CGK) Lo w(CGK)
FIGURE A1Committee Gatekeeping Model, Predicted SC Scores
High (CGK) Low (CGK)- - - Predicted SC~ SC~ + 2*su SC~ – 2*su
Bergara, Richman, and Spiller.p65 4/3/03, 11:25 AM268

269Supreme Court Decision Making
-100
-50
0
50
100
150
200
250
1947 1952 1957 1962 1967 1972 1977 1982 1987 1992
Predicted SC~ SC~ + 2*su SC~ - 2*su
High(MV) Low(MV)
FIGURE A2Predicted SC Score—Multiple Veto Model
-40
-20
0
20
40
60
80
100
120
140
1947 1952 1957 1962 1967 1972 1977 1982 1987 1992
Predicted SC~ SC~ + 2*su SC~ - 2*su
High(PC) Low(PC)
FIGURE A3Party Caucus Model, Predicted SC Scores
High (PC) Low (PC)- - - Predicted SC~ SC~ + 2*su SC~ – 2*su
High (MV) Low (MV)- - - Predicted SC~ SC~ + 2*su SC~ – 2*su
Bergara, Richman, and Spiller.p65 4/3/03, 11:25 AM269

270 Bergara, Richman, and Spiller
APPENDIX II
Segal (1997) also employs the Segal-Cover (1989) scores as an alternativemeasurement for the Supreme Court’s ideological preference. Our preceding discussioncenters on the constitutional scores since the Segal-Cover scores have been shown tohave important measurement errors (Epstein and Mershon 1996). Nonetheless, weperformed the same econometric analysis using the Segal-Cover scores to impute theSupreme Court’s ideal point, and the results again show a strong influence of congres-sional preferences on Supreme Court decisions. We first report in Table A1 a linearregression of the Court’s percent pro-liberal decisions in statutory cases using theCourt’s ideal point, determined by Segal-Cover scores, and the congressional constraints,as determined by each of the four models for the legislative process.
Like the results with the constitutional scores, the coefficient for the SupremeCourt’s ideology is significant in all four regressions, further weakening the notion ofthe Court as legalistic decision makers. In addition, like the earlier results, Congress’sconstraints generally appear insignificant. Although the high constraint variables appearto be significant in the F-V and Multiple Veto models, the low constraint variables arein the wrong direction. The CGK and Party Caucus models generate similarly unreliableresults. The F-statistics and log-likelihood results also indicate that these linear regressionsdo a poor job of explaining the variance of the Supreme Court’s statutory decisionscompared to the corresponding regressions that use the constitutional scores.
TABLE A1Linear Probability Models across Alternative Political Models,
Using Segal-Cover(t-statistics in parentheses)
Variable F-V CGK MV PC
CONSTANT 0.292 0.345 0.279 0.340(2.93) (4.18) (2.85) (4.11)
SC 0.12 0.15 0.13 0.12(3.20) (3.56) (3.09) (3.00)
Max 0.38 0.13 0.13 0.11(2.08) (1.10) (1.79) (1.29)
Min –0.26 0.14 –0.06 0.12(–1.15) (0.73) (–0.91) (1.18)
R2 0.28 0.25 0.28 0.27
F-statistic 5.58 4.72 5.52 5.16
Standard Error 0.115 0.117 0.115 0.116
Akaike IC –58.44 –56.85 –58.44 –57.64
Number of Observations: 46
Bergara, Richman, and Spiller.p65 4/3/03, 11:25 AM270

271Supreme Court Decision Making
The results of estimating the regime-switching econometric model with the Segal-Cover scores to test strategic behavior by the Supreme Court are shown in Table A2.Here, all four models show the political constraints coefficient to be highly significant.Similarly, the Court’s ideology is also significant, although less so.
In sum, the Segal-Cover scores reveal a Supreme Court that is even moreconstrained than the one whose ideology measure was derived from its constitutionaldecisions, further providing support to the strategic approach. Thus, independent ofthe measure used to estimate the ideological preferences of the Court, congressionalpreferences are shown to have a marked effect on the Supreme Court’s decisions.
TABLE A2The Econometric Model,
Using Segal-Cover Maximum Likelihood Estimates(t-statistics in parentheses)
Parameter Variable F-V CGK MV PC
g CONSTANT 30.0 34.9 52.7 60.0(5.39) (5.95) (3.77) (7.61)
d SC 0.30 0.29 0.47 0.32(2.26) (1.86) (1.97) (1.82)
q CONSTANT 27.2 27.8 32.1 20.9(5.64) (4.18) (4.72) (1.93)
b POLITICS 0.57 0.52 0.26 0.44(3.97) (3.56) (2.40) (2.21)
se 0.05 0.06 0.06 0.08(3.38) (3.06) (2.12) (1.82)
su 0.23 0.23 0.39 0.18(3.07) (2.35) (2.38) (2.11)
Log-Likelihood 37.84 37.077 35.63 37.56
Akaike IC –63.68 –62.15 –59.26 –63.12
Pr. Regime 1 0.16 0.18 0.09 0.15
Pr. Regime 2 0.35 0.27 0.09 0.05
Pr. Regime 3 0.49 0.55 0.82 0.80
Number of Observations: 46
Bergara, Richman, and Spiller.p65 4/3/03, 11:25 AM271

272 Bergara, Richman, and Spiller
APPENDIX III
A potent criticism of ADA scores, despite their widespread use, is that theyconflate votes in both the House and Senate and in different Congresses across time. Amore accurate measure of true ideologies, it is argued, would correct for this problemand allow for more accurate intertemporal and interchamber comparisons. In an extremelyuseful 1999 paper, Groseclose, Levitt, and Snyder (GLS) derive transformations thattranslate a certain ADA score for a given year in a given chamber into an “adjusted”ADA score that allows for such comparisons.
We perform additional estimations using the GLS-adjusted ADA scores andgenerate the results shown in Tables A3 and A4. Similar to the results in Tables 1 and2 above, these results illustrate the importance of the regime-switching methodology,since political constraints are significant in our maximum likelihood estimations but notin the linear models. In addition, the results exhibit the superiority of the F-V model andoffer some support for the effectiveness of the CGK model. In general, the estimationswith the adjusted ADA scores generate coefficients that are qualitatively similar tothose produced from the “raw” ADA scores, adding robustness to the estimation.
TABLE A3Linear Probability Models across Alternative Legislative Models
Using Adjusted ADA Scores( t-statistics in parentheses)
Variable F-V CGK MV PC
CONSTANT 15.98 16.92 11.33 12.58(2.62) (2.49) (1.68) (1.85)
SC 0.68 0.69 0.69 0.67(7.00) (6.64) (7.19) (6.93)
Max –0.05 0.01 0.04 0.05(–0.30) (0.11) (1.02) (0.84)
Min 0.24 0.04 –0.03 0.07(0.94) (0.15) (–0.56) (0.91)
R2 0.58 0.57 0.58 0.59
F-statistic 19.70 18.89 19.69 20.26
Standard Error 0.09 0.09 0.09 0.09
Log-Likelihood 48.95 48.39 48.94 49.33
Number of Observations: 46
Bergara, Richman, and Spiller.p65 4/3/03, 11:25 AM272

273Supreme Court Decision Making
TABLE A4The Econometric Model Using Adjusted ADA Scores
Maximum Likelihood Estimation(t-statistics in parentheses)
Parameter Variable F-V CGK MV PC
g CONSTANT –0.11 –20.39 –48.74 –22.70(–0.63) (–1.20) (–0.47) (–1.21)
d SC 0.98 1.18 2.07 1.52(2.37) (3.07) (0.76) (4.17)
q CONSTANT 0.22 0.28 0.33 0.30(1.94) (4.69) (2.19) (5.84)
b POLITICS 0.82 0.66 0.34 0.40(2.13) (3.68) (0.69) (5.00)
se 0.07 0.06 0.07 0.09(3.26) (3.28) (2.02) (9.54)
su 0.06 0.10 0.13 0.01(1.18) (2.05) (0.46) (1.74)
Log-Likelihood 51.41 48.99 49.45 46.10
Pr. Regime 1 0.17 0.17 0.06 0.17
Pr. Regime 2 0.11 0.21 0.08 0.10
Pr. Regime 3 0.72 0.62 0.86 0.73
Number of Observations: 46
NOTES
This paper was originally written while Spiller was a Visiting Scholar at theCenter for the Study of Institutional Development at the Fundación Gobierno y Sociedad,Buenos Aires, which he thanks for financial support. Barak Richman thanks the JohnM. Olin Center for Law, Economics, and Business at Harvard Law School for itsgenerous support. We would like to thank Jeffrey Segal for providing the data used inthis paper and three anonymous referees for helpful comments.
1. In its applications to the external game faced by the justices, the strategicapproach has been coined the “separation of powers” approach. See Eskridge 1991a.
2. Previous strategic approaches to judicial decision making can be found inMurphy’s (1964) book on judicial strategy and in Dahl’s (1957) suggestion that theselection process of Supreme Court justices caused judicial decisions to reflect thepublic’s policy preferences since voters elected the judge-appointing politicians. See
Bergara, Richman, and Spiller.p65 4/3/03, 11:25 AM273

274 Bergara, Richman, and Spiller
also Funston’s (1975) analysis of the disagreements between the judicial and legislativebranches during “change-over” periods of the Court.
3. The essence of strategic behavior is to consider the consequences of one’sbehavior on rivals’ optimal behavior. In the sequential games commonly used in thisliterature, strategic behavior can be defined as maximizing behavior (with regard topolicy preferences) that is forward-looking, in the sense of anticipating the possibleactions by other policy makers. Supreme Court justices, in acting strategically, antici-pate the subsequent actions of the Court’s other justices ( “games within the Court”)and of the other branches of government (“separation of power games”).
4. That is, they vote their preferences sincerely. For a theoretical analysis ofsincere voting as a dominant strategy within the court, and within groups in general, seeSpiller and Spitzer 1992.
5. Spiller and Gely (1992) found that the Supreme Court was constrained bycongressional policy preferences in labor-relations cases from 1949 to 1988. HoldingCourt composition constant, they determined that Court decisions became increas-ingly more liberal (conservative) as relevant members of Congress became more liberal(conservative).
6. Note, however, that Spiller and Tiller (1996) offer a model where the Courtprovokes a congressional reversal as a way to improve upon its policy outcome. Ingeneral, the strategic approach assumes that the Court can actually forecast whichdecisions would prompt Congress to act. Uncertain or unknown preferences are easilyimplementable. See, for example, Spiller 1992 or Schwartz, Spiller, and Urbiztondo 1994.
7. The figure assumes that the policy space can be represented by a singledimension corresponding to an ideological spectrum where, as in ADA ratings, thelower boundary represents the most extreme conservative policy and the upper bound-ary represents the most extreme liberal policy.
8. This model assumes symmetric preferences, an assumption typical of spatialmodels of this type. Also, although some investigators place the conservative end of aone-dimensional policy spectrum on the right side and place the liberal end on the leftside, we use a different convention here. In later sections, we proxy legislative preferenceswith legislators’ ADA ratings, which give higher values to liberal legislative records.
9. This result is a simple extension of the median voter to constrained environ-ments. Since policy outcomes must fall within the legislative Pareto set, which is therange [S, H] in Figure 1, justices vote for an outcome within [H, S]. In the figure, thepreferred outcome for justices A and B within [S, H] is S, but the preferred outcome forC is H. Thus the median voter outcome is S.
10. The congressional Pareto set contains all possible policies for which a move-ment away from a policy in that set would make either the House or the Senate worseoff. In other words, it comprises the entire set of policies that Congress would not beable to overturn. Conversely, all policies outside the Pareto set would be overturned byCongress and replaced with some other policy within the set.
11. The distinction between statutory and constitutional is not always clear. Asingle case can present the Court with both statutory and constitutional issues, and theCourt has the discretion to base its decision in such a case on either grounds. Moreover,the Court’s majority decision may rest on one type of argumentation (statutory orconstitutional) while concurring justices may have preferred another. Segal (1997)preempts these selection complications by relying on the U.S. Supreme Court Judicial
Bergara, Richman, and Spiller.p65 4/3/03, 11:25 AM274

275Supreme Court Decision Making
Database and defining as constitutional all cases “in which the authority the Court gavefor its decision was judicial review at the national or state level” (35, n. 20). This methodseems, to us at least, a useful and objective way to separate the two kinds of cases.
12. Segal’s dataset does not include individual decisions but rather the percent ofdecisions each year that were pro-liberal. Thus, we cannot correct for individual casecharacteristics and individual ideologies must be translated into a tendency to cast pro-liberal votes in Supreme Court cases. The assumption we make in the text is intendedto perform such a translation.
13. Alternatively, this measure could be interpreted as a preference for 60% ofthe Supreme Court’s decisions to produce a pro-liberal outcome. We use this interpre-tation in the econometric model by averaging across a year.
14. Recall that the strategic model suggests that the Court’s outcomes, in equilib-rium, depend on a single political player, even if the relevant player is different acrossvarying regimes. Our model begins analysis with the preferences of that decisive player.Note that the model operates within the probability space, not the actual liberal/conservative nature of the Court’s decision. Thus, the Court is seen as picking prob-abilities: although the Court picks for each case a pro-liberal or pro-conservative out-come, its preferences, and those of the other players, are characterized by averages.Consequently, the equilibrium probability is independent of actual policies, whichwould not be the case if preferences were characterized by each individual policyoutcome.
15. We assume both that the identity of the critical player, a, remains constantthroughout a given year and that her preferences remain constant through that year. Ofcourse, there have been mid-year changes to both the membership of the Court and themembership of Congress (thus the difference between year t and period k). Thesechanges, however, are sufficiently infrequent and sufficiently inconsequential in chang-ing the identity of the relevant member that assuming Pta to be constant should notaffect our results.
16. To explore the robustness of our findings, we use alternative judicial ideologi-cal scores developed in Segal and Cover 1989 to further test the model. See AppendixII. For a discussion about the ADA ratings’ “artificially extreme” bipolar distribution,see Snyder 1992. Also, see n. 28 of this article.
17. For a further discussion of the calculation of these constitutional scores, seeSegal 1997, 35–36. Because these constitutional scores rely on votes that justices castduring their terms, we believe they may suffer from endogeneity. We review this issuefurther in the section discussing our dataset.
18. Segal claims his final calculated scores range from 5 to 93.3 (1997, 36), but hisoriginal data contain some predicted scores (for individual justices in particular years)that rise above 100 and some that dip below 0. This fact is especially problematic sincethe 0–100 spectrum is supposed to cover all possible ideologies; it calls into questionthe appropriateness of his method for calculating justices’ ideologies. This error doesnot affect our results, however, since we use only the median justice’s score, which isalways within the 0–100 range.
19. Because members of Congress vote on these issues, they are by naturenonconstitutional.
20. One could consider Segal’s conflation of ADA and Supreme Court constitu-tional scores within the same dimension to be the flip side of his mistake in conflating
Bergara, Richman, and Spiller.p65 4/3/03, 11:25 AM275
276 Bergara, Richman, and Spiller
ideological scores with policy outcomes. Segal directly compares ADA scores, SupremeCourt constitutional scores, and policy outcomes to each other. In fact, a transforma-tion is required to relate each one to the others.
21. Consider the following nonlinear transformation: call Segal’s scores S, and letS’ be a one-to-one nonlinear transformation of S that also spans 0–100. It is possible tofind a transformation where S’ < S for the interval 0–50 and S’ > S for the range 50– 100.This transformation has the effect of making most S’ closer to its extreme values. As aconsequence, if we hold the congressional preferences constant, then the values arisingfrom S’ will tend to be closer to the boundaries of the congressional Pareto set than thevalues arising from S will be. As we later discuss in detail, different transformations havevery different implications for whether or not the strategic model is an appropriaterepresentation of judicial decision making. Hence, the choice of transformation is crucial,and there is no reason why Segal’s (1997) transformation is an appropriate one.
22. The transformation allows a direct comparison between the judicial ideologi-cal values and the ADA legislative scores. Furthermore, our approach avoids the prob-lem of relying on a given value to reflect an essentially unobservable judicial ideology.Our model instead offers a probability distribution of ideal points for the SupremeCourt along an ADA scale. See Spiller and Gely 1992 for a fuller discussion of con-structing this latent variable.
23. Because the ADA ratings are constrained within the 0–100 range, the nor-mality assumption of u may not be appropriate. An alternative transformation of theleft-hand-side variable could be designed but would not allow for a straightforward testof Segal’s assumption of similarity between the two levels.
24. To see the bias formally, substitute, in the case of Regime 1 (SC > Max),Equation (10) into (9). Rearranging terms yields the following equation: PL = a + p *Max – p * SCi + e. Recall that justices in Regime 1 are more liberal than Congress and,according to the strategic approach, would cast votes at the most liberal end of thecongressional Pareto set. The Max variable, which represents the most liberal endpoint,appropriately reflects the constraints imposed by Congress. Thus, under the strategicapproach and for a justice in Regime 1, an increase in Max produces an increase in theprobability of a liberal vote PL when SC is held constant. That is, if PL were regressedon Max, then the coefficient p would be positive and statistically significant. Yet thesecond variable, SCi, which measures a justice’s sincere preferences, is also in theregression equation and should not affect PL because the sample is selected so that SCexceeds Max. Since in the equation—and we arrive at this assertion by direct construc-tion from (10)—Max and SCi share the same coefficient p, the regression would estimatea single value for the coefficient shared by the two variables even though they shouldgenerate coefficients of different values. The estimated parameter p is an average betweenzero and the value of the coefficient that would be generated (in the case of a justice inRegime 1) if PL were regressed only on the explanatory variable Max. Consequently,the regression biases the estimated parameter p toward zero. A similar analysis showsthat the same bias toward zero exists for Regime 2.
25. The median voter theorem is indeterminate in terms of how each playervotes. The theorem simply specifies that the median voter policy is the only equilibriumto the game, thus a majority must support it. Whether the outcome will be supportedunanimously or by a large or thin majority is unspecified. Thus, we can only inferbehavior by the median justice, who indeed must support the Court’s decision.
Bergara, Richman, and Spiller.p65 4/3/03, 11:25 AM276

277Supreme Court Decision Making
26. The Multiple Veto model, for example, produces Pareto sets that have botha lower boundary below zero and an upper boundary above 100 for 32 of the 46 yearsstudied. If this model accurately depicted congressional behavior, then Congress wouldhave been unable to overturn any Supreme Court decision, no matter how radical, fornearly two-thirds of all years after World War II. But one could say something evenmore striking: since these are essentially legislative models, they imply that Congresswould be unable to legislate at all (at least over judiciary matters) during two-thirds ofall such years, as any status quo would always fall in the gridlock area. Such a prospectseems not only unlikely but is factually wrong. The Party Caucus model is onlyslightly better at offering feasible Pareto sets, still yielding impossible Pareto sets for27 of the 46 years. The Committee Gatekeeping model is a further improvement butgenerates impossible sets twice. The inadequacies of the legislative models explainSegal’s observation that very few justices appear to be constrained from 1947 to 1992.We further find it unlikely that Congress and the individual justices share such ideologicalagreement—i.e., that so few justices would have policy preferences with which Congresswould disagree. We note that a 0–100 Pareto set would not imply gridlock in legislativeissues where there is no identifiable status quo and where new legislation is a Paretoimprovement for all of Congress.
27. In fact, he observes that his testing for political constraints is limited becauseso many justices in his analysis appear to be in Regime 3. This pattern could simply bethe result of the wrong assignment of regimes.
28. ADA measures are not without their faults. In particular, they are calculatedfrom a small set of votes, they tend to use narrow majority votes, and a “no-vote” isequivalent to a vote in favor of the conservative position. They also have a bimodaldistribution, which is at odds with other measurements of congressional preferences.See Snyder 1992. To address some of these criticisms, and to test the robustness of ourfindings, we also perform the empirical tests using adjusted ADA scores, as perGroseclose, Levitt, and Snyder 1999, which smooth ADA scores across time andchambers. See Appendix III.
29. We acknowledge some concern that these constitutional scores may beendogenous. Cases could be argued and decided on constitutional grounds, yet thedecision might be influenced by congressional composition. Consequently, these con-stitutional scores may not be independent from congressional composition (see Spillerand Spitzer 1992). Spiller and Gely (1992) avoid this problem by using the percentageof Democrats on the Court as a proxy for Court preferences. While this tactic solves theproblem of endogeneity, it yields a parameter that is not very precise. We considerSegal’s (1997) constitutional scores to be strong, albeit imperfect, indices for the justices’ideologies. Although problems of endogeneity must be considered, and we still welcomefuture efforts to measure justices’ ideologies, we proceed here with the constitutionalscores for our analytical purposes.
Segal and Cover’s scores (1989) are another innovative attempt to measure thejustices’ ideologies while avoiding the problem of endogeneity. Unfortunately, Epsteinand Mershon (1996) have shown these scores to contain measurement error despitetheir assured independence and relative success in predicting decisions. Nonetheless,we also apply our econometric model to the Segal-Cover scores. See Appendix II.
30. With each justice’s ideology being an unobserved latent variable, it is notstraightforward to determine with certainty who the median justice is. Here, we implicitly
Bergara, Richman, and Spiller.p65 4/3/03, 11:25 AM277

278 Bergara, Richman, and Spiller
assume that the constitutional scores capture the “right” order of justices. We also notethat the proxy variable is not as precise as collecting data from the Court’s actualdecisions. Since, however, our aim is to use an improved technique with the data usedby Segal (1997), we must remain committed to that dataset, which only contains pro-liberal votes for individual justices.
31. Our use of aggregate data does not mean we do not recognize that strategicbehavior by political actors often varies from issue to issue. On the contrary, we predictthat such “individualized” strategies have general, predictable trends, and aggregatedata, while perhaps not adequate to characterize certain one-time behavior with greatprecision, should capture these tendencies sufficiently to test refutable hypotheses.
32. We used several starting values to be sure we obtained a good estimation. TheSegal data are presented as annual averages. Thus, focusing on the median justices limitsthe available observations to 46. Although in principle more observations are betterthan less, note that the model exclusively estimates six parameters, including standarddeviations and constants. Thus, there are ample degrees of freedom, even for a switch-ing-regime model. The robustness of the results presented here buttresses this point.
33. Recall that d measures how a one-point increase in the Court’s constitutionalscore affects its expected ideology in the ADA dimension. Similarly, b measures how aone-point increase in the relevant player’s ideology affects the probability of a pro-liberal Supreme Court decision.
34. This result is obtained from the estimated values for the coefficient, b, shownin Table 2. A value of 0.66, for example, means that a 10-point increase in the decisiveplayer’s ideological score translates into a 6.6% increase in the pro-liberal percent ofannual Court decisions.
35. To have a preliminary test of the robustness of the results, we developedanalogous maximum likelihood regressions using the Segal-Cover scores of the SupremeCourt preferences. These additional estimations, shown in Appendix II, illustrate thatthe main qualitative results persist when using an alternative set of scores for justices’ideologies.
36. We obtain these results from the estimated probabilities for Regimes 1, 2, and3, shown in Table 2.
37. The interval [ SC – 2su , SC + 2su] is also plotted, where su is the standarddeviation of u. This step is to capture the likely range of values for SC .
38. In the 1950s and late 1970s through 1980s, the Court’s estimated ideologicalscore was close to the conservative boundary of the Congressional Pareto set, so theprobability of actually being constrained was higher then than during the 1960s and1970s.
39. The resulting estimation for the constant g is more difficult to interpret,however. It is estimated to be –12.8, which is far from zero, but that value is notstatistically significant.
40. The other models, though, provide less support for this result.41. The chi-square test with two degrees of freedom has the following values for
.10, .05, and 0.01 significance levels: 4.605, 5.991, and 9.21.
Bergara, Richman, and Spiller.p65 4/3/03, 11:25 AM278

279Supreme Court Decision Making
REFERENCES
Akaike, Hirotsugu. 1974. “A New Look at the Statistical Model Identification.” IEEETransaction on Automatic Control AC–9, 716–23.
Chi, P., and C.T. Russell. 1999. Statistical Methods for Data Analysis in Space Physics.Computer Based Learning Unit, University of Leeds, West Yorkshire, England.
Dahl, Robert A. 1957. “Decision-Making in a Democracy: The Supreme Court as aNational Policy-Maker.” Journal of Public Law 6:179–295.
Epstein, Lee, and Jack Knight. 1995. “Positive Approaches to Supreme Court Deci-sion Making.” Presented at the annual meeting of the Midwest Political ScienceAssociation, Chicago.
Epstein, Lee, and Jack Knight. 1998. The Choices Justices Make. Washington: CQ Press.Epstein, Lee, and Carol Mershon. 1996. “Measuring Political Preferences.” American
Journal of Political Science 40:261–94.Epstein, Lee, and Thomas G. Walker. 1995. “The Role of the Supreme Court on
American Society: Playing the Reconstruction Game.” In Contemplating Courts,ed. Lee Epstein. Washington, DC: CQ Press.
Eskridge, William N., Jr. 1991a. “Overriding Supreme Court Statutory InterpretationDecisions.” Yale Law Journal 101:825–41.
Eskridge, William N., Jr. 1991b. “Reneging on History? Playing the Court/Congress/President Civil Rights Game.” California Law Review 79:613–84.
Funston, Richard. 1975. “The Supreme Court and Critical Elections.” American PoliticalScience Review 69:795–811.
Gely, Rafael, and Pablo T. Spiller. 1990. “A Rational Choice Theory of Supreme CourtStatutory Decisions with Applications to the State Farm and Grove City Cases.”Journal of Law, Economics, and Organization 6:263–300.
Groseclose, Timothy, Steven D. Levitt, and James M. Snyder, Jr. 1999. “ComparingInterest Group Scores across Time and Chambers: Adjusted ADA Scores for theU.S. Congress.” American Political Science Review 93:33–50.
Harvey, Andrew C. 1981. Time Series Models. New York: Wiley.Krehbiel, Keith. 1998. Pivotal Politics: A Theory of U.S. Lawmaking. Chicago, IL:
University of Chicago Press.Marks, Brian A. 1988. “A Model of Judicial Influence on Congressional Policymaking:
‘Grove City College v. Bell.’” Working Paper in Political Science P-88-7, HooverInstitution.
Murphy, Walter F. 1964. Elements of Judicial Strategy. Chicago, IL: University ofChicago Press.
Pritchett, C. Herman. 1941. “Divisions of Opinion among Justices of the SupremeCourt, 1939–1941.” American Political Science Review 35:890–98.
Pritchett, C. Herman. 1948. “The Roosevelt Court: Votes and Values.” American PoliticalScience Review 42:53–67.
Schubert, Glendon A. 1965. The Judicial Mind: The Attitudes and Ideologies of SupremeCourt Justices, 1946–1963. Evanston, IL: Northwestern University Press.
Schwartz, Edward P. 1992. “Policy, Precedent, and Power: A Positive Theory ofSupreme Court Decision-Making.” Journal of Law, Economics, and Organiza-tion 8:219–52.
Bergara, Richman, and Spiller.p65 4/3/03, 11:25 AM279

280 Bergara, Richman, and Spiller
Schwartz, Edward P., Pablo T. Spiller, and S. Urbiztondo. 1994. “A Positive Theoryof Legislative Intent.” Law and Contemporary Problems 57:51–74.
Segal, Jeffrey A. 1997. “Separation-of-Powers Games in the Positive Theory ofCongress and Courts.” American Political Science Review 91:28–44.
Segal, Jeffrey A., and Albert D. Cover. 1989. “Ideological Values and the Votes of U.S.Supreme Court Justices.” American Political Science Review 83:557–65.
Segal, Jeffrey A., Lee Epstein, Charles M. Cameron, and Harold J. Spaeth. 1995.“Ideological Values and the Votes of U.S. Supreme Court Justices Revisited.”Journal of Politics 57:812–23.
Segal, Jeffrey A., and Harold J. Spaeth. 1993. The Supreme Court and the AttitudinalModel. New York: Cambridge University Press.
Segal, Jeffrey A., and C-L. Wang. 2001. “Inducing Apparently Strategic Behavior inModels of Bounded Discretion: The Case of Regime-Change Switching Re-gressions.” Presented at the annual meeting of the American Political ScienceAssociation, San Francisco.
Snyder, James M., Jr. 1992. “Committee Power, Structure-Induced Equilibria, andRoll Call Votes.” American Journal of Political Science 36:1–30.
Spiller, Pablo T. 1992. “Agency Discretion under Judicial Review.” Mathematical andComputer Modeling 16:185–200.
Spiller, Pablo T. 1996. “A Positive Political Theory of Regulatory Instruments—Contracts, Administrative Law or Regulatory Specificity.” Southern Califor-nia Law Review 69:477–515.
Spiller, Pablo T., and Rafael Gely. 1992. “Congressional Control or Judicial Indepen-dence: The Determinants of U.S. Supreme Court Labor-Relations Decisions,1949–1988.” Rand Journal of Economics 23:463–92.
Spiller, Pablo T., and Matthew L. Spitzer. 1992. “Judicial Choice of Legal Doctrines.”Journal of Law, Economics, and Organization 8:8–46.
Spiller, Pablo T., and Emerson H. Tiller. 1996. “Invitations to Override: Congres-sional Reversals of Supreme Court Decisions.” International Review of Lawand Economics 16:503–21.
Bergara, Richman, and Spiller.p65 4/3/03, 11:25 AM280