modeling the impact of lifestyle on health at scale
TRANSCRIPT
Modeling the Impact of Lifestyle on Health at Scale
Adam SadilekDept. of Computer Science
University of RochesterRochester, NY, USA
Henry KautzDept. of Computer Science
University of RochesterRochester, NY, USA
ABSTRACTResearch in computational epidemiology to date has concen-trated on estimating summary statistics of populations andsimulated scenarios of disease outbreaks. Detailed studieshave been limited to small domains, as scaling the meth-ods involved poses considerable challenges. By contrast, wemodel the associations of a large collection of social and envi-ronmental factors with the health of particular individuals.Instead of relying on surveys, we apply scalable machinelearning techniques to noisy data mined from online socialmedia and infer the health state of any given person in anautomated way. We show that the learned patterns can besubsequently leveraged in descriptive as well as predictivefine-grained models of human health. Using a unified statis-tical model, we quantify the impact of social status, exposureto pollution, interpersonal interactions, and other importantlifestyle factors on one’s health. Our model explains morethan 54% of the variance in people’s health (as estimatedfrom their online communication), and predicts the futurehealth status of individuals with 91% accuracy. Our meth-ods complement traditional studies in life sciences, as theyenable us to perform large-scale and timely measurement,inference, and prediction of previously elusive factors thataffect our everyday lives.
Categories and Subject DescriptorsH.1.m [Information Systems]: Miscellaneous
General TermsAlgorithms, Experimentation, Human Factors
KeywordsOnline social networks, machine learning, computational epi-demiology, ubiquitous computing, geo-temporal modeling
Permission to make digital or hard copies of all or part of this work forpersonal or classroom use is granted without fee provided that copies arenot made or distributed for profit or commercial advantage and that copiesbear this notice and the full citation on the first page. To copy otherwise, torepublish, to post on servers or to redistribute to lists, requires prior specificpermission and/or a fee.WSDM’13, February 4–8, 2013, Rome, Italy.Copyright 2013 ACM 978-1-4503-1869-3/13/02 ...$15.00.
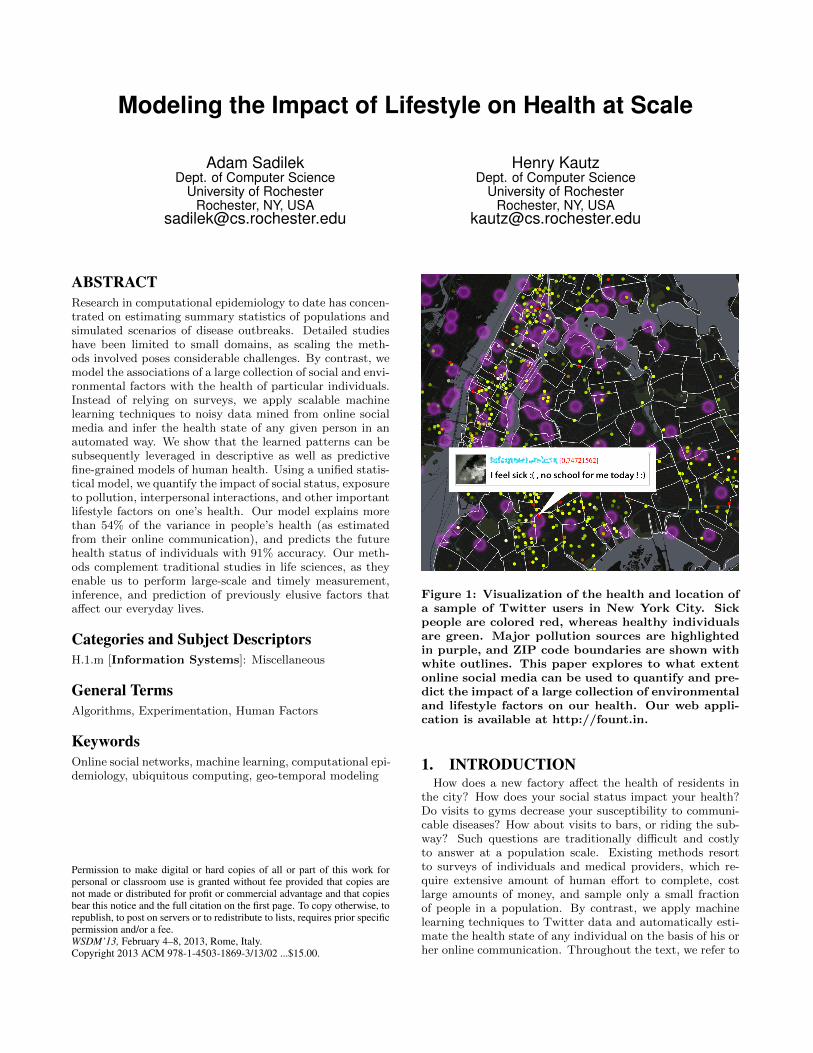
Figure 1: Visualization of the health and location ofa sample of Twitter users in New York City. Sickpeople are colored red, whereas healthy individualsare green. Major pollution sources are highlightedin purple, and ZIP code boundaries are shown withwhite outlines. This paper explores to what extentonline social media can be used to quantify and pre-dict the impact of a large collection of environmentaland lifestyle factors on our health. Our web appli-cation is available at http://fount.in.
1. INTRODUCTIONHow does a new factory affect the health of residents in
the city? How does your social status impact your health?Do visits to gyms decrease your susceptibility to communi-cable diseases? How about visits to bars, or riding the sub-way? Such questions are traditionally difficult and costlyto answer at a population scale. Existing methods resortto surveys of individuals and medical providers, which re-quire extensive amount of human effort to complete, costlarge amounts of money, and sample only a small fractionof people in a population. By contrast, we apply machinelearning techniques to Twitter data and automatically esti-mate the health state of any individual on the basis of his orher online communication. Throughout the text, we refer to

the frequency of self-reports of sickness in a user’s Twitterupdates as user’s health estimate or simply user’s health forbrevity.
By leveraging the text of geo-tagged tweets, along withthe social network structure, we quantify the interplay be-tween a number of important factors and human health. Weconsider environmental and socioeconomic factors (such aspollution, education, and poverty), as well as social aspectsof life (such as encounters and friendships with sick people).Furthermore, we do this at no cost, and without any activeuser participation. This enables us to operate with a signif-icantly larger number of subjects than previous work in lifesciences.
For instance, every thirtieth resident of New York Cityappears in our dataset.1 Since Twitter users do not, in gen-eral, constitute a representative sample of a population, itis unknown to what extent our results generalize to peoplewho do not participate in online social media. Nonetheless,as we will see, the patterns we find are in agreement withprevious epidemiological work. Even if it turns out thatthe mechanisms we explore here operate in a fundamentallydifferent way within the population at large, our methodsstill capture a considerable fraction of people. Globally, theprevalence of social media usage is significant, and is increas-ing: 13% of online adults use Twitter, most of them dailyand often via a phone [39].
As a result, this large online population creates a vast “or-ganic” sensor network composed of individuals reporting ontheir activities, social interactions, and events around them.All of this activity streams in real-time and is often anno-tated with context including GPS location and images. Inthis work, we leverage this sensor network to model publichealth. We capture this important domain in a unified sta-tistical model that measures the impact of various aspectsof people’s behavior on their health, and allows us to controlfor a number of confounding factors. Specifically, we showthe following:
• Features mined from social media account for up to54% variance in health of individual Twitter users.
• Physical proximity to pollution sources negatively im-pacts public health in a measurable way.
• One’s online social status has a definite positive asso-ciation with one’s health.
• Encounters and social ties with ill individuals have alarge negative impact on one’s health.
• The quality of one’s neighborhood is associated withone’s health.
• One’s health state revealed on Twitter can be pre-dicted across individuals with 91% accuracy on thebasis of geospatial and relationship data inferred fromthe Twitter stream.
2. SIGNIFICANCE OF RESULTSConsider the amount of resources and human effort re-
quired to determine how complex social and environmen-tal factors affect the health of millions of people in a largemetropolitan area. This paper demonstrates that the ex-penditure can be, in fact, negligible when we concentrateon users of online social media. We show that fine-grained
1More than 19 million people live in the NYC metropolitanarea: http://www.census.gov/popest/metro/
Figure 2: This figure shows the health status of peo-ple within a social network of the user u at the cen-ter. Each edge represents one of u’s friendships, andthe color denotes the health of the correspondingfriend. Note the patterns in geographical as well associal distribution of sickness. For instance, friendson the east side of the Hudson River tend to besicker than friends from Manhattan. Is this due toan outbreak of flu in the New Jersey school district?Or is it because the sick individuals lead more stress-ful lives? In this work, we begin to tease these inti-mately tied factors apart.
signals mined from online social media complement tradi-tional coarse-grained offline data, such as census statistics.We view the methods described in this paper as the firststep towards real-time public health analysis that enablesindividuals as well as public officials to make more informeddecisions.
3. MOTIVATIONA large body of research in life sciences studied the effect
of a variety of factors on animal and human health. For in-stance, researchers have established that, among monkeys,immune function can be directly influenced by social status.Experimentally controlled manipulations in social rank werefound to lead to widespread changes in gene expression re-lated to immune function. Social rank and immune functionwere found to be directly correlated, i.e., better social statusyields a stronger immune system, as measured by countinganti-bodies in blood samples [42].
Proximity to“green”places, such as urban parks, has beenlinked to improved resistance to allergies [21] and reduc-tion in stress [40]. Another study showed that even theshort-term improvement of pollution levels during BeijingOlympics has a measurable impact on people’s health [33].
However, most experiments in this space involved rela-tively small numbers of individuals—typically less than a
hundred, rarely thousands such as the NHLBI-MESA Studyinvolving 6,500 subjects [5]. Furthermore, because of theamount of human effort required in these controlled stud-ies (physical setup, drawing blood samples, analysis requir-ing expensive equipment etc.), the results and insights comewith a significant cost and delay. Additionally, ethical con-straints preclude arbitrary controlled experiments with hu-man subjects.
As a result, many important mechanisms remain poorlyunderstood. For example, the link between social status andincreased risk of contracting an infectious disease in humansstill presents an open question [37]. Parts of the puzzle havebeen solved. Stress has been found to increase the incidenceof common cold, mononucleosis [10], and to activate latentviruses [1]. However, the overall picture remains unclearand incomplete. In this paper, we propose a complementaryapproach to the traditional small-scale biological and soci-ological studies. By applying machine learning techniquesto large-scale data mined from online social networks, wecan quantify the impact of a large collection of social andenvironmental factors on human health. Since our modelsare fully unsupervised, they can be updated in real-time asnew data and evidence come in.
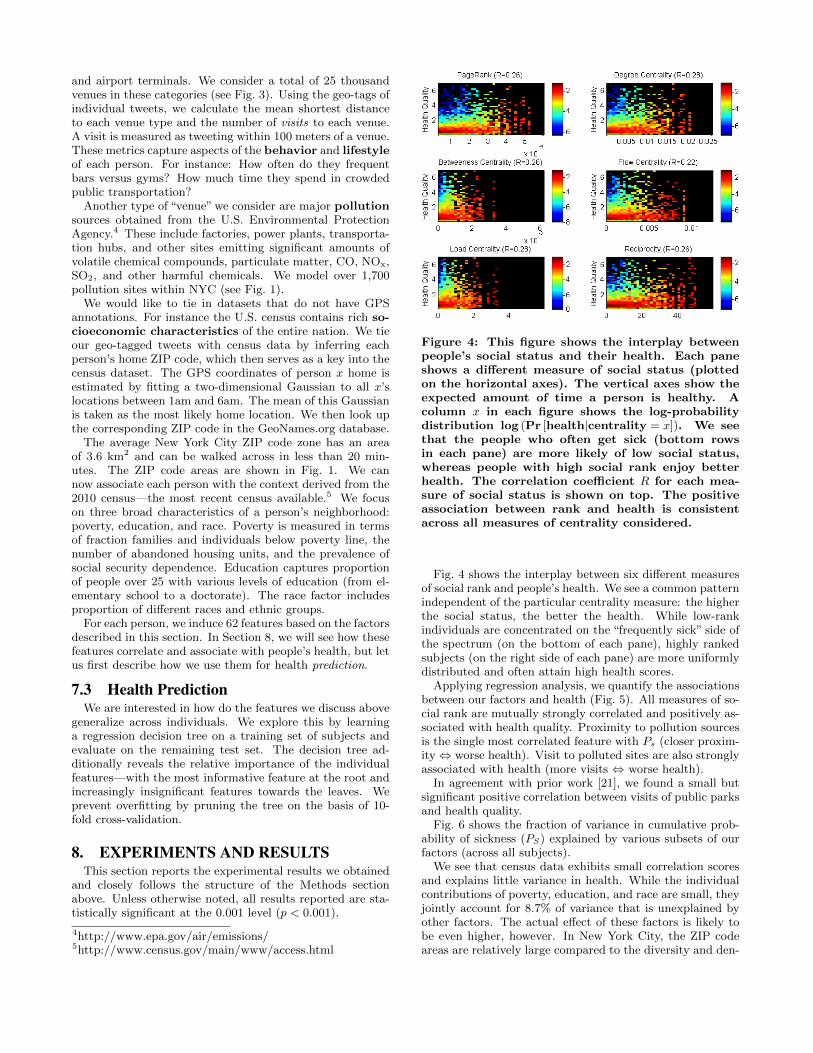
Let us give a concrete example of how we model the as-sociation between social status and health. In this work, wemeasure a person’s social status by network properties, suchas PageRank, reciprocity of their relationships, and variouscentrality measures, as well as by features derived from userinteractions, e.g., how many times a person’s messages getforwarded or “liked”, how many times people mention theperson’s name. As a proxy for the strength of an immunesystem of any given person, we use the number of days theperson indicates an illness in their online communication. Inagreement with [42], we find a strong negative correlation(R = −0.27, p� 0.0001) between people’s social status andthe frequency with which they get sick (Fig. 4).
Social status is just one of more than sixty factors affect-ing human health we consider in this paper. These includediverse features ranging from intensity of contact with illindividuals to pollution exposure.
The United States has the world’s largest health inequal-ity across society, where the gap of life expectancy of themost and the least advantaged segments of the populationis over 20 years [41]. It has been reported that this differ-ence is partly due to differences in social status, but manyaspects of the phenomenon remain unexplained [37]. Thelevel of detail and timeliness of the signals we mine frompeople’s online social activities enable us to capture a num-ber of confounding factors that were previously invisible.
For instance, we can explore complex geographical, envi-ronmental, and social patterns with fine-granularity and ata large scale as shown in Fig. 2. By fusing this informationwith public data on pollution sources within a single view,we can begin to quantify the emergent patterns (Fig. 1).This is specific example of our vision of the future of publicand personal health management enabled by an automatedunification of public and personal data sets. As a result, ourwork allows governments as well as individuals to model andunderstand the interplay between health, location, environ-ment, and social factors more effectively.
Before we dive into the details of our approach, we willdiscuss the limitations that apply to any indirect method ofmodeling public health.
4. LIMITATIONSThis paper describes our approach to public health mod-
eling that we view as a complement to existing work inepidemiology. Any given dataset carries with it a set ofbiases and our Twitter dataset is no exception. For exam-ple, younger people and minorities are disproportionatelypresent on Twitter as compared to the overall makeup ofthe population [39]. The results of this study apply directlyto the health of Twitter users inferred from their online com-munication. The health state of each user is captured withina gradient from “sick” to “healthy” with respect to influenza-like illness, but does not further distinguish between specifickinds of ailments. Some users may never self-report (sto-ics) and others may report being sick when they are not(hypochondriacs). We remove some of this bias by countingthe sick days for each user, but ground truth is required tocontrol for this effect more explicitly.
Our models are exposed to much noisier data than onefinds in a typical survey in life sciences. One componentof the noise comes from the text classification process, butevaluation on a held-out set shows that it’s small. Addi-tional noise is in the location data and its interpretation.For example, a person tweeting on a sidewalk in front of abar may be recorded as“visiting” the bar. In most instances,it is next to impossible to determine whether he actually didvisit the venue from Twitter data alone. To some extent, wemitigate the rate of false positives by capturing each factorin a number of complementary ways. For example, we alsorecord the distance to the nearest bar and the mean distanceto all bars.
While people do not tweet from every location they visitand do not declare every friend online, much of the missingdata can be “filled in” by data mining their past behavior[4, 8, 34]. We note that currently used methods suffer fromsimilar confounding effects. For example, infected peoplewho do not visit a doctor, or do not respond to surveys arevirtually invisible to the traditional methods. Similarly, ef-forts such as Google Flu Trends can only observe individualswho search the web for certain types of content when sick.A fully comprehensive coverage of a population will requirea combination of diverse methods, and application of AItechniques—like the ones presented in this work—capableof inferring the missing information. An important part ofour future work, as described at the end of this paper, is tostudy how estimates based on Twitter users can be adjustedto reflect properties of the general population.
5. DATAOur experiments are based on data obtained from Twitter,
a popular micro-blogging service where people post messageupdates at most 140 characters long. The forced brevity en-courages frequent mobile updates, as we show below. Rela-tionships between users on Twitter are not necessarily sym-metric. One can follow (subscribe to receive messages from)a user without being followed back. When users do recipro-cate following, we say they are friends on Twitter. There isanecdotal evidence that Twitter friendships have a substan-tial overlap with offline friendships [20]. Twitter launchedin 2006 and has been experiencing an explosive growth sincethen. As of April 2012, over 500 million accounts are regis-tered on Twitter.

Figure 3: A snapshot of Twitter activity overlaid ontop New York City public transit map. By merginggeo-tagged tweets with the known locations of tran-sit routes, we can model the impact of public transitusage on the health of specific individuals.
Using the Twitter Search API2, we collected a sample ofpublic tweets that originated from the New York City (NYC)metropolitan area. The collection period was one monthlong and started on May 19 2010, shortly after U.S. Cen-sus 2010 data has been recorded. We periodically queriedTwitter for all recent tweets within 100 kilometers of theNYC city center in a distributed fashion. Altogether, wehave logged nearly 16 million tweets authored by more than630 thousand unique users. To put these statistics in con-text, the entire NYC metropolitan area has an estimatedpopulation of 19 million people. Since this work studies theeffects environment, location, and co-location have on hu-man health, we concentrate on users that posted more than100 GPS-tagged tweets during the one-month data collec-tion period. We refer to them as geo-active users, and ourdataset contains 6,237 such individuals.
5.1 User PrivacyOur research demonstrates that much can be inferred and
predicted about specific individuals. This allows users withopen profiles to consider the implications of such settingand enables them to make an informed decision about theironline behavior. Our methods are useful at an anonymizedlevel as well, as they can extract aggregate information fromindividuals for the benefit of others. For example, we showthat one’s social status is significantly tied with one’s health.Government officials as well as public advocacy groups canuse such insights to make a stronger case for a policy change.Personalized results can be reported directly to the authen-ticated user.
We recognize that there are substantial privacy questionsahead. We believe the issues ultimately reduce to a cost-benefit analysis. Specifically, by quantifying the trade-offsbetween the value our automated systems create versus lossof user privacy. In the future, we envision each person willbe able to set—either explicitly or implicitly via an auctionscheme—a dollar valuation on his or her privacy, and onlineservices will take that preference into account when collect-ing, analyzing, and using customer data. In one extreme,one may decide to risk sharing all data, make money on it,and get more personalized services. On the other hand, one
2http://search.twitter.com/api/
may set tight privacy filters and pay for online services. Thismay lead to a new open marketplace with public data [3].
6. BACKGROUNDSupport vector machine (SVM) is an established model
of data in machine learning [12]. We learn an SVM for lin-ear binary classification to accurately distinguish betweentweets indicating the author is afflicted by an ailment andall other tweets.
Linear binary SVMs are trained by finding a hyperplanedefined by a normal vector w with the maximal margin sep-arating it from the positive and negative datapoints. Find-ing such a hyperplane is inherently a quadratic optimizationproblem given by the following objective function
minw
λ
2||w||2 + L(w,D), (1)
where λ is a regularization parameter controlling model com-plexity, and L(w,D) is the hinge-loss over all training dataD given by
L(w,D) =∑i
max(
0, 1− yiwTxi). (2)
The optimization problem in Equation 1 can be solvedefficiently and in a parallel fashion using stochastic gradientdescend methods [38].
Class imbalance, where the number of examples in oneclass is dramatically larger than in the other class, compli-cates virtually all machine learning. For SVMs, prior workhas shown that transforming the optimization problem fromthe space of individual datapoints 〈xi, yi〉 in matrix D toone over pairs of examples
⟨x+i − x
−j , 1
⟩yields significantly
more robust results [23]. (x+i denotes feature vectors fromthe positive class (yi = +1), whereas x−j denotes negativelylabeled data points (yj = −1).) This method is often re-ferred to as ROC Area SVM because it directly maximizesthe area under the ROC curve of the model.
Measures of centrality mathematically capture the“im-portance” of a node in a (social) network. Some measures,such as degree centrality, are local and depend only on theimmediate neighborhood of a node. Other methods, includ-ing PageRank and betweenness centrality, capture the globalproperties of the network as well. For an excellent gen-eral overview of computational analysis of social networksat large see [15].
Regression analysis is a statistical technique of quanti-fying the relationship between one or more independent vari-ables and a dependent response variable. In this work, weapply regularized least-squares regression model with elasticnet algorithm [45]. This formalism encourages grouping ofstrongly correlated independent variables, and enables vari-able selection in a principled way.
Decision trees are models of data encoded as rules in-duced from examples [6]. Intuitively, in our domain, a de-cision tree represents a series of questions that need to beasked and answered in order to estimate the health qualityof a person, based on his or her attributes and contextualfeatures. During decision tree learning, features are evalu-ated in terms of information gain with respect to the labelsand the best candidates are subsequently selected for eachinner node of the tree. Our implementation uses regressiondecision trees, where each leaf contains a continuous label.

As described below, we also employ decision trees for fea-ture selection, since they intrinsically rank features by theirinformation content.
7. METHODSThis section presents the methods we use to quantify and
predict people’s health from their location and activitiesrecorded online. In short, we begin by inferring the healthstate of any given Twitter user on the basis of the contentof his or her online communication. We then data minea large collection of features for each individual. The fea-tures jointly describe the context of people’s lives in terms oflocation, their environment, and social activities. We sub-sequently capture the associations between the contextualfeatures and people’s health via statistical analysis. Finally,we explore the predictability of health from the induced fac-tors. The following subsections describe each of these stepsin detail.
7.1 Health State InferenceWe build upon previous work on classification of short
text messages [13, 31, 35] and learn a support vector ma-chine classifier C that accurately identifies tweets that indi-cate their author is ill. C is trained by directly optimizingthe area under the ROC curve, as is therefore robust evenin the presence of strong class imbalance, where for everyhealth-related message there are more than 1,000 irrelevantones. We use C to distinguish between tweets indicating theauthor is afflicted by an ailment (we call such tweets “sick”),and all other tweets (called “other” or “normal”).
As SVM features, we use all unigram, bigram, and trigramword tokens that appear in the training data. For example,a tweet “I feel sick.” is represented by the following featurevector: (
i, feel, sick, i feel, feel sick, i feel sick).
Overall, our SVM operates in more than 1.7 million dimen-sions, where each dimension represents a word or a phraseextracted from training data. Before tokenization, we con-vert all text to lower case, strip punctuation and specialcharacters, and remove mentions of user names (the“@”tag)and re-tweets (analogous to email forwarding). However, wedo keep hashtags (such as “#sick”), as those are often rele-vant to the author’s health state, and are particularly usefulfor disambiguation of short or ill-formed messages. Table 1lists examples of significant features found in the process oflearning C.
We use the SVM cascade learning procedure described in[35]. Evaluation of C on a held-out set shows 0.98 precisionand 0.97 recall with respect to labels agreed upon by humanannotators. Ground truth for each tweet was obtained byasking five Amazon Mechanical Turk workers to label thetweet as either “sick” or “other” and subsequently extractingthe majority vote.
7.2 Modeling Associations:Environment, Lifestyle, and Health
From the online activities of each geo-active user, we minea number of features that describe the context of his or herlife in terms of location, environment, and social interac-tion. We describe the health of individuals using two ran-dom variables: the expected number of sick days, and the
Positive Features Negative FeaturesFeature Weight Feature Weight
sick 0.9579 sick of −0.4005headache 0.5249 you −0.3662flu 0.5051 lol −0.3017fever 0.3879 love −0.1753feel 0.3451 i feel your −0.1416coughing 0.2917 so sick of −0.0887being sick 0.1919 bieber fever −0.1026better 0.1988 smoking −0.0980being 0.1943 i’m sick of −0.0894stomach 0.1703 pressure −0.0837and my 0.1687 massage −0.0726infection 0.1686 i love −0.0719morning 0.1647 pregnant −0.0639
Table 1: Examples of positively and negativelyweighted significant features of our SVM model C.
normalized cumulative probability mass of sickness given by
PS =1
|M |∑t∈M
Pr[t is sick
],
where M is the set of tweets of a given user. A sick dayis defined as a calendar day during which the user wrote atleast one “sick” tweet. Throughout the paper, we will usethe term health quality to denote −PS .
We quantify one’s social status with PageRank, reci-procity of following, the number of times other people men-tion the user, and a collection of centrality measures (de-gree, communicability, eigenvector, betweenness, load, flow,and closeness). The reciprocity of friendships between highschool students has been shown to be a strong predictor ofsocial status of individuals [30]. Namely, low-rank individu-als frequently (and wishfully) list highly ranked students astheir friends, but the relationship is not reciprocated. Moststable and mutual friendships occur between people of thesame rank. We find that all measures of social rank arehighly cross-correlated (R > 0.73, p � 0.0001) and have al-most identical predictive power, explaining over 24% of thevariance in health.
Leveraging the estimated health state of all individualsin our dataset along with their GPS location, we extractthe number of physical encounters with sick people. Thenoise in GPS signal in areas with tall buildings throughoutNew York City can be up to hundred meters. Therefore,we consider two individuals co-located if they appear withinhundred meters of each other within a time window (slack)of length T . While this method is likely to overestimatethe number of actual encounters with other Twitter users,we find that it serves as a good proxy for the actual levelof exposure to infected individuals. In this work, we con-sider time windows of lengths 1, 4, and 24 hours. Based ondeclared Twitter friendships (i.e., mutual following of geo-active users), we count the number of sick friends eachuser has.
Using Google Places API,3 we download GPS coordinatesof all bars, night clubs, transit stations, public parks, andgyms in the greater New York City area. Transit stationsinclude major bus stops, subway stations, and train, ferry
3https://developers.google.com/places/documentation/
and airport terminals. We consider a total of 25 thousandvenues in these categories (see Fig. 3). Using the geo-tags ofindividual tweets, we calculate the mean shortest distanceto each venue type and the number of visits to each venue.A visit is measured as tweeting within 100 meters of a venue.These metrics capture aspects of the behavior and lifestyleof each person. For instance: How often do they frequentbars versus gyms? How much time they spend in crowdedpublic transportation?
Another type of “venue” we consider are major pollutionsources obtained from the U.S. Environmental ProtectionAgency.4 These include factories, power plants, transporta-tion hubs, and other sites emitting significant amounts ofvolatile chemical compounds, particulate matter, CO, NOx,SO2, and other harmful chemicals. We model over 1,700pollution sites within NYC (see Fig. 1).
We would like to tie in datasets that do not have GPSannotations. For instance the U.S. census contains rich so-cioeconomic characteristics of the entire nation. We tieour geo-tagged tweets with census data by inferring eachperson’s home ZIP code, which then serves as a key into thecensus dataset. The GPS coordinates of person x home isestimated by fitting a two-dimensional Gaussian to all x’slocations between 1am and 6am. The mean of this Gaussianis taken as the most likely home location. We then look upthe corresponding ZIP code in the GeoNames.org database.
The average New York City ZIP code zone has an areaof 3.6 km2 and can be walked across in less than 20 min-utes. The ZIP code areas are shown in Fig. 1. We cannow associate each person with the context derived from the2010 census—the most recent census available.5 We focuson three broad characteristics of a person’s neighborhood:poverty, education, and race. Poverty is measured in termsof fraction families and individuals below poverty line, thenumber of abandoned housing units, and the prevalence ofsocial security dependence. Education captures proportionof people over 25 with various levels of education (from el-ementary school to a doctorate). The race factor includesproportion of different races and ethnic groups.
For each person, we induce 62 features based on the factorsdescribed in this section. In Section 8, we will see how thesefeatures correlate and associate with people’s health, but letus first describe how we use them for health prediction.
7.3 Health PredictionWe are interested in how do the features we discuss above
generalize across individuals. We explore this by learninga regression decision tree on a training set of subjects andevaluate on the remaining test set. The decision tree ad-ditionally reveals the relative importance of the individualfeatures—with the most informative feature at the root andincreasingly insignificant features towards the leaves. Weprevent overfitting by pruning the tree on the basis of 10-fold cross-validation.
8. EXPERIMENTS AND RESULTSThis section reports the experimental results we obtained
and closely follows the structure of the Methods sectionabove. Unless otherwise noted, all results reported are sta-tistically significant at the 0.001 level (p < 0.001).
4http://www.epa.gov/air/emissions/5http://www.census.gov/main/www/access.html
Figure 4: This figure shows the interplay betweenpeople’s social status and their health. Each paneshows a different measure of social status (plottedon the horizontal axes). The vertical axes show theexpected amount of time a person is healthy. Acolumn x in each figure shows the log-probabilitydistribution log (Pr [health|centrality = x]). We seethat the people who often get sick (bottom rowsin each pane) are more likely of low social status,whereas people with high social rank enjoy betterhealth. The correlation coefficient R for each mea-sure of social status is shown on top. The positiveassociation between rank and health is consistentacross all measures of centrality considered.
Fig. 4 shows the interplay between six different measuresof social rank and people’s health. We see a common patternindependent of the particular centrality measure: the higherthe social status, the better the health. While low-rankindividuals are concentrated on the “frequently sick” side ofthe spectrum (on the bottom of each pane), highly rankedsubjects (on the right side of each pane) are more uniformlydistributed and often attain high health scores.
Applying regression analysis, we quantify the associationsbetween our factors and health (Fig. 5). All measures of so-cial rank are mutually strongly correlated and positively as-sociated with health quality. Proximity to pollution sourcesis the single most correlated feature with Ps (closer proxim-ity⇔ worse health). Visit to polluted sites are also stronglyassociated with health (more visits ⇔ worse health).
In agreement with prior work [21], we found a small butsignificant positive correlation between visits of public parksand health quality.
Fig. 6 shows the fraction of variance in cumulative prob-ability of sickness (PS) explained by various subsets of ourfactors (across all subjects).
We see that census data exhibits small correlation scoresand explains little variance in health. While the individualcontributions of poverty, education, and race are small, theyjointly account for 8.7% of variance that is unexplained byother factors. The actual effect of these factors is likely tobe even higher, however. In New York City, the ZIP codeareas are relatively large compared to the diversity and den-

−0.4 −0.2 0 0.2 0.4 0.6
PageRankDegree Centrality
Closeness CentralityBetweeness Centrality
Flow CentralityLoad Centrality
Eigenvector CentralityCommunication Centrality
Follows Reciprocity# Times Mentioned
Mean Distance to PollutionVisits Near Pollution
Visits of ParksMean Distance to Bars
Visits to BarsMean Distance to Gyms
Visits to GymsMentions of "gym"
Mean Distance to Transit StationsVisits to Transit Stations
Encounters within 1 hUnique Encounters within 1 h
Encounters within 4 hUnique Encounters within 4 h
Encounters within 12 hUnique Encounters within 12 h
Encounters within 24 hUnique Encounters within 24 h
Total # of Unique EncountersNumber of Sick Friends
PovertyLow EducationHigh Education
Correlation with Health Quality
Figure 5: Results of regularized regression analy-sis with the negative cumulative probability of sick-ness (−PS) as the dependent variable. Proximity topolluted sites and encounters with sick individualsare negatively correlated with people’s health qual-ity, whereas high centrality corresponds with goodhealth. Note the positive association between socialrank and health quality, irrespective of the measureof social status. Features derived from census data(education and poverty) have small but significanteffect.
sity of the city population. As a result, a single ZIP codeoften contains people on both extremes of any given factorconsidered in this study. This suggests that the fine-graineddata available in online social media does open novel op-portunities for increasingly comprehensive models of publichealth.
From Figures 5 and 6, we see that subjects’ activities re-garding bars, gyms, and public transit all appear to have acommon association with health: avoiding those venues isconnected to better health. For gyms, the effect is mildlystronger (in a statistically significant way) as compared tobars and public transit. Interestingly, mentioning the word“gym” in online communication is also associated with worsehealth. Future work will explore possible confounders andshed more light on the interplay between these importantlifestyle factors.
For health prediction, we use 80% randomly selected sub-jects to induce a regression decision tree D1 that predicts theexpected number of sick days (Fig. 7), and D2 that predictsthe cumulative probability of sickness PS . Evaluation on theremaining 20% of the subjects shows that D1 achieves 91%accuracy, and D2 is within 8% of the actual PS value morethan 95% of the time. We see that the decision tree induced
0 10 20 30 40 50 60
All Factors
Life Style
Social Status
Pollution
Sick Encounters
Sick Friends
Race
Education
Poverty
% Variance Explained in Health
Figure 6: Fraction of variance in health (−PS) ex-plained by various subsets of our factors. All fea-tures jointly account for more than 54% of the totalvariance. The first three factors (Poverty, Educa-tion, and Race) are derived from census data foruser’s home ZIP code. See Section 7.2 for explana-tion of the composition of the factors.
meaningful sequences of features, and it will be interestingto see if such insights can guide the design of a controlledepidemiological study that explores the effects further.
We consider two baselines: random and most-frequent.The former draws the predicted number of sick days froma Gaussian distribution learned from training data, whereasthe most-frequent baseline always outputs the mode of thelabels in training data. They achieve 15% and 64% accuracy,respectively, when predicting the number of individuals’ sickdays.
9. RELATED WORKSince the famous cholera study by John Snow (1855),
much work has been done in capturing the mechanisms ofepidemics. There is ample previous work in computationalepidemiology on building relatively coarse-grained modelsof disease spread via differential equations and graph the-ory [2, 29], by harnessing simulated populations [16], and byanalysis of official statistics [19]. Such models are typicallydeveloped for the purposes of assessing the impact a partic-ular combination of an outbreak and a containment strategywould have on humanity or ecology [7]. However, the aboveworks focus on simulated populations and hypothetical sce-narios. By contrast, we address the problem of predictingthe health of real-world populations composed of individualsembedded in a fine social structure. As a result, our workmakes a step towards understanding the impact of complexintertwined factors affecting our health.
Traditionally, public health is monitored via surveys andby aggregating statistics obtained from healthcare providers.Such methods are costly, slow, and may be biased. Recently,digital media has been successfully used to significantly re-duce the latency and improve the overall effectiveness ofpublic health monitoring. Perhaps most notably, GoogleFlu Trends models the prevalence of flu via analysis of geo-located search queries[18].

PageRank < 0.8 Visits Bar > 4
Distance to Pollution < 988.6
Sick Encounters
12h > 8
Visits Pollution < 5
Distance to Transit< 964.5
Visits Pollution < 18
Reciprocity < 0.6
Mentions "Gym" > 4
Sick Encounters
24h < 8
4 1.12
0.86 3.67
0.17
0.2 0.31
0.01
0.52
0.89 0.44
Figure 7: Decision tree predicting the expectednumber of sick days. The tree has been pruned toan optimal level using 10-fold cross-validation. Toestimate the number of sick days for a new individ-ual, we start at the root of the tree and evaluatethe inequality in the root. If it evaluates to true, wetraverse the left subtree, otherwise we recurse onthe right subtree. We see, for example, that highlyranked subjects who avoid pollution sources tendto be healthier than people who frequent bars, en-counter too many sick individuals, and have unre-ciprocated relationships.
Eubank et al. began to leverage more fine-grained infor-mation, including people’s activities [16]. They developed asimulation tool (EpiSims) that leverages synthetic—but sta-tistically realistic—human mobility to study the spread ofinfectious diseases over a metropolitan area. We see an im-portant continuity from such simulations to real-time track-ing of human behavior. For example, as we have seen, ourNYC dataset contains 1/30 of the residents. We can sim-ulate the remainder of the population, while “seeding” thesystem with realistic parameters learned from live data. Forexample, people’s home locations or social encounters are nolonger drawn from coarse distributions, but rather inferredfrom online activities.
In the context of social media, [25] explore augmenting thetraditional notification channels about a disease outbreakwith data extracted from Twitter. By manually examininga large number of tweets, they show that self-reported symp-toms are the most reliable signal in detecting if a tweet isrelevant to an outbreak or not. This is because people oftendo not know what their true problem is until diagnosed byan expert, but they can readily write about how they feel.Researchers have also concentrated on capturing the overalltrend of a particular disease outbreak, typically influenza,by monitoring social media [13, 26, 9]. [17] use informationactively submitted by cell phone users to model aggregate
public health. However, scaling such systems poses consid-erable challenges.
Other researchers focus on a more detailed modeling ofthe language of the tweets and its relevance to public healthin general [31], and to influenza surveillance in particular[11]. Paul et al. develop a variant of topic models thatcaptures the symptoms and possible treatments for ailments,such traumatic injuries and allergies, that people discusson Twitter. In a follow-up work [32] begin to consider thegeographical patterns in the prevalence of such ailments, andshow a good agreement of their models with official statisticsand Google Flu Trends.
Our previous work has shown that people’s interactionsrecorded in online social networks can be used to learn veryspecific and fine-grained models of the spread of contagiousdisease [35, 36]. However, prior work considered only rudi-mentary features based on immediate user co-location andsocial ties. In this paper, we include more than forty addi-tional factors based not only on interpersonal interactions,but also on the environment, quality of one’s neighborhood,socioeconomic status, and lifestyle. Furthermore, we showthat the factors we induce generalize across individuals andhave a strong predictive power within our population ofTwitter users.
In life sciences, the positive correlation between socialrank and strength of an immune system has been foundin rhesus monkeys by performing controlled experiments ona small number of subjects [42]. In human studies, socialstatus has been estimated indirectly. Socioeconomic status(SES) has been widely used as a proxy for people’s socialrank [44]. A strong correlation between SES and health hasbeen documented in a large number of contexts, in countrieswith egalitarian and socialized medical care, and even fordiseases whose outcomes are largely unaffected by the qual-ity of health care. Interestingly, even when controlling forrisk factors often associated with low SES, such as smokingand unhealthy diet, SES is still the dominant factor. Sub-sequent studies have shown that subjective SES is a betterpredictor of a person’s health than a global measure SES.
For example, in the US, the higher the income inequal-ity in a given region, the worse the health of the populationthere [24] (and also the higher the prevalence of firearm own-ership [22]). Position in a civil servant hierarchy is anotherpotential proxy for social status. A pioneering study of [28]has found that the risk of heart disease grows as one’s occu-pational rank decreases. In this paper, we use the declaredsocial network of Twitter users and their online interactionsto determine the social rank of any given individual.
While we do not yet have a comprehensive understand-ing of the biological and psychological mechanisms that linksocial status to disease susceptibility, partial explanationshave been proposed. Low social rank often leads to lesscontrol over one’s life, imbalance between work effort andreward, lack of autonomy, less respect from the general so-ciety, fewer means and options available to resolve difficultsituations, etc. [27]. This renders low-rank individuals morevulnerable to stress, in the developed world mostly psycho-logical stress. The negative impact of stress on health iswell documented. Stress induces metabolic and endocrinechanges that in turn lead to increased risk of disease [37].
However no studies to date have resolved the impact ofpeople’s social status on the prevalence of diseases, or thespread of infectious diseases, throughout a large-scale pop-

ulation over extended periods of time. In this paper, wedemonstrate that large-scale data mining enables us to fillsome of these gaps without any active user participation. Asa result, we can improve our understanding of human behav-ior and begin to quantify—in a scalable fashion—importantphenomena affecting our everyday lives. At the same time,our approach complements, but does not replace, controlledlongitudinal studies (e.g., [28, 14, 37]) that uncover the de-tailed biological mechanism behind diseases and capture sig-nal that is, at present, too weak to be detectable online.
10. CONCLUSIONS AND FUTURE WORKThis paper focuses on data mining diverse, noisy, and in-
complete sensory data over large numbers of individuals. Weshow that the induced patterns can be subsequently lever-aged in descriptive as well as predictive models of the healthof a population of Twitter users at scale. We find that theraw sensory data linked with the content of users’ onlinecommunication, explicit as well as implicit online social in-teractions, and relationships are extremely rich informationsources. The fine granularity and pervasiveness of the dataallows us to model phenomena that have been previouslyout of reach. We consider environmental factors (such aspollution and poverty) as well as social aspects of life (suchas encounters and friendships with sick and healthy people).Furthermore, we do this at no cost, and without any activeuser participation.
Our methods enable us to shed additional light on im-portant questions in public health that have been either tooexpensive or outright impossible to answer. In the process,we have drawn parallels to work done in other scientificfields, including epidemiology, immunology, and sociology,and shown how our methods complement previous resultsand bring new insights.
Our current work concentrates on two areas: effectiveways of validating disease models with ground truth aboutpeople’s health, and expanding the set of environmental fac-tors our models capture. The first area builds on researchin traditional epidemiology and active learning, and will en-able us to learn more specific health models that capture the“offline” part of the population as well.
Consider the following pyramid model of public health.On the base of the pyramid, we have the entire population.In the middle of the pyramid are users of online social mediawho we can access. At the top of the pyramid is a small—but strategically selected—sample of individuals from thegeneral population (which includes some of the social me-dia users) for whom we have detailed records about theirhealth. These include subjects who respond to online med-ical surveys, take at-home rapid tests, or even get tested ata nearby medical lab and share the results.
Traditionally, epidemiological studies are based on datacollected from the top of the pyramid. This paper addressesthe middle of the pyramid. We believe a hybrid approachwill enable knowledge gained at any level in the pyramidto “trickle down”. For example, by applying automated ma-chine learning techniques described in this paper to the largemass of people in online social media, we can bootstrap thetop of the pyramid to make well-founded predictions aboutthe general population at the bottom of the pyramid. Thiswill infuse epidemiological models with additional structureand parameters learned from detailed timely data, so thatfewer factors need to be modeled via simulation. However,
information could also “trickle up”, where the latent behav-ior of the hidden population influences predictions even forindividuals on top.
The second area focuses on modeling the interplay be-tween a wider range of personal, social, environmental andhealth factors. For example: What exact impact eatinghabits have on one’s health, and the health of related peo-ple? Animal studies have shown that personality plays asignificant role in the perception of one’s social rank, whichin turn modulates the impact of the social status on one’shealth [43]. Similar processes are likely to occur in humansocieties as well. For instance, a phlegmatic person may beless affected by his or her low rank. However, these mech-anisms prove difficult to capture using current techniques.By contrast, our work builds a foundation that makes suchstudies possible. For example, the language model used hereto infer the health state of an individual can be augmented toestimate the personality type of a person. Finally, our mod-els enable mobile applications that inform the user abouthealth risks around him in real-time, opening opportunitiesfor complex social studies of human behavior at scale.
11. ACKNOWLEDGMENTSFigures 1-3 in this paper are taken from our web applica-
tion developed with Sean Brennan, Martin Janda, AndrewAbumoussa, and Hao Chen (http://fount.in). This researchwas partly funded by ARO grant W911NF-08-1-0242, ONRgrant N00014-11-10417, OSD grant W81XWH-08-C07-40,and a gift from the Kodak Company.
12. REFERENCES[1] R. Ader and N. Cohen. Conditioning and immunity.
Psychoneuroimmunology, 2:3–34, 2001.
[2] R. Anderson and R. May. Population biology of infectiousdiseases: Part I. Nature, 280(5721):361, 1979.
[3] C. Aperjis and B. Huberman. A market for unbiasedprivate data: Paying individuals according to their privacyattitudes. Arxiv.org, 2012.
[4] L. Backstrom and J. Leskovec. Supervised random walks:predicting and recommending links in social networks. InWSDM 2011, pages 635–644. ACM, 2011.
[5] D. Bild, D. Bluemke, G. Burke, R. Detrano, A. Diez Roux,A. Folsom, P. Greenland, R. Kronmal, K. Liu, J. Nelson,et al. Multi-ethnic study of atherosclerosis: objectives anddesign. American Journal of Epidemiology, 156(9):871–881,2002.
[6] L. Breiman et al. Classification and Regression Trees.Chapman & Hall, New York, 1984.
[7] P. Chen, M. David, and D. Kempe. Better vaccinationstrategies for better people. In Proceedings of the 11thACM conference on Electronic commerce, pages 179–188.ACM, 2010.
[8] E. Cho, S. A. Myers, and J. Leskovec. Friendship andmobility: User movement in location-based social networks.ACM SIGKDD International Conference on KnowledgeDiscovery and Data Mining (KDD), 2011.
[9] R. Chunara, J. Andrews, and J. Brownstein. Social andnews media enable estimation of epidemiological patternsearly in the 2010 Haitian cholera outbreak. The AmericanJournal of Tropical Medicine and Hygiene, 86(1):39–45,2012.
[10] S. Cohen, D. Tyrrell, and A. Smith. Psychological stressand susceptibility to the common cold. New Englandjournal of medicine, 325(9):606–612, 1991.
[11] N. Collier, N. Son, and N. Nguyen. OMG U got flu?Analysis of shared health messages for bio-surveillance.Journal of Biomedical Semantics, 2011.

[12] C. Cortes and V. Vapnik. Support-vector networks.Machine learning, 20(3):273–297, 1995.
[13] A. Culotta. Towards detecting influenza epidemics byanalyzing Twitter messages. In Proceedings of the FirstWorkshop on Social Media Analytics, pages 115–122.ACM, 2010.
[14] F. Destefano, E. Eaker, S. Broste, D. Nordstrom, P. Peissig,R. Vierkant, K. Konitzer, R. Gruber, and P. Layde.Epidemiologic research in an integrated regional medicalcare system: the marshfield epidemiologic study area.Journal of clinical epidemiology, 49(6):643–652, 1996.
[15] D. Easley and J. Kleinberg. Networks, Crowds, andMarkets: Reasoning About a Highly Connected World.Cambridge University Press, 2010.
[16] S. Eubank, H. Guclu, V. Anil Kumar, M. Marathe,A. Srinivasan, Z. Toroczkai, and N. Wang. Modellingdisease outbreaks in realistic urban social networks. Nature,429(6988):180–184, 2004.
[17] C. Freifeld, R. Chunara, S. Mekaru, E. Chan,T. Kass-Hout, A. Iacucci, and J. Brownstein. Participatoryepidemiology: use of mobile phones for community-basedhealth reporting. PLoS medicine, 7(12):e1000376, 2010.
[18] J. Ginsberg, M. Mohebbi, R. Patel, L. Brammer,M. Smolinski, and L. Brilliant. Detecting influenzaepidemics using search engine query data. Nature,457(7232):1012–1014, 2008.
[19] B. Grenfell, O. Bjornstad, and J. Kappey. Travelling wavesand spatial hierarchies in measles epidemics. Nature,414(6865):716–723, 2001.
[20] A. Gruzd, B. Wellman, and Y. Takhteyev. ImaginingTwitter as an imagined community. In AmericanBehavioral Scientist, Special issue on ImaginedCommunities, 2011.
[21] I. Hanski, L. von Hertzen, N. Fyhrquist, K. Koskinen,K. Torppa, T. Laatikainen, P. Karisola, P. Auvinen,L. Paulin, M. Makela, et al. Environmental biodiversity,human microbiota, and allergy are interrelated. Proceedingsof the National Academy of Sciences, 2012.
[22] D. Hemenway, B. Kennedy, I. Kawachi, and R. Putnam.Firearm prevalence and social capital. Annals ofEpidemiology, 11(7):484–490, 2001.
[23] T. Joachims. A support vector method for multivariateperformance measures. In ICML 2005, pages 377–384.ACM, 2005.
[24] I. Kawachi. The health of nations: Why inequality isharmful to your health author: Ichiro kawachi, bruce p.kennedy, publisher: New p. 2006.
[25] M. Krieck, J. Dreesman, L. Otrusina, and K. Denecke. Anew age of public health: Identifying disease outbreaks byanalyzing tweets. Proceedings of Health WebScienceWorkshop, ACM Web Science Conference, 2011.
[26] V. Lampos, T. De Bie, and N. Cristianini. Fludetector-tracking epidemics on Twitter. Machine Learningand Knowledge Discovery in Databases, pages 599–602,2010.
[27] M. Marmot. Status syndrome. JAMA: the journal of theAmerican Medical Association, 295(11):1304–1307, 2006.
[28] M. Marmot, G. Rose, M. Shipley, and P. Hamilton.Employment grade and coronary heart disease in britishcivil servants. Journal of Epidemiology and CommunityHealth, 32(4):244–249, 1978.
[29] M. Newman. Spread of epidemic disease on networks.Physical Review E, 66(1):016128, 2002.
[30] M. Newman. A measure of betweenness centrality based onrandom walks. Social networks, 27(1):39–54, 2005.
[31] M. Paul and M. Dredze. A model for mining public healthtopics from Twitter. Technical Report. Johns HopkinsUniversity. 2011., 2011.
[32] M. Paul and M. Dredze. You are what you tweet:Analyzing Twitter for public health. In Fifth InternationalAAAI Conference on Weblogs and Social Media, 2011.
[33] D. Q. Rich, H. M. Kipen, W. Huang, G. Wang, Y. Wang,P. Zhu, P. Ohman-Strickland, M. Hu, C. Philipp, S. R.Diehl, S.-E. Lu, J. Tong, J. Gong, D. Thomas, T. Zhu, andJ. J. Zhang. Association between changes in air pollutionlevels during the beijing olympics and biomarkers ofinflammation and thrombosis in healthy young adultsairpollution, inflammation, and thrombosis. The Journal ofthe American Medical Association, 307(19):2068–2078,2012.
[34] A. Sadilek, H. Kautz, and J. P. Bigham. Finding yourfriends and following them to where you are. In Fifth ACMInternational Conference on Web Search and Data Mining,2012. (Best Paper Award).
[35] A. Sadilek, H. Kautz, and V. Silenzio. Modeling spread ofdisease from social interactions. In Sixth AAAIInternational Conference on Weblogs and Social Media(ICWSM), 2012.
[36] A. Sadilek, H. Kautz, and V. Silenzio. Predicting diseasetransmission from geo-tagged micro-blog data. InTwenty-Sixth AAAI Conference on Artificial Intelligence,2012.
[37] R. Sapolsky. Social status and health in humans and otheranimals. Annual Review of Anthropology, pages 393–418,2004.
[38] S. Shalev-Shwartz, Y. Singer, and N. Srebro. Pegasos:Primal estimated sub-gradient solver for svm. InProceedings of the 24th international conference onMachine learning, pages 807–814. ACM, 2007.
[39] A. Smith. Pew internet & american life project.http://pewresearch.org/pubs/2007/twitter-users-cell-phone-2011-demographics,2011.
[40] C. W. Thompson, J. Roe, P. Aspinall, R. Mitchell,A. Clow, and D. Miller. More green space is linked to lessstress in deprived communities: Evidence from salivarycortisol patterns. Landscape and Urban Planning,105(3):221 – 229, 2012.
[41] B. I. Truman et al. CDC health disparities and inequalitiesreport. Morbidity and Mortality Weekly Report, 2011.
[42] J. Tung, L. Barreiro, Z. Johnson, K. Hansen,V. Michopoulos, D. Toufexis, K. Michelini, M. Wilson, andY. Gilad. Social environment is associated with generegulatory variation in the rhesus macaque immune system.Proceedings of the National Academy of Sciences, 2012.
[43] C. Virgin Jr and R. Sapolsky. Styles of male social behaviorand their endocrine correlates among low-ranking baboons.American Journal of Primatology, 42(1):25–39, 1997.
[44] R. Wilkinson. Mind the gap. Weidenfeld & Nicolson, 2000.
[45] H. Zou and T. Hastie. Regularization and variable selectionvia the elastic net. Journal of the Royal Statistical Society:Series B (Statistical Methodology), 67(2):301–320, 2005.