modeling the removal of sunfix red s3b from aqueous
TRANSCRIPT

J. Serb. Chem. Soc. 81 (8) 959–970 (2016) UDC 667.2–037.004.74+544.35.145.2:66.087.5: JSCS–4900 510.644:628.3 Original scientific paper
959
Modeling the removal of Sunfix Red S3B from aqueous solution by electrocoagulation process using artificial neural network
HA BUI MANH* Department of Environmental Sciences, Sai Gon university, 273 An Duong Vuong St.,
District 5, Ho Chi Minh 700000, Vietnam
(Received 8 January, revised 15 March, accepted 25 March 2016)
Abstract: This study presents an application of artificial neural networks (ANNs) to predict the dye removal efficiency (color and chemical oxygen dem-and (COD) value)) of electrocoagulation process from Sunfix Red S3B aque-ous solution. The Bayesian regulation algorithm was applied to train the net-works with experimental data including five factors: pH, current density, sul-phate concentration, initial dye concentration (IDC) and electrolysis time. The predicting performance of the ANN models was validated through the low root mean square error value (9.844 %), mean absolute percentage error (13.776 %) and the high determination coefficient value (0.836). Garson’s algorithm, con-nection weight method and neural interpretation diagram were also used to study the influence of input variables on dye removal efficiency. For decolor-ization, determined most effective inputs are current density, electrolysis time and initial pH, while COD removal is found to be strongly affected by initial dye concentration and sulphate concentration. Through these steps, we ANN’s robustness in modeling and analysis of electrocoagulation process is dem-onstrated.
Keywords: color removal; Garson’s algorithm; sensitivity analysis; textile wastewater.
INTRODUCTION Textile wastewater usually has characteristic intensive color, suspended
solids and salinity. In addition, it usually contains a large amount of bioresistant organic contaminants, which have strong toxic impact on microbes.1,2 In the last few years, various modern methods such as ozonation, sonication, ion exchange, membrane filtration, etc. have been successfully applied for color removal of dye-containing wastewater.3–5 Nonetheless, most of these techniques are limited by engineering requirements, costs or difficulties in operation. Hence, they could
* E-mail: [email protected] doi: 10.2298/JSC160108032M
_________________________________________________________________________________________________________________________
(CC) 2016 SCS. All rights reserved.
Available on line at www.shd.org.rs/JSCS/

960 MANH
not be employed for treatment of actual dyeing wastewater. Recently, research has focused on electrocoagulation, which completely removes color from dyeing wastewater.6,7
In electrocoagulation (EC), direct electrical current is used to dissolve metal electrode (mostly iron and aluminum) forming a range of coagulant species and metal hydroxides. Thus formed compounds possess adsorption efficiency 100 times greater than pre-precipitated hydroxides in conventional coagulation pro-cess.8 There are three proposed mechanisms for dye removal in EC (iron anode): precipitation, floatation and adsorption, as illustrated in Fig. S-1 of the Supple-mentary material to this paper. Generally, the overall reaction is a synergistic effect of the three removal mechanisms and could be shifted depending on oper-ating parameters (pH, current density, electrolysis time, etc.), treatment con-ditions (monopolar, bipolar, sample volume, etc.) and type of textile dyes (reactive, basic, acidic, etc.).6,8,9 Therefore, it is not easy to explain the mech-anisms in EC process.
Several authors tried to explain the phenomenological principle in this process. However, strong basic knowledge of EC including completed math-еmatical formulas is still required.10–12 Accordingly, we need a fast and reliable modeling approach to reveal the complicated relationship between variables in EC process. Many scientists have shown recently that artificial neural networks (ANNs) are robust and excellent tools for modeling water treatment processes.13 This method enables understanding of the process without actually simulating the physical and chemical laws governing the system.14 Therefore, ANN has attracted a great deal of attention. However, few reports have been published on modeling of an EC process applied to remove pollutants from dye-containing wastewaters using ANN. Thus, the focus of the present study was to assess the potential of EC technique for removal of Sunfix Red S3B from aqueous sol-utions, monitored through color and chemical oxygen demand (COD) removal efficiencies for variable parameters such as: electrolysis time, initial pH, initial dye concentration, electric current and Na2SO4 concentration. Herein, we also implement a model network, which is capable to investigate effectively the rel-ationship between the parameters and the dye removal efficiencies of EC process.
EXPERIMENTAL Materials and instruments
Reactive dye stock. The commercial Sunfix Red S3B (SRS) was supplied by Oh-Young (a Korean company). Its molecular structure and UV–Vis absorption spectra are given in Fig. S-2 (Supplementary material). The dye stock solution (1000 mg L-1) was prepared by com-pletely dissolving 1.000 g dye powder into 1000 mL of distilled hot water, and the solution was diluted to appropriate concentrations (30–140 mg L-1) before the experiment.
_________________________________________________________________________________________________________________________
(CC) 2016 SCS. All rights reserved.
Available on line at www.shd.org.rs/JSCS/

MODELING ELECTROCOATULATION PROCESS USING ANN 961
Electrocoagulation reactor The experiments were performed in a bipolar batch reactor (Fig. S-3 of the Supple-
mentary material), using four iron electrodes (Fe: 99.25 % – CT2), dimensions of 146 mm×150 mm×4 mm, connected in parallel (bipolar mode). Only the outer electrodes were connected to the custom made digital DC power supply (220 V and 30 A) whose polarity automatically switch every 30 s. The electrocoagulator was made of Plexiglas, dimensions 160 mm×160 mm×250 mm including an Imhoff sedimentation tank. The active area and the distance of each electrode were 19.6 cm2 (140 mm×140 mm) and 15 mm, respectively. Procedure and water analysis
For each run, 4.0 L of the constant dye solution with specific concentration (30–140 mg L-1) were placed into the electrocoagulator. The pH of the contents was adjusted to the needed pH value (3–12) by NaOH or HCl (0.05 N) solutions. Afterwards, Na2SO4 was added for desired sulphate concentration (500–2500 mg L-1). Finally, the current density was adjusted to the desired value (43.3, 65.0, 86.6, 108.3 and 130 A m-2). After 30 min settling at the end of each run, 50 mL of the treated sample were collected, filtered and determined color removal effi-ciency by the reducing absorbance at 542 nm (λmax) using a spectrophotometer (Thermo UV– –Vis Genesys 10) and chemical oxygen demand (COD) removal efficiency by standard methods for the examination of water and wastewater.15 Finally, to avoid electrode passivation at the end of each run, the electrodes were washed thoroughly in water and dipped in 0.5 M HCl solution for at least 15 min to dissolve any oxide from electrode surface. Each analysis was performed in duplicate and the results presented are the average value ± standard devi-ations. Experimental design
At first, the experiments were conducted with “one factor at a time” design to estimate the range values of the five factors or variables (31 assays). Afterwards, 19 experiments were designed using fractional factorial with 3 central points and two levels of operating variables (Table S-I of the Supplementary material) to generate information about the behaviour of EC treatment. Next, a full central composite design with two blocks (31 experiments) was per-formed to promote variability in the data factors as shown in Table S-II, Supplementary mat-erial. Finally, 5 additional tests were conducted to increase variability in the initial dye con-centration factor (IDC) from 30 to 140 mg L-1 while keeping initial pH at 11, electrolysis time at 4 min, current density at 65.0 A m-2, and sulphate concentration at 1200 mg L-1. Therefore, 86 experiments were designed with descriptive statistics shown in Table S-III and distribution histogram of the factors shown in Fig. S-IV (Supplementary material). The Minitab software (version 16.2.0) was use for the statistical design of experiments. Artificial neural network method
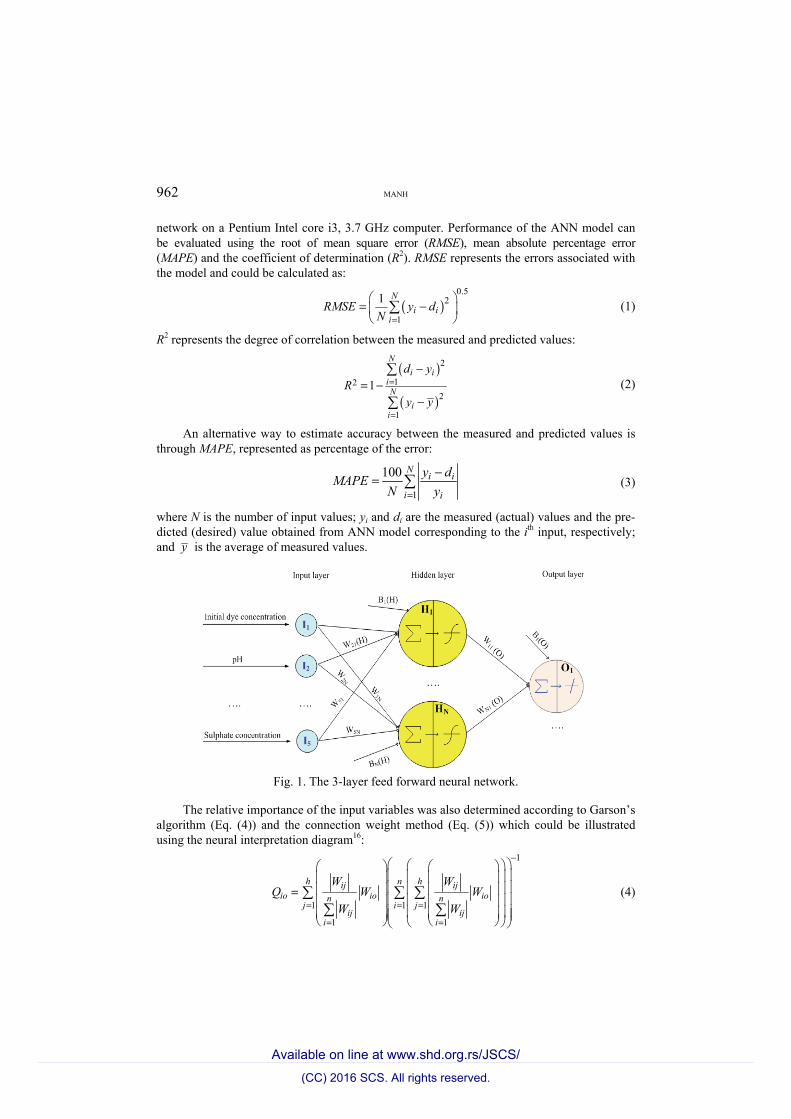
A three-layer feed-forward back-propagation network (Fig. 1) was chosen to model the relation of COD and color removal efficiencies to five independent variables with surveyed value, as mentioned in previous section. The number of neurons in hidden layer was varied from 1 to 17 to determine the optimal topology of the network. Each topology was repeated one hundred times to avoid random correlation due to random initialization of the weights and bias. This network was trained using the Bayesian regulation algorithm (trainbr) with a set of 76 experimental data points, randomly divided into 80 % for training, 20 % for validation. Then the resulting network was evaluated with another set of 10 experimental data points. Artificial neural network (ANN) toolbox of Matlab 8.1 mathematical software for Windows was used for training and testing the
_________________________________________________________________________________________________________________________
(CC) 2016 SCS. All rights reserved.
Available on line at www.shd.org.rs/JSCS/
962 MANH
network on a Pentium Intel core i3, 3.7 GHz computer. Performance of the ANN model can be evaluated using the root of mean square error (RMSE), mean absolute percentage error (MAPE) and the coefficient of determination (R2). RMSE represents the errors associated with the model and could be calculated as:
( )0.5
2
1
1 Ni i
iRMSE y d
N =
= −
(1)
R2 represents the degree of correlation between the measured and predicted values:
( )
( )
2
122
1
1
Ni i
iN
ii
d yR
y y
=
=
−= −
−
(2)
An alternative way to estimate accuracy between the measured and predicted values is through MAPE, represented as percentage of the error:
1
100 Ni i
i i
y dMAPEN y=
−= (3)
where N is the number of input values; yi and di are the measured (actual) values and the pre-dicted (desired) value obtained from ANN model corresponding to the ith input, respectively; and y is the average of measured values.
Fig. 1. The 3-layer feed forward neural network.
The relative importance of the input variables was also determined according to Garson’s algorithm (Eq. (4)) and the connection weight method (Eq. (5)) which could be illustrated using the neural interpretation diagram16:
1
1 1 1
1 1
h n hij ijio io ion n
j i jij ij
i i
W WQ W W
W W
−
= = =
= =
=
(4)
_________________________________________________________________________________________________________________________
(CC) 2016 SCS. All rights reserved.
Available on line at www.shd.org.rs/JSCS/
MODELING ELECTROCOATULATION PROCESS USING ANN 963
( )1
hio ij jo
jV W W
== × (5)
Herein, Qio is the relative significance of the ith input variable upon the output variable; n and h denote the number of input and hidden neurons, respectively. W is the connection weight value, the subscripts “i” “j” and “o” represents the input, hidden and output neurons, respectively.
RESULTS AND DISCUSSION
Neural network topology Since the problem of predicting dye removal efficiency in this study is a
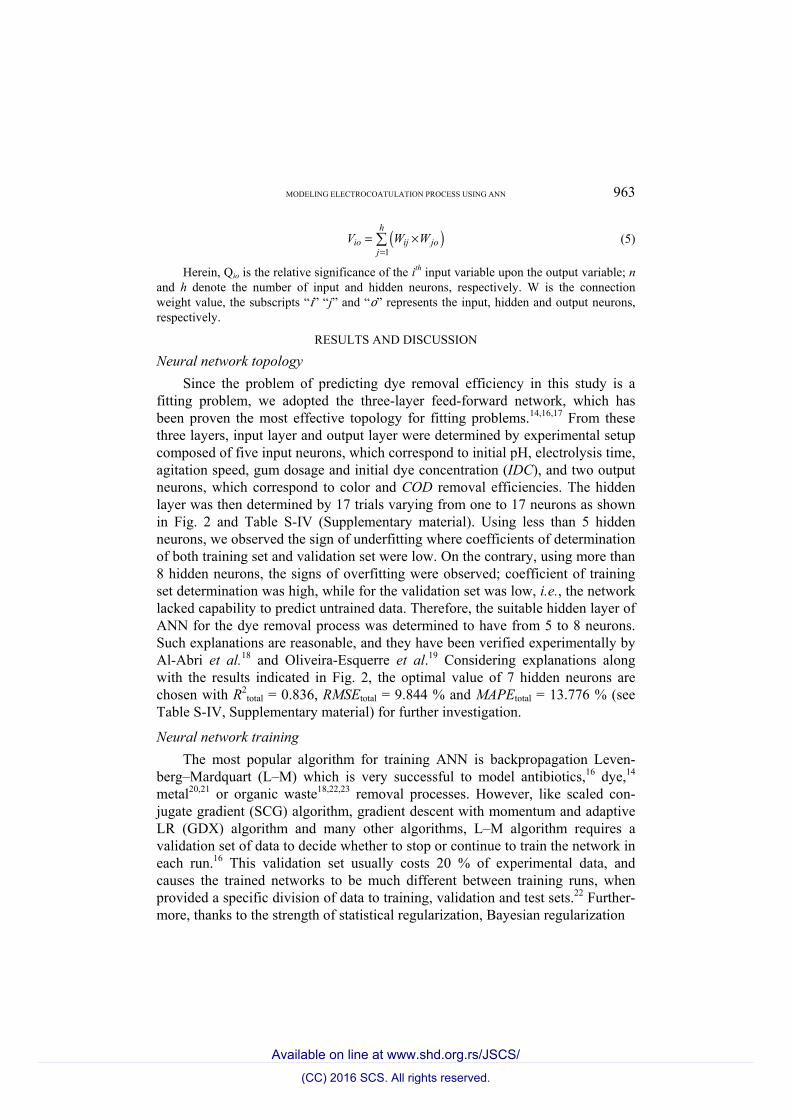
fitting problem, we adopted the three-layer feed-forward network, which has been proven the most effective topology for fitting problems.14,16,17 From these three layers, input layer and output layer were determined by experimental setup composed of five input neurons, which correspond to initial pH, electrolysis time, agitation speed, gum dosage and initial dye concentration (IDC), and two output neurons, which correspond to color and COD removal efficiencies. The hidden layer was then determined by 17 trials varying from one to 17 neurons as shown in Fig. 2 and Table S-IV (Supplementary material). Using less than 5 hidden neurons, we observed the sign of underfitting where coefficients of determination of both training set and validation set were low. On the contrary, using more than 8 hidden neurons, the signs of overfitting were observed; coefficient of training set determination was high, while for the validation set was low, i.e., the network lacked capability to predict untrained data. Therefore, the suitable hidden layer of ANN for the dye removal process was determined to have from 5 to 8 neurons. Such explanations are reasonable, and they have been verified experimentally by Al-Abri et al.18 and Oliveira-Esquerre et al.19 Considering explanations along with the results indicated in Fig. 2, the optimal value of 7 hidden neurons are chosen with R2
total = 0.836, RMSEtotal = 9.844 % and MAPEtotal = 13.776 % (see Table S-IV, Supplementary material) for further investigation.
Neural network training The most popular algorithm for training ANN is backpropagation Leven-
berg–Mardquart (L–M) which is very successful to model antibiotics,16 dye,14 metal20,21 or organic waste18,22,23 removal processes. However, like scaled con-jugate gradient (SCG) algorithm, gradient descent with momentum and adaptive LR (GDX) algorithm and many other algorithms, L–M algorithm requires a validation set of data to decide whether to stop or continue to train the network in each run.16 This validation set usually costs 20 % of experimental data, and causes the trained networks to be much different between training runs, when provided a specific division of data to training, validation and test sets.22 Further-more, thanks to the strength of statistical regularization, Bayesian regularization
_________________________________________________________________________________________________________________________
(CC) 2016 SCS. All rights reserved.
Available on line at www.shd.org.rs/JSCS/
964 MANH
0.836
0.827
9.844
0.0
2.0
4.0
6.0
8.0
10.0
12.0
14.0
0.0
0.1
0.2
0.3
0.4
0.5
0.6
0.7
0.8
0.9
0 1 2 3 4 5 6 7 8 9 10 11 12 13 14 15 16 17 18
RM
SE, %
R-S
quar
ed
Number of hidden neurons
R2 total
R2 validation
R2 train
RMSE total
Fig. 2. The influence of number of hidden neurons on R2 and RMSE values.
(BR) algorithm, which is used in the study, does not require a validation set, i.e., 20 % of the experimental data are added to the training set, which gives the result networks with almost the same performance across training runs on a specific division of data.21 Particularly, Fig. S-III (Supplementary material) shows vari-ation of ANN performance across 10 training runs in the same configuration of seven-hidden neuron network and a specific division of data. BR algorithm had outperformed other algorithms by yielding determination coefficient higher and more stable compared to the other algorithms.
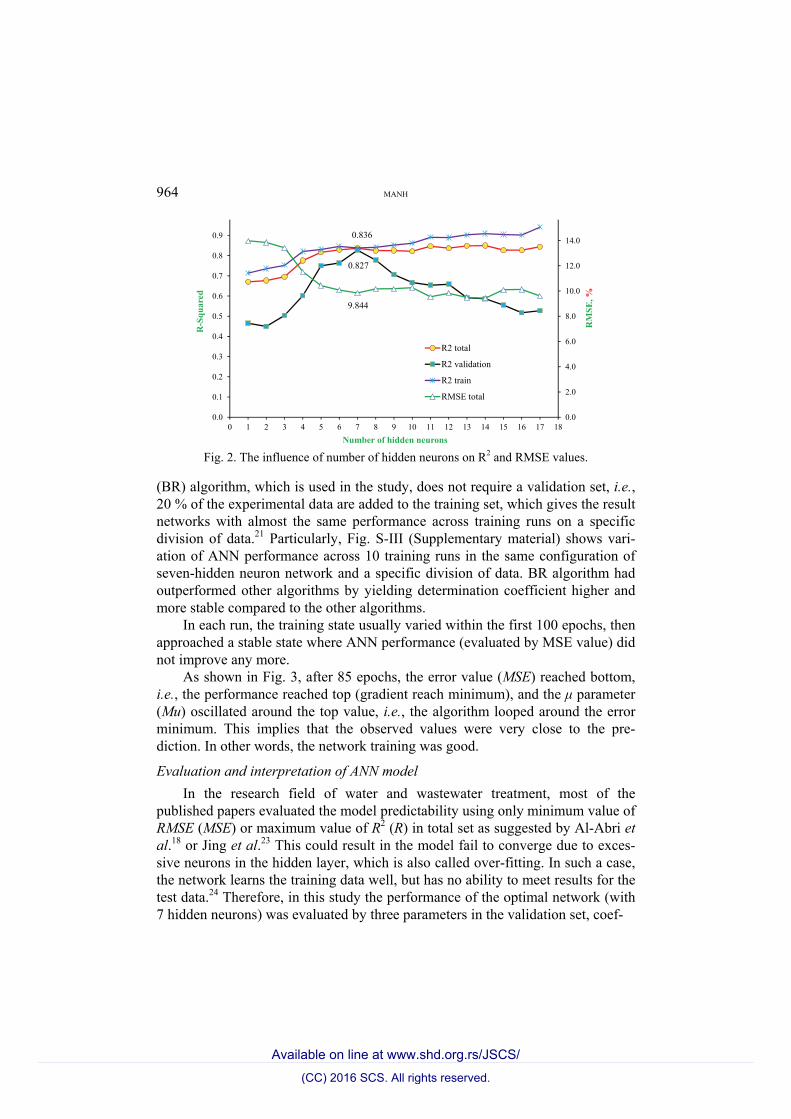
In each run, the training state usually varied within the first 100 epochs, then approached a stable state where ANN performance (evaluated by MSE value) did not improve any more.
As shown in Fig. 3, after 85 epochs, the error value (MSE) reached bottom, i.e., the performance reached top (gradient reach minimum), and the μ parameter (Mu) oscillated around the top value, i.e., the algorithm looped around the error minimum. This implies that the observed values were very close to the pre-diction. In other words, the network training was good.
Evaluation and interpretation of ANN model In the research field of water and wastewater treatment, most of the
published papers evaluated the model predictability using only minimum value of RMSE (MSE) or maximum value of R2 (R) in total set as suggested by Al-Abri et al.18 or Jing et al.23 This could result in the model fail to converge due to exces-sive neurons in the hidden layer, which is also called over-fitting. In such a case, the network learns the training data well, but has no ability to meet results for the test data.24 Therefore, in this study the performance of the optimal network (with 7 hidden neurons) was evaluated by three parameters in the validation set, coef-
_________________________________________________________________________________________________________________________
(CC) 2016 SCS. All rights reserved.
Available on line at www.shd.org.rs/JSCS/
MODELING ELECTROCOATULATION PROCESS USING ANN 965
Mea
n sq
uare
d er
ror,
%2
Epoch
Epoch
Gra
dien
tM
u
(b)
(a)
MuMuMu
Epoch
Epoch
MuMu
(c)
Mu Mu
MuTrainValidationBest
Fig. 3. Number of epochs vs. performance parameters in traning state; a) gradient, b) Mu and c) mean squared error (MSE). The parameters at epoch 100 are 14.550, 0.005 and 82.597 for
gradient, Mu and MSE, respectively.
ficient of determination R2validation = 0.827, root of mean square error RMSEvalidation
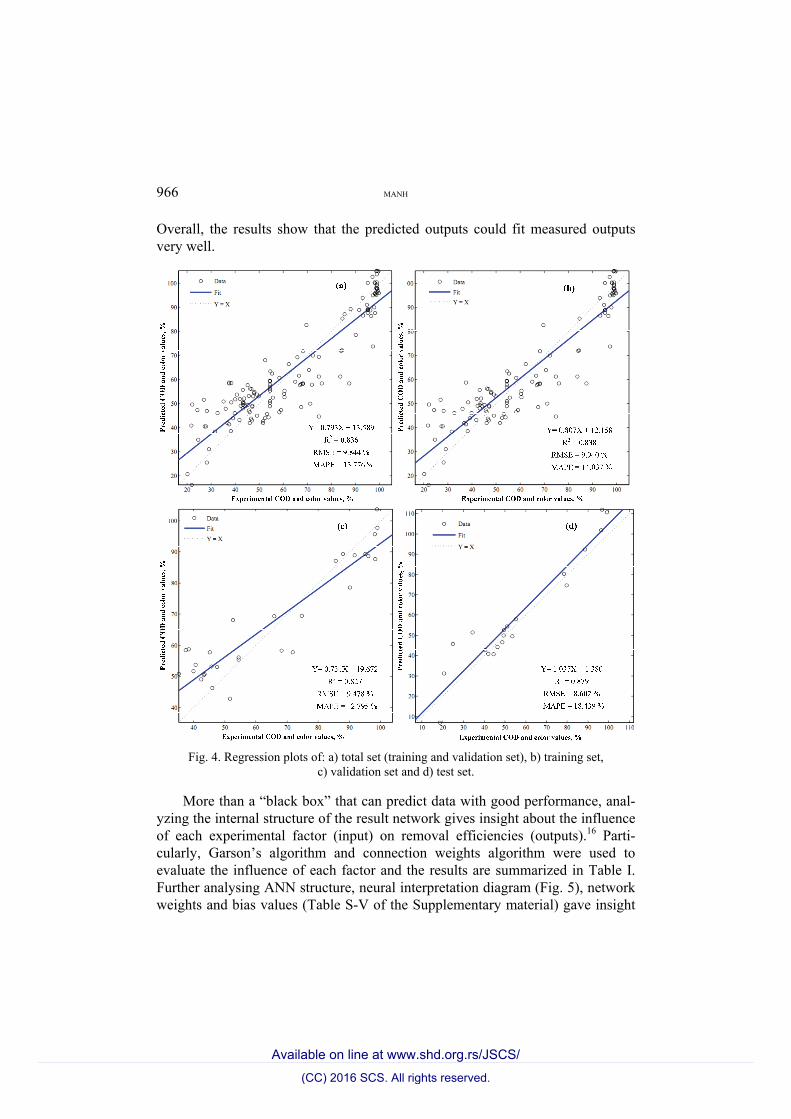
= 9.478 %, and mean absolute percentage error MAPEvalidation = 12.795 %, which could improve the convergence and prediction capacity of the model. Reg-arding Fig. 4, the regression of validation set closely replicated the regression of training set, i.e., the ANN model could predict new data as well as how it did in training. The realistic estimation of the model was also verified experimentally by modeling with the test data set. R2
test value 0.879 for this experiment is quite similar to R2
test value of 0.876, as presented in the modeling of naphthalene removal process using ANN by Jing et al.23 Moreover, the low RMSEtest value (8.602 %) indicated that the trained model could predict dye removal efficiency of a new experiment with 8.60 % error, which is higher than the RMSEtest value (13.82 %) in the report by Choi and Park25 for modeling the wastewater treatment process. During this testing process, the mean absolute percentage error (MAPE) was 18.439 % (Table S-IV), value comparable to MAPE around 16.3 % for predicting COD effluent in the wastewater treatment plant by Côté et al. 26
_________________________________________________________________________________________________________________________
(CC) 2016 SCS. All rights reserved.
Available on line at www.shd.org.rs/JSCS/
966 MANH
Overall, the results show that the predicted outputs could fit measured outputs very well.
Fig. 4. Regression plots of: a) total set (training and validation set), b) training set,
c) validation set and d) test set.
More than a “black box” that can predict data with good performance, anal-yzing the internal structure of the result network gives insight about the influence of each experimental factor (input) on removal efficiencies (outputs).16 Parti-cularly, Garson’s algorithm and connection weights algorithm were used to evaluate the influence of each factor and the results are summarized in Table I. Further analysing ANN structure, neural interpretation diagram (Fig. 5), network weights and bias values (Table S-V of the Supplementary material) gave insight
_________________________________________________________________________________________________________________________
(CC) 2016 SCS. All rights reserved.
Available on line at www.shd.org.rs/JSCS/

MODELING ELECTROCOATULATION PROCESS USING ANN 967
into the sophisticated contribution of each factor to the outputs and their correl-ation.
TABLE I. Contribution of each input factor to output values in the electrocoagulation process
Output Factor Garson’s algorithm, % Ranka Connection
weight Ranka Influence
Decolorization (O1)
Dye concentration (I1) 15.48 4 –0.001 5 Negative pH (I2) 20.07 3 0.572 3 Positive
Current density (I3) 24.56 2 3.489 1 Positive Time (I4) 25.89 1 1.743 2 Positive
Csulphate (I5) 14.01 5 0.063 4 Positive COD removal (O2)
Dye concentration (I1) 23.09 2 0.863 1 Positive pH (I2) 20.82 3 –0.093 5 Negative
Current density (I3) 15.42 5 –0.159 4 Negative Time (I4) 16.84 4 0.173 3 Positive csulphate (I5) 23.81 1 0.773 2 Positive
aRank of the absolute values
Fig. 5. Neural interpretation diagram of dye removal using electrocoagulation.
For decolorization, both algorithms comply that the three most influential factors are current density (I3), electrolysis time (I4) and initial pH (I2). Con-nection weight algorithm confirms that these factors have positive effect on decolorization, i.e., when their values increase, the decolorization efficiency inc-reases. Significance of current density, electrolysis time and initial pH were also recorded for decoloring Basic Red 46 by EC in the research by Daneshvar et al.7 For current density (or electrolysis time), their positive effects could be explained by the following; when the current density (or electrolysis time) increased, the amount of iron ion produced on the electrodes increased according to Faraday’s law. That led to increase in flocculant production and then improved color removal capacity. In the case of pH, its value determined the iron hydroxides formation in EC process.6 If the initial pH value was higher, the more iron hyd-
_________________________________________________________________________________________________________________________
(CC) 2016 SCS. All rights reserved.
Available on line at www.shd.org.rs/JSCS/
968 MANH
roxides were formed, which increased the decolorization efficiency. The other two factors, initial dye concentration (I1) and sulphate concentration (I5), have minor effect on decolorization improvement.
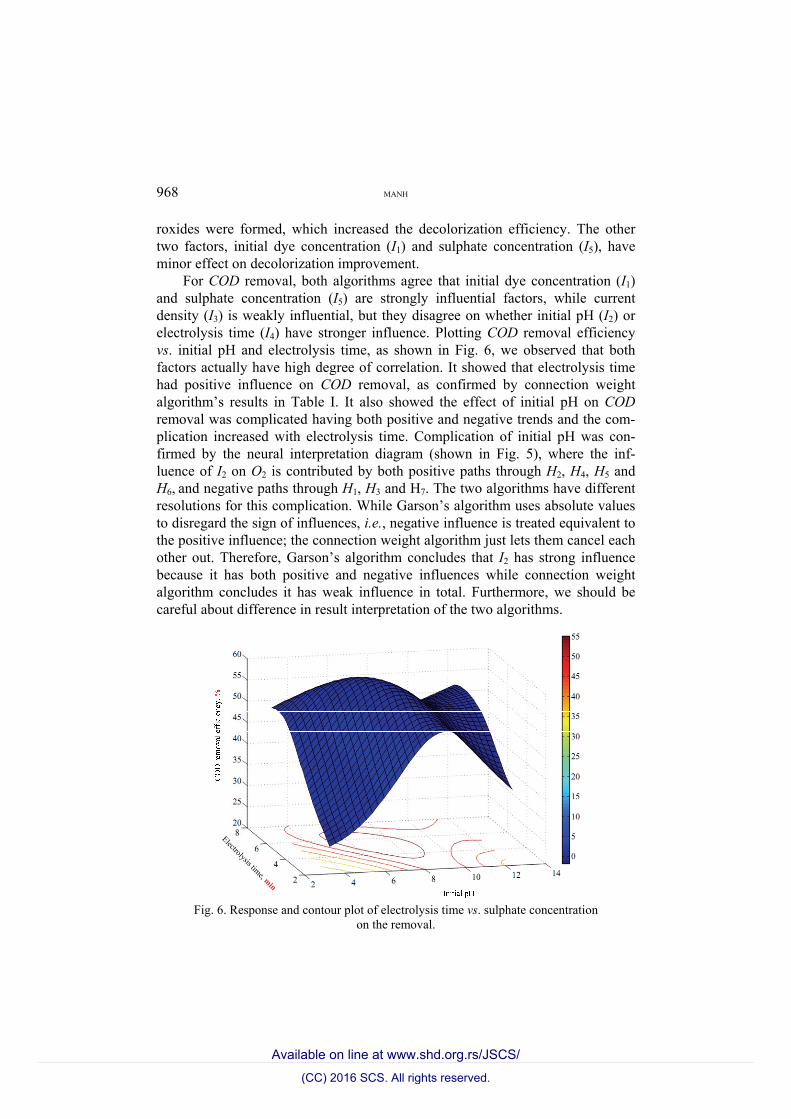
For COD removal, both algorithms agree that initial dye concentration (I1) and sulphate concentration (I5) are strongly influential factors, while current density (I3) is weakly influential, but they disagree on whether initial pH (I2) or electrolysis time (I4) have stronger influence. Plotting COD removal efficiency vs. initial pH and electrolysis time, as shown in Fig. 6, we observed that both factors actually have high degree of correlation. It showed that electrolysis time had positive influence on COD removal, as confirmed by connection weight algorithm’s results in Table I. It also showed the effect of initial pH on COD removal was complicated having both positive and negative trends and the com-plication increased with electrolysis time. Complication of initial pH was con-firmed by the neural interpretation diagram (shown in Fig. 5), where the inf-luence of I2 on O2 is contributed by both positive paths through H2, H4, H5 and H6, and negative paths through H1, H3 and H7. The two algorithms have different resolutions for this complication. While Garson’s algorithm uses absolute values to disregard the sign of influences, i.e., negative influence is treated equivalent to the positive influence; the connection weight algorithm just lets them cancel each other out. Therefore, Garson’s algorithm concludes that I2 has strong influence because it has both positive and negative influences while connection weight algorithm concludes it has weak influence in total. Furthermore, we should be careful about difference in result interpretation of the two algorithms.
Electrolysis time, min Fig. 6. Response and contour plot of electrolysis time vs. sulphate concentration
on the removal.
_________________________________________________________________________________________________________________________
(CC) 2016 SCS. All rights reserved.
Available on line at www.shd.org.rs/JSCS/

MODELING ELECTROCOATULATION PROCESS USING ANN 969
CONCLUSIONS
Electrocoagulation process (EC) was demonstrated to be a simple and effi-cient method for color removal of simulated wastewater from Sunfix Red S3B dye. The newly proposed ANN model successfully predicted the coagulation process with determination coefficient (R2), the root mean square error (RMSE), and mean absolute percentage error (MAPE) found as 0.836, 9.844 % and 13.776 %, respectively. Based on the model and sensitivity analysis methods (Garson’s algorithm, connection weight method and neural interpretation diagram), it can be concluded that the efficiency of EC was highly dependent on current density, electrolysis time and initial pH for color removal. COD removal efficiency was highly dependent on IDC, sulphate concentration, and electrolysis time combined with initial pH. These results showed a potential of ANN as a robust tool for modeling coagulation process and for analyzing effects of each factor on dye removal process.
SUPPLEMENTARY MATERIAL Details about soil treatment, materials, chemicals and are available electronically from
http://www.sbd.org.rs/JSCS/ or from the corresponding author on request. И З В О Д
МОДЕЛОВАЊЕ УКЛАЊАЊА SUNFIX RED S3B ИЗ ВОДЕНОГ РАСТВОРА ЕЛЕКТРОКОАГУЛАЦИОНИМ ПОСТУПКОМ КОРИШЋЕЊЕМ ВЕШТАЧКЕ
НЕУРОНСКЕ МРЕЖЕ
HA BUI MANH
Department of Environmental Sciences, Sai Gon university, 273 An Duong Vuong St., District 5, Ho Chi Minh 700000, Vietnam
Ова студија представља примену вештачких неуронских мрежа (ANN) како би се предвидела ефикасност уклањања боје (вредност хемијског утрошка кисеоника и боје) електрокоагулационим поступком из воденог раствора Sunfix Red S3B. Употребљен је алгоритам Бајесијанске регулације са експерименталним подацима који су укључивали пет фактора: pH, густину струје, концентрацију сулфата, почетну концентрацију боје (IDC) и време електролизе. Приликом тестирања ANN модела добијена су предвиђања са ниском вредношћу корена средње квадратне грешке (9,844 %), средње релативне грешке (13,776 %) и високом вредношћу коефицијента детерминације (0,836). Гeрсонов и Олденов алгоритам, као и визуализациони приступ, примењени су да би се проценио утицај улазних променљивих на ефикасност уклањања боје. Одређено је да су за обез-бојавање најделотворније променљиве густина струје, време електролизе и почетна pH вредност, док је на хемијски утрошак кисеоника јако утицала почетна концентрација боје и сулфата. Овим корацима смо показали робусност ANN при моделирању и ана-лизи електрокоагулационог процеса.
(Примљено 8. јануара, ревидирано 15. марта, прихваћено 25. марта 2016)
REFERENCES 1. A. Gottlieb, C. Shaw, A. Smith, A. Wheatley, S. Forsythe, J. Biotechnol. 110 (2003) 49.
_________________________________________________________________________________________________________________________
(CC) 2016 SCS. All rights reserved.
Available on line at www.shd.org.rs/JSCS/
970 MANH
2. S. Sadhasivam, E. Saritha, S. Savitha, K. Swaminathan, Bull. Environ. Contam. Toxicol. 75 (2005) 1046
3. T.-H. Kim, C. Park, S. Kim, J. Clean Prod. 13 (2005) 779 4. J.-W. Lee, S.-P. Choi, R. Thiruvenkatachari, W.-G. Shim, H. Moon, Water Res. 40 (2006)
435 5. L. Zou, B. Zhu, J. Photochem. Photobiol., A 196 (2008) 24 6. N. Daneshvar, A. R. Khataee, A. R. Amani Ghadim, M. H. Rasoulifard, J. Hazard.
Mater. 148 (2007) 566 7. N. Daneshvar, A. Oladegaragoze, N. Djafarzadeh, J. Hazard. Mater. 129 (2006) 116 8. M. Y. A. Mollah, P. Morkovsky, J. A. G. Gomes, M. Kesmez, J. Parga, D. L. Cocke, J.
Hazard. Mater. 114 (2004) 199 9. A. Cerqueira, C. Russo, M. R. C. Marques, Braz. J. Chem. Eng. 26 (2009) 659
10. S. S. Moghaddam, M. R. A. Moghaddam, M. Arami, J. Environ. Manage. 92 (2011) 1284 11. M. Khayet, A. Y. Zahrim, N. Hilal, Chem. Eng. J. 167 (2011) 77 12. S. Sadri Moghaddam, M. R. Alavi Moghaddam, M. Arami, J. Hazard. Mater. 175 (2010)
651 13. B. Lamrini, A. Benhammou, A. Karama, M. V. Lann, Advances in Carbohydrate Chem-
istry, Springer, Vienna, 2005, p. 79 14. N. Daneshvar, A. R. Khataee, N. Djafarzadeh, J. Hazard. Mater. 137 (2006) 1788 15. L. S. Clesceri, A. E. Greenberg, A. D. Eaton, Standard Methods for the Examination of
Water and Wastewater, 20th ed., American Public Health Association, Section 4500-H+, Washington DC, 1998, p. 79
16. E. S. Elmolla, M. Chaudhuri, M. M. Eltoukhy, J. Hazard. Mater. 179 (2010) 127 17. F. Masood, M. Ahmad, M. Ansari, A. Malik, Bull. Environ. Contam. Toxicol. 88 (2012)
563 18. M. Al-Abri, K. Al Anezi, A. Dakheel, N. Hilal, Desalination 253 (2010) 153 19. K. P. Oliveira-Esquerre, M. Mori, R. E. Bruns, Braz. J. Chem. Eng. 19 (2002) 365 20. F. Geyikçi, E. Kılıç, S. Çoruh, S. Elevli, Chem. Eng. J. 183 (2012) 53 21. M. S. Bhatti, D. Kapoor, R. K. Kalia, A. S. Reddy, A. K. Thukral, Desalination 274
(2011) 74 22. Y. Abdollahi, A. Zakaria, M. Abbasiyannejad, H. R. F. Masoumi, M. G. Moghaddam, K.
A. Matori, H. Jahangirian, A. Keshavarzi, Chem. Cent. J. 7 (2013) 1 23. L. Jing, B. Chen, B. Zhang, Water Air Soil Pollut. 225 (2014) 1 24. S. Banik, R. Rangayyan, J. E. L. Desautels, Computer-aided Detection of Architectural
Distortion in Prior Mammograms of Interval Cancer, Morgan & Claypool Publishers, San Rafael, CA, 2013, p. 79
25. D.-J. Choi, H. Park, Water Res. 35 (2001) 3959 26. M. Côté, B. P. A. Grandjean, P. Lessard, J. Thibault, Water Res. 29 (1995) 995.
_________________________________________________________________________________________________________________________
(CC) 2016 SCS. All rights reserved.
Available on line at www.shd.org.rs/JSCS/