modeling turnover and their antecedents using the locus … · the locus of control as the...
TRANSCRIPT

INT-04 1
MODELING TURNOVER AND THEIR ANTECEDENTS USING THE LOCUS OF CONTROL AS MODERATION: EMPIRICAL STUDY OF PUBLIC
ACCOUNTANT FIRMS IN JAVA INDONESIA
LENY PUSPITASARI Muhammadiyah University of Jember
DWI CAHYONO Muhammadiyah University of Jember
ABSTRACT
The objectives of this study was examined modeling turnover intentions and
their antecedents using Locus Of Control as moderation, empirical study of public accountant firms in Java Indonesia. This study use SEM (Structural Equation Modeling) and LISREL (Linier Structural Relation) to confirm the moderating effects related to TI (turnover intention), and considers on OC (Organizational Commitment), JS (Job Satisfaction), and POS (Perceived Organizational Support) as individual or organizational outcomes.
This research found that turnover intention influencing by internals Locus of Control and externals Locus Of Control as moderation was negatively relationship to OC and JS, while POS as JS antecedent factor was negatively affected to JS, therefore it can be concluded that POS had negative relationship to TI. The antecedent examined was perceived organizational support (POS); job satisfaction and OC were mediating constructs. Test results indicated a stronger influence of job satisfaction on TI and OC among those with an internal LOC than those with an external LOC. However, the influence of POS on job satisfaction and OC was stronger among externals than internals. Key words: turnover intention, Organizational Commitment, Job Satisfaction,Perceived
Organizational Support
INT-04 2
I. Introduction
Employee turnover intention (TI) becomes important overlooked in many firms,
including service-based organization. Public Accountant Firms, which employees are
accountants were concerned at services, was influenced by the topic, Accountant’s job
is full of risk and he must be prudent in doing his job. Accountant has obligation to keep
their behaviors standard to the organization where they work, their professions, society
and them selves (Fine et.al, 2004). Commonly, firms attempt to decrease Employee
Turnover Intention because it may cause firms loss. Kollaritsh (1968) shown that
around 85 % public accountants at big Public Accountant Firms left their jobs to search
for alternative employment (Belkaoi,1989). Commonly, significantly characteristics
influencing turnover intentions of public accountants at Public Accountant Firms are,
Instrument and Job Satisfaction. Susskind et.al (2000), suggested that any cumulative
research results showed significant and negative relationship related to TI on a
consistent basis. Recent model of TI have linked job satisfaction with TI through
various intermediate withdrawal cognitions such as Instrument (OC) and Perceived
Organizational Support (POS) (Susskind et.el, 2000; Mannheim, Baruch and Tal, 1997).
At the previous researches have been found that Job satisfaction is one of the
most important factors which is influencing worker’s satisfaction because most of their
time were spend at their work place (Riggio, 1990). Many researches related to Job
Satisfaction and Instrument (OC), which influencing Employee Turnover Intentions
were found. Gregson (1992) stated that Job Satisfaction is the beginning of Instrument
at Accounting Firms. In the other word, Job Satisfaction influenced Instrument. In
addition, Aranya et.al (1982) argued that there was a statistical correlation between
instrument and job satisfaction. While, Suwandi and Indriantoro (1992) stated that there

INT-04 3
was a consistent relationship with the previous researches, that Job Satisfaction was
positively correlation with instrument. On the other hand, there were some empirical
evidence which shown that job satisfaction and instrument had unclear relationship and
inconsistent. Mathiew (1988), Price and Mueller (1986), William and Hazer (1986),
argued that job satisfaction were the previous variable of the instrument, while Bateman
and Stasser (1984) found that instrument was the previous variable of job satisfaction.
While some of the current researches found that both Instrument and Job Satisfaction
were related reciprocally without influencing each other (Mathiew, 1991). While
perceived organizational support (POS) has been found to positively influence both TI
and OC (Susskind et.al, 2000). Furthermore, several studies have recently found that
psychological variables may be useful to understand TI and Job Satisfaction.
According to those research gaps from the previous researches and literature
exist, this study will investigate employees turnover intentions and its antecedents using
the Locus of Control as the moderator variable, this study take a starting point from the
previous research of Chou Kang Chiu, Chieh Peng Lin, Yuan Hiu Tsai & Cing Yun
Hsiao (2005), which is observed TI and their antecedents using the locus of control as a
moderation: A case of Customer Service Employees to find the new evidence. Using
Susskind et.al (2000) model as a guide, this study will explore the causal model of TI
using a specific psychological moderating variable: Locus of Control (LOC)
This study differs from the previous research in two ways. First, the object of
this research where examined public accountants at Public Accountant Firms in Java,
Indonesia. Second, this study was using La Rose model to explore the causal model of
LOC. This study use SEM (Structural Equation Modeling) and LISREL to confirm the

INT-04 4
moderating effects related to TI, and considers on OC, Job Satisfaction, and POS as
individual or organizational outcome.
The remaining sections of this paper are organized as follows: Section II
presents an overview of literature, such definitions of each variable and develops
testable hypotheses. Section III describes the methodology and measurements of
variables. Section IV reports and discuss the result. Section V summarizes the findings
of this research.
II. Literature Review and Hypotheses
Job Satisfaction (JS), Instrument (OC) and Turnover Intentions (TI)
Job satisfaction was effectiveness or emotional response to several aspects of
jobs or works Kreitner dan Kinicki, (1995). Thus definition shown that job satisfaction
was not the single concept, in contrast individuals can relatively satisfied with one
aspect of their job and unsatisfied with their other jobs. Anastasia (1979) concluded that
several researches related to job satisfaction and turnover intentions relationship (such
as: Lockle, 1976; Porter and Steer, 1973) found that there was a relation between job
satisfaction and turover intentions. Turnover intentions at organization was commonly
related to their unsatisfied of what they wanted and what they gotfrom their
organization such as: salary, promotion, their chef support and their perceived of their
own work (such as: task variations, responsibility, and otonomy).
The presence or absence of numerous attributes in the employing organizations
influences worker’s attitudes concerning one’s commitment to his/her organization
(Herzberg, 1966; Steers, 1977). Job satisfaction and OC are related, but distinguishable
attitudes. Job satisfaction is associated with the affective response to the immediate
work environment, while OC is more stable and enduring (Norris and Niebuhr, 1983).

INT-04 5
A number of empirical studies confirm the important role of OC and Job satisfaction in
the turnover process (Chiu and Francesco, 2003; Susskind et.al, 200). It generally
indicates that one’s TI is negatively related to Job satisfaction and OC. Near (1989),
Lachman and Aranya (1986), argued that employees with highly-committed to their
organization are low likely to quit rather than employee with low-committed to their
organization. Employees may be temporarily dissatisfied with their job, but never
remain the low-committed to their organizations.
The evidence that JS has a direct effect on TI as well as an indirect effect
through OC has been found (Blau, 1987). This relationship is supported by a number of
research which identify JS as an antecedent of OC (Tett and Meyers, 1993) the
numerous studies have provided evidence of a strong negative relationship between JS
and TI (Mannheim, Baruch and Tal, 1997; Abraham, 1999). Lawler (1971 to Luthan,
1995) suggested the similar approach that satisfaction and dissatisfaction was
inappropriate function between what individuals’ feel and amount of feedback they
accepted. Dissatisfaction of salary commonly influenced low job satisfactions of
feedback to predictably job components (Lawler, 1990). Meanwhile, individuals with
high eagerness to their job had low dissatisfied of their acceptably salary (Motowidlo,
1982)
Job satisfaction can predict absence level and employees turnover, although its
relationship was moderate. Motowidlo (1983) used job satisfactions to predict turnover
intentions, the real effect of turnover intentions was shown at turnover intentions it
selves. The study of Bateman and Strasser (1984) at Zelfane (1994) result was
supported that nurses and other staffs job satisfaction, colleagues and supervisor were
the strong predictor of commitment. According to Slattery and Selvarajab (2005) stated
INT-04 6
in social exchange theory, that there was a social exchange relationship between two
individuals or more or between organization and their workers, and between job
satisfaction and instrument as antecedent of turnover intentions (Horn and Griffeyh,
1995) at Slattery and Selvarajan (2005). Therefore the hypotheses are summarized as
follows:
H1 : OC has a negative influence on TI H2 : Job satisfaction has a negative influence on OC H3 : Job satisfaction has a negative influence on TI
Perceived Organizational Support (POS), Job Satisfaction (JS), Organizational
Commitment (OC)
POS is related to employees’ satisfaction in term of their perception about their
organization’s support. This describes the extent to which employees believe that their
employer is concerned with their well being (Shore and Tetrick, 1991) and is influenced
by aspects of the organization’s treatment of the employees. Generally, employees will
be satisfied with their jobs and committed to their organizations if they are content with
the nature of work itself, and if they perceive current pay policies and future
opportunities for promotion within their organizations to be adequate. Therefore, POS is
an important influence on job satisfaction. Without sufficient POS, employees may be
dissatisfied with their job and view their task negatively. Shore and Tetrick (1991)
argued that POS shows a strong empirical relationship with OC, yet remains distinct
from commitment because POS focuses on employee accounts of organization’s
awareness, whereas OC represent reported individual employee concern for the
organization (Shore and Wayne, 1993). Therefore the hypotheses are summarized as
follows:

INT-04 7
H4 : Perceived organizational support (POS) has a positive influence on job satisfaction (JS) H5 : Perceived organizational support (POS) positively influences on Organizational Commitment (OC) Locus of Control (LOC)
JS has held a prominent place in the organization and has significant correlation
with LOC for ages. LOC is an important construct describing individual differences. It
is one of the most widely studied personality concept (Matsumoto, 2000) and has often
used for predicting employees’ behavior (Spector, 1988; Spector et.al, 2002). LOC is a
well-documented personality trait that refers to individual differences in a generalized
belief in internal versus external control of reinforcement (in the context of a stimulus
and response) (Rotter, 1966; Christohee Boone, Woody V.O and Arjen V.W et.al,
2005). LOC is strongly associated with individual’s feeling of potency. LOC can also
be defined as:The degree to which the individual perceives that the reward (obtained)
follow from or is contingent upon his own behavior or attributes (Rotter1996).
In many researches, the importance of LOC to work experience has been shown
that the internals earned higher compensation, had higher-status occupation, and were
more satisfied with their job. People with an external LOC (externals) tend to feel like
pawns in a complicated environment governed by forces outside their own control,
whereas internals feel they are active masters of their own fates. Generally, people
differ in term of the amount of control their believe they have over their own behavior
and environment (Lefcourt, 1966; Rotter, 1966; Levenson, 1974; Desmond Lam and
Dick Mizerski et.al, 2005). Hoffman et.al (2000) stated that internals are likely tend to
initiate new activities and undertake efforts or action in order to manage events around
them actively and hence, are more action oriented. In addition Blau (1987) showed that

INT-04 8
internals exert greater effort personally likely to take an active posture with respect to
their environment (Kren, 1992) and external may adopt a passive role. Externals often
feel a lack personal control and believe their actions do not necessarily lead to their
desired result. Externals are more likely to wait until environmental factors forces them
to leave.
Regarded to such aspects the LOC are hypothesizing to exist in the relationships
between job satisfaction and OC and between OC and TI. Therefore those relationships
would be moderated by LOC, for which the relationship is stronger for internals than
externals. Finally, we hypothesize as follows:
H1a : the negative relationship between OC and TI is stronger for internals than externals. H2a : the negative relationship between job satisfaction and TI is stronger for internals
than externals H3a : the positive relationship between POS and job satisfaction is stronger for than
externals H4a : the positive relationship between POS and OC is stronger for internals than
externals H5a : the positive relationship between POS and OC is stronger for internals than for
externals Regarded to the hypotheses made, the research framework have been made as
follows: Insert Figure 1. Research Framework
III. Methods
General View of Respondents
Data were collected using questionnaires, which was delivered to 500
respondents of auditor staffs in Public Accountants Firms in Java. This Research
population, like other research for example, Aranya Et al ( 1982), Noriss And Buhr (
1983) and Meixener and Bline ( 1989), using staff of public accountant firms
individually as analysed unit. Intake sampel of pursuant to population public accountant
INT-04 9
firms amount. Address And Data taken away from a Directory Public Accountant
Firms of Year 2005 published by IAI Public Accountant Compartement as sampling.
Hereinafter the gathering sampel technique by accidental sampling that is sampling
technique owning sampel from easiest unit or individual met or accessed.
Total questionnaires accepted were 113 and only 103 respondents can be
analyzed. The reducing from total respondents which can be analyzed because of
several reasons such as: 6 respondents did not complete all of the questions given, and 4
respondents gave uncompleted answers. The final data which was analyzed was more
than the limitation of the minimum data analyzed using LISREL. From 103 respondents
48 respondents identified as internals and 55 respondents identified as externals. The
characteristics of those respondents
were shown as follows on table 1. Insert. Table 1.
Construct Measurement. All variables investigated were measured on scales drawn and modi.ed from
the existing literature, and three common steps were employed to choose items for
measurement from the existing literature.First, the items from the existing literature
were all translated into Indonesian.
A five-point Likert scale anchored by Strongly Agree/Strongly Disagree was
used for scaling. TI were measured using the four items (Bluedorn, 1982) set out in
Appendix A: turnover inventions, organizational commitment, job satisfaction, and
perceived organizational support. Job satisfaction was measured using these items
(Hackman & Oldham, 1975; Churchill, Ford, & Walker, 1974). A sample item was, “I
am generally satisfied with the kind of work I do in this job.” OC was assessed by five-
INT-04 10
item affective organizational commitment taken from the Organizational Commitment
Questionnaire (OCQ) of Mowday, Steers, and Porter (1979). POS investigates whether
employees feel their organization cares about their satisfaction at work, cares about their
opinion, would help them if they needed a special favor, would help if they have a
problem, and considers their goals and values. POS was measured using .ve retained
scale items (Susskind et al., 2000) due to their good validity tested by Susskind et al.
(2000), which were originally from Eisenberger, Fasolo, and Davis-LaMastro (1990).
LOC here was measured via rating format of an abbreviated version of LOC
(Barnett & Lanier, 1995). Sample items include: “Many of the unhappy things in
people’s lives are partly due to bad work,” and “People’s misfortunes result from the
mistakes they make.” The abbreviated LOC has eleven items originally from Rotter’s
(1966) scale (Barnett & Lanier, 1995). Two measures of LOC were obtained: one in the
original forced-choice format and one in a four-point rating format (Barnett & Lanier,
1995). Respondents were .first asked to respond to the items in the original format by
selecting the statement from each pair that better re.ected their beliefs. Then they were
asked to indicate whether the chosen internal or external statement was “much closer”
or “slightly closer” to their belief. If the chosen belief was much closer or slightly closer
to the internal statement, it was scored a 1 or a 2, respectively. If the chosen belief was
slightly closer or much closer to the external statement, it was scored a 3 or 4. Total
scores for the rating format were divided by the number of items in the scale and could
therefore range from 1 to 4 (Barnett & Lanier,1995).
While to show the measurement of variables of this study such as (Job
Satisfaction, Perceived Organizational Support, Turnover Intention, and OC) we used
absolute frequency table which was shown average value, theoretical range, real range,

INT-04 11
and deviation standard, which was shown at table 2. Based on the table 2, the
measurement of Job Satisfaction variable shown that respondents’ answers were around
5-19, which was lower than the maximum limitation of theoretical range, which was
around 4-20. This value indicated that respondents shown low Job Satisfaction. On
Perceived Organizational Support variable, the score was around 5-9 with theoretical
range was around 4-20, indicated that respondents shown the low appreciation to
Perceived Organizational Support in Public Accountant Firms, while for Turnover
Intention the score was around 5-19 with theoretical range was around 4-20, indicated
that respondents has low appreciate on turnover intention at their firms. Instrument
variable was around 5-25 with theoretical range was around 6-25, this was indicated that
respondents had low commitment to their organizations
Insert. Table 2.
Data Analysis
This study used SEM (Structural Equation Model) and LISREL (Linier
Structural Relation) to conduct the data analysis for confirmatory factor analysis. SEM,
a multivariate statistical techniques based on regression, can be used to confirm the
significant relation among variables which LOC as moderating variables. Before doing
SEM analysis, it suggested to have screening data to conduct descriptive measurements
(mean, standard, and deviation) and the most important was to convince SEM
assumptions were fulfils, there was normality Ghozali and Fuad (2005). The result of
screening data from variables such as Job Satisfaction, Perceived Organizational,
Turnover Intentions and Instrument were normal, both in univarint and multivariate, it
can be seen at p-value which was more than 0.05

INT-04 12
Data analysis process afterwards was measuring reciprocal relationships among
the variables. Considering that the data were behavioral data which collected by
questionnaires, statistical test were needed to confirm the appropriate of questionnaires.
We used reliability test using SPSS programmed and validity test with confirmatory
factor analysis using LISREL. After those tests, research analysis done
Reliability Test and Confirmatory Factor Analysis
Consistency dependence degree and measurement stability, measured using
reliability test. The result of reliability test using SPSS 12 found that alpha correlation
of cronbach was higher than 0.7, while confirmatory factor analysis test using LISREL
showed that there were no eliminated indicators, on the other words all of the variables
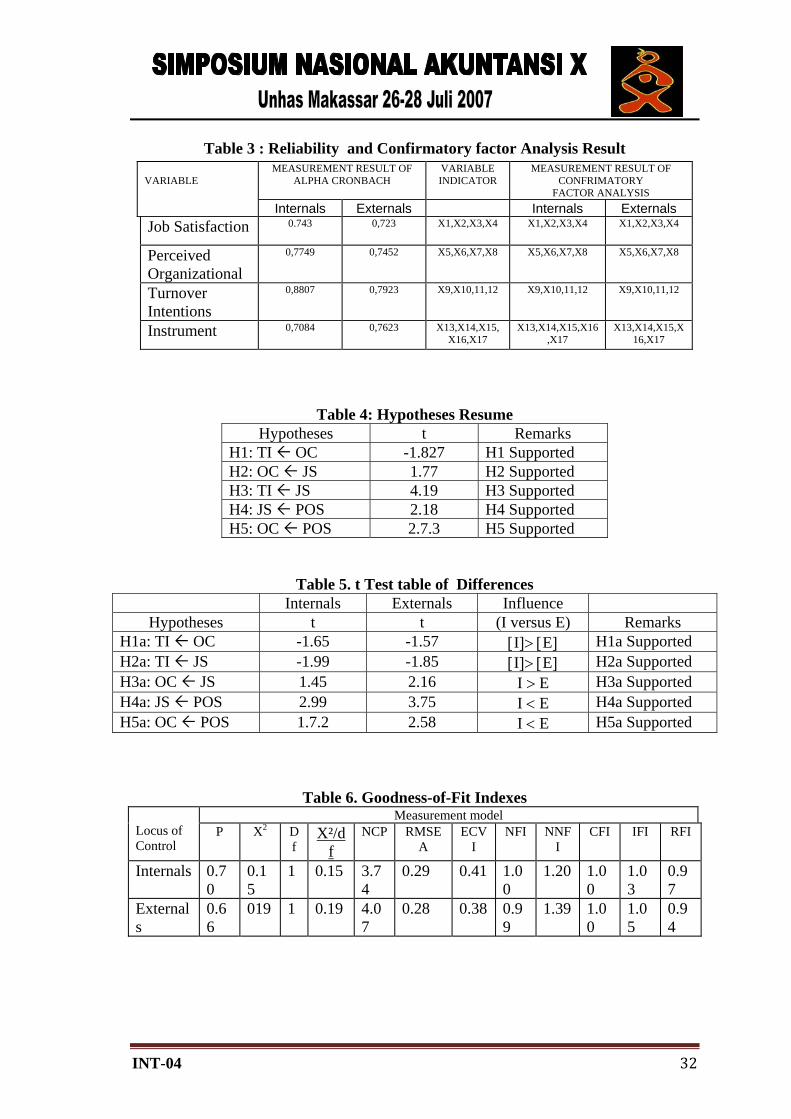
were accepted. The measurement result shown on table 3
Insert. Table 3.
Hypothesis Analysis Result
Before analyzing SEM full model this used to divine variable latent, model
was analyzed using confirmatory factor analysis to find each indicator in fit model. Fit
to the purpose, this found the relation among variables (Job Satisfaction, Perceived
Instrument, Turnover Intentions, and Instrument), with Locus of Control as moderation.
All the variables simultaneously measured using structural equal with LISREL 8.54
(Linier Structural Relation) as the measurement instrument. This study confirmed the
hypothesis as follows:
Hypothesis 1 confirmed that OC has a negative influence on TI was
significant because t value was negative -1.827 higher than -1.296 of the total sample
for more than 60 samples. This research was supported the previous research which
stated that OC has a negative influence on TI. This hypothesis was supported, according
INT-04 13
to some of researches Organizational Commitment were characterized as the acceptance
of behavioral goals and a willingness to exert effort on the organization’s behalf (Angle
and Perry, 1981; Porter et.al, 1974) on Hossein Nouri. Psychology and organizational
behavior studies indicated that instrument is linked to work outcomes such as job
performance (Mathieu and Zajac, 1990; Randall, 1990). Randall (1990) noted in her
meta analysis of Instrument, researchers have theorized that OC is directly related to
positive work outcomes such as low turnover. Therefore, the public accountants should
alter their strategies to achieve high OC and reduce TI.
Hypothesis 2 stated that Job satisfaction has a positive influence on OC was
significant because t value 1.77 higher than 1.296 with total sample more than 60
samples. This result was supported the previous researches which stated that Job
satisfaction has a positive influence on OC, according to a number of empirical studies
confirmed that it generally indicated that one’s TI is negatively related to Job
satisfaction and OC. Near (1989), Lachman and Aranya (1986), argued that employees
with highly-committed to their organization are low likely to quit rather than employee
with low-committed to their organization. Employees may be temporarily dissatisfied
with their job, but never remain the low-committed to their organizations. Although,
some of accounting research has shown that OC and JS were positively related to one
another (Bline et.al, 1991; Aranya et.el and Ferris, 1984), in general, it appeared that JS
preceded OC (Gregson, 1992; Farkas and Tetrick, 1989; Curry et.al, 1986, William and
Hazer, 1986; Bateman and Strasser, 1984). The presence or absence of numerous
attributes in the employing organizations influences worker’s attitudes concerning one’s
commitment to his/her organization (Herzberg, 1966; Steers, 1977). Job satisfaction and
OC are related, but distinguishable attitudes. Job satisfaction is associated with the

INT-04 14
affective response to the immediate work environment, while OC is more stable and
enduring (Norris and Niebuhr, 1983). Therefore, this research was shown that Job
satisfaction has a positive influence on OC.
Hypothesis 3 stated Job satisfaction has a negative influence on TI was
significant because t value negative -4.19 was higher than -1.296 with total sample more
than 60 samples. This result was supported the previous research which stated that Job
satisfaction has a negative influence on TI, some researches related to Job satisfaction
shown that JS has a direct effect on TI as well as an indirect effect through OC (Blau,
1987). This relationship is supported by a number of research which identify JS as an
antecedent of OC (Tett and Meyers, 1993) the numerous studies have provided evidence
of a strong negative relationship between JS and TI (Mannheim, Baruch and Tal, 1997;
Abraham, 1999). Lawler (1971 to Luthan, 1995) suggested the similar approach that
satisfaction and dissatisfaction was inappropriate function between what individuals’
feel and amount of feedback they accepted. Dissatisfaction of salary commonly
influenced low job satisfactions of feedback to predictably job components (Lawler,
1990). Meanwhile, individuals with high eagerness to their job had low dissatisfied of
their acceptably salary (Motowidlo, 1982). Job satisfaction can predict absence level
and employees turnover, although its relationship was moderate. Motowidlo (1983)
used job satisfactions to predict turnover intentions, the real effect of turnover intentions
was shown at turnover intentions it selves.
Hypothesis 4 confirmed that POS has a positive influence on Job Satisfaction
was significant, because t value positive 2.18 was higher than 1.296 with total sample
more than 60 samples. This research was supported the previous which stated POS has a
positive influence on Job Satisfaction some researches shown that generally, employees

INT-04 15
will be satisfied with their jobs and committed to their organizations if they are content
with the nature of work itself, and if they perceive current pay policies and future
opportunities for promotion within their organizations to be adequate. Therefore, POS is
an important influence on job satisfaction. Without sufficient POS, employees may be
dissatisfied with their job and view their task negatively.
Insert. Table 4.
Hypothesis 5 stated that POS positively influences on OC were significant
because t value was positive 2.73 higher than 1.296 with total sample more than 60
samples. This result was supported the previous researches such as Shore and Tetrick
(1991) argued that POS shows a strong empirical relationship with OC, yet remains
distinct from commitment because POS focuses on employee accounts of organization’s
awareness, whereas OC represent reported individual employee concern for the
organization (Shore and Wayne, 1993). Therefore, the higher POS accepted the higher
Organizational Commitment hold. If organization is concerned about employees’ POS,
it would raise individuals’ Perceived
Organizational Support (POS). The Hypotheses 1-5 Resume shown on table 4.
The measurement for both internals LOC and externals LOC using t test
differences with LISREL 8.54. The complete result was shown on table 5. This study
confirmed the hypotheses result related to internals LOC and externals LOC affected to
variables such as TI, OC, JS, and POS as follows:
Hypothesis 1a stated the negative relationship between OC and TI is stronger
for internals than externals. Result measurement of LOC for internals showed that t
value was negative 1.65 while for externals negative 1.57 higher than 1.303 with total
sample 40. Relationship between OC and TI is stronger for internals than externals and
INT-04 16
Hypothesis 1a supported. Strong instrument is characterized as the acceptance of
behavioral goals and a willingness to exert effort on the organization’s behalf (Angle
and Perry, 1981; Porter et.al, 1974) on Hossein Nouri. Psychology and organizational
behavior studies indicated that instrument is linked to work outcomes such as job
performance (Mathieu and Zajac, 1990; Randall, 1990). Randall (1990) noted in her
meta analysis of organizational commitment, researchers have theorized that OC is
directly related to positive work outcomes such as low turn over
Hypothesis 2a stated the negative relationship between job satisfaction and TI
is stronger for internals than externals. Measurement result for internals LOC showed
that the t value was negative 1.99 while for externals LOC was negative 1.85 higher
than 1.303 with total sample 40. Relationship between JC and TI is stronger for
internals than externals and hypothesis 2a supported. The influence of job satisfaction
on TI and OC is stronger for internals than for externals. Therefore, public accountants
should consider prioritizing the needs of internals whenever those internals express low
job satisfaction. Ignoring their satisfaction may cause internals to react by quitting.
Consequently, consulting with employees and listening to their constructive suggestions
can help retained good employees and avoid turnover. Specifically, this finding suggest
that serious problems may exist in an organization when both internals and externals
have low OC. High turnover may occur due to high TI originally influenced by low OC.
The best response in this situation may be to examine whether the organizational offers
inadequate support to its employees.Other recommendations include enhancing
psychological well-being in the workplace so as to improve employee perceptions of
organizational support. The higher they perceive organizational support the lower TI
happened. Providing positive feedback on employee performance can also increase

INT-04 17
employee job satisfaction and OC, consequently reduce TI. The comments of
Mannheim et.al (1997) and Blau (1987), this study confirms that the overall fit of data
to the model supports the notion that the relationship of job satisfaction to TI is stronger
for internals than externals. Public accountants as the risky job, often feel depressed
with their job, therefore, employee turnovers intentions at Public Accountant Firms
were commonly happen
Hypothesis 3a stated that the positive relationship between job satisfaction and
OC is stronger for internals than for externals. Measurement results for internals LOC
showed that t value was positive 1.45 while external positive 2.16 higher than 1.303
with total sample 40. Relationship between OC and TI is stronger for internals than
externals and hypothesis 3a Supported. Hypothesis 4a stated that the positive
relationship between POS and job satisfaction is stronger for internals than externals
than for internals. Measurement results for internals LOC showed that t value was
positive 2.99 while LOC external positive 3.75 higher than 1.303 with total sample 40.
Relationship between OC and TI is stronger for internals than externals and hypothesis
4a supported. The findings of this study were generally consistent with those of
previous research (Susskind et.al, 2000; Mannheim et.al, 1997) in identifying links
between POS and TI. This study was supported the previous research done by Chou
Kang Chiu, Chieh Peng Lin, Yuan Hiu Tsai & Cing Yun Hsiao (2005). All paths are
significant for both internals and externals since the previous literature has confirmed
this theory to be solid. The awareness of an organization in term of concerning
employees’ POS, paying attention to and facilitating employee development activities
could be used as another strategy to reduce employee turnover.
INT-04 18
Hypothesis 5a stated the positive relationship between POS and OC is
stronger for externals than for internals. Measurement results for internals LOC showed
that t value was positive 1.72 while LOC external positive 2.58 higher than 1.303 with
total sample 40. Relationship between OC and TI is stronger for internals than externals
and hypothesis 5a was supported. The awareness of an organization in term of
concerning employees’ POS, paying attention to and facilitating employee development
activities could be used as another strategy to reduce employee turnover. Enhancing
psychological well-being at the work place will improve employee perceptions of
organizational supports. Development activities that groom an individual for further
advancement, job delegation, and
empowerment will improve the individual’s perceptions of POS. The Hypotheses 1a-5a
Resume shown on table 5
Insert. Table 5.
Model Fit Measurement Results
A model was fit if covariant matrix of the model was equal to covariant model
of data (observed). According to LISREL measurement result each indicators result in
fit model measurement shown as follows: for chi-square and p value of internals LOC
were 0.15 with 1degree of freedom. The Chi-square probability was not significant
which was 0.07, this indicated that model was fit, while for externals LOC chi-square
value was 0.19 with 1 degree of freedom. Chi-square probability was not significant
which was 0.66, this indicated that model was fit. X²/df, which were goodness of fit
indicators as the comparison between chi-square value and degree of freedom. In this
case for internals LOC model was 0.15/1 = 0.15, while for externals LOC model was
0.19/1 = 019. This result was lower than fit model cut-off suggested by Carmines and
INT-04 19
Melver (1981), which were 2. Therefore, controlling model complexities (which was
compared with degrees of freedom), the
model was not fit. The result of those two
model measurement was shown on table 6.
Insert. Table 6.
Limitation of the Study
A mismatch between personality characteristics and organization parameters
under a steady organizational contingency could lead to breakdowns in operational
effectiveness despite the implementation of an optimal organization design system.
Pervin (1968) stated that performance and satisfaction tend to be high when a match
exists between individual and organizational characteristics. Pervin then described a
best fit or match between these organizational characteristics and the personality of
individual. Moreover, a lack of fit results in decreased performance, dissatisfaction, and
low OC. In addition, some researches have noted numerous similar finding related to
the benefits of a good match between the individual and his or her job. For example,
O’Reilly (1997) stated that outcomes of a match between the personality characteristics
required for achievement and need for security and the degree of challenge offered by
the job tasks. Analytical results of this investigation supported such numerous related to
the match between individual and organizational characteristics, even more satisfaction
and commitment were higher for individuals who had achieved personality-job
congruence. Downey, Hellriegel, and Slocum (1975) concluded that job satisfaction was
“a function of the interaction between the personality characteristics of the individual
and perceived environment (organizational support)”. On the other hand a good match

INT-04 20
between the individual and the organization was important in predicting commitment,
job satisfaction, and TI.
According to the analytical results of this investigation support the conjecture
that LOC is an important moderator concerning organizational behavior. LOC was able
to identify the employees’ difference behaviors in both internals and externals, which
influence job satisfaction, organization commitment and perceived organizational
support and TI. The findings indicated that employees differ, as do differences in
turnover process. Therefore, employees could be given a standard battery of
psychological and aptitude test, which could include measure of LOC, Job satisfaction,
and OC. Specifically, whenever externals are found to have low POS, managers should
consult them and try to prioritize their needs as noted in H4a and H5a, where POS
influences both job satisfaction and OC more strongly externals and internals. Based on
this analysis when they perceive low organizational support, externals tend to expend
low effort on their job, and their commitment to organization declines. On the other
word, externals are prone to view themselves as power low to control they day-to-day
life, attributing outcomes to outside variables such as company policies and personal
relationships among colleagues in the organization. Externals seldom have confidence
concerning the business events they are dealing with, as the result it will influence
employees’ job satisfaction and organization commitment, which will reduce employee
turnover. Another implication of the finding is that specific training program can be
designed to improve POS and reduce TI. The externals believe whatever they have no
effect on organization’s outcome.
The first limitation of this research is the possibility of a common method bias
in this study because all the variables were measured using the same methods and the
INT-04 21
test result indicates that a more complex and potentially useful model regarding the
fitness between the individual and the organization may be considered to design
effective organizational design system.. Another limitation of this research is that this
study might have treated some in fairly simplistic terms. For example, instrument is a
multidimensional construct, but this study examined only affective instrument.The
second limitation of this research was the limitation of respondents, which was analyzed
were 103 respondents. This may cause inappropriate result, meanwhile the sample
consisted only of the public accountants in Java, which might be not quite larger that
were overlooked.
Future Research
This research sought to demonstrate the influence of LOC using a causal model
of TI. In the future work, longitudinal analysis might provide a complementary
understanding of the influence of LOC change on TI and OC. In addition, the model
could be expanded to other related factors, such as job stress or job ambiguity. It would
be better for the future research to enlarge the respondents of research and the analysis
system used, even more the future research should
The findings of this study were generally consistent with those of previous
research (Susskind et.al, 2000; Mannheim et.al, 1997) in identifying links between POS
and TI. This study was supported the previous research done by Chiu et al (2005). This
study has conducted another test for the same structural model based on different
personality traits in this study we used Barnett & Lanier (1995) to measure LOC in term
of identifying the stronger influence between internals and externals.
Corresponding the comments of Mannheim et.al (1997) and Blau (1987), this
study confirms that the overall fit of data to the model supports the notion that the
INT-04 22
relationship of job satisfaction to TI and OC is significant and that the influence of both
relationships is stronger for internals than externals (H2, H2a, H3 and H3a are
supported). In accordance with the studies of Susskind et al. (2000) and the comments
of Blau (1987), the influences of POS on job satisfaction and OC are both stronger for
externals than internals (H4, H4a, H5, and H5a are supported). According to the test
result, the influence of OC and TI is also supported (H1 is supported; H1a is supported.
This study used LOC as a moderator of model comparison. The findings have
clear and straightforward implications for Public Accountant Firms in term of retaining
employees, organizational support should be strengthened so as to boost employee POS,
job satisfaction and OC, and thus reduce TI. There are also a variety of organizational
activities such as job content assessment, personality counseling and organizational
style learning. Some organizations may have such activities in place but they are not
aware of employee development program, which is one of the ways to create
employee’s job satisfaction.
The importance of cross-personality research lies in defining relationships between
variables that are sensitive to LOC, since it is an important personality trait for
describing individual differences and predicting behavioral in organizational settings.
According to some evidence exist that LOC individuals’ differences influence the
perception and construction of key environmental through different lenses. LOC has
been related in numerous experiments with cognitive activities like attention and
alertness, and information search and assimilation, specifically in reviewing the findings
on cognitive capacities of internals versus external. LOC constructs as it is indicative of
a basic striving of internals to actively engage in seeking relevant cues in worker’s
environments to determine and make sense out of their positions and to guide or adapt

INT-04 23
their behavior accordingly. Differences in LOC are the cause of these different
perceptions. Under the moderating effect of LOC, all the hypotheses are supported by
the related literature and the empirical result presented here. According to the data
analysis, the relationship was found to be stronger for internals than externals, a finding
that is consistent with previous experiment result (Chou Kang Chiu, Chieh Peng Lin,
Yuan Hiu Tsai & Cing Yun Hsiao, 2005). Similar finding regarding LOC from previous
studies seem attributable to the same dynamic reaction patterns may be modified and a
more active response set learned through specific training programs.
According to H2a and H3a, the influence of job satisfaction on TI and OC is
stronger for internals than for externals. Therefore, public accountants should consider
prioritizing the needs of internals whenever those internals express low job satisfaction.
Ignoring their satisfaction may cause internals to react by quitting. Consequently,
consulting with employees and listening to their constructive suggestions can help
retained good employees and avoid turnover. Specifically, this finding suggest that
serious problems may exist in an organization when both internals and externals have
low OC. High turnover may occur due to high TI originally influenced by low OC. The
best response in this situation may be to examine whether the organizational offers
inadequate support to its employees.
Other recommendations include enhancing psychological well-being in the
workplace so as to improve employee perceptions of organizational support. The higher
they perceive organizational support the lower TI happened. Providing positive
feedback on employee performance can also increase employee job satisfaction and OC,
consequently reduce TI. The awareness of an organization in term of concerning
employees’ POS, paying attention to and facilitating employee development activities
INT-04 24
could be used as another strategy to reduce employee turnover. Public accountants as
the risky job, often feel depressed with their job, therefore, employee turnovers
intentions at Public Accountant Firms were commonly happen, this research give new
implication to reduce employee TI in Public Accountant Firms. The recommendations
are enhancing psychological well-being at the work place so as to improve employee
perceptions of organizational supports. Development activities that groom an individual
for further advancement, job delegation, and empowerment will improve the
individual’s perceptions of POS.
To sum up, the findings reported here have important implications for human
resource development in service-based firms, specifically in public accounting firms.
The public accountants should alter their strategies to achieve high OC and reduce TI,
by giving highly POS and job satisfaction. The organization must be aware of the
moderating effect of individual characteristics on the relationships between job
attributes and employees’ behavioral attitudes, which is reflect in LOC both internals
and externals.
Limitation and Future Research
A mismatch between personality characteristics and organization parameters
under a steady organizational contingency could lead to breakdowns in operational
effectiveness despite the implementation of an optimal organization design system.
Pervin (1968) stated that performance and satisfaction tend to be high when a match
exists between individual and organizational characteristics. Pervin then described a
best fit or match between these organizational characteristics and the personality of
individual. Moreover, a lack of fit results in decreased performance, dissatisfaction, and
low OC. In addition, some researches have noted numerous similar finding related to
INT-04 25
the benefits of a good match between the individual and his or her job. For example,
O’Reilly (1997) stated that outcomes of a match between the personality characteristics
required for achievement and need for security and the degree of challenge offered by
the job tasks. Analytical results of this investigation supported such numerous related to
the match between individual and organizational characteristics, even more satisfaction
and commitment were higher for individuals who had achieved personality-job
congruence. Downey, Hellriegel, and Slocum (1975) concluded that job satisfaction was
“a function of the interaction between the personality characteristics of the individual
and perceived environment (organizational support)”. On the other hand a good match
between the individual and the organization was important in predicting commitment,
job satisfaction, and TI.
Based on the analytical results of this investigation support the conjecture that
LOC is an important moderator concerning organizational behavior. LOC was able to
identify the employees’ difference behaviors in both internals and externals, which
influence job satisfaction, organization commitment and perceived organizational
support and TI. The findings indicated that employees differ, as do differences in
turnover process. Therefore, employees could be given a standard battery of
psychological and aptitude test, which could include measure of LOC, Job satisfaction,
and OC. Specifically, whenever externals are found to have low POS, managers should
consult them and try to prioritize their needs as noted in H4a and H5a, where POS
influences both job satisfaction and OC more strongly externals and internals. Based on
this analysis when they perceive low organizational support, externals tend to expend
low effort on their job, and their commitment to organization declines. On the other
word, externals are prone to view themselves as power low to control they day-to-day

INT-04 26
life, attributing outcomes to outside variables such as company policies and personal
relationships among colleagues in the organization. Externals seldom have confidence
concerning the business events they are dealing with, as the result it will influence
employees’ job satisfaction and organization commitment which will reduce employee
turnover. Another implication of the finding is that specific training program can be
designed to improve POS and reduce TI. The externals believe whatever they have no
effect on organization’s outcome.
The first limitation of this research is the possibility of a common method bias
in this study because all the variables were measured using the same methods and the
test result indicates that a more complex and potentially useful model regarding the
fitness between the individual and the organization may be considered to design
effective organizational design system. The second limitation is that the sample
consisted only of the public accountants in Java which might be not quite larger that
were overlooked. Another limitation of this research is that this study might have
treated some in fairly simplistic terms. For example, instrument is a multidimensional
construct, but this study examined only affective instrument.
This research sought to demonstrate the influence of LOC using a causal model
of TI. In the future work, longitudinal analysis might provide a complementary
understanding of the influence of LOC change on TI and OC. In addition, the model
could be expanded to other related factors, such as job stress or job ambiguity. It would
be better for the future research to enlarge the object of research and the analysis system
used.

INT-04 27
References Abraham, R. (1999). The impact of emotional dissonance on instrument and intention to
turnover. Journal of Psychology, 133, 441-455. Anderson, J. C., & Gerbing, D. W. (1988). Structural equation modeling in practice: A
review and recommended two-step approach. Psychological Bulletin, 103, 411–423.
Andrisani, P. J., & Nestel, G. (1976). Internal-external control as contributor to and outcome of work experience. Journal of Applied Psychology, 61, 156–165.
Barnett, T., & Lanier, P. A. (1995). Comparison of alternative response formats for an abbreviated version of Rotter’s locus of control scale. Psychological Report, 77, 259–264.
Bentler, P. M. (1989). EQS structural equations program manual. Los Angeles: BMDP Statistical Software.
Bentler, P. M., & Bonett, D. G. (1980). Signi.cance tests and goodness-of-.t in the analysis of covariance structures. Psychological Bulletin, 88, 588–606.
Blau, G. J. (1987). Locus of control as a potential moderator of the turnover process. Journal of Occupational Psychology, 60, 21–29.
Bluedorn, A. C. (1982). A uni.ed model of turnover from organizations. Human Relations, 35, 135–153.
Bogg, J., & Cooper, C. (1995). Job satisfaction, mental health, and occupational stress among senior civil servants. Human Relations, 48, 327–341.
Boone, C., & De Brabander, B. (1997). Self-reports and CEO locus of control research: A note. Organization Studies, 18, 949–971.
Boone, C., De Brabander, B., & Hellemans, J. (2000). Research note: CEO locus of control and small firm performance. Organization Studies, 21, 641–646.
Boone, C., Olfen, V. W., & Witteloostuijn, V. A. (2005). Team Locus Of Control Composition, Leadership, Structure, Information Acquisition, and Financial Performance: A Business Stimulation Study. Academy Of Management Journal ,Vol. 48. 690-691
Brockner, J., & Adsit, L. (1986). The moderating effect of sex on the equity-satisfaction relationship.Journal of Applied Psychology, 71, 585–590.
Chiu, R. K., & Francesco, A. M. (2003). Dispositional traits and turnover intention: Examining the mediating role of job satisfaction and affective commitment. International Journal of Manpower, 24, 284–298.
Chiu, K. C, Lin, P. C., Tsai Hui, Y., (2005). Modeling Turnover Intentions and Their Antecedents Using The Locus Of Control as a Moderator : A Case Of Customer Service Employee. Human Resources Development Quarterly, vol 16. 485–486
Churchill, G., Ford, N. M., & Walker, O. C. (1974). Measuring the job satisfaction of industrial salesmen. Journal of Marketing Research, 11, 254–260.
Cohen, J., & Cohen, P. (1988). Applied multiple regression/correlation analysis of the behavior science (2nd ed.). Mahwah, NJ: Erlbaum.
Davy, J. A., Kinicki, A. J., & Scheck, C. L. (1991). Developing and testing a model of survivor responses to layoffs. Journal of Vocational Behavior, 38, 302–317.
Downey, H. K., Hellriegel, D., & Slocum, J. (1975). Congruence between individual needs, organizational climate, job satisfaction, and performance. Academy of Management Journal, 18, 149–154.

INT-04 28
Eisenberger, R., Fasolo, P., & Davis-LaMastro, V. (1990). Perceived organizational support and employee diligence, commitment, and innovation. Journal of Applied Psychology, 75, 51–59.
Hackman, J. R., & Oldham, G. R. (1975). Development of the job diagnostic survey. Journal of Applied Psychology, 60, 159–170.
Hammer, T. H., & Vardi, Y. (1980). Locus of control and career self management among non supervisory employees in industrial settings. Journal of Vocational Behavior, 18, 13–29.
Hatcher, L. (1994). A step-by-step approach to using the SAS system for factor analysis and structural equation modeling. Cary, NC: SAS Institute.
Johnson, A. L., Luthans, F., & Hennessey, H. W. (1984). The role of locus of control in leader influence behavior. Personnel Psychology, 37, 61–75.
Jöreskog, K. G., & Sorbom, D. (1986). LISREL VI: Analysis of linear structural relationships by maximum likelihood, instrumental variables, and least squares methods (4th ed.). Mooresville, IN: Scientific Software.
Keller, R. (1984). The role of performance and absenteeism in the prediction of turnover. Academy of Management Journal, 27, 176–183.
King, M., Murray, M. A., & Atkinson, T. (1982). Background, personality, job characteristics, and satisfaction with work in a national sample. Human Relations, 35, 119–134.
Kraut, A. I. (1975). Predicting turnover of employees from measured job attitudes. Organizational Behavior and Human Performance, 13, 233–243.
Kren, L. (1992). The moderating effects of locus of control on performance incentives and participation. Human Relations, 45, 991–1003.
Lachman, R., & Aranya, N. (1986). Job attitudes and turnover intentions among professionals in different work settings. Organization Studies, 7, 279–293.
Lam, D., & Mizerski, D. (2005). The effect of locus of control on word of mouth communication. Journal of Marketing Communicaions, 11,215-228
Larwood, L., Wright, T. A., Desrochers, S., & Dahir, V. (1998). Extending latent role and psychological contract theories to predict intent to turnover and politics in business organization.Group and Organization Management, 23, 100–123.
Lewin, A. Y., & Stephens, C. U. (1994). CEO attitudes as determinants of organization design: An integrated model. Organization Studies, 15, 183–212.
Luthans, F., Baack, D., & Taylor, L. (1987). Instrument: Analysis of antecedents. Human Relations, 40, 219–236.
Mannheim, B., Baruch, Y., & Tal, J. (1997). Alternative models for antecedents and outcomes of work centrality and job satisfaction of high-tech personnel. Human Relations, 50, 1537–1561.
Meyer, J. P., & Smith, C. A. (2000). HRM practices and instrument: Test of a mediation model. Canadian Journal of Administrative Sciences, 17, 319–331.
Mowday, R. T., Steers, R. M., & Porter, L. W. (1979). The measurement of instrument. Journal of Vocational Behavior, 14, 224–227.
Mullen, M. R. (1995), Diagnosing measurement equivalence in cross-national research. Journal of International Business Studies, 26 (3), 573–596.
Near, J. P. (1989), Instrument among Japanese and U.S. workers. Organization Studies, 10, 281–300.

INT-04 29
Newton, T. J., and Keenan, A. (1990), The moderating effect of the Type A behavior pattern and locus of control upon the relationship between change in job demands and change in psychological strain. Human Relations, 43, 1229–1255.
Nouri Hossein , and Parker. J. Robert. (1966), the effect of organizational commitment on the relation between budgeting participation and budgetary slack. Behavioral Research in Accounting, 18, 75
O’Reilly, C. A. III (1977). Personality-job .t: Implications for individual attitudes and performance. Organizational Behavior and Human Performance, 18, 36–46.
Organ, D. W., & Greene, C. N. (1974), Role ambiguity, locus of control, and work satisfaction, Journal of Applied Psychology, 59, 101–102.
Pervin, L. A. (1968), Performance and satisfaction as a function of individual environment, Psychological Bulletin, 69, 56–68.
Reed, A. S., Kratchman, H.S, & Strawser, H. R. (1994), Job Satisfaction, Instrument, and Turnover Intentions of United States Accountnts ; The Impact of Locus Of control and Gender. Accounting, Auditing, and Accountability Journal, 7. 32-35
Reynolds, N., Diamantopoulos, A., & Schlegelmilch, B. B. (1993). Pretesting in questionnaire design: A review of the literature and suggestions for further research. Journal of the Market Research Society, 35, 171–182.
Rotter, J. B. (1966). Generalized expectancies for internal versus external control of reinforcement. Psychological Monographs, 80, 1–28.
Salancik, G. R. (1977). Commitment and the control of organizational behavior. In B. M. Staw & G. R. Salancik (Eds.), New directions in organizational behavior. Chicago: St. Clair Press.
Schilit, W. K. (1986). An examination of individual differences as moderators of upward influence activity in strategic decisions. Human Relations, 39, 933–953.
Shore, L. M., & Tetrick, L. E. (1991). A construct validity study of the survey of perceived organizational support. Journal of Applied Psychology, 76, 637–643.
Shore, L. M., & Wayne, S. J. (1993). Commitment and employee behavior: Comparison of affective commitment and continuance commitment with perceived organizational support. Journal of Applied Psychology, 78, 774–780.
Spector, P. E. (1982). Behavior in organizations as a function of employee’s locus of control. Psychological Bulletin, 91, 482–497.
Storms, P. L., & Spector, P. E. (1987). Relationships of organizational frustration with reported behavioral reactions: The moderating effect of locus of control. Journal of Occupational Psychology,60, 227–234.
Susskind, A. M., Borchgrevink, C. P., Kacmar, K. M., & Brymer, R. A. (2000). Customer service employees’ behavioral intentions and attitudes: An examination of construct validity and a path model. International Journal of Hospitality Management, 19 (1), 53–77.
Tansky, J. W., & Cohen, D. J. (2001). The relationship between organizational support, employee development, and instrument: An empirical study. Human Resource Development Quarterly, 12, 285–300.
Tett, R. P., & Meyer, J. P. (1993). Job satisfaction, instrument, turnover intention, and turnover: Path analyses based on meta-analytic findings. Personnel Psychology, 46, 259–291.

INT-04 30
Venkatesh, V., & Morris, M. G. (2000). Why don’t men ever stop to ask for directions? Gender, social in.uence, and their role in technology acceptance and usage behavior. MIS Quarterly,24 (1), 115–139.
Williams, L. J., & Hazer, J. T. (1986). Antecedents and consequences of satisfaction
and commitment in turnover models: A reanalysis using latent variable
structural equation methods. Journal of Applied Psychology, 71, 219–231.

INT-04 31
Figure 1. Research Framework
H2a H2 H3a H4 H1 H4a H3
H5 H5a
Locus of Control (Moderator)
JS Job
Satisfaction
POS Perceived
Organization Support
OC Organizational Commitment
TI Turnover Intention
Table 1. Sample Characteristics (N=103 ) Sample Characteristics (N=103)
Characteristic Internals (48) Externals (55) Male 30 (63%) 23 (42%) Gender
Female 18 (38%) 32 (58%) S1 22 (46%) 27 (49%)
Education S2 26 (54%) 28 (51%) Staff 12 (25%) 25 (45%) Senior 23 (48%) 12 (22%)
Posisition Manager 13 (27%) 18 (33%)
Table 2: Descriptive Statistical Variables VARIABEL THEORITICAL
RANGE
ACTUAL RANGE
MEAN STANDARD DEVIATION
Job Satisfaction 4-20 5-19 13.0874 3.69978 Perceived Organizational Support
4-20 5-18 10.5631 3.64522
Turnover Intentions 4-20 6-19 12.6019 3.79716 Instrument 5-25 6-20 12.8544 4.06421
INT-04 32
Table 3 : Reliability and Confirmatory factor Analysis Result MEASUREMENT RESULT OF
ALPHA CRONBACH VARIABLE INDICATOR
MEASUREMENT RESULT OF CONFRIMATORY
FACTOR ANALYSIS
VARIABLE
Internals Externals Internals Externals Job Satisfaction 0.743 0,723 X1,X2,X3,X4 X1,X2,X3,X4 X1,X2,X3,X4
Perceived Organizational
0,7749 0,7452 X5,X6,X7,X8 X5,X6,X7,X8 X5,X6,X7,X8
Turnover Intentions
0,8807 0,7923 X9,X10,11,12 X9,X10,11,12 X9,X10,11,12
Instrument 0,7084 0,7623 X13,X14,X15,X16,X17
X13,X14,X15,X16,X17
X13,X14,X15,X16,X17
Table 4: Hypotheses Resume Hypotheses t Remarks
H1: TI OC -1.827 H1 Supported H2: OC JS 1.77 H2 Supported H3: TI JS 4.19 H3 Supported H4: JS POS 2.18 H4 Supported H5: OC POS 2.7.3 H5 Supported
Table 5. t Test table of Differences Internals Externals Influence
Hypotheses t t (I versus E) Remarks H1a: TI OC -1.65 -1.57 [I]> [E] H1a Supported H2a: TI JS -1.99 -1.85 [I]> [E] H2a Supported H3a: OC JS 1.45 2.16 I > E H3a Supported H4a: JS POS 2.99 3.75 I < E H4a Supported H5a: OC POS 1.7.2 2.58 I < E H5a Supported
Table 6. Goodness-of-Fit Indexes Measurement model
Locus of Control
P X2 Df
X²/df
NCP RMSEA
ECVI
NFI NNFI
CFI IFI RFI
Internals 0.70
0.15
1 0.15 3.74
0.29 0.41 1.00
1.20 1.00
1.03
0.97
Externals
0.66
019 1 0.19 4.07
0.28 0.38 0.99
1.39 1.00
1.05
0.94

INT-04 33
DATE: 6/13/2007 TIME: 22:28 L I S R E L 8.54 BY Karl G. Jöreskog & Dag Sörbom This program is published exclusively b y Scientific Software International, Inc. 7383 N. Lincoln Avenue, Suite 100 Lincolnwood, IL 60712, U.S.A. Phone: (800)247-6113, (847)675-0720, Fax: (847)675-2140 Copyright by Scientific Software International, Inc., 1981-2002 Use of this program is subject to the terms specified in the Universal Copyright Convention. Website: www.ssicentral.com The following lines were read from file D:\SNA Makassar\Leni\LISREL SEMUA LOC.spj: TOTAL LOC Raw Data from file 'D:\SNA Makassar\LOC EKTERNAL 103.psf' Relationships TI = JS OC JS = POS OC = JS POS Path Diagram End of Problem Sample Size = 103 TOTAL LOC Covariance Matrix JS TI OC POS -------- -------- -------- -------- JS 13.69 TI -5.31 14.42 OC 1.97 0.45 16.52 POS 2.86 0.09 4.18 13.29 TOTAL LOC Number of Iterations = 0 LISREL Estimates (Maximum Likelihood) Structural Equations JS = 0.32*POS, Errorvar.= 13.07, R² = 0.045 (0.099) (1.84) 2.18 7.11 TI = - 0.40*JS - 0.37*OC, Errorvar.= 12.27, R² = 0.15 (0.095) (0.087) (1.73) -4.19 1.82 7.11
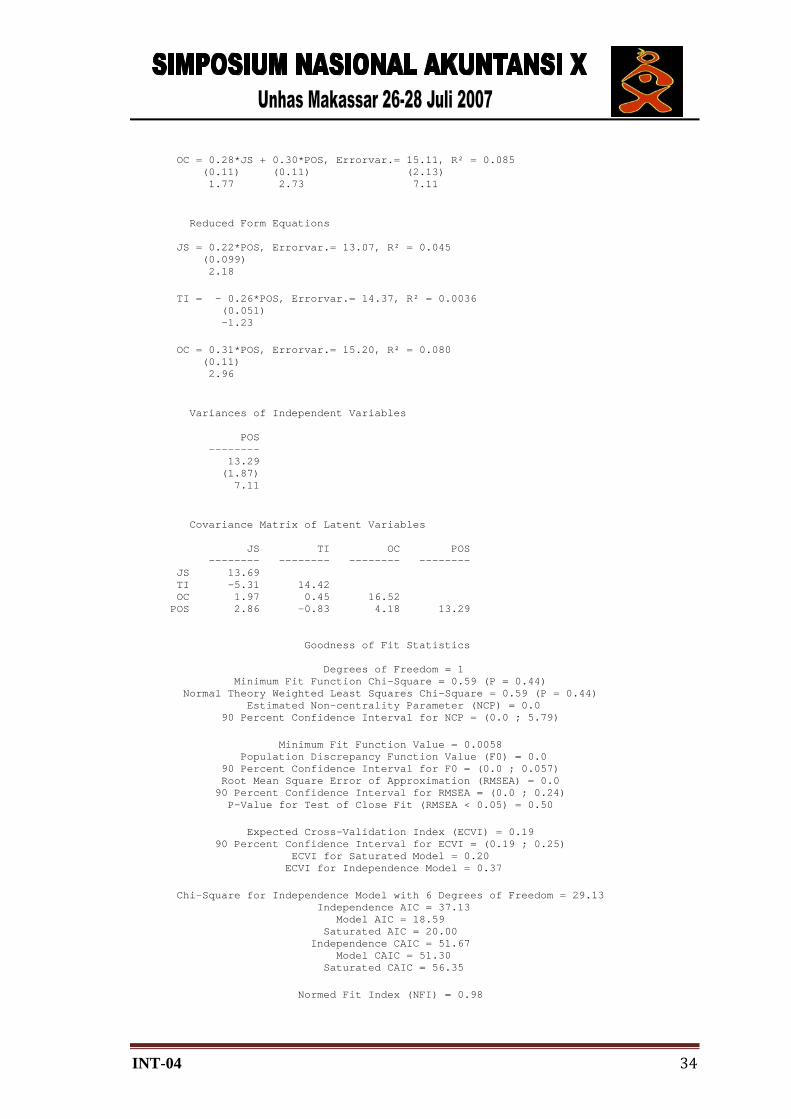
INT-04 34
OC = 0.28*JS + 0.30*POS, Errorvar.= 15.11, R² = 0.085 (0.11) (0.11) (2.13) 1.77 2.73 7.11 Reduced Form Equations JS = 0.22*POS, Errorvar.= 13.07, R² = 0.045 (0.099) 2.18 TI = - 0.26*POS, Errorvar.= 14.37, R² = 0.0036 (0.051) -1.23 OC = 0.31*POS, Errorvar.= 15.20, R² = 0.080 (0.11) 2.96 Variances of Independent Variables POS -------- 13.29 (1.87) 7.11 Covariance Matrix of Latent Variables JS TI OC POS -------- -------- -------- -------- JS 13.69 TI -5.31 14.42 OC 1.97 0.45 16.52 POS 2.86 -0.83 4.18 13.29 Goodness of Fit Statistics Degrees of Freedom = 1 Minimum Fit Function Chi-Square = 0.59 (P = 0.44) Normal Theory Weighted Least Squares Chi-Square = 0.59 (P = 0.44) Estimated Non-centrality Parameter (NCP) = 0.0 90 Percent Confidence Interval for NCP = (0.0 ; 5.79) Minimum Fit Function Value = 0.0058 Population Discrepancy Function Value (F0) = 0.0 90 Percent Confidence Interval for F0 = (0.0 ; 0.057) Root Mean Square Error of Approximation (RMSEA) = 0.0 90 Percent Confidence Interval for RMSEA = (0.0 ; 0.24) P-Value for Test of Close Fit (RMSEA < 0.05) = 0.50 Expected Cross-Validation Index (ECVI) = 0.19 90 Percent Confidence Interval for ECVI = (0.19 ; 0.25) ECVI for Saturated Model = 0.20 ECVI for Independence Model = 0.37 Chi-Square for Independence Model with 6 Degrees of Freedom = 29.13 Independence AIC = 37.13 Model AIC = 18.59 Saturated AIC = 20.00 Independence CAIC = 51.67 Model CAIC = 51.30 Saturated CAIC = 56.35 Normed Fit Index (NFI) = 0.98

INT-04 35
Non-Normed Fit Index (NNFI) = 1.11 Parsimony Normed Fit Index (PNFI) = 0.16 Comparative Fit Index (CFI) = 1.00 Incremental Fit Index (IFI) = 1.01 Relative Fit Index (RFI) = 0.88 Critical N (CN) = 1142.59 Root Mean Square Residual (RMR) = 0.29 Standardized RMR = 0.021 Goodness of Fit Index (GFI) = 1.00 Adjusted Goodness of Fit Index (AGFI) = 0.97 Parsimony Goodness of Fit Index (PGFI) = 0.100 Time used: 0.040 Seconds DATE: 6/13/2007 TIME: 22:19 L I S R E L 8.54 BY Karl G. Jöreskog & Dag Sörbom This program is published exclusively by Scientific Software International, Inc. 7383 N. Lincoln Avenue, Suite 100 Lincolnwood, IL 60712, U.S.A. Phone: (800)247-6113, (847)675-0720, Fax: (847)675-2140 Copyright by Scientific Software International, Inc., 1981-2002 Use of this program is subject to the terms specified in the Universal Copyright Convention. Website: www.ssicentral.com The following lines were read from file D:\SNA Makassar\Leni\LISREL 2.spj: LISREL 2 Raw Data from file 'D:\SNA Makassar\Leni\LISREL 2.psf' Relationships
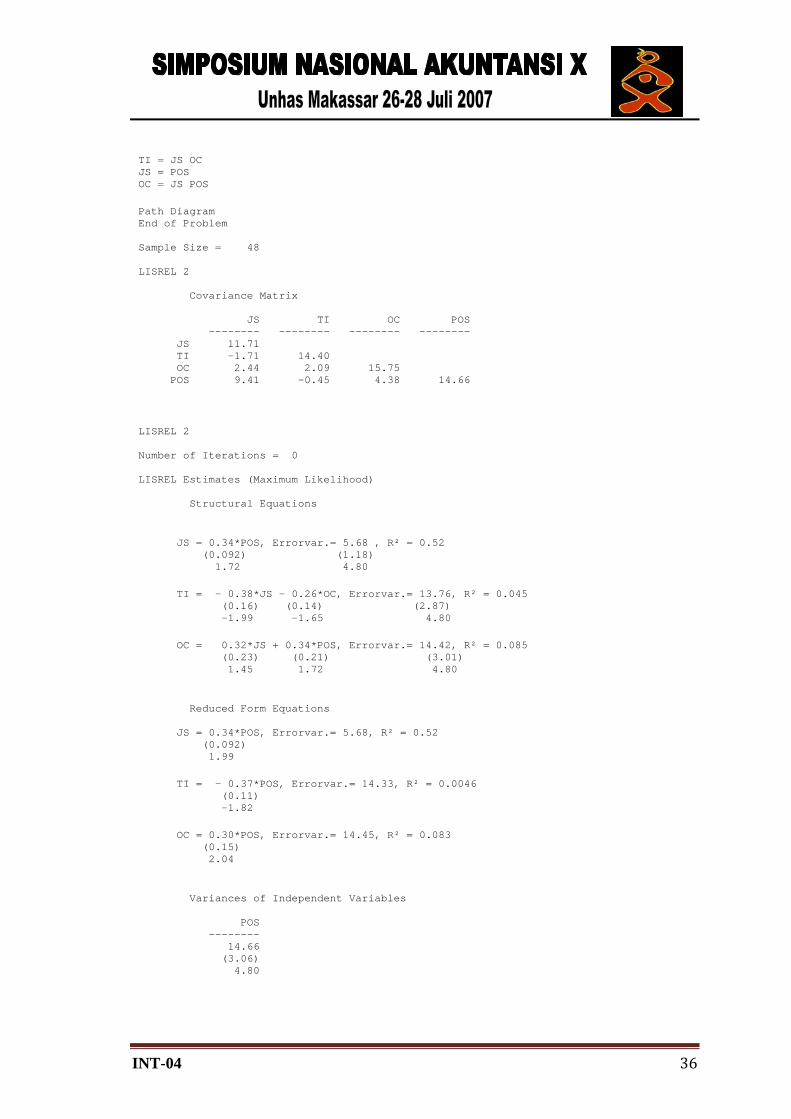
INT-04 36
TI = JS OC JS = POS OC = JS POS Path Diagram End of Problem Sample Size = 48 LISREL 2 Covariance Matrix JS TI OC POS -------- -------- -------- -------- JS 11.71 TI -1.71 14.40 OC 2.44 2.09 15.75 POS 9.41 -0.45 4.38 14.66 LISREL 2 Number of Iterations = 0 LISREL Estimates (Maximum Likelihood) Structural Equations JS = 0.34*POS, Errorvar.= 5.68 , R² = 0.52 (0.092) (1.18) 1.72 4.80 TI = - 0.38*JS - 0.26*OC, Errorvar.= 13.76, R² = 0.045 (0.16) (0.14) (2.87) -1.99 -1.65 4.80 OC = 0.32*JS + 0.34*POS, Errorvar.= 14.42, R² = 0.085 (0.23) (0.21) (3.01) 1.45 1.72 4.80 Reduced Form Equations JS = 0.34*POS, Errorvar.= 5.68, R² = 0.52 (0.092) 1.99 TI = - 0.37*POS, Errorvar.= 14.33, R² = 0.0046 (0.11) -1.82 OC = 0.30*POS, Errorvar.= 14.45, R² = 0.083 (0.15) 2.04 Variances of Independent Variables POS -------- 14.66 (3.06) 4.80

INT-04 37
Covariance Matrix of Latent Variables JS TI OC POS -------- -------- -------- -------- JS 11.71 TI -1.71 14.40 OC 2.44 2.09 15.75 POS 9.41 -0.98 4.38 14.66 Goodness of Fit Statistics Degrees of Freedom = 1 Minimum Fit Function Chi-Square = 0.15 (P = 0.70) Normal Theory Weighted Least Squares Chi-Square = 0.15 (P = 0.70) Estimated Non-centrality Parameter (NCP) = 0.0 90 Percent Confidence Interval for NCP = (0.0 ; 3.74) Minimum Fit Function Value = 0.0031 Population Discrepancy Function Value (F0) = 0.0 90 Percent Confidence Interval for F0 = (0.0 ; 0.081) Root Mean Square Error of Approximation (RMSEA) = 0.0 90 Percent Confidence Interval for RMSEA = (0.0 ; 0.29) P-Value for Test of Close Fit (RMSEA < 0.05) = 0.72 Expected Cross-Validation Index (ECVI) = 0.41 90 Percent Confidence Interval for ECVI = (0.41 ; 0.49) ECVI for Saturated Model = 0.43 ECVI for Independence Model = 0.86 Chi-Square for Independence Model with 6 Degrees of Freedom = 31.40 Independence AIC = 39.40 Model AIC = 18.15 Saturated AIC = 20.00 Independence CAIC = 50.89 Model CAIC = 43.99 Saturated CAIC = 48.71 Normed Fit Index (NFI) = 1.00 Non-Normed Fit Index (NNFI) = 1.20 Parsimony Normed Fit Index (PNFI) = 0.17 Comparative Fit Index (CFI) = 1.00 Incremental Fit Index (IFI) = 1.03 Relative Fit Index (RFI) = 0.97 Critical N (CN) = 2145.21 Root Mean Square Residual (RMR) = 0.17 Standardized RMR = 0.012 Goodness of Fit Index (GFI) = 1.00 Adjusted Goodness of Fit Index (AGFI) = 0.98 Parsimony Goodness of Fit Index (PGFI) = 0.100 Time used: 0.030 Seconds

INT-04 38
DATE: 6/13/2007 TIME: 22:04 L I S R E L 8.54 BY Karl G. Jöreskog & Dag Sörbom This program is published exclusively by Scientific Software International, Inc. 7383 N. Lincoln Avenue, Suite 100 Lincolnwood, IL 60712, U.S.A. Phone: (800)247-6113, (847)675-0720, Fax: (847)675-2140 Copyright by Scientific Software International, Inc., 1981-2002 Use of this program is subject to the terms specified in the Universal Copyright Convention. Website: www.ssicentral.com The following lines were read from file D:\SNA Makassar\Leni\LISREL 1.spj: lisrel1 Raw Data from file 'D:\SNA Makassar\Leni\LISREL 1.psf' Relationships TI = JS OC JS = POS OC = JS POS Path Diagram End of Problem Sample Size = 55 lisrel1 Covariance Matrix JS TI OC POS -------- -------- -------- -------- JS 9.91 TI -4.41 11.73 OC 2.37 -1.52 17.38 POS -2.59 0.42 4.06 12.33 lisrel1 Number of Iterations = 0 LISREL Estimates (Maximum Likelihood) Structural Equations
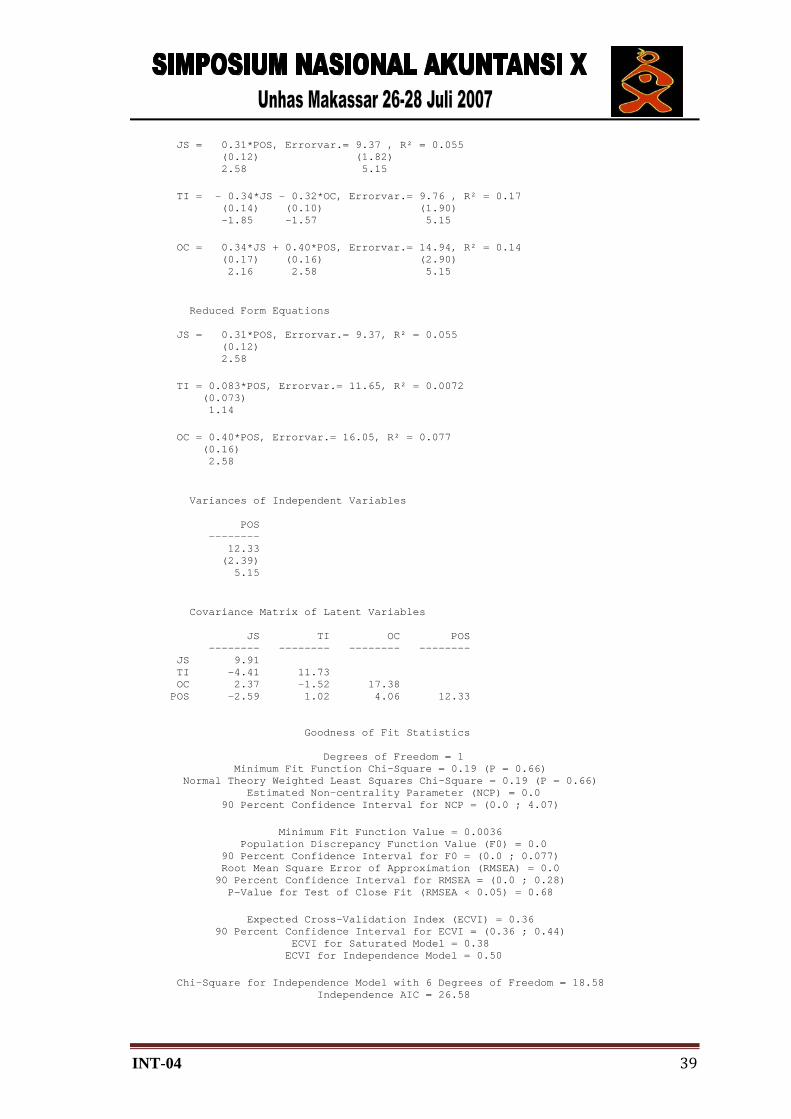
INT-04 39
JS = 0.31*POS, Errorvar.= 9.37 , R² = 0.055 (0.12) (1.82) 2.58 5.15 TI = - 0.34*JS - 0.32*OC, Errorvar.= 9.76 , R² = 0.17 (0.14) (0.10) (1.90) -1.85 -1.57 5.15 OC = 0.34*JS + 0.40*POS, Errorvar.= 14.94, R² = 0.14 (0.17) (0.16) (2.90) 2.16 2.58 5.15 Reduced Form Equations JS = 0.31*POS, Errorvar.= 9.37, R² = 0.055 (0.12) 2.58 TI = 0.083*POS, Errorvar.= 11.65, R² = 0.0072 (0.073) 1.14 OC = 0.40*POS, Errorvar.= 16.05, R² = 0.077 (0.16) 2.58 Variances of Independent Variables POS -------- 12.33 (2.39) 5.15 Covariance Matrix of Latent Variables JS TI OC POS -------- -------- -------- -------- JS 9.91 TI -4.41 11.73 OC 2.37 -1.52 17.38 POS -2.59 1.02 4.06 12.33 Goodness of Fit Statistics Degrees of Freedom = 1 Minimum Fit Function Chi-Square = 0.19 (P = 0.66) Normal Theory Weighted Least Squares Chi-Square = 0.19 (P = 0.66) Estimated Non-centrality Parameter (NCP) = 0.0 90 Percent Confidence Interval for NCP = (0.0 ; 4.07) Minimum Fit Function Value = 0.0036 Population Discrepancy Function Value (F0) = 0.0 90 Percent Confidence Interval for F0 = (0.0 ; 0.077) Root Mean Square Error of Approximation (RMSEA) = 0.0 90 Percent Confidence Interval for RMSEA = (0.0 ; 0.28) P-Value for Test of Close Fit (RMSEA < 0.05) = 0.68 Expected Cross-Validation Index (ECVI) = 0.36 90 Percent Confidence Interval for ECVI = (0.36 ; 0.44) ECVI for Saturated Model = 0.38 ECVI for Independence Model = 0.50 Chi-Square for Independence Model with 6 Degrees of Freedom = 18.58 Independence AIC = 26.58
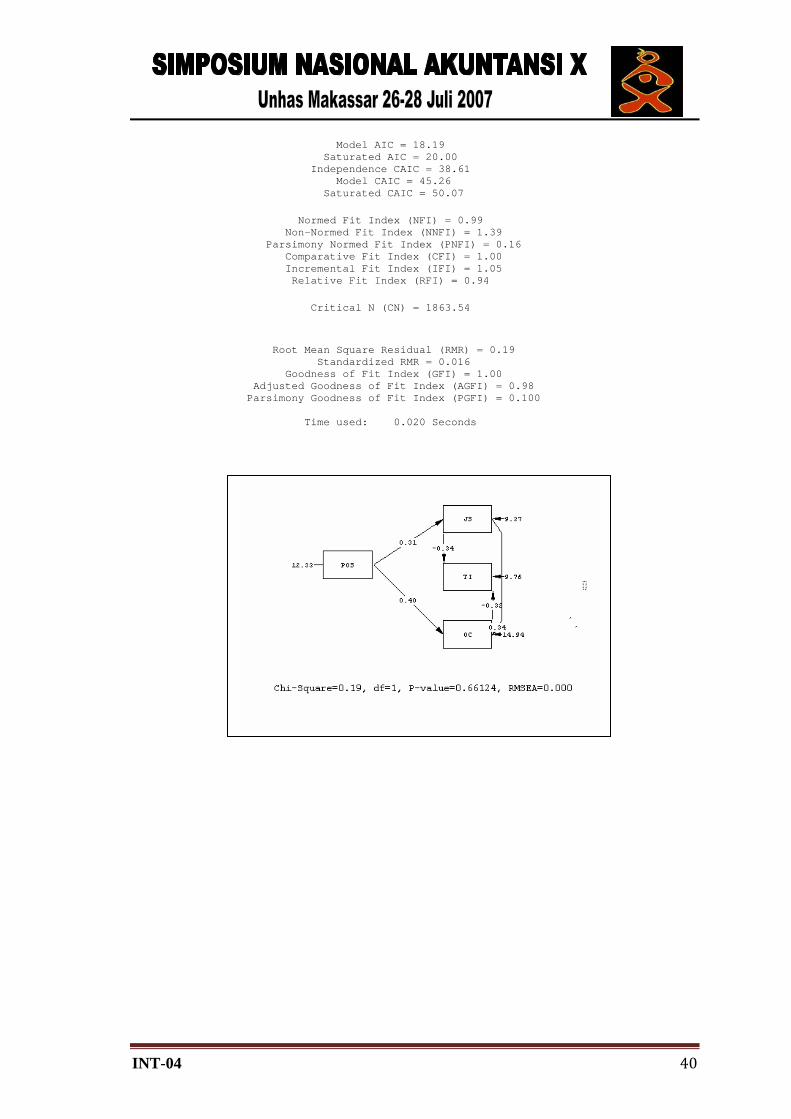
INT-04 40
Model AIC = 18.19 Saturated AIC = 20.00 Independence CAIC = 38.61 Model CAIC = 45.26 Saturated CAIC = 50.07 Normed Fit Index (NFI) = 0.99 Non-Normed Fit Index (NNFI) = 1.39 Parsimony Normed Fit Index (PNFI) = 0.16 Comparative Fit Index (CFI) = 1.00 Incremental Fit Index (IFI) = 1.05 Relative Fit Index (RFI) = 0.94 Critical N (CN) = 1863.54 Root Mean Square Residual (RMR) = 0.19 Standardized RMR = 0.016 Goodness of Fit Index (GFI) = 1.00 Adjusted Goodness of Fit Index (AGFI) = 0.98 Parsimony Goodness of Fit Index (PGFI) = 0.100 Time used: 0.020 Seconds