modeling variability in torso shape for chair...
TRANSCRIPT

Proceedings of DETC08ASME International Design Engineering Technical Conferences
August 3-6, 2008, New York, NY, USA
DETC2008-49483
MODELING VARIABILITY IN TORSO SHAPE FOR CHAIR AND SEAT DESIGN
Matthew P. ReedUniversity of Michigan Transportation Research Institute
Ann Arbor, MI [email protected]
Matthew B. ParkinsonEngineering Design Program
Department of Mechanical EngineeringThe Pennsylvania State University
University Park, PA [email protected]
ABSTRACTAnthropometric data are widely used in the design of chairs,
seats, and other furniture intended for seated use. These dataare valuable for determining the overall height, width, and depthof a chair, but contain little information about body shape thatcan be used to choose appropriate contours for backrests. A newmethod is presented for statistical modeling of three-dimensionaltorso shape for use in designing chairs and seats. Laser-scandata from a large-scale civilian anthropometric survey were ex-tracted and analyzed using principal component analysis. Multi-variate regression was applied to predict the average body shapeas a function of overall anthropometric variables. For optimiza-tion applications, the statistical model can be exercised to ran-domly sample the space of torso shapes for automated virtualfitting trials. This approach also facilitates trade-off analysesand other the application of other design decision-making meth-ods. Although seating is the specific example here, the methodis generally applicable to other designing for human variabilitysituations in which applicable body contour data are available.
INTRODUCTIONGeneral Problem
Products intended to “fit” their users must be designed withcareful consideration of the size and shape of the user popula-tion. Clothing is the most apparent example, but many otherproducts, including bicycles, automobiles, and mobile phones,are developed with reference to anthropometric data that describethe distributions of human size and shape. For most applications,
designers draw on reference texts that tabulate percentiles of var-ious dimensions of interest [1]. More generally, limiting casesare identified that associate particular body dimensions with de-sign variables [2]. For example, the width between the arms of anoffice chair should be larger than most users’ seated hip breadth.
However, most anthrometric data are only approximately re-lated to the design variables of interest. Anthropometric datahave customarily been gathered using tape measures, calipers,and other simple apparatus to obtain repeatable point-to-pointand circumferential measures [3]. These dimensions are usuallygathered in only one or two standardized postures, and conse-quently do not represent well the body dimensions that are im-portant for many applications, such as automobile interior de-sign [4, 5, 6]. Standard anthropometric data also do not repre-sent body shape well and are of minimal value for designing thecontours of products that are to fit snugly over part of the body.These interfaces between user and designed artifact can affect fitand other measures of performance such as safety [7].
In recent years, three-dimensional scanning technology hasmade feasible rapid recording of whole body shape. Most ap-plications of body scan data are focused on the shapes of indi-viduals. Body scans have been used to fit personalized garments[8, 9] and as part of mass customization of footwear [10]. Large-scale surveys of populations have provided the opportunity touse shape information directly in design. However, methods forusing whole-body scan data for design purposes are not as welldeveloped as those applied with standard anthropometric mea-sures. This paper presents a systematic approach to analyzingand modeling body shape for design purposes, with a focus on
1 Copyright c© 2008 by ASME
representing torso shape, which is not well described by conven-tional anthropometric measures.
The current analysis uses data from the Civilian Americanand European Anthropometric Resource (CAESAR), which con-tains information on 2400 U.S. men and women measured be-tween 1999 and 2002 [11]. The participants were scanned in onestanding and two seated postures while wearing minimal, tight-fitting clothing. The models presented here are based on datafrom a relaxed, unsupported seated posture.
Applications of the CAESAR body scan data have primarilyrelied on the selection of a small number of individuals from thedataset to use as virtual test subjects [12]. But these individu-als have idiosyncrasies that may make them unsuitable to eval-uate particular features of a design, and the appropriate way toweight evaluations performed with a small number of manikinsis unclear. Boundary manikin approaches have been proposed tofacilitate the evaluation process (e.g., [13, 14]) but these meth-ods do not produce the desired quantification of accommodationif the selected anthropometric dimensions are not uniformly re-lated to accommodation [15, 16].
For the design of products to be used by large populations,virtual evaluations using the body shapes of a large number ofpeople would be preferred. One approach would use a randomsample of body shapes from the target population, but this is im-practical and inefficient. Body scan data are expensive to gatherand the existing datasets (e.g., CAESAR) are generally not repre-sentative of any particular target population. Product evaluationsor design criteria could be based on a weighted analysis, in whichthe results from each individual tested are weighted according tothe likelihood of such an individual being sampled from the tar-get population. However, some individuals of considerable an-thropometric interest, such as those with high body weight fortheir stature, are not well-represented in the CAESAR data, andhence would have high sampling weights in such a scheme.
An alternative approach presented in this paper is to developa statistical model of body shape that can be used to generatea wide range of synthetic torso shapes representing populationswith varying characteristics. The resulting shapes can be selectedto avoid the idiosyncrasies of individuals while accurately pre-serving the relationships between overall body dimensions, suchas stature (standing height) and weight, and body shape. Thisapproach parameterizes the data in a way that readily accommo-dates the application of rigorous design tools such as optimiza-tion.
Specific Problem: Backrest DesignThe backrests of office chairs and vehicle seats are critical
determinants of comfort in seating. A poorly designed back-rest can lead to discomfort and poor product acceptance. Onechallenge in backrest design is that few of the standard anthro-pometric variables are relevant. For example, the anthropometric
database used by the Business and Institutional Furniture Man-ufacturers Association to develop dimensional recommendationsfor office chairs [17] contains only a few linear dimensions, suchas chest breadth and erect seated shoulder height, that are rele-vant to backrest design.
Backrest design for both office and vehicle seating is cur-rently guided primarily by the subjective judgements of design-ers, by copying successful designs, and through repeated sub-jective trials of physical prototypes. This approach is time-consuming, expensive, and often yields uncomfortable seats.This paper describes some of the foundational activity neededto move to a system in which most of the evaluations for back-rest fit are performed using virtual sitting trials, using computermanikins to represent a wide spectrum of potential users. Com-mon problems, such as bolsters that are too narrow or upper-backcontours that encroach on the shoulders, can be readily identifiedand eliminated prior to building expensive physical prototypes.
Virtual fitting has been conducted for more than two decadesusing scalable digital human figure models to represent occu-pants [18, 12]. A central problem with this approach has beenthat the manikin body shapes have been generated by coarse scal-ing of a standard, midsize body form, and the resulting shapeshave been distinctly unrealistic. Moreover, a relatively smallnumber of manikins are typically used (fewer than 20), leadingto inaccurate and imprecise accommodation estimates.
In the current paper, we describe an approach to represent-ing human size and shape for design applications that providesconsiderably more useful detail than previous methods. A modelof human torso shape is developed that can provide a large num-ber of statistically representative torso shapes to represent a tar-get population characterized by gender mix and the distributionsof a few overall body dimensions. Populations of virtual sittersdeveloped using this model can be used to perform automated fit-ting trials of seats or chairs, providing an opportunity to conducttrade-off studies and optimize three-dimensional fit.
METHODSThe current methods were developed from those presented
by [19]. A uniform mesh is fit to body scan data and a princi-pal component analysis is performed on the mesh. Regressionanalysis is used to predict principal component scores from pop-ulation descriptors, such as stature and body weight. Finally,virtual individuals are sampled from a statistical representationof the desired population and their body shape is generated fromthe principal-component model.
Generating a Standard MeshPrior to conducting a statistical analysis of body shape, the
scan data must be mapped to a uniform representation. The rawCAESAR data are a high-resolution (mm-scale) irregular poly-
2 Copyright c© 2008 by ASME
gon mesh with a large number of holes and other irregularities.Due to the design of the laser scanning system, the vertices ofthe mesh are organized in horizontal slices. The data reductionprocess used here, which differs substantially from that used by[19], exploits the slice-oriented structure of the data, as follows:
1. Extract slices at 10-mm vertical intervals between the seatsurface and the top of the head.
2. Using a semi-automated procedure, strip off the data for thearms below the shoulders and the legs below the knees.
3. “Shrinkwrap” each data slice. This procedure uses an auto-mated algorithm to create a continuous planar contour thatinterpolates across holes while preserving the real concavi-ties in the surface contour.
4. Resample each slice, taking 120 points on each side of thebody.
5. Align the slices laterally by shifting to compensate for bodylean in the raw data.
6. Create a cylindrical mesh and resample to 60 slices betweenthe seat and the top of the head.
7. Downsample each slice to 60 vertices using spline interpo-lation.
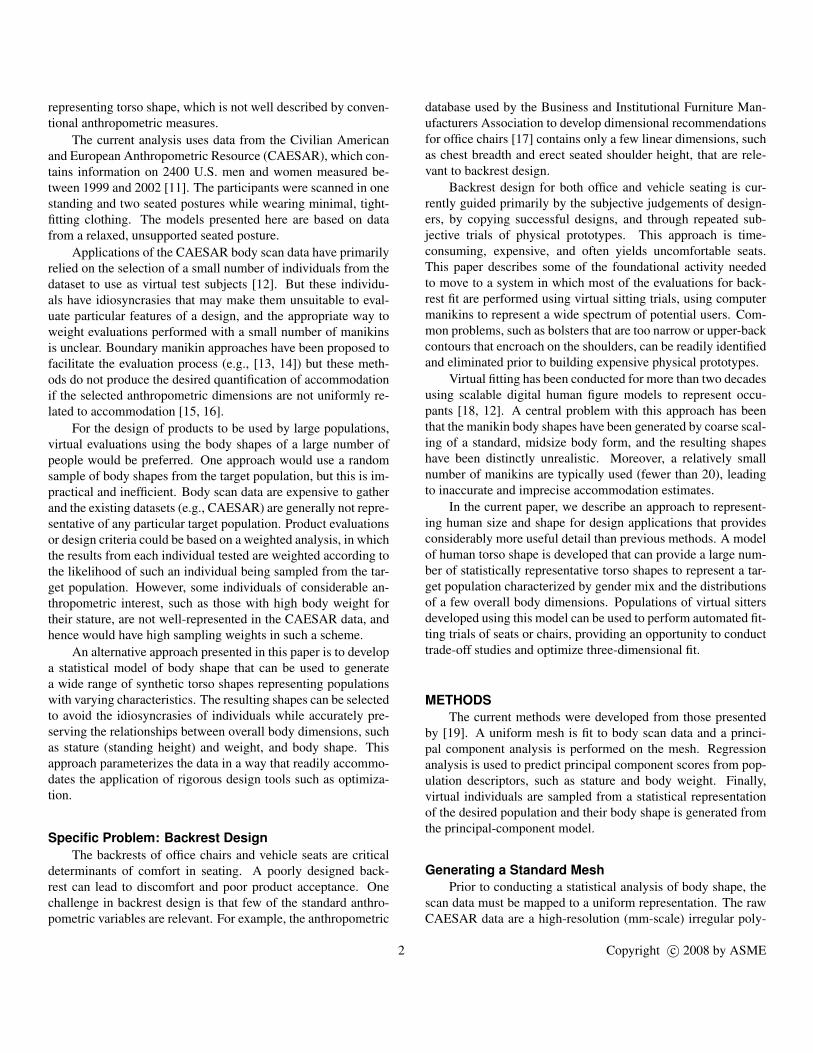
The result is that each subject’s torso data is represented bya 60× 60 vertex mesh. Figure shows examples of torso datafrom several subjects, including a set of body landmarks thatwere recorded along with the body scans. These 92 landmarksare useful for estimating the locations of skeletal features and,in the current work, for tracking the statistical performance ofthe analysis and reconstruction algorithms. The results in thispaper are based on analysis of 315 male and 449 female torsosfrom the CAESAR dataset. The sample includes all of the obese(BMI ≥ 30 kg/m2) participants, since their body dimensions areoften limiting for backrest design. Note that this sample, andindeed the overall CAESAR dataset, was not designed to be rep-resentative of any design population of interest.
Principal Component AnalysisWhen confronting data with a high number of dimensions,
principal component analysis (PCA) is a widely used tool to (1)express the data on an orthogonal basis that can be more read-ily analyzed, and (2) achieve data compression [20]. The latterresults when most of the variance in the data is contained in thefirst few principal components, which occurs when many data di-mensions are highly correlated. Geometrically, the first PC is thedirection in the space of the data with the highest variance, thesecond is the direction orthogonal to the first PC with the highestvariance, and so on. PCA is sometimes carried out using corre-lations, particularly when the data to be analyzed have differentunits or widely different scales. However, for the current appli-cation, analysis using the covariance matrix is more appropriatebecause it preserves scale [20].
Figure 1. Sample torsos with landmarks from the CAESAR dataset us-ing the mesh parameterization.
The current PCA approach follows the methods presentedby [19]. Separate analyses are conducted for men and women,since we expect gender specific patterns of body shape variation.The 60× 60 vertex mesh (60× 60× 3 floating point numbers)is concatenated with the coordinates of 92 landmarks to obtaina geometry vector g of length l = (60 ∗ 60 + 92) ∗ 3 = 11076for each individual in the database. The geometry vectors foreach individual are append to form the geometry matrix G withdimensions for N = 315 men of 315× 11076. Without loss ofgenerality, the G matrix is assumed to be centered by subtractingfrom each subject’s g vector the overall mean g.
The PCA can be computed as the eigendecomposition of thecovariance matrix, but this can be computationally expensive (thecovariance matrix is 11076× 11076, in this case). Instead, weuse an PCA algorithm by Turk and Pentland [21] that computesonly the first k principal components in descending order of vari-ance. Although k could take a value as large as l, the algorithmcalls for setting k = N, significantly reducing the size of the ma-trix on which operations are performed. This choice is justifiedby the results below, which show that 99 percent of the variancein the data is accounted for by the first 60 principal components.
For k = l,
G = SP, (1)
where S is an N× l matrix of principal component (PC) scoresand P is an l×N matrix, each column of which is a normalizedprincipal component. In effect, the PCA projects the data into anew basis given by the principal components.
3 Copyright c© 2008 by ASME

The PCA for the first k principal components (i.e., the k withthe highest associated variance) yields
G∗ = SkPk, (2)
where G∗ is an approximation of G, Sk is the first k columns ofS, and Pk is the first k columns of P. With the Turk and Pentlandalgorithm, we compute k = N PCs, so Sk is square.
An individual’s geometry can be approximated by
g∗ = g+PTk ST
ki (3)
where Ski is the row of the Sk matrix corresponding to the ithindividual’s principal component scores. Considerable compres-sion is achieved by using only the first, say, 60 PC scores, ratherthan the individual’s full 11076 element geometry vector.
Regression AnalysisThe PCA expresses the data in a relatively compact, orthog-
onal basis, which is amenable to statistical analysis. To predictthe PC scores associated with a particular set of characteristics(such as body mass or sitting height), we create a linear model ofthe form
Sk = CF+ εT (4)
where F is a feature matrix with rows of vectors
fi = [v1i,v2i, ...,1]T (5)
such that v1i is the value of the first subject descriptor for the ithsubject and εT is a column of residuals. The coefficient matrixC is estimated using standard least-squares techniques by takingthe Moore-Penrose pseudoinverse F+ of F such that
C = SkF+. (6)
For the current application, the design population can usu-ally be described by gender mix (fraction of males and females inthe population) and by the distributions within gender of stature(erect standing height) and body mass index (BMI). BMI is com-puted as body weight in kg divided by stature in meters squaredand is widely used for characterizing weight-for-stature. Unlikebody weight, BMI is only weakly correlated with stature, andhence is a better predictor to include in regression analyses alongwith stature. Although it is sometimes of interest to examine the
statistical significance of these models using conventional proce-dures, those analyses do not ultimately affect these results andhence are not presented.
The outcome of the regression analysis is a model in theform
s = Cf′T (7)
where f′ is [v1,v2, ...,1] that gives the predicted PC scores condi-tioned on values of the predictors. The predicted torso shape isthen constructed from Eq. 3. For the current work, one model isgenerated for each gender.
The residual variance not accounted for by the predictors(ε) can be considerable and is important to retain. We representthe residual variance for the current models by computing thestandard deviation across subjects of the residuals on each PC.The residuals are independent and, for the current work, assumedto be normally distributed with zero mean.
Model ApplicationThe male and female models are exercised to generate torso
shapes by (1) inputting a stature and BMI to compute a PC-scorevector, (2) optionally adding a random component obtained bysampling k zero-mean normal distributions with standard devia-tions given by the ε vector, (3) multiplying the PC-score vectorby the PC matrix and adding g to obtain g, and partitioning g toobtain coordinates of the torso mesh.
RESULTSNumber of Principal Components
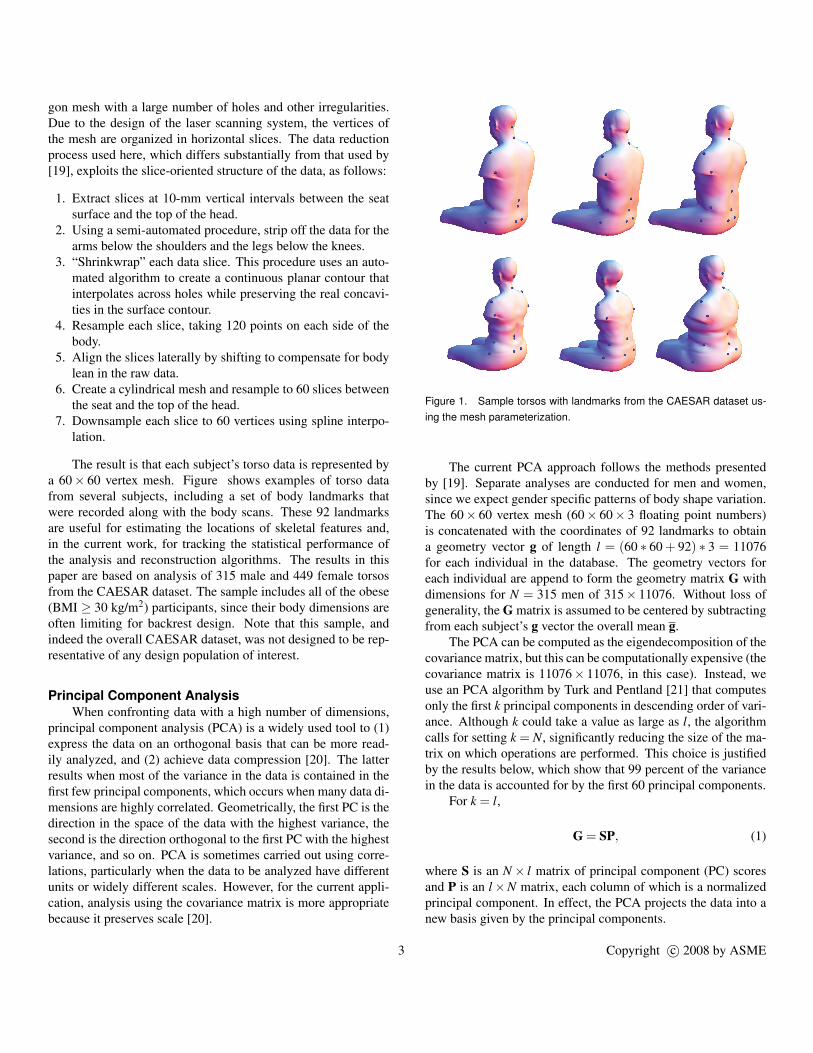
As expected, an individual’s body shape could be repre-sented to acceptable accuracy by a relatively small number ofPCs. Figure 2 shows the cumulative fraction of variance ac-counted for by number of PCs for men and women. Using thecurrent parameterization of body shape, 99% of variance is cap-tured by the first 60 PCs for both men and women. In the resultsthat follow, 60 PCs were included. Using more PCs preservesmore individual variability, but for the current design applicationno more than 60 PCs are needed.
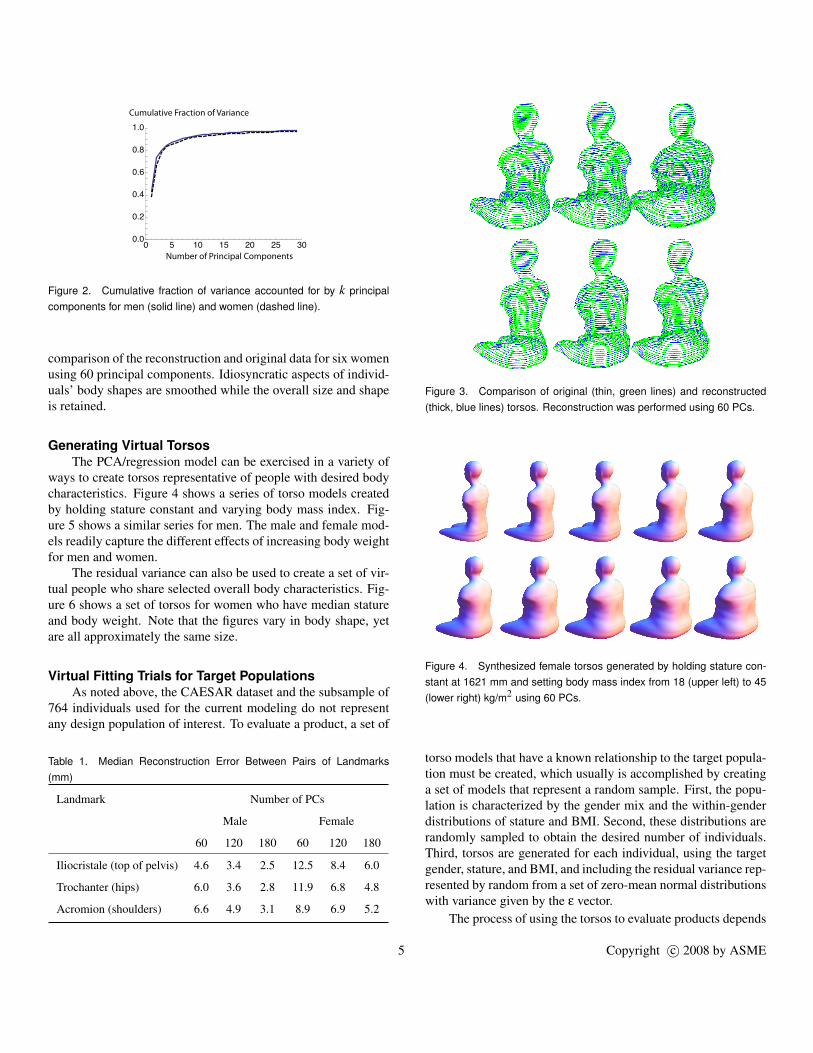
More important than the cumulative fraction of variance ishow well a selected number of PCs preserves key body dimen-sions. A good error metric for this application is the torso widthat key landmark locations. Table 1 lists the median error in thetorso width at the hips, top of the pelvis, and shoulders for re-constructions using 60, 120, and 180 PCs. The median widtherror is approximately halved when going from 60 to 180 PCs.For men, the median error is below 5 mm for all three dimen-sions with 120 PCs. The median errors for women are larger,reflecting greater shape variability. Figure 3 shows a qualitative
4 Copyright c© 2008 by ASME
0 5 10 15 20 25 300.0
0.2
0.4
0.6
0.8
1.0Cumulative Fraction of Variance
Number of Principal Components
Figure 2. Cumulative fraction of variance accounted for by k principalcomponents for men (solid line) and women (dashed line).
comparison of the reconstruction and original data for six womenusing 60 principal components. Idiosyncratic aspects of individ-uals’ body shapes are smoothed while the overall size and shapeis retained.
Generating Virtual TorsosThe PCA/regression model can be exercised in a variety of
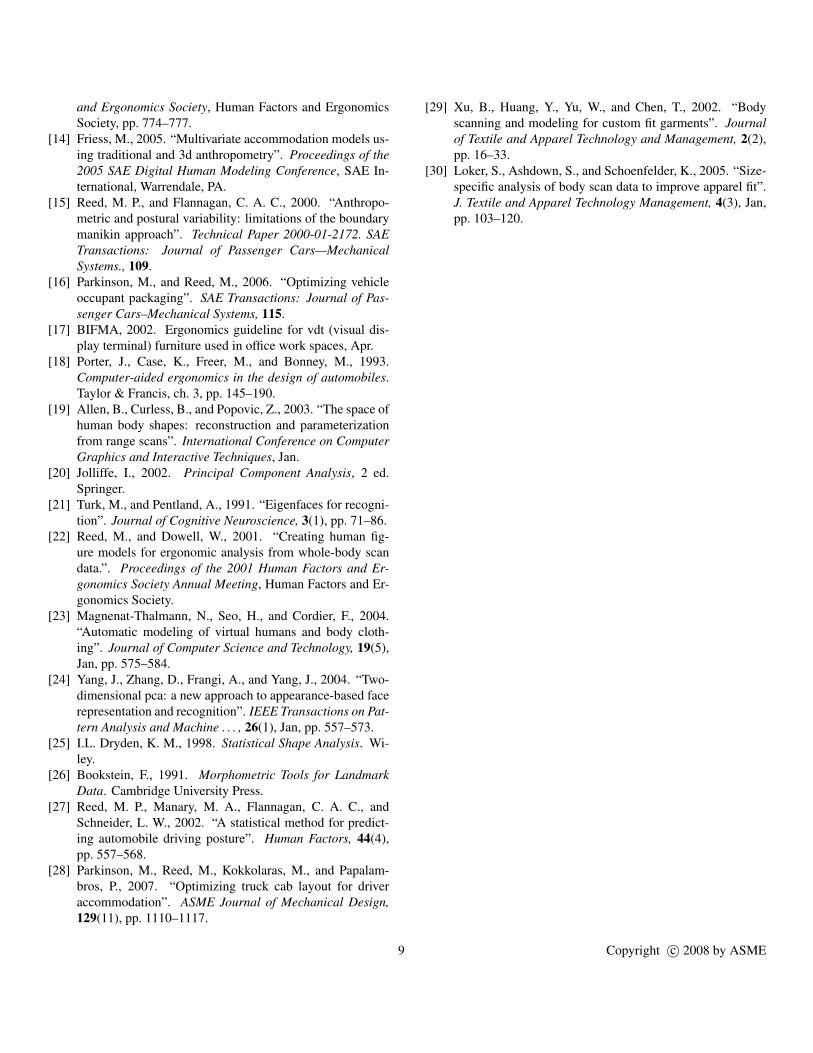
ways to create torsos representative of people with desired bodycharacteristics. Figure 4 shows a series of torso models createdby holding stature constant and varying body mass index. Fig-ure 5 shows a similar series for men. The male and female mod-els readily capture the different effects of increasing body weightfor men and women.
The residual variance can also be used to create a set of vir-tual people who share selected overall body characteristics. Fig-ure 6 shows a set of torsos for women who have median statureand body weight. Note that the figures vary in body shape, yetare all approximately the same size.
Virtual Fitting Trials for Target PopulationsAs noted above, the CAESAR dataset and the subsample of
764 individuals used for the current modeling do not representany design population of interest. To evaluate a product, a set of
Table 1. Median Reconstruction Error Between Pairs of Landmarks(mm)
Landmark Number of PCs
Male Female
60 120 180 60 120 180
Iliocristale (top of pelvis) 4.6 3.4 2.5 12.5 8.4 6.0
Trochanter (hips) 6.0 3.6 2.8 11.9 6.8 4.8
Acromion (shoulders) 6.6 4.9 3.1 8.9 6.9 5.2
Figure 3. Comparison of original (thin, green lines) and reconstructed(thick, blue lines) torsos. Reconstruction was performed using 60 PCs.
Figure 4. Synthesized female torsos generated by holding stature con-stant at 1621 mm and setting body mass index from 18 (upper left) to 45(lower right) kg/m2 using 60 PCs.
torso models that have a known relationship to the target popula-tion must be created, which usually is accomplished by creatinga set of models that represent a random sample. First, the popu-lation is characterized by the gender mix and the within-genderdistributions of stature and BMI. Second, these distributions arerandomly sampled to obtain the desired number of individuals.Third, torsos are generated for each individual, using the targetgender, stature, and BMI, and including the residual variance rep-resented by random from a set of zero-mean normal distributionswith variance given by the ε vector.
The process of using the torsos to evaluate products depends
5 Copyright c© 2008 by ASME

Figure 5. Synthesized male torsos generated by holding stature con-stant at 1755 mm and setting body mass index from 18 (upper left) to 45(lower right) kg/m2 using 60 PCs.
Figure 6. Synthesized female torsos with median stature and body massindex using random sampling of residuals.
on the desired metrics, but a general approach is to posture thetorso against the backrest to evaluate fit. Dependent measurescan be computed from the intersection between the virtual torsoand the design surface of the backrest. For seats with compliantbackrests, the magnitude of intersection is of interest. Figure 7shows several torso models relative to an office chair. The torsoshave been positioned relative to the backrest using a prediction ofthe estimated hip joint location. The contours of the backrest andother components can be evaluated relative to the virtual sitters todetermine if the contours are too restrictive. Often a qualitativeanalysis is useful, but the fit can also be evaluated quantitativelyfor a population of sitters to determine if the desired accommo-dation targets are met. In future work, the posturing algorithmwill consider the simulated deflection of the backrest surface andsubjective response to the resulting pressure distribution.
DISCUSSIONThis work presents the first application of human body scan
data to seat and chair design that incorporates the variance in alarge dataset, rather than extracting a few individuals. The rela-tively large number of people in the dataset, and their anthropo-metric diversity, means that the resulting models capture a largepercentage of the variance in body shape that is important forchair and seat design. The approach is broadly applicable andcan be readily extended to other problems for which body-scandata are available. It also facilitates trade-off analysis and hasbeen developed to be readily implemented in a workflow incor-porating optimization.
The analysis methods presented here are derived principallyfrom [19], but the model construction, analysis, and applicationmethods differ in several important ways. We use a cylindricalmesh model that simplifies the parameterization of the scan data.In principle, any consistent parameterization can be used. Forexample, we have conducted similar modeling using the con-trol points of parametric surfaces (e.g., Non-Uniform RationalB-Splines). The cylindrical parameterization can also be gen-eralized to represent the whole body [22], although the morecomplex surface mesh model used by Allen et al. (2003) hasadvantages for visualization. Our emphasis is to create mod-els that can be represented simply in any CAD system and canalso be subjected to additional statistical analysis. The simplic-ity of the parameterization used here has allowed with modesteffort the extraction of data from 764 scans, rather than the 250used by [19]. While we cannot easily define how many scansis ”enough” outside of the context of a particular design analy-sis, adding more individuals provides higher confidence that thepopulation variability in body size and shape is adequately repre-sented. For example, the current dataset includes all of the obeseindividuals in the U.S. CAESAR dataset, who were included toimprove the model performance for simulating the larger peo-ple who are often the limiting cases for chair and seat design.Our PCA methods follow [19] closely, including the selectionof the Turk and Pentland algorithm. We differ in applying theresults of the regression analysis to the modeling of target popu-lations using the residual variance from the regressions, a naturalbut important extension of the earlier work. This methodologyis motivated by functional anthropometric models developed forposture prediction [4]. Finally, the application of this analysisand modeling approach to ergonomics analysis and virtual fittingtrials is novel, and represents an important advancement in theapplication of anthropometric data to seat and chair design.
The use of principal component analysis to reduce largedatasets is a widely used technique that has been applied pre-viously to modeling anatomical shapes (e.g., [23]), but the de-pendence of the resulting models on the selected parameteriza-tion of the geometry has not been widely discussed. In particu-lar, the relationship between the high-variance PCs and the shapeare strongly dependent on the distribution of the landmarks, ver-
6 Copyright c© 2008 by ASME

Figure 7. Synthesized torsos used for virtual fitting trials in an office chair.
7 Copyright c© 2008 by ASME

tices, or other features represented by the parameterization. Thecurrent work used a simple parameterization that distributed ver-tices evenly on each slice on each side of the body. Body land-mark locations are parameterized separately from the mesh, sothat the location of a particular landmark relative to the meshcan vary across individuals. This approach simplifies the fittingprocess, but means that detailed features are not well preserved.This tradeoff is acceptable for the current work, because the bodysurfaces of interest have relatively smooth contours, but a param-eterization with more homologous points would be appropriatefor modeling face contours, for example [24].
The modeling methods presented here differ from the stan-dard approaches to shape analysis, which remove size (scale)prior to analyzing shape [25]. A typical shape analysis is in-tended to test hypotheses regarding group membership based onthe relative positions of landmarks [26]. Removing scale allowsshape to be differentiated among individuals who differ widelyin size. Generalized Procrustes Analysis (GPA) is often a firststep in such shape analyses. GPA standardizes scale and com-putes an optimal (in a least-squares sense) alignment or registra-tion between the homologous landmarks of each individual in thesample [25]. PCA is often used to analyze the remaining devia-tions from the average landmark locations. The current methodbypasses the GPA and instead uses an anatomical coordinate sys-tem to align the data from individuals prior to subtracting off themean. Our approach is dramatically faster and is justified in placeof Procrustes analysis when (1) a reasonable coordinate systemcan readily be defined, in this case exploiting bilateral symmetry,and (2) when the errors in the locations of the landmarks used toestablish the coordinate system are small relative to the effectsto be analyzed. But the most important difference between thecurrent work and typical shape analysis is that our objective isnot testing hypotheses regarding shape differences, but rather si-multaneously modeling both size and shape, and hence we do notnormalize scale prior to analysis.
The results presented here are based on analysis of the torsoshape as scanned, but sitters’ postures when using chairs andseats can be somewhat different. Methods for morphing the tor-sos to represent a range of seated postures have been developed[22] and statistical models to predict seated posture are availablefor some environments [27]. For virtual fitting trials, represent-ing variance in posture can be as important as modeling anthro-pometric variability [15, 28, 16].
The development of statistical models of body contours pro-vides the opportunity for more robust and automated design toolsfor creating products that fit their users well. The technology ofautomated fit assessments is still evolving and most applicationshave been in the apparel industry [29, 30]. As these methodsare refined, we anticipate that virtual fitting trials will be usedto improve product design and to reduce development time andcost.
ACKNOWLEDGMENTThis work was supported in part by Herman Miller, Incor-
porated.
REFERENCES[1] Tilley, A., Bardagjy, J., and Diffrient, N., 1974. Human-
scale 1/2/3. MIT Press.[2] HFES 300 Committee, 2004. Guidelines for Using Anthro-
pometric Data in Product Design. Human Factors and Er-gonomics Society, Santa Monica, CA.
[3] Roebuck, J. A., 1995. Anthropometric methods: designingto fit the human body. HFES. Santa Monica, CA.
[4] Flannagan, C. A. C., Manary, M. A., Schneider, L. W.,and Reed, M. P., 1998. “Improved seating accommoda-tion model with application to different user populations”.Proc. SAE International Congress & Exposition, Vol. 1358,SAE, Warrendale, PA, USA, pp. 43–50.
[5] Manary, M. A., Flannagan, C. A. C., Reed, M. P., andSchneider, L. W., 1998. “Development of an improveddriver eye position model”. Technical Paper 980856. SAETransactions: Journal of Passenger Cars, 107.
[6] Reed, M. P., Manary, M. A., Flannagan, C. A. C., andSchneider, L. W., 2000. “The effects of vehicle interior ge-ometry and anthropometric variables on automobile drivingposture”. Human Factors, 42(4), pp. 541–552.
[7] Parkinson, M. B., and Reed, M. P., 2006. “Improved headrestraint design for safety and compliance”. Proc. ASMEInternational Design Engineering Technical Conferences,Philadelphia, PA.
[8] Ashdown, S., Loker, S., Schoenfelder, K., and Lyman-. . . ,L., 2004. “Using 3d scans for fit analysis”. Journal ofTextile and Apparel, Jan.
[9] Ashdown, S., and Dunne, L., 2006. “A study of automatedcustom fit: Readiness of the technology for the apparel in-dustry”. Clothing and Textiles Research Journal, Jan.
[10] Witana, C., Xiong, S., Zhao, J., and Goonetilleke, R.,2006. “Foot measurements from three-dimensional scans:A comparison and evaluation of different methods”. Inter-national Journal of Industrial Ergonomics, Jan.
[11] Robinette, K., Blackwell, S., Daanen, H., and Boehmer,M., 2002. Civilian american and european surface anthro-pometry resource (caesar), final report. volume 1. Tech.rep., United States Air Force Research Laboratory, Wright-Patterson Air Force Base, Ohio, U.S., n.
[12] Loczi, J., 2000. “Application of the 3-D CAD manikin ram-sis to heavy truck design”. Proc. Human Factors and Er-gonomics Society, Human Factors and Ergonomics Society,pp. 832–835.
[13] Bittner, A. C., 2000. “A-CADRE: advanced family ofmanikins for workstation design”. Proc. Human Factors
8 Copyright c© 2008 by ASME
and Ergonomics Society, Human Factors and ErgonomicsSociety, pp. 774–777.
[14] Friess, M., 2005. “Multivariate accommodation models us-ing traditional and 3d anthropometry”. Proceedings of the2005 SAE Digital Human Modeling Conference, SAE In-ternational, Warrendale, PA.
[15] Reed, M. P., and Flannagan, C. A. C., 2000. “Anthropo-metric and postural variability: limitations of the boundarymanikin approach”. Technical Paper 2000-01-2172. SAETransactions: Journal of Passenger Cars—MechanicalSystems., 109.
[16] Parkinson, M., and Reed, M., 2006. “Optimizing vehicleoccupant packaging”. SAE Transactions: Journal of Pas-senger Cars–Mechanical Systems, 115.
[17] BIFMA, 2002. Ergonomics guideline for vdt (visual dis-play terminal) furniture used in office work spaces, Apr.
[18] Porter, J., Case, K., Freer, M., and Bonney, M., 1993.Computer-aided ergonomics in the design of automobiles.Taylor & Francis, ch. 3, pp. 145–190.
[19] Allen, B., Curless, B., and Popovic, Z., 2003. “The space ofhuman body shapes: reconstruction and parameterizationfrom range scans”. International Conference on ComputerGraphics and Interactive Techniques, Jan.
[20] Jolliffe, I., 2002. Principal Component Analysis, 2 ed.Springer.
[21] Turk, M., and Pentland, A., 1991. “Eigenfaces for recogni-tion”. Journal of Cognitive Neuroscience, 3(1), pp. 71–86.
[22] Reed, M., and Dowell, W., 2001. “Creating human fig-ure models for ergonomic analysis from whole-body scandata.”. Proceedings of the 2001 Human Factors and Er-gonomics Society Annual Meeting, Human Factors and Er-gonomics Society.
[23] Magnenat-Thalmann, N., Seo, H., and Cordier, F., 2004.“Automatic modeling of virtual humans and body cloth-ing”. Journal of Computer Science and Technology, 19(5),Jan, pp. 575–584.
[24] Yang, J., Zhang, D., Frangi, A., and Yang, J., 2004. “Two-dimensional pca: a new approach to appearance-based facerepresentation and recognition”. IEEE Transactions on Pat-tern Analysis and Machine . . . , 26(1), Jan, pp. 557–573.
[25] I.L. Dryden, K. M., 1998. Statistical Shape Analysis. Wi-ley.
[26] Bookstein, F., 1991. Morphometric Tools for LandmarkData. Cambridge University Press.
[27] Reed, M. P., Manary, M. A., Flannagan, C. A. C., andSchneider, L. W., 2002. “A statistical method for predict-ing automobile driving posture”. Human Factors, 44(4),pp. 557–568.
[28] Parkinson, M., Reed, M., Kokkolaras, M., and Papalam-bros, P., 2007. “Optimizing truck cab layout for driveraccommodation”. ASME Journal of Mechanical Design,129(11), pp. 1110–1117.
[29] Xu, B., Huang, Y., Yu, W., and Chen, T., 2002. “Bodyscanning and modeling for custom fit garments”. Journalof Textile and Apparel Technology and Management, 2(2),pp. 16–33.
[30] Loker, S., Ashdown, S., and Schoenfelder, K., 2005. “Size-specific analysis of body scan data to improve apparel fit”.J. Textile and Apparel Technology Management, 4(3), Jan,pp. 103–120.
9 Copyright c© 2008 by ASME