modelling and mapping the occurrence of ...in fire danger assessment. in ‘wildland fire danger...
TRANSCRIPT

MODELLING AND MAPPING THE OCCURRENCE OF WILDFIRE
IGNITIONS IN PORTUGAL
por
Filipe Xavier Catry
Dissertação apresentada como requisito parcial para obtenção do grau de Mestre
em Ciência & Sistemas de Informação Geográfica
pelo
Instituto Superior de Estatística e Gestão de Informação
i
da
Universidade Nova de Lisboa
MODELAÇÃO ESPACIAL DO RISCO DE IGNIÇÃO EM PORTUGAL CONTINENTAL
Filipe Xavier Catry

MODELAÇÃO ESPACIAL DO RISCO DE IGNIÇÃO EM PORTUGAL
CONTINENTAL
Dissertação orientada por
Professor Doutor Fernando Lucas Bação
Professor Doutor Francisco Castro Rego
Agosto de 2007
ii

AGRADECIMENTOS
Um especial agradecimento ao Professor Francisco Castro Rego e ao Professor
Fernando Lucas Bação, pela orientação deste trabalho, pelas importantes e
decisivas discussões metodológicas, e por todo o apoio prestado.
Ao Dr. Francisco Moreira do CEABN, por ter acompanhado grande parte deste
processo, e pelas muitas sugestões e importante ajuda que deu.
À Direcção-Geral das Florestas (DGRF), por toda a colaboração e por ter
disponibilizado a base de dados oficial relativa aos incêndios ocorridos em
Portugal.
À Eng.ª Paula Lopes do CEABN, e ao Eng.ºAntónio Nunes e Eng.º Vasco Nunes
do IGP, pela sua ajuda no processamento preliminar das bases de dados.
Aos meus pais por tudo, e pelo apoio e incentivo constantes.
À Comissão Europeia que financiou uma parte do trabalho desenvolvido, através
do projecto Fire Paradox (contract no. FP6-018505).
A todos os que de alguma forma me apoiaram ao longo das diferentes fases do
trabalho.
iii

MODELAÇÃO ESPACIAL DO RISCO DE IGNIÇÃO EM PORTUGAL
CONTINENTAL
RESUMO
Portugal regista actualmente a densidade mais elevada de focos de incêndio entre
os países do sul da Europa Mediterrânica. A capacidade de prever a ocorrência de
ignições pode constituir um importante instrumento, auxiliando os gestores na
definição de prioridades entre áreas com risco de propagação idêntico, e
proporcionando uma melhor eficácia na distribuição dos meios de prevenção e
combate a incêndios. Neste estudo foram analisados 127 490 focos de incêndio
que ocorreram em Portugal num período de cinco anos. Foram utilizados modelos
de regressão logística para prever a probabilidade de ocorrência de ignições,
usando diversas variáveis explicativas, humanas e ambientais, e foi também
produzido um mapa de risco de ignição para Portugal continental. Quer os
modelos quer o mapa produzidos foram avaliados utilizando diferentes métodos.
Os resultados obtidos mostram que as ignições estão muito relacionadas com a
presença e actividade humana. Foi demonstrado que é possível prever a
probabilidade de ocorrência de ignições a nível nacional com uma precisão
satisfatória, previsões essas que poderão ser bastante úteis no apoio à tomada de
decisões na gestão do risco de incêndio.
iv

MODELLING AND MAPPING THE OCCURRENCE OF WILDFIRE
IGNITIONS IN PORTUGAL
ABSTRACT
Portugal has the highest density of wildfire ignitions among southern
European countries. The ability to predict fire ignition occurrence constitutes an
important tool for managers, helping to define priorities among areas of
equivalent fire propagation risk, and to improve the effectiveness of fire
prevention and fire fighting resources allocation. In this study we analysed 127
490 fire ignitions which occurred in Portugal during a five years period. We used
logistic regression models to predict the probability of wildfire ignition
occurrence, using both human and environmental explanatory variables, and
produced a fire ignition risk map for the Portuguese mainland. Results show that
fire ignitions are strongly correlated with human presence and activity. In this
paper we demonstrate that it is possible to predict the likelihood of fire ignition at
the national level with satisfactory accuracy, which can be useful in decision
making for fire risk management.
v

PALAVRAS-CHAVE
Risco de Ignição
Sistemas de Informação Geográfica
Regressão Logística
Incêndios Florestais
KEYWORDS
Fire Ignition Risk
Geographic Information Systems
Logistic Regression
Forest Fires
vi

ACRÓNIMOS
DGRF – Direcção-Geral dos Recursos Florestais
EC – Comissão Europeia (European Comission)
IA – Instituto do Ambiente
IGeoE – Instituto Geográfico do Exército
IGP – Instituto Geográfico Português
SIG – Sistemas de Informação Geográfica
vii

ÍNDICE DO TEXTO
.
CAPÍTULO 1 - INTRODUÇÃO __________________________________
Referências bibliográficas ________________________________________
CAPÍTULO 2 - PUBLICAÇÕES __________________________________
Spatial Distribution Patterns of Wildfire Ignitions in Portugal _________
Modelling and mapping wildfire ignition risk in Portugal _____________
CAPÍTULO 3 - CONCLUSÕES __________________________________
Pág
__ 1
__ 5
__ 7
__ 8
_ 19
_ 41
viii

CAPÍTULO 1 - INTRODUÇÃO
Em Portugal a floresta tem uma grande importância, ocupando cerca de 27% do
território continental, (DGF, 2001). A floresta gera cerca de 113 mil postos de
trabalho directos (2% da população activa), gerando também muitos postos de
trabalho indirectos, e os produtos florestais representam cerca de 15% do valor
das exportações nacionais. Mendes et al. (2004), calcularam a produção
económica anual da floresta portuguesa em cerca de 1,2 mil milhões de euros,
tendo em consideração os valores de uso directo dos produtos tradicionais
(madeira, cortiça e resina), mas também outros valores que normalmente não são
contabilizados, tanto de uso directo (produtos não lenhosos como frutos,
cogumelos e plantas aromáticas, mas também a pastorícia, a caça e o recreio),
como de uso indirecto (protecção do solo e dos recursos hídricos, sequestro de
carbono, e a protecção da paisagem e da biodiversidade).
Os incêndios em Portugal constituem um fenómeno que se tem vindo a agravar
nas últimas décadas, constituindo a principal ameaça à riqueza florestal do país e
representando anualmente elevados prejuízos económicos, sociais e ambientais.
Analisando os dados da Comissão Europeia (EC 2005) relativos a cinco países do
sul da Europa Mediterrânea (Portugal, Espanha, França, Itália e Grécia), verifica-
se que desde 1980, a tendência de evolução da área ardida em Portugal tem sido
crescente, contrariando a tendência decrescente que se vem verificando nos
restantes países. Entre 1990 e 2005 arderam em Portugal cerca de 2,3 milhões de
hectares, representando cerca de 25% da área do país (DGRF 2006), e nos
recentes anos de 2003 e 2005 a área ardida atingiu os valores mais elevados desde
que há registos (1980).
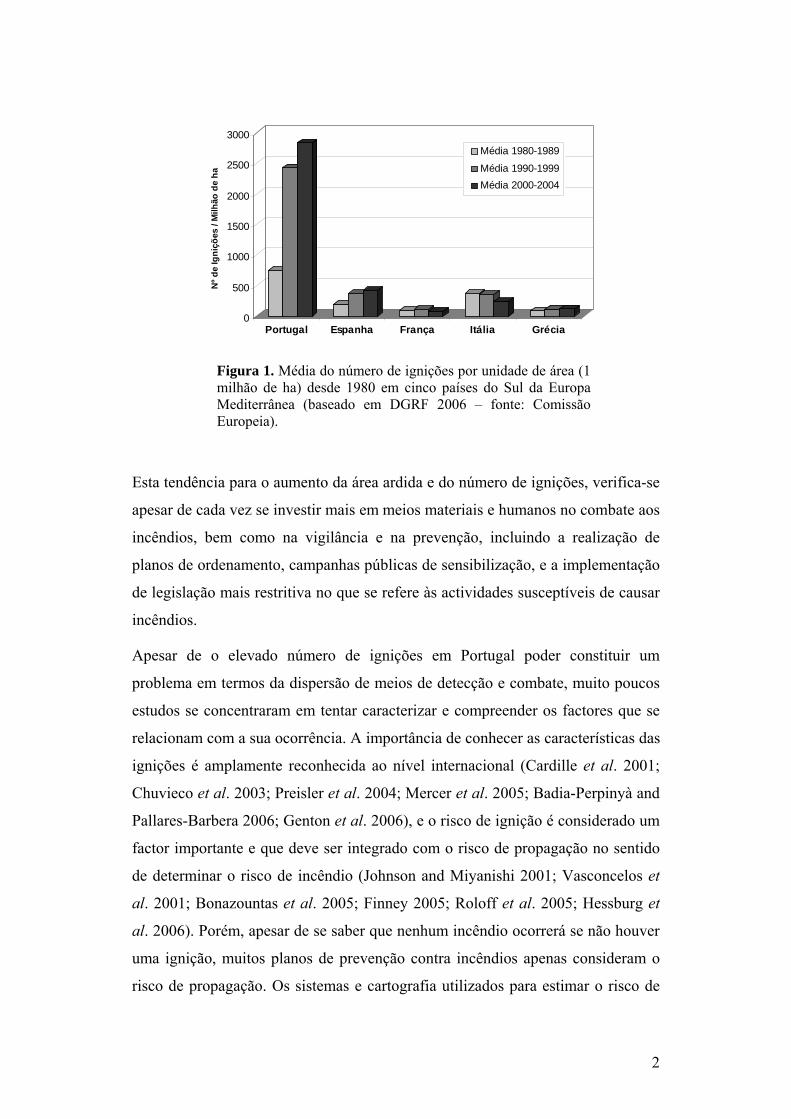
Relativamente à evolução do número de ignições (focos de incêndio), as
estatísticas mostram que em Portugal houve um aumento muito acentuado nas
últimas décadas, e que no período 2000-2005 a densidade média de ignições em
no nosso país foi três vezes superior relativamente ao conjunto dos restantes
países (Fig. 1). Desde 2000 Portugal registou em média cerca de 28 500 ignições
por ano (DGRF 2006).
1
0
500
1000
1500
2000
2500
3000
Nº d
e Ig
niçõ
es /
Milh
ão d
e ha
Portugal Espanha França Itália Grécia
Média 1980-1989
Média 1990-1999Média 2000-2004
Figura 1. Média do número de ignições por unidade de área (1 milhão de ha) desde 1980 em cinco países do Sul da Europa Mediterrânea (baseado em DGRF 2006 – fonte: Comissão Europeia).
Esta tendência para o aumento da área ardida e do número de ignições, verifica-se
apesar de cada vez se investir mais em meios materiais e humanos no combate aos
incêndios, bem como na vigilância e na prevenção, incluindo a realização de
planos de ordenamento, campanhas públicas de sensibilização, e a implementação
de legislação mais restritiva no que se refere às actividades susceptíveis de causar
incêndios.
Apesar de o elevado número de ignições em Portugal poder constituir um
problema em termos da dispersão de meios de detecção e combate, muito poucos
estudos se concentraram em tentar caracterizar e compreender os factores que se
relacionam com a sua ocorrência. A importância de conhecer as características das
ignições é amplamente reconhecida ao nível internacional (Cardille et al. 2001;
Chuvieco et al. 2003; Preisler et al. 2004; Mercer et al. 2005; Badia-Perpinyà and
Pallares-Barbera 2006; Genton et al. 2006), e o risco de ignição é considerado um
factor importante e que deve ser integrado com o risco de propagação no sentido
de determinar o risco de incêndio (Johnson and Miyanishi 2001; Vasconcelos et
al. 2001; Bonazountas et al. 2005; Finney 2005; Roloff et al. 2005; Hessburg et
al. 2006). Porém, apesar de se saber que nenhum incêndio ocorrerá se não houver
uma ignição, muitos planos de prevenção contra incêndios apenas consideram o
risco de propagação. Os sistemas e cartografia utilizados para estimar o risco de
2

incêndio em Portugal, têm concentrado a maior parte dos esforços na predição do
risco de incêndio global (Carreiras and Pereira 2006; IGP 2004), mas poucos
trabalhos se têm concentrado em modelar e prever especificamente o risco de
ignição, não existindo nenhum mapa nacional de risco de ignição.
Assim, os principais objectivos deste trabalho consistiram em:
a) Proceder à análise das características e dos padrões espaciais de ocorrência dos
focos de incêndio em Portugal, identificando os principais factores que lhes
estão associados;
b) Desenvolver modelos de probabilidade de ocorrência de ignições, utilizado um
conjunto de variáveis que estão directa ou indirectamente associadas aos focos
de incêndio;
c) Produzir um mapa de risco de ignição para Portugal continental, com base no
modelo desenvolvido e recorrendo a Sistemas de Informação Geográfica;
d) Avaliar o grau de precisão dos modelos e mapa desenvolvidos.
Para a persecução destes objectivos, foi utilizada uma base de dados que inclui a
localização de 127 490 ocorrências de fogo registadas em Portugal durante um
período de cinco anos, e um conjunto de informação correspondente a variáveis
que potencialmente poderão explicar a sua ocorrência. Estas bases de dados foram
analisadas utilizando métodos de regressão logística.
É conhecido que a maior parte das ignições em Portugal está associada a causas
humanas, à semelhança do que acontece em outros países do Sul da Europa. Um
relatório recente da Direcção-Geral dos Recursos Florestais (DGRF 2006) mostra
que apenas 3% dos fogos investigados com sucesso entre 2000 e 2005 tiveram
causa natural (relâmpagos), tendo os restantes origem humana. Tendo presente
este facto, foi dada especial atenção às características do território que estão
relacionadas com a presença e actividade humana.
Neste trabalho apresentam-se as análises relativas aos padrões espaciais de
ocorrência de focos de incêndio em Portugal, bem como os modelos de predição e
o mapa de risco de ignição desenvolvidos. São ainda apresentados os resultados
relativos à avaliação da performance dos modelos e do mapa produzido. Pretende-
3

se assim contribuir para um melhor conhecimento da ocorrência das ignições e
consequentemente contribuir para melhorar a eficácia da gestão do risco de
incêndio em Portugal.
A presente dissertação é apresentada sob a forma de duas publicações científicas,
que constituem o segundo capítulo desta dissertação, e onde são apresentadas as
metodologias, os resultados e a discussão. O terceiro capítulo consiste na
apresentação resumida das principais conclusões resultantes do trabalho
desenvolvido.
4

Referências bibliográficas Badia-Perpinyà A, Pallares-Barbera M (2006) Spatial distribution of ignitions in
Mediterranean periurban and rural areas: the case of Catalonia. International Journal of Wildland Fire 15, 187–196.
Bonazountas M, Kallidromitou D, Kassomenos, PA, Passas N (2005) Forest fire risk analysis. Human and Ecological Risk Assessment 11, 617–626.
Cardille JA, Ventura SJ, Turner MG (2001) Environmental and social factors influencing wildfires in the Upper Midwest, USA. Ecological Applications 11(1), 111-127.
Carreiras JMB, Pereira, JMC (2006) An inductive fire risk map for Portugal. In ‘Proceedings of the 5th International Conference on Forest Fire Research’. CD Rom, 7 pp. (Figueira da Foz)
Chuvieco E, Allgöwer B, Salas J (2003) Integration of physical and human factors in fire danger assessment. In ‘Wildland fire danger estimation and mapping. The role of remote sensing data’. (Ed. E Chuvieco). Vol. 4 World Scientific Publishing (Singapore).
DGF (2001) Inventário florestal nacional. Portugal continental. 3ª Revisão, 1995-1998. Direcção-Geral das Florestas, Lisboa. [In Portuguese]
DGRF (2006) Incêndios florestais – Relatório de 2005. Divisão de Defesa da Floresta Contra Incêndios. Direcção-Geral dos Recursos Florestais (Lisboa). [In Portuguese]
EC (2005) Forest fires in Europe 2004. Official Publication of the European Commission, S.P.I.05.147 EN.
Finney MA (2005) The challenge of quantitative risk analysis for wildland fire. Forest Ecology and Management 211, 97-108.
Genton MG, Butry DT, Gumpertz ML, Prestemon JP (2006) Spatio-temporal analysis of wildfire ignitions in the St Johns River Warer Management District, Florida. International Journal of Wildland Fire 15, 87–97.
Hessburg PF, Reynolds KM, Keane RE, Salter RB (2006) A multi-scale decision support system for evaluating wildland fire hazard and prioritizing treatments. In ‘Proceedings of the 5th International Conference on Forest Fire Research’. (Ed. DX Viegas) CD Rom 3 pp. (Figueira da Foz).
IGP (2004) Cartografia de risco de incêndio florestal. Relatório do distrito de Viseu. Centro para a Exploração e Gestão de Informação e Situações de Emergência, Technical Report (Lisboa). [In Portuguese]
Johnson EA, Miyanishi K (2001) Forest fires: behavior and ecological effects. Academic press, USA, 594 p.
Mendes A [et al.] (2004). The Portuguese Forests. Country level report delivered to the EFFE Project, Evaluating Financing of Forestry in Europe. Porto: Portuguese catholic university, Porto Regional Center, Faculty of Economics and Management.
Mercer DE, Prestemon, JP (2005) Comparing production function models for wildfire risk analysis in the wildland-urban interface. Forest Policy and Economics 7, 782-795.
Preisler HK, Brillinger DR, Burgan RE, Benoir JW (2004) Probability based models for estimation of wildfire risk. International Journal of Wildland Fire 13, 133–142.
5

Roloff GJ, Mealey SP, Clay C, Barry J, Yanish C, Neuenschwander L (2005) A process for modelling short and long-term risk in the southern Oregon Cascades. Forest Ecology and Management 211, 166-190.
Vasconcelos MJP, Silva S, Tomé M, Alvim M, Pereira JMC (2001) Spatial prediction of fire ignition probabilities: comparing logistic regression and neural networks. Photogrametric Engineering & Remote Sensing 67 (1): 73-81.
6

CAPÍTULO 2 - PUBLICAÇÕES Como foi referido, a presente dissertação é apresentada sob a forma de duas
publicações científicas, que constituem o conteúdo principal deste trabalho.
A primeira publicação, intitulada ‘Spatial distribution patterns of wildfire
ignitions in Portugal’, consiste na apresentação de alguns dados resultantes das
análises preliminares efectuadas no decorrer deste trabalho, e que foram
apresentados na 4ª Conferência Internacional sobre Incêndios Florestais, que
decorreu em Sevilha (Espanha) entre 13 e 17 de Maio de 20071.
A segunda publicação, intitulada ‘Modelling and mapping wildfire ignition risk in
Portugal’, consiste na apresentação dos resultados finais obtidos no âmbito deste
trabalho e que foram submetidos sob a forma de um artigo científico à revista
internacional ‘International Journal of Wildland Fire’ em Agosto de 20072.
1 Catry FX, Damasceno P, Silva JS, Galante M and Moreira F (2007) Spatial distribution patterns of wildfire ignitions in Portugal. In ‘Proceedings of the 4th
International Wildland Fire Conference’. CD Rom, 10 pp. (Seville) 2 Catry FX, Rego FC, Bação FL and Moreira F (Submetido). Modelling and mapping wildfire ignition risk in Portugal. International Journal of Wildland Fire.
7

Spatial Distribution Patterns of Wildfire Ignitions in Portugal1
Filipe X. Catry1, Pedro Damasceno2, Joaquim S. Silva1, Miguel Galante3 and Francisco
Moreira1
Abstract Burnt area in Portugal increased in the last decades, contrarily to other southern European countries. On the other hand, the number of wildfire ignitions is increasing in Portugal, Spain and Greece, but in Portugal its occurrence density is much higher. Since 2000 Portugal registered an average of about 28,500 fire ignitions every year, and this situation causes an important dispersion of detection and fire fighting resources, contributing to reduce their effectiveness. In order to evaluate the distribution of wildfire ignitions, we analyzed 127,492 fires detected in Portugal during the period 2001-2005 in relation to variables such as population density, proximity to urban areas and road network, land cover types, altitude, causes and final burnt area. Results showed that most part of fire ignitions are concentrated in the north and centre littoral areas, in the most populated municipalities, and were intentionally caused. Although municipalities with more than 100 persons per km2 only represents 21% of the territory, they concentrated more than 70% of fire ignitions occurring in Portugal, but only about 14% of total burnt area. We verified that 85% of fire ignitions occurred at less than 500 m from urban areas and 98% were within a distance of 2 km. Fire ignitions were also located very close to the main roads (70% at less than 500 m, and 98% at less than 2 km). Most ignitions were located in agricultural and social/urban areas (60% and 25%, respectively), and only 15% in forested or uncultivated areas (8.5% and 6.5%, respectively). We verified that about 80% of ignitions occurred at elevations below 500 meters, and that 85% of fire ignitions originated a burnt area lower than 1 ha, and only 0.3% of them originated large wildfires with 500 hectares or more. These results emphasise the crucial role of human distribution and activity in the spatial distribution of wildfire ignitions, and can be very useful in fire risk management and in prevention strategies implementation. Keywords: forest fires, wildfire ignitions, spatial distribution, fire risk, GIS, Portugal 1 Technical University of Lisbon, Institute of Agronomy, Centre of Applied Ecology (CEABN) - Tapada da Ajuda 1349-017 Lisboa Portugal, E-mail: [email protected]
2 University of Coimbra, Faculty of Sciences, Coimbra Portugal
3 Portuguese Forest Services (DGRF), Lisboa Portugal
8

Introduction Forest fires have been increasing in Portugal during last two decades and especially last years, being an agent of landscape changes, and important social, environmental and economic impacts. Contrarily to other southern Mediterranean European countries, where in last decades the average burnt area decreased (Spain, Italy and Greece) or stabilized (France), in Portugal the situation got worst (EC 2005, DGRF 2006). Between 1990 and 2005, about 2.3 million hectares burnt (DGRF 2006), representing about 25% of the country area, and in the recent years of 2003 and 2005 the burnt area reached the highest values since 1980 (750,932 ha). Since 2000 Portugal registered an average of about 28,500 fire ignitions per year (DGRF 2006). Statistics also shows that the number of wildfire ignitions is increasing in Portugal, Spain and Greece (EC 2005), but in Portugal its number per area unit is much higher, having proportionally more ignitions than the other southern European countries all together. Although the registration methods could differ from one country to another, the situation seems to be quite concerning. This increase of fire occurrences in the last decades is registered even if more resources are being allocated to prevention, vigilance and fire fighting, including management plans, public educational campaigns and the implementation of more restrictive legislation concerning human activities and wildfires. It is known that most fire ignitions in Portugal are associated to human causes. A recent official report from the Forest Services (DGRF 2006) shows that only 3% of the forest fires successfully investigated between 2000 and 2005 were naturally caused (lightings). It also reports that about 49% of the wildfires were intentionally caused, while 37% were due to negligence and 11% were accidentally caused. Although the high number of wildfire ignitions in Portugal constitutes a problem in terms of fire detection and fire fighting resources dispersion, few studies concentrated on this subject. The importance of knowing fire ignition characteristics is widely recognized (Vasconcelos and others 2001, Preisler and others 2004, Riva and others 2006, Robin and others 2006; Badia-Perpinyà. and Pallares-Barbera 2006). Fire ignition probability (or ignition risk) is often considered as an important factor, for example used in association with fire propagation risk to produce fire risk cartography (Johnson and Miyanishi 2001, Finney 2005, Roloff and others 2005, Hessburg and others 2006, Jappiot and others 2006). Nevertheless several fire risk maps and fire prevention plans only consider the fire propagation risk, but as it is known that there are no fires without ignitions, it should be given more attention to fire ignitions. The main objective of this work is to analyse the spatial patterns of wildfire ignition in Portugal, contributing to a better knowledge of their occurrence and consequently to improve fire risk management.
9

Methodology Study area The study area is constituted by the entire Portuguese mainland, which covers about 90,000 km2 in southern Europe (fig. 2). Most part of the country is included in the Mediterranean biogeographic region and there is a transition to the Atlantic region in the north. Mean annual temperatures range from about 18ºC in the south to 7ºC at more altitude in the north, and annual precipitation ranges from about 400 mm to 2,800 mm (IA 2003). In general topography is not very rough and the altitudes range from sea level to 2,000 m. About 48% of the country area is used for agriculture and 27% is covered by forests (DGF 2001). The population is estimated in about ten million inhabitants, more concentrated in the north and centre littoral areas (INE 2003).
Figure 1 — General location of the Portuguese mainland, with representation of its elevation. Data preparation Methodology used resulted from an interactive process in which different approaches were evaluated. Special emphasis was putted on territory characteristics related with human presence and activity. All spatial analysis and cartographic production were made using geographical information systems (GIS). In order to analyze the spatial distribution and characteristics of fire ignitions we prepared the following digital cartography in a GIS environment: a) Fire ignitions – we used the official database from the Forest Services, which contained the geographical coordinates and other characteristics (eg. start and end date, burnt area) of all fire ignitions detected in Portugal during a five years period (between 2001 and 2005), to create a vector map with the location of all occurrences (DGRF – database made available by Forest Services, by request); b) Land cover – we used the Corine Land Cover 2000 cartography in vector format, at scale 1:100,000 (IA 2005). The Portuguese cartography identifies 42 land cover classes which were grouped to five classes: 1) agricultural areas, 2) forests, 3) shrublands and natural grasslands, 4) urban and other artificialized areas, and 5) wetlands and water bodies; c) Population density map – this map was produced using a database which includes the number of persons present in each parish, from the National Statistic Institute concerning the 2001 National Inventory (INE 2003). This information was assigned to the official
10

municipality map to create the population density map (number of persons per km2); d) Distance to urban areas map – to produce this map, we extracted the urban areas from the Land Cover Map COS’90 (IGP 2005) and from Corine Land Cover 2000. The Land Cover Map COS’90 (scale 1:25,000) was used for almost all the Portuguese mainland (about 95%); for the few places where this map was not available we complemented the missing data with the Corine Land Cover 2000; although COS’90 is not as recent as desirable, we opted to use it because it doesn’t exist other detailed cartography at national level. Based on this map, we calculated the distance from each location of the national territory to the nearest urban area, producing the desired map (raster format with 100 m spatial resolution); e) Distance to roads map – to produce this map, we used the Itinerary Military Map from the Portuguese mainland, in vector format at scale 1:500,000 (IGEOE 2005). Based on this map we calculated the distance of each territory location to the nearest road and produced the desired map (raster format with 100 m spatial resolution); f) Elevation map – we used a free digital elevation model (DTM), in raster format and with 90 m spatial resolution (NASA and others 2004). This map was submitted to several operations, including georeferencing and correction of negative and no data values (by interpolation methods), in order to prepare it for spatial analysis; g) Portuguese administrative maps – we used a map which defines the official Portuguese administrative borders, as well as the parish limits, both in vector format (IGP 2004). The database with the wildfire ignitions detected in Portugal during the period 2001-2005 was prepared to the analysis, by removing all the records with incorrect data (eg. fires with incorrect coordinates, without date and hour of detection, with simultaneously coincident coordinates, date and hour, duplicated identification codes), and merging different records concerning the same fire (simultaneously updating respective dates and burnt areas). After these procedures, from an initial number of 137,204 ignition points, 127,492 remained in the database for analysis. Additionally an equal number of points (127,492) were randomly generated within the whole country (average density of 1.4 points per km2), representing the distribution we should expect if fire ignitions occurred in a random way, or non-ignition points to be used in a logistic regression analysis. Ignition and non-ignition points constituted the new fire ignition variable, coded in a numeric binary format (1 - presence of ignition; 0 - absence of ignition), and were overlayed with all the other variable maps in order to create a new database with the information from all layers. In order to analyse fire causes we used a sub-set of the global database with 4,587 ignitions investigated by the Portuguese Forest Services for which causes were successfully determined, and classified in three main categories: 1) intentional, 2) negligence/accidental, and 3) natural. Data analysis First we made a frequency analysis of all variables used to characterize the wildfire ignition population. Than a binary logistic regression (Hosmer and Lemeshow 1989) was used to determine separately the influence of each variable on fire ignition probability. The significance of each variable was tested through a univariate model, by using the likelihood-ratio χ2 statistic. Model performance was assessed through the likelihood ratio statistic and by calculating the area under the receiver operating characteristics (ROC) curve (Saveland and Neueschwander 1990, Pearce and Ferrier 2000). Land cover and fire cause were analysed as categorical variables and the others as continuous. All analyses were carried out using the SPSS software (SPSS 2004).
11

Results Most part of fire ignitions occurred during the period 2001-2005 were concentrated in the north and centre littoral areas (fig. 3), mainly in Porto, Braga, Lisboa and Aveiro districts.
Figure 3 — Fire ignitions distribution in Portugal (period 2001-2005). Using the univariate regression analysis, we verified that all the variables considered were highly significantly related to fire ignition occurrence (p<0.001). The most important variable affecting fire ignitions distribution was distance to urban areas. Land cover type ranked second, followed by distance to main roads and by population density. Correlation between variables (Pearson correlation coefficient) was relatively low, and the most correlated were distance to urban areas and distance to roads (r=0.59; p<0.001). Distance to urban areas and distance to main roads were negatively correlated with fire ignition probability, meaning a decreasing fire occurrence frequency at increasing distances to roads or urban areas (figs.4, 5). About 85% of fire ignitions occurred at less than 500 m from urban areas and 98% were within a distance of 2 km. Fire ignitions were also located very close to the main roads, with 70% at less than 500 m distance, and 98% at less than 2 km.
12

Figure 4 — Fire ignitions in relation to distance to artificial/urban areas. Left: Percentage of random points and fire ignitions observed in each class; Right: Fire ignition probability based on the univariate model (model performance evaluated by the area under the ROC curve - AUC).
Figure 5 — Fire ignitions in relation to distance to main roads network. Left: Percentage of random points and fire ignitions observed in each class; Right: Fire ignition probability based on the univariate model (model performance evaluated by the area under the ROC curve - AUC).
On the other hand population density variable was positively correlated with fire ignition probability (fig. 6). Although municipalities with more than 100 persons/km2 only represent 21% of the territory, they concentrated more than 70% of fire ignitions occurring in Portugal.
13

Figure 6 — Fire ignitions in relation to population density (persons/km2). Left: Percentage of random points and fire ignitions observed in each class; Right: Fire ignition probability based on the univariate model (model performance evaluated by the area under the ROC curve - AUC). Concerning fire ignitions distribution by land cover classes (fig. 7), about 60% were located in agricultural areas; within those ignitions, the majority occurred in heterogeneous agriculture (81%), annual crops (10%) and permanent crops (8%). About 25% of ignitions occurred in artificial/urban areas, which often includes a dense mosaic of mixed urban with other land covers, including mainly agriculture but it can also include some small fragments of woodlands and shrublands; in those areas (which only covers 2.7% of the country) the occurrence of fire ignitions were nine times larger than if ignitions occurred in a random way through the territory. On the other hand the forested areas, covering about 27% of the country, only registered 8.5% of fire ignitions, most of them in mixed and coniferous forests (80%). A similar situation was observed in uncultivated areas (including shrublands and natural grasslands) which cover about 19% of the land and registered 6.2% of ignitions.
Figure 7 — Fire ignitions in relation to land cover classes. Left: Percentage of random points and fire ignitions observed in each class; Right: Fire ignition probability based on the univariate model (model performance evaluated by the area under the ROC curve - AUC). It is important to notice that about 85% of fire ignitions originated a burnt area lower than 1 ha and 95% burnt less than 5 ha. In fact only 0,3% of ignitions analyzed originated large
14

wildfires which burnt 500 ha or more. Regarding topography, we verified that 80% of ignitions occurred at elevations below 500 m and 98% below 1000 m. The analysis of fire causes showed that 50% were intentionally ignited, 47% were due to negligence and only 3% had natural causes (lightings). Fire causes were not independent of land cover type (χ2=35.85; p<0.001); major differences were observed in forested areas, where the majority of fires (58%) were intentionally caused, while 37% were caused by negligence or accident. Concerning wildfires which burnt more than 500 ha (208 cases), we also verified that the majority (53%) were intentionally caused. Fires due to negligence and accidental causes were more frequent in the south of the country and in the interior areas of north and centre, while intentionally caused fires were more frequent in north and centre littoral areas. Conclusions Portugal has one of the highest fire occurrence densities in southern Europe. As in many countries fire ignitions are highly related with human presence and activity, in the present study we analyzed fire ignition occurrence in relation to some natural and anthropogenic variables, but giving special emphasis to the last ones. The high number of wildfire ignitions in Portugal constitutes a problem in terms of fire detection and fire fighting resources dispersion and consequently it is very important to know their characteristics and spatial distribution patterns to improve fire risk management. We concluded that fire ignition occurrence in Portugal is strongly correlated to variables such as proximity to urban areas, proximity to main roads, land cover, and population density. The ability to predict the locations with higher or lower ignition risk constitutes an important factor in order to improve and optimize prevention activities, as well as vigilance and fire fighting management. Results obtained can now be used in a multivariate model to predict fire ignition occurrence probability, and to produce a map of fire ignition risk for the entire Portuguese mainland. Acknowledgments
Part of this work was developed in the scope of the Fire Paradox project (contract no. FP6-018505), funded by the European Commission (6th Framework Program). We also acknowledge the Portuguese Forest Services (DGRF) for collaboration and for making available the official data concerning fire detections. Finally we acknowledge Francisco Rego, Fernando Bação, Susana Dias and Miguel Bugalho for their comments, and Paula Lopes, António Nunes and Vasco Nunes for their help on data processing and preliminary analysis.
15

16
References Badia-Perpinyà, A. and Pallares-Barbera, M. 2006. Spatial distribution of
ignitions in Mediterranean periurban and rural areas: the case of Catalonia. International Journal of Wildland Fire. 15: 187–196.
DGF 2001. Inventário florestal nacional. Portugal continental. 3ª Revisão, 1995-1998. Direcção-Geral das Florestas, Lisboa.
DGRF 2006. Incêndios florestais – Relatório de 2005. Divisão de Defesa da Floresta Contra Incêndios. Direcção-Geral dos Recursos Florestais, Lisboa.
EC 2005. Forest fires in Europe 2004. Official Publication of the European Commission, S.P.I.05.147 EN.
Finney, M.A. 2005. The challenge of quantitative risk analysis for wildland fire. Forest Ecology and Management. 211: 97-108.
Hessburg, P.F.; Reynolds, K.M.; Keane, R.E.; Salter, R.B. 2006. A multi-scale decision support system for evaluating wildland fire hazard and prioritizing treatments. In: Viegas, D.X. (Ed.); Proceedings of the 5th International Conference on Forest Fire Research. CD Rom (3 pp.). ADAI, Figueira da Foz.
Hosmer, D.W. and Lemeshow, S. 1989. Applied logistic regression. John Wiley and Sons, New York.
IA 2005. CORINE Land Cover 2000 Portugal. Institute for the Environment (IA).
IA 2003. Atlas do Ambiente Digital. Institute for the Environment (IA). Available at www.iambiente.pt/atlas/est/index.jsp [Verified 2 March 2007]
IGEOE 2005. Carta Militar Itinerária de Portugal. Instituto Geográfico do Exército. Available at www.igeoe.pt [Verified 2 March 2007]
IGP 2005. Carta de Ocupação do Solo COS’90. Instituto Geográfico Português. Available at www.igeo.pt/IGEO/portugues/Frameset-egeo.htm [Verified 2 March 2007]
IGP 2004. Carta administrativa oficial de Portugal. Instituto Geográfico Português. Available at www.igeo.pt/IGEO/portugues/Frameset-egeo.htm [Verified 2 March 2007]
INE 2003. Dados estatísticos da população em Portugal - Censos 2001. Instituto Nacional de Estatística.
Jappiot, M.; Lampin, C.; Curt, T.C.; Borgniet, L.; Chandioux, O. 2006. Fire risk ignition: the integrated model “AIOLI”. In: Viegas, D.X. (Ed.); Proceedings of the 5th International Conference on Forest Fire Research. CD Rom (9 pp.). ADAI, Figueira da Foz.
Johnson, E.A. and Miyanishi, K. 2001. Forest fires: behavior and ecological effects. Academic press, USA, 594 p.
NASA; NIMA; DLR; ASI 2004. Digital elevation model. National Aeronautics and Space Administration (NASA); National Imagery and Mapping Agency
17

(NIMA); German space agency (DLR); Italian space agency (ASI). Available at ftp://edcsgs9.cr.usgs.gov/pub/data/srtm [Verified 8 August 2006]
Preisler, H.K.; Brillinger, D.R.; Burgan, R.E.; Benoir, J.W. 2004. Probability based models for estimation of wildfire risk. International Journal of Wildland Fire. 13: 133–142.
Riva, J.; Pérez-Cabello, F.; Chuvieco, E. 2006. Wildland fire ignition danger spatial modelling using GIS and satellite data. Geophysical Research Abstracts. 8, 10321.
Robin, J.G.; Carrega, P.; Fox, D. 2006. Modelling fire ignition in the Alpes-Maritimes Depertment, France, A comparison. In: Viegas, D.X. (Ed.); Proceedings of the 5th International Conference on Forest Fire Research. CD Rom (12 pp.). ADAI, Figueira da Foz.
Roloff, G.J.; Mealey, S.P.; Clay, C.; Barry, J.; Yanish, C.; Neuenschwander, L. 2005. A process for modelling short and long-term risk in the southern Oregon Cascades. Forest Ecology and Management. 211: 166-190.
SPSS 2004. SPSS for Windows. SPSS Inc., Chicago.
Vasconcelos, M.J.P.; Silva, S.; Tomé, M.; Alvim, M.; Pereira, J.M.C. 2001. Spatial prediction of fire ignition probabilities: comparing logistic regression and neural networks. Photogrametric Engineering & Remote Sensing. 67 (1): 73-81.
18

Modelling and mapping wildfire ignition risk in Portugal Filipe X. CatryA,C, Francisco C. RegoA, Fernando L. BaçãoB and F. MoreiraA
A Centre of Applied Ecology ‘Prof. Baeta Neves’, Institute of Agronomy, Technical
University of Lisbon, Portugal. B Institute of Statistics and Information Management, New University of Lisbon,
Portugal. C Corresponding author. Email: [email protected]
Abstract. Portugal has the highest density of wildfire ignitions among southern European countries. The ability to predict fire ignition occurrence constitutes an important tool for managers, helping to define priorities among areas of equivalent fire propagation risk, and to improve the effectiveness of fire prevention and fire fighting resources allocation. In this study we analysed 127 490 fire ignitions which occurred in Portugal during a five years period. We used logistic regression models to predict the probability of wildfire ignition occurrence, using both human and environmental explanatory variables, and produced a fire ignition risk map for the Portuguese mainland. Results show that fire ignitions are strongly correlated with human presence and activity. In this paper we demonstrate that it is possible to predict the likelihood of fire ignition at the national level with satisfactory accuracy, which can be useful in decision making for fire risk management. Additional keywords: fire ignition risk; geographic information systems; logistic regression; forest fires. Introduction Fire risk is generally defined as ‘the chance of a fire starting as determined by the presence and activity of any causative agent (both man and lightning-caused)’ (FAO 1986), existing a general agreement on this definition amongst numerous international organizations (e.g. Hardy 2005; NWCG 2006). However other authors sustain that fire risk is the union of fire ignition and fire hazard (e.g. Chuvieco and Congalton 1989). In this paper we use the term fire ignition risk to refer to the probability of fire occurrence on the presence of external causes, both anthropogenic and natural.
Wildfires constitute a serious concern in many regions of the Mediterranean Basin, representing important social, environmental and economic impacts. Contrarily to other southern Mediterranean European countries, where in last decades the average burned area decreased (Spain, Italy and Greece) or stabilized (France), in Portugal the situation got worse (EC 2005; DGRF 2006). Between 1990 and 2005, about 2.3 million hectares burned, representing about 25% of the country area (DGRF 2006), and in 2003 and 2005 the burned area reached the highest values since 1980. Statistics also show that in Portugal the number of recorded fire ignitions increased extraordinarily in the last decades, and in the
19

period 2000-2005 the average density of ignitions was three times higher in Portugal than in Spain, France, Italy and Greece all together. Since 2000 Portugal registered an average of about 28 500 fire ignitions every year (DGRF 2006). The increasing number of fire ignitions occurs albeit more resources are being allocated to vigilance, fire fighting and prevention, including management plans, public educational campaigns and the implementation of more restrictive legislation concerning human activities susceptible to cause wildfires.
Although the high number of wildfire ignitions in Portugal can constitute a problem in terms of fire detection and fire fighting resources dispersion, very few studies have concentrated on trying to characterize and understand the factors behind fire ignition occurrence. The importance of knowing fire ignition characteristics is widely recognized (Cardille et al. 2001; Preisler et al. 2004; Mercer and Prestemon 2005; Badia-Perpinyà and Pallares-Barbera 2006; Genton et al. 2006), and fire ignition risk is considered an important factor to be integrated with fire propagation risk, to assess fire danger (Johnson and Miyanishi 2001; Vasconcelos et al. 2001; Chuvieco et al. 2003; Bonazountas et al. 2005; Finney 2005; Roloff et al. 2005; Hessburg et al. 2006). However, although it is known that no fires will occur without ignitions, several fire prevention plans only consider the fire propagation risk. The Portuguese official fire danger estimation systems and cartography being used concentrated efforts on the prediction of the overall fire risk probability (Carreiras and Pereira 2006; IGP 2004a) but little or no attention was given to specifically model and predict the risk of fire ignition. Thus, and until now, a national fire ignition risk map has not yet been produced.
In this work we aimed to evaluate the likelihood of fire ignition occurrence at the national level. With that purpose we used a database including a layer with the location of 127 490 fire events occurred in Portugal during a five years period and a set of layers corresponding to potentially explanatory variables. It is known that the majority of fire ignitions in Portugal are associated to human causes, similarly to other countries of southern Europe. A recent report from the Forest Services (DGRF 2006) shows that only 3% of the forest fires successfully investigated between 2000 and 2005 were naturally caused (lightning). With these facts in mind, special attention was given to the variables associated to territory characteristics related to human presence and activity. In this paper we present the analyses concerning the spatial patterns of wildfire ignition occurrence in Portugal, and the predictive models we developed using logistic regression. We also present the fire ignition risk map produced for the whole Portuguese mainland, and the results of accuracy evaluation. Thus we expect to contribute to a better knowledge of ignition occurrence and consequently to improve fire risk management effectiveness. Methods Study area The study area is constituted by the entire Portuguese mainland, which covers about 90 000 km2 in southern Europe (Fig. 1). Most part of the country is included in the Mediterranean biogeographic region and there is a transition to the Atlantic region in the north. Mean annual temperatures range from about 18ºC in the south
20
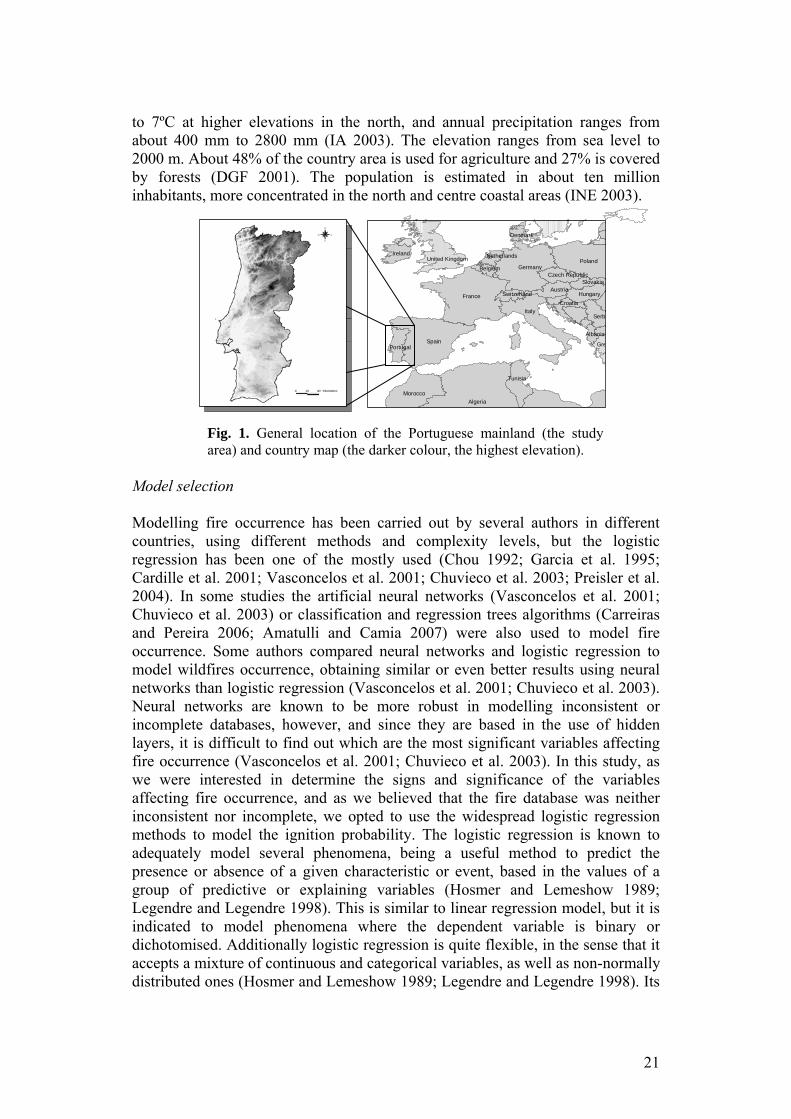
to 7ºC at higher elevations in the north, and annual precipitation ranges from about 400 mm to 2800 mm (IA 2003). The elevation ranges from sea level to 2000 m. About 48% of the country area is used for agriculture and 27% is covered by forests (DGF 2001). The population is estimated in about ten million inhabitants, more concentrated in the north and centre coastal areas (INE 2003).
Fig. 1. General location of the Portuguese mainland (the study area) and country map (the darker colour, the highest elevation).
Algeria
Spain
France
Italy
PolandGermany
Morocco
Tunisia
United Kingdom
Serb
Gre
Austria
Ireland
Hungary
Portugal
Croatia
SlovakiaCzech Republic
Belgium
Switzerland
Albania
Denmark
Netherlands
Model selection Modelling fire occurrence has been carried out by several authors in different countries, using different methods and complexity levels, but the logistic regression has been one of the mostly used (Chou 1992; Garcia et al. 1995; Cardille et al. 2001; Vasconcelos et al. 2001; Chuvieco et al. 2003; Preisler et al. 2004). In some studies the artificial neural networks (Vasconcelos et al. 2001; Chuvieco et al. 2003) or classification and regression trees algorithms (Carreiras and Pereira 2006; Amatulli and Camia 2007) were also used to model fire occurrence. Some authors compared neural networks and logistic regression to model wildfires occurrence, obtaining similar or even better results using neural networks than logistic regression (Vasconcelos et al. 2001; Chuvieco et al. 2003). Neural networks are known to be more robust in modelling inconsistent or incomplete databases, however, and since they are based in the use of hidden layers, it is difficult to find out which are the most significant variables affecting fire occurrence (Vasconcelos et al. 2001; Chuvieco et al. 2003). In this study, as we were interested in determine the signs and significance of the variables affecting fire occurrence, and as we believed that the fire database was neither inconsistent nor incomplete, we opted to use the widespread logistic regression methods to model the ignition probability. The logistic regression is known to adequately model several phenomena, being a useful method to predict the presence or absence of a given characteristic or event, based in the values of a group of predictive or explaining variables (Hosmer and Lemeshow 1989; Legendre and Legendre 1998). This is similar to linear regression model, but it is indicated to model phenomena where the dependent variable is binary or dichotomised. Additionally logistic regression is quite flexible, in the sense that it accepts a mixture of continuous and categorical variables, as well as non-normally distributed ones (Hosmer and Lemeshow 1989; Legendre and Legendre 1998). Its
21

analysis is based on the following function: P(z) = 1/(1+e-z), where P is the probability of occurrence of the event, and z is obtained from a linear combination of the independent variables estimated from a maximum likelihood fitting: z = b0 + b1x1 + b2x2 + … + bnxn, where b0 is the constant and βn is the weighing factor of the variable Xn. Z values can be interpreted as a function of the probability of occurrence, and P(z) converts z values in a continuous function (probability) that ranges from 0 to 1. Fire ignition database The dependent variable used in our analysis was the presence or absence of wildfire ignitions. For the presences we used the official wildfire database from the Portuguese Forest Services (DGRF), which contained the geographical coordinates and other characteristics (e.g. fire code, start and end date) of all fires that occurred in Portugal between 2001 and 2005. This database was then corrected, avoiding duplications, and removing all the records with inconsistent data, which included ignitions with erroneous coordinates or with missing date and hour of detection. After these procedures, from an initial number of 137 204 ignition points, 127 490 remained in the database for analysis. As we also needed to account for non-ignition locations in order to model ignition risk, 191 235 points (50% more than the ignition points) were randomly generated within the whole country, and were considered as non-ignition points. Ignition and non-ignition points were coded in a numeric binary format (1-presence, 0-absence), constituting the fire ignition dependent variable.
Because the validation of logistic models require the quantification of their predictive ability and an assessment of their predictive ability in independent datasets, as evaluation of model performance based on training datasets will be probably made in an optimistic manner (Hosmer and Lemeshow 1989), we prepared two separate datasets. From the fire ignition database we randomly selected 63 745 ignitions (50%) and 127 490 non-ignition points to build the model, constituting the training subset; we opted to use two times more non-ignition points (average density 1.5 point/km2), to better represent the spatial heterogeneity of the country, as it is expected that its variability is larger than that found in the ignition sample. For testing both the model and the map produced we reserved the remaining fire ignitions and an equal number of non-ignition points, constituting the validation subset. Geographic constraints The majority of fire ignition coordinates in Portugal are associated to the nearest toponymic location, meaning that they do not have totally accurate coordinates, which is a relatively common problem also in other countries (e.g. Amatulli et al. 2007). In order to have an idea of the geographic inaccuracies associated with this location method, we evaluated the toponymic places at national level and verified that 96% are at less than 1000 m from each other, thus we can estimate that 96% of fire ignitions would have a maximum error of 500 m, if they occurred
22
randomly in the territory. However the real errors in the fire database are probably considerably lower, because the majority of ignitions occur in areas where the toponymic density is higher. In fact, considering the seven districts with more fire ignitions (concentrating 77% of all occurrences), we can estimate that 80% of them would have a maximum error of about 250 m and 99% would have a maximum error of 500 m. These location uncertainties influenced some subsequent decisions concerning the spatial resolution of cartographic layers. Cartographic information
Previous works in different regions identified several environmental and human factors as significant predictors of wildfire ignition occurrence (Langhart et al. 1998; Cardille et al. 2001; Vasconcelos et al. 2001; Mercer and Prestemon 2005; Nunes and Duarte 2006; Badia-Perpinyà and Pallares-Barbera 2006; Robin et al. 2006; Catry et al. 2007a). Based on this knowledge and on the fact that 97% of all fire ignitions in Portugal are human-caused (DGRF 2006), we concentrated our analysis on factors related to the human presence and activity, selecting a group of independent variables potentially associated with fire ignitions occurrence and that were available for the study, namely: population density, distance to roads, land cover type and elevation.
All the spatial analysis and cartographic production were made using geographic information systems (GIS), mainly ArcGIS (ESRI 2005), and using the following cartographic parameters: Projection System - Transverse Mercator, Hayford Internacional Ellipsoid, Lisbon Datum. Because of the mentioned ignition location uncertainties, and in order to reduce their potential influence on the analysis, the base raster maps were produced with 250 meters spatial resolution. Next we describe the base cartography used and the pre-processing steps performed to obtain the explanatory variable maps.
a) Population density – this map was obtained using a database from the National Statistics Institute concerning the 2001 Census (INE 2003), which included the number of persons present in each parish. This information was assigned to the official parish map (IGP 2004b; vector format) and the population density (number of persons per km2) was calculated for each of the 4050 parishes in the country mainland.
b) Land cover – we used the Corine Land Cover 2000 cartography at scale 1:100 000 (IA 2005; vector format). The Portuguese cartography identifies 42 land cover classes which were grouped into six major classes according to their main characteristics: 1) agricultural areas, 2) forests, 3) shrublands and natural grasslands, 4) urban and other artificialized areas, 5) sparsely vegetated areas, and 6) wetlands and water bodies. In this study we will refer to class 4 as wildland–urban interface areas, which corresponds mainly to areas where urban structures are interspersed with other land uses. This designation seemed to be more appropriate because continuous urban fabric represents less than 6% of the total area of this class.
c) Distance to roads – this map was obtained using the Portuguese Itinerary Military Map in vector format at scale 1:500 000 (IGEOE 2005), representing the main national and regional roads. Distance (in meters) from each location of the territory to the nearest road was calculated, producing a raster map with 100 m
23

spatial resolution that was resampled to 250 m using the bilinear interpolation method (ESRI 2005).
d) Elevation – we used a digital elevation model (m) in raster format and with 90 m spatial resolution (NASA et al. 2004). This map was submitted to several operations, including projection transformation to be consistent with other data layers, and correction of negative and no data values. Finally the map was also resampled to 250 m using the bilinear interpolation method. Fire ignition characterization and modelling
The fire ignition database, including both fire ignitions and non-ignitions, was transformed into a vector point map and overlayed with all the other maps in order to gather all the information in a single database, where each, presence-absence, record contained the information of all the other layers.
In a first step we performed a frequency analysis to characterize the occurrence of all wildfire ignitions in relation to some spatial characteristics. For that purpose continuous variables were classified in intervals, and expected vs. observed frequencies were registered and compared. Observed frequencies were the number of fire ignitions that occurred in the five years period in each class interval, and the expected frequencies were derived from the area of each class in the whole country, assuming they occurred randomly. Comparisons between observed and expected frequencies were based on chi-square statistics (Sokal and Rohlg 1987), using a significance level of 0.001. The same method was used by other authors (Badia-Perpinyà and Pallares-Barbera 2006) to analyse similar spatial information.
In a second step, using the training dataset, we developed logistic models to predict the spatial distribution of fire ignitions. Continuous variables were much skewed, thus they were log (x+1) transformed to approach normality and reduce variance. As models with transformed variables systematically showed a better fit to the data, they were retained, replacing the original variables. Additionally, the correlation between variables was analysed using the Pearson correlation coefficient. The most correlated pairs of variables were distance to roads and population density (r=-0.328; P<0.01), and population density and elevation (r=-0.315; P<0.01), thus all the variables were used as candidates for model selection. For the multivariate logistic regression the independent variables were selected using forward stepwise selection (forward likelihood-ratio). All analyses were carried out using SPSS software (SPSS 2006). Production of the fire ignition risk map In order to spatialize the model obtained in the multivariate logistic analysis, we had to prepare all the cartographic layers using GIS techniques. All the maps needed to be in raster format and co-registered in a common base 250 m cell size. The maps in vector format (population density and land cover) were directly converted to the raster format, while distance to roads and elevation maps were previously resampled using a bilinear interpolation technique. Following these steps the model equation was spatialized through map algebra operations in a GIS environment, in order to obtain the fire ignition risk map. The map produced was
24

classified into six risk classes, representing the different probabilities of wildfire ignition: extremely low (0-10%), very low (10-20%), low (20-40%), medium (40-60%), high (60-80%) and very high (80-100%). Evaluation of model and ignition risk map performance The assessment of the models performance and adjustment was done by means of different standard approaches for logistic regression. First, signs of estimated parameters were checked to make sure they agreed with theoretical expectations based on previous knowledge of fire occurrence. The significance of each single variable was evaluated using the Wald test (Legendre and Legendre 1998), considering that the parameter was useful to the model if the significant level was lower than 0.001. The overall significance of the models was assessed through the Hosmer and Lemeshow goodness-of-fit test which is a measure of how well the model performs (Hosmer and Lemeshow 1989; SPSS 2006). If the significance of the test is small (i.e., less than 0.05) then the model does not adequately fit the data (Norusis 2002; SPSS 2006).
Quantification of the model predictive ability was also done by comparing observed with predicted probability of ignition, both in the training and in the validation datasets. A confusion matrix (Congalton 1991) was used to assess the model classification accuracy, as a 2x2 classification table of observed vs. predicted values. For this purpose we had to establish some probability at which to accept the occurrence of a fire ignition. Cut-off points are used to convert probability of ignition to dichotomous 0-1 data, where cells with values below the cut-off are considered as non-ignition sites, while all above become predicted as ignition sites. Although in some cases a value of 0.5 is used, this threshold can be modified (Garcia et al. 1995; Vasconcelos et al. 2001; Chuvieco et al. 2003). The training data set was used to construct classification tables for different cut-off points, helping defining an optimal value. Two statistics were computed for each cut-off point considered: sensitivity and specificity. Sensitivity is the proportion of true positives that are predicted as events and specificity is the proportion of true negatives that are predicted as non-events. The optimal cut-off point corresponds to the value where both sensitivity and specificity reach the same proportion, which in our case was 0.34. This method was also used by other authors (e.g. Vasconcelos et al. 2001; Garcia et al. 1995). The selection of the threshold can also be made according to the average value of occurrence (Chuvieco et al. 2003), which in our case was 0.33. In this study we decided to consider a probability value of 0.34 to accept the presence-absence of a fire ignition.
Another procedure used to evaluate how well a model is parameterized and calibrated in presence-absence models is the ROC analysis - receiver operating characteristic (Swets 1988; Pearce and Ferrier 2000; SPSS 2006). For example in ecology and medicine, the ROC method has had some application because of assumed advantages in assessing model performance in a threshold-independent fashion, being independent of prevalence (e.g. Manel et al. 2001). The curve is obtained by plotting sensitivity vs. specificity for varying probability thresholds. Good model performance is characterized by a curve that maximizes sensitivity for low values of specificity (i.e. large areas under the curve; AUC). Usually AUC
25

values of 0.5-0.7 are taken to indicate low accuracy, values of 0.7-0.9 indicate useful applications and values above 0.9 indicate high accuracy (Swets 1988).
The produced fire ignition risk map was also evaluated, to assess its ability to predict the fire ignitions occurrence. This was also made through a confusion matrix using the validation data set constituted by 63 745 known ignition points, and with an equal number of non-ignition points, in order to evaluate the effect of model spatialization. Additionally, for each ignition point we recorded the respective probability value present in the map, and analysed the results by comparing the percentage of area covered by each risk class in the whole country with the percentage of fire ignitions occurred at each one. Ignition density in each risk class was also evaluated using all the fire ignition points. At a final step, a regression equation was developed to predict average density of fire ignitions from the original explanatory variables. Results Frequencies of fire ignitions The Portuguese mainland can be roughly divided into two south-north regions, separated by the Tagus River. The southern region, representing 58% of the territory, only registered 5.2% of the total number of fire ignitions, while the northern region concentrated the remaining 94.8%. Most part of ignitions occurred in the north and centre coastal areas, mainly in Porto (21.8%), Braga (14.6%), Lisboa (9.3%) and Aveiro (9.2%) districts.
During the period analysed, the year of 2005 was the one that registered the highest number of ignitions (27.2%) followed by 2001 (20.5%), 2002 (20.0%), 2004 (16.3%) and 2003 (16.1%). The majority of fire ignitions occurred between June and September (76.2% of the total), which is the fire season in Portugal. The months with fewer occurrences were November, December and January with only 4.1% of the total. The number of ignitions varied substantially during the day, with a maximum in the afternoon, between 14 and 17h, and a minimum early in the morning, from 4 to 8h, following the pattern of human activity.
A preliminary analysis of fire ignitions spatial distribution in relation to the selected variables showed that about 98% of fire ignitions occurred at less than 2 km from the nearest road, and regarding elevation, 98% of ignitions occurred below 1000 m. The analysis of fire ignitions distribution by land cover classes shown that about 60% were located in agricultural areas. About 25% of ignitions occurred in the wildland–urban interface, which often includes a dense mosaic of mixed urban with agriculture or other land cover types. Forested areas, registered 8.5% of fire ignitions, most of them in mixed and coniferous forests (80%), and uncultivated areas (including shrublands and natural grasslands) registered 6.2% of ignitions. Concerning population density, although municipalities with more than 100 persons/km2 only represent 21% of the territory they registered 70% of all ignitions observed.
Comparisons between observed and expected frequencies of fire ignitions in relation to the selected variables are presented in Fig. 2. We used a homogeneity test to evaluate the differences between observed and expected frequencies, and confirmed the existence of significant differences in their spatial distribution in
26
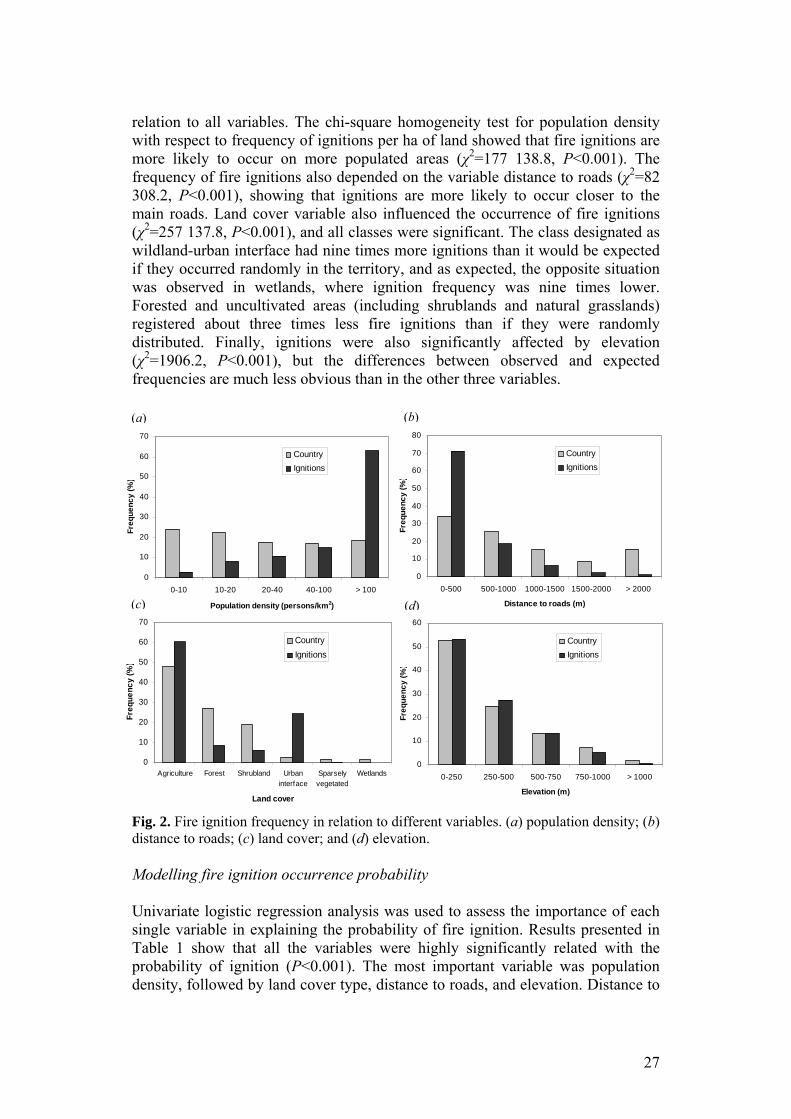
relation to all variables. The chi-square homogeneity test for population density with respect to frequency of ignitions per ha of land showed that fire ignitions are more likely to occur on more populated areas (χ2=177 138.8, P<0.001). The frequency of fire ignitions also depended on the variable distance to roads (χ2=82 308.2, P<0.001), showing that ignitions are more likely to occur closer to the main roads. Land cover variable also influenced the occurrence of fire ignitions (χ2=257 137.8, P<0.001), and all classes were significant. The class designated as wildland-urban interface had nine times more ignitions than it would be expected if they occurred randomly in the territory, and as expected, the opposite situation was observed in wetlands, where ignition frequency was nine times lower. Forested and uncultivated areas (including shrublands and natural grasslands) registered about three times less fire ignitions than if they were randomly distributed. Finally, ignitions were also significantly affected by elevation (χ2=1906.2, P<0.001), but the differences between observed and expected frequencies are much less obvious than in the other three variables.
0
10
20
30
40
50
60
70
80
0-500 500-1000 1000-1500 1500-2000 > 2000
Distance to roads (m)
%)
ncy
(qu
eFr
e
CountryIgnitions
0
10
20
30
40
50
60
70
0-10 10-20 20-40 40-100 > 100
Population density (persons/km2)
Freq
uenc
y (%
)
CountryIgnitions
0
10
20
30
40
50
60
0-250 250-500 500-750 750-1000 > 1000
Elevation (m)
%)
y (
uenc
Freq
CountryIgnitions
0
10
20
30
40
50
60
70
Agriculture Forest Shrubland Urbaninterface
Sparselyvegetated
Wetlands
Land cover
Freq
uenc
y (%
)
CountryIgnitions
(a) (b)
(c) (d)
Fig. 2. Fire ignition frequency in relation to different variables. (a) population density; (b) distance to roads; (c) land cover; and (d) elevation.
Modelling fire ignition occurrence probability Univariate logistic regression analysis was used to assess the importance of each single variable in explaining the probability of fire ignition. Results presented in Table 1 show that all the variables were highly significantly related with the probability of ignition (P<0.001). The most important variable was population density, followed by land cover type, distance to roads, and elevation. Distance to
27

roads was negatively correlated with fire ignition probability, meaning an increasing fire occurrence frequency at decreasing distances to roads. Elevation was also negatively correlated with ignition occurrence. On contrary population density variable was positively correlated with fire ignition probability, as expected. The most important effects regarding land cover types were observed in wildland-urban interface (χ2=1522.30), followed by agriculture (χ2=363.05), shrublands (χ2=31.45), forests (χ2=22.82), and sparsely vegetated areas (χ2=7.52), and were all significant (P<0.001). Models performance was evaluated trough the area under the curve (AUC) of the ROC, showing in general reasonable adjustments, except for the elevation variable.
Table 1. Results of the univariate logistic regression model Variables are ordered by decreasing importance in terms of their effect on fire ignition occurrence. For each variable, the coefficient value, the standard error (SE), the Wald’s
test, and the area under the ROC curve (AUC) are shown (cat= categorical variable)
Variable Coefficient SE Wald χ2 d.f. P-value AUC Population density 0.805 0.004 36 652.78 1 <0.001 0.805 Land cover type cat 26 108.97 5 <0.001 0.720 Distance to roads -0.270 0.002 23 414.80 1 <0.001 0.743 Elevation -0.039 0.005 72.72 1 <0.001 0.519
Following this analysis, a multivariate logistic regression model was performed using all the selected variables. Results presented in Table 2 show that in this model the most influential variable explaining fire ignition occurrence was population density, followed by land cover type, elevation, and distance to roads. The estimated coefficient signs were as expected. The Hosmer and Lemeshow goodness-of-fit test showed adequate fit of the model to the data (χ2=78 900.37, P<0.001). The area under the curve (AUC) for this model was 0.869, and its global accuracy was 79.8% (using the training data set), both of which indicate good model adjustment. Table 2. Results of multivariate logistic regression model using 4 variables
Variables are ordered by decreasing importance. Full model goodness-of-fit statistic=1891.06 (d.f.=8, P<0.001); AUC=0.869±0.001 (P<0.001)
Variables Coefficient SE Wald χ2 d.f. P-value Population density 0.821 0.005 24 297.11 1 <0.001 Land cover 9701.60 5 <0.001
Urban interface 1.559 0.108 207.78 1 <0.001 Agriculture 0.773 0.106 52.67 1 <0.001 Forest -0.526 0.108 23.97 1 <0.001 Shrublands -0.462 0.108 18.24 1 <0.001 Sparsely vegetated -0.478 0.125 14.70 1 <0.001
Elevation 0.590 0.007 7105.77 1 <0.001 Distance to roads -0.166 0.002 5932.85 1 <0.001 Constant -6.964 0.114 3719.37 1 <0.001
28

The model obtained is represented by the following equation:
P1 = 1 / [1 + e - (-6.964 + 0.821 Pop_D - 0.166 D_roads + 0.590 Elev + 1.559 Urb + 0.773 Agr - 0.526 For -
0.462 Shr - 0.478 Spa)], where P1 is the probability that a fire ignition occurs, Pop_D is the population
density (persons/km2), D_Roads is the distance to the nearest road (m), Elev is the altitude (m), Urb is the land cover class representing wildland–urban interface, Agr represents agriculture, For represents forest, Shr represents shrublands, and Spa represents sparsely vegetated areas (all variables but land cover are log (x+1) transformed).
Model performance was also evaluated using the validation dataset. In Table 3 we present the results of a confusion matrix used to assess the global model accuracy. This model correctly classified 79.8% of all observations. 79.7% of observed fire ignitions were correctly predicted by the model, and 80.0% of no ignitions were also well classified. As it can be seen, the omission and commission errors for both ignitions and non-ignition are not very high. Omission error of ignition events (20.3%) represents the percentage of observed ignitions that were not predicted by this model, and the commission error (20.0%) represents the percentage of expected ignitions that were not observed. The comparison between the model accuracy obtained with the training and the validation datasets revealed insignificant differences (79.8% vs. 79.9%). The area under the curve (AUC) using the validation dataset was 87.2% (SE=±0.001, P<0.001).
Table 3. Confusion matrix presenting the predicted and observed ignition occurrence in the model using four variables
Based on 63 745 observed fire ignitions reserved to the validation phase, and on equal number of non-ignitions (cut-off-point=0.34)
Observed Ignition No Ignition Total User’s
Accuracy Commission
Error Ignition 50 785 12 729 63 514 80.0% 20.0% No Ignition 12 960 51 016 63 976 79.7% 20.3% Predicted Total 63 745 63 745 127 490
Producer’s Accuracy 79.7% 80.0% Omission Error 20.3% 20.0% Global
Accuracy 79.9%
In a subsequent step we also evaluated the possibility of developing a simpler model to predict the fire ignition occurrence, as it would allow an easier use by managers. Additionally, it is generally recognized that a model with fewer variables should be probably more stable and easily generalized, and that more variables are included in the model, higher will be the estimated standard errors and higher will be the model dependence on the observed data (Hosmer and Lemeshow 1989). Thus, a new logistic model was developed without using the land cover variable, which is more likely to change through time than the others.
The performance of the multivariate model using only three variables was not
29

much different from the model using four variables (Table 4). The simplest model presented a global accuracy of 77.1% with both the training and the validation datasets (cut-of-point=0.34). The omission error of ignition events was 23.2% and the commission error was 22.7%. The area under the curve (AUC) was 0.847 (SE=±0.001, P<0.001) with the training dataset, and 0.849 (SE=±0.001, P<0.001) with the validation dataset.
Table 4. Results of multivariate logistic regression model using three variables
Variables are ordered by decreasing importance. Full model goodness-of-fit statistic = 1688.19 (d.f.=8, P<0.001); AUC=0.847±0.001 (P<0.001)
Variable Coefficient SE Wald χ2 d.f. P-value Population density 0.875 0.005 30 968.93 1 <0.001 Distance to roads -0.214 0.002 11 072.16 1 <0.001 Elevation 0.473 0.006 5492.23 1 <0.001 Constant -5.890 0.049 14 552.78 1 <0.001
The new model obtained is represented by the following equation:
P2 = 1 / [1 + e - (-5.890 + 0.875 Pop_D - 0.214 D_roads + 0.473 Elev)]. We also evaluated model stability, by comparing the coefficient values and
the model performance for each single year and for the five years period. As it can be observed in Fig. 3, there were little differences between the coefficient values of annual and global models. The model performances were also quite stable, with the AUC varying between 0.832 and 0.855 in annual models (0.847 in global model). The same constancy was observed in the model using four variables.
Fig. 3. Coefficient values of the variables (population density, elevation, and distance to roads) obtained in each annual model and in the global model (all years).
30
Fire ignition risk map
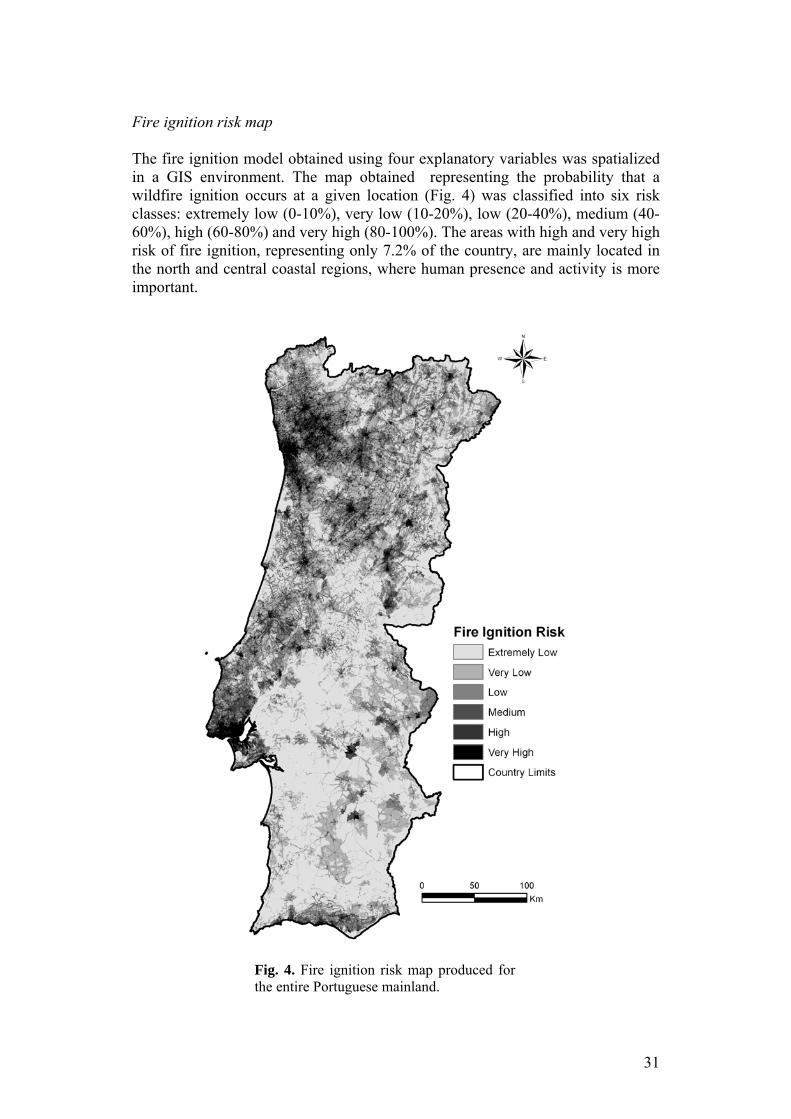
The fire ignition model obtained using four explanatory variables was spatialized in a GIS environment. The map obtained representing the probability that a wildfire ignition occurs at a given location (Fig. 4) was classified into six risk classes: extremely low (0-10%), very low (10-20%), low (20-40%), medium (40-60%), high (60-80%) and very high (80-100%). The areas with high and very high risk of fire ignition, representing only 7.2% of the country, are mainly located in the north and central coastal regions, where human presence and activity is more important.
Fig. 4. Fire ignition risk map produced for the entire Portuguese mainland.
31

We evaluated the performance of the fire ignition risk map using a confusion
matrix, as we did previously for the model evaluation. The map produced also showed good predictive results, with a global accuracy of 79.1%, and an omission error of about 22%. With the objective of describing the map prediction ability in a more detailed way, we overlayed the validation ignition points with the map, recording the exact fire risk class where the ignitions were located. In Table 5 it can be seen that more than 50% of ignitions were located in high and very high risk classes, although they only represent 7% of the country area (i.e. ignitions occurred at these classes in a much higher frequency than it would be expected in a random distribution). On the other hand only 10% of the ignitions were located in the two lowest risk classes, which cover more than 65% of the country area. Average ignition density in each risk class (ignitions/100 km2/year) is also shown in Table 5 giving managers a better idea on the potential number of fire ignition they can expect. In one year period, the ignition density is expected to be about 139 times higher in the areas with very high risk, than in areas with extremely low risk (covering 42% of the country), and 4 times higher than in areas with medium ignition risk.
Table 5. Evaluation of the ignition risk map classification, based on the representativeness of each class in the whole country and on fire ignitions from the
validation set Ignition density shows the average number of ignitions per 100 km2 and per year
occurred at each risk class
Fire ignition risk classes
Area in the country (%)
Ignitions observed (%)
Average density (ignitions/100
km2/year) Extremely Low (0-10%) 42.2 3.2 1 Very Low (10-20%) 23.0 6.9 4 Low (20-40%) 18.9 17.6 13 Medium (40-60%) 8.8 22.0 36 High (60-80%) 4.6 24.7 78 Very High (80-100%) 2.6 25.6 139
There is a strong relationship between fire ignition risk (P) and the average
density of ignition (D). This relationship can be shown graphically and expressed numerically (Fig.5).
32

D = 166.52 P 2
R2 = 0.996
0
20
40
60
80
100
120
140
160
0 20 40 60 80 100
Ignition risk (%)
Igni
tion
Den
sity
(ign
itions
/100
km2 /y
ear)
Fig. 5. Density of ignitions (D) as an average for 2001-2005, as a function of P1, as computed before.
The combination of the model developed for P1 and the relationship between
P1 and D, allows for a general comprehensive final equation that predicts the average density of ignitions directly from the explanatory variables as:
D = 166.52 / [1 + e - (-6.964 + 0.821 Pop_D - 0.166 D_roads + 0.590 Elev + 1.559 Urb + 0.773 Agr - 0.526
For - 0.462 Shr - 0.478 Spa)]2.
Discussion
Modelling fire ignition occurrence
Results of this study show that human presence and activity is the key driver of wildfire ignitions in Portugal. The selected explanatory variables, namely population density, distance to roads, land use and elevation, were all highly significantly related with ignition occurrence probability. These variables, or others closely related to them, were also found to be significant in several studies about wildfire spatial occurrence (Chou 1992; Cardille et al. 2001; Vasconcelos et al. 2001; Mercer and Prestemon 2005; Nunes and Duarte 2006; Badia-Perpinyà and Pallares-Barbera 2006; Robin et al. 2006)
The model obtained using four variables showed satisfactory predictive results, with a global accuracy of 79.9% when applied to the validation dataset. This model achieved acceptable classification error rates for given cut-off-points. The percentage of fire ignitions not predicted by the model (omission error) was not very high (20.3%), neither the percentage of fire ignitions not predicted by the model (commission error) which was 20.0%. Omission errors of the event being modelled are frequently considered as the most important type of errors (e.g. Chuvieco et al. 2003). The decision about the cut-off-point for accepting the presence-absence of a fire ignition is arbitrary, and ultimately depends on the objectives of the user (Garcia et al. 1995). A decision about the best probability level involves a compromise between predicting correctly both true and false fire
33

ignitions. As the objective in this study was to obtain similar accuracy in predicting both true and false fire ignitions, we used a cut-off-point of 0.34.
Although this model was developed at national level, and thus with large human and natural variability, the results were quite good when compared with other models developed to predict the fire occurrence. For example Vasconcelos et al. (2001) modelled the spatial occurrence of fire ignitions in five Portuguese municipalities (~1.6% of the country area), obtaining a global accuracy of 73.9% using logistic regression, and 77.0% using artificial neural networks (omission errors for ignitions were respectively 22.1% and 24.3%, while commission errors were respectively 48.6% and 44.0%). Chuvieco et al. (1998; 2003) developed models to predict the occurrence of large fires in southern Europe, obtaining a global accuracy of 60.0% using a logistic regression model, and 69.2% using neural networks (omission errors for observed fires were respectively 37.5% and 30.0%, and commission errors were 51.7% and 41.4%). In another study Garcia et al. (1995) also used logistic regression to predict the daily occurrence of fires in the Whitecourt Forest of Alberta (Canada), obtaining a global accuracy of 74.1%; these authors obtained an omission error of 25.9% for fire-days and a very high commission error (95.1%). Although only the first of the referred models is completely comparable with the one developed in the present work, they can give an idea of the accuracy levels achieved in modelling fire occurrence.
As it is generally recognized that a model with fewer variables should be probably more stable and easily generalized, a simpler model was developed using only three variables. In this model the variable land cover was not included, as it is more complex to compute, and because this variable is expected to suffer more changes in short to medium term. As expected its accuracy (77.1%) was lower than in the more complex model (79.9%), but the differences concerning both global accuracy and omission or commission errors were not sufficiently important to discourage its use as an alternative solution. Additionally it was confirmed that annual and inter-annual models had very similar performance, which seems to indicate that little spatial variability is to be expected in a five years period, and that models developed using information from one or more years are expected to achieve similar results.
The variable elevation showed a negative influence with ignition occurrence when considered alone, and a positive influence in the presence of the other explanatory variables. We think that this contradictory effect can be due to the fact that the majority of most populated areas, where more ignitions occur, are located at lower altitudes, thus causing the negative influence. However, when the other variables are included in the model, this influence changes because for equivalent population density and distance to roads, there are several human activities at higher elevation such as agriculture and pastoralism which are known to cause frequent burns (to clean the fields and renovate the pastures). Additionally some authors showed that lightning-caused ignitions are more likely to occur at higher elevations (Vazquez and Moreno 1998; Kilinc and Beringer 2007).
The final equation exposing D as a function of the explanatory variables has two different components: a geographical/land use component expressed by P1, which should remain relatively constant throughout the years, and a coefficient, representing the maximum local density of ignitions, estimated in 166.52
34

ignitions/100 km2/year for the period 2001-2005, but that varies yearly in accordance with varying weather and social behaviour.
Data application
It is important to notice that some technical difficulties arise when analysing
and processing databases at national level, due to software and hardware limitations, or because relevant information may not be available for all regions. However, in this work we demonstrated the feasibility of modelling and mapping fire ignition risk using logistic regression, GIS techniques and a limited number of easily available variables.
We consider that both the model developed and the fire ignition risk map produced, have enough predictive accuracy to be used in predicting the likelihood of fire ignition occurrence at the national level. Nowadays many fire management decisions are still exclusively based on the risk of fire propagation. However, and as resources are limited, it is important to define priorities among areas of equivalent propagation risk. Under similar vegetation, topographic or weather conditions, the areas with higher fire ignition risk should be given priority for surveillance (Vasconcelos et al. 2001; Chuvieco et al. 2003). Fire ignition risk maps can thus be used to integrate fire danger estimation systems, complementing the information from fire propagation risk cartography, helping managers to define vigilance priority areas for ground patrol units, or in defining priority locations for new lookout towers installation (Catry et al. 2004; Rego and Catry 2006; Catry et al. 2007b). The results obtained can also be used for more informed decisions of fire fighting resources allocation, or to optimize fire prevention public campaigns, by indicating the most problematic areas.
When using the model or the map produced some considerations must be kept in mind:
1) Special attention should be given to large forested areas with high or very high risk, where ignitions can easily occur and originate large forest fires. However, areas with low or medium ignition risk can also be very susceptible to wildfires because of high biomass accumulation. Previous analysis (e.g. Rego et al. 2004) showed that the areas of the country with the highest density of ignitions do not coincide with those where larger fires occur. The increasing human migratory fluxes from inland to coastal areas led to a situation of land abandonment, contributing to reduce the risk of wildfire ignitions in many inland regions. However, this situation simultaneously enhanced fuel accumulation and consequently improved the risk of fire propagation. At the same time many of these areas have a low population density and are more distant from roads, being less accessible to fire fighters. Thus, these areas should be analysed in fire planning and surveillance operations by simultaneously evaluating the risk of fire propagation.
2) Because of the positive influence of population density on fire ignition risk, it can be seen that the areas corresponding to the centre of the larger cities (namely Lisboa and Porto), have been classified with a high risk of fire ignition, although we know that in fact very few ignitions occur in these highly urbanized areas because they almost do not have fuels to ignite. However, this kind of problem will be obviously eliminated if the fire ignition map is to be used in
35

association with a fire propagation risk map. 3) To use the information presented at the regional level, some verification
should be done to assure that predictions fit adequately to the specificities of the area being analysed. Some model adjustments, including updated and more detailed data or inclusion of other variables can be required to improve the accuracy of predictions. Variables could include for example summer population density in regions where tourism highly increases the population during the fire season, as it happens in Algarve (southern Portugal), or cattle density in areas where pastoralism is an important activity.
4) As mentioned before, the fire ignition points had some geographical inaccuracies. It is known that spatial analysis and modelling involving point observations and area data can produce inaccuracies, depending on the magnitude of positional errors of point observations and on the grid resolution (e.g. Koutsias et al. 2004). Some authors dealing with data recorded in a UTM 10x10 km grid opted to use interpolation methods, like the kernel density estimation, to transform point-data into surface-data (Amatulli et al. 2007; de la Riva et al. 2004). However, it is also recognized that an increment in cell size (i.e. generalization) can reduce or eliminate existing location accuracy problems (e.g. Koutsias et al. 2004). In this study it was not possible to exactly determine the ignitions location accuracy, but we estimated that the vast majority will have a maximum error of 250 m. Thus, we opted to perform the analysis and produce the ignition risk map with 250 meters spatial resolution in order to minimize the effect of ignitions location uncertainty. Additionally, when using the risk map for operational purposes, the minimum unit of analysis should be the parish and not the grid cell, because parishes constitute the least detailed layer. The mentioned geographic constraints should be considered, and it would be useful if the national authorities could adjust the location method in order to improve future analysis of fire ignitions, especially if the objectives are to model this event at local or at municipal level. Conclusions Portugal is the southern European country with the highest density of fire ignition occurrence. The high number of fire ignitions can constitute serious problems in terms of fire detection and fire fighting resources dispersion contributing to reduce their effectiveness, thus the knowledge of their characteristics and spatial distribution patterns can be very important to managers. The ability to predict the risk of fire ignition can be very important to define priorities among areas of equivalent propagation risk, helping to improve fire danger estimations and the allocation of fire prevention and fire fighting resources.
In this work we aimed to contribute to improve the capacity of predicting the fire ignition occurrence at the national level. We analysed the spatial patterns of 127 490 wildfire ignitions occurred during a five years period, developed logistic models and produced a fire ignition risk map for the entire Portuguese mainland, evaluating their accuracy.
We concluded that fire ignition occurrence in Portugal is strongly correlated to human presence and activity. Most part of fire ignitions was concentrated in the more populated areas, and 98% occurred at less than 2 km from the roads. Fire
36

ignitions were mainly located in agricultural and in wildland-urban interface areas (85%), and only 15% occurred in forested or uncultivated areas. The linear models obtained with logistic regression were consistent with prior expectations regarding the variations of the explanatory variables, showing that it is more likely for ignitions to occur close to areas that can function as ignition sources, like roads, wildland-urban interface and agricultural areas.
The selected model showed satisfactory predictive results, with a global accuracy of 79.9% when applied to the validation dataset. Although this model was developed to the whole country, and thus with large human and natural variability, the results were quite good when compared to other models of the same type. Additionally, the model achieved acceptable classification error rates for given cut-off-points.
We demonstrated that it is possible to predict the likelihood of fire ignition occurrence at the national level and with good confidence levels, using only four explanatory variables. The obtained model and the fire ignition risk map can be easily used in a GIS environment to integrate fire danger estimation systems, constituting useful tools to help decision making in fire risk management.
In spite of good results obtained, the prediction model can probably be improved by including more accurate and updated information, or by including some additional explanatory variables. We expect that this study, the first performed in Portugal at national level, will encourage further research needed on this topic, which could include, for example, the probability that an ignition results in a large fire, or measures of temporal fire activity such as predictions on number of fires per day. Additional research on spatial and temporal factors variability of different causes should also be useful.
Acknowledgements We acknowledge the Portuguese Forest Services (DGRF) for all collaboration and for making available the wildfire database. We also acknowledge Paula Lopes, António Nunes and Vasco Nunes for their help on preliminary data processing. Part of this study was supported by the European Commission under the 6th Framework Programme through the Integrated Project ‘Fire Paradox’ (contract no. FP6-018505), and by IFAP-IP through the Project ‘Recuperação de Áreas Ardidas’.
References Amatulli G, Pérez-Cabello F, de la Riva J (2007) Mapping lightning/human-
caused wildfires occurrence under ignition point location uncertainly. Ecological modelling 200, 321-333.
Amatulli G, Camia A (2007) Exploring the relationships of fire occurrence variables by means of CART and MARS models. In ‘Proceedings of the 4th
International Wildland Fire Conference’. CD Rom, 11 pp. (Seville) Badia-Perpinyà A, Pallares-Barbera M (2006) Spatial distribution of ignitions in
Mediterranean periurban and rural areas: the case of Catalonia. International Journal of Wildland Fire 15, 187–196.
Bonazountas M, Kallidromitou D, Kassomenos, PA, Passas N (2005) Forest fire risk analysis. Human and Ecological Risk Assessment 11, 617–626.
37

Cardille JA, Ventura SJ, Turner MG (2001) Environmental and social factors influencing wildfires in the Upper Midwest, USA. Ecological Applications 11(1), 111-127.
Carreiras JMB, Pereira, JMC (2006) An inductive fire risk map for Portugal. In ‘Proceedings of the 5th International Conference on Forest Fire Research’. CD Rom, 7 pp. (Figueira da Foz)
Catry FX, Damasceno P, Silva JS, Galante M, Moreira, F (2007a) Spatial distribution patterns of wildfire ignitions in Portugal. In ‘Proceedings of the 4th International Wildland Fire Conference’. CD Rom, 10 pp. (Seville)
Catry FX, Rego FC, Santos T, Almeida J, Relvas P (2007b) Forest fires prevention in Portugal - Using GIS to help improving early fire detection effectiveness. In ‘Proceedings of the 4th International Wildland Fire Conference’. CD Rom, 12 pp. (Seville)
Catry FX, Almeida RM, Rego FC (2004) Produção de cartografia de visibilidades para Portugal continental. A importância da sua utilização na vigilância contra incêndios florestais. Silva Lusitana 12 (2), 227-241. [In Portuguese]
Chou, Y.H. (1992) Management of wildfires with a geographical information system. International Journal of Geographical Information Systems 6, 123-140.
Chuvieco E, Allgöwer B, Salas J (2003) Integration of physical and human factors in fire danger assessment. In ‘Wildland fire danger estimation and mapping. The role of remote sensing data’. (Ed. E Chuvieco). Vol. 4 World Scientific Publishing (Singapore).
Chuvieco E, Salas J, Barredo JI, Carvacho L, Karteris M, Koutsias N (1998) Global patterns of large fire occurrence in the European Mediterranean Basin: A GIS analysis. In ‘Proceedings of the 3rd International Conference on Forest Fire Research – 14th Conference on Forest Fire Meteorology. Vol II (Ed. DX Viegas) pp. 2447-2462. (Coimbra)
Chuvieco E, Congalton RG (1989) Application of remote sensing and geographic information systems to forest fire hazard mapping. Remote Sensing of Environment 29, 147-159.
Congalton R (1991) A review of assessing the accuracy of classifications of remotely sensed data. Remote Sensing of Environment 37, 35-46.
de la Riva J, Pérez-Cabello F, Lana-Renault N, Koutsias, N (2004) Mapping wildland fire occurrence at regional scale. Remote Sensing of Environment 92, 363-369.
DGF (2001) Inventário florestal nacional. Portugal continental. 3ª Revisão, 1995-1998. Direcção-Geral das Florestas, Lisboa. [In Portuguese]
DGRF (2006) Incêndios florestais – Relatório de 2005. Divisão de Defesa da Floresta Contra Incêndios. Direcção-Geral dos Recursos Florestais (Lisboa). [In Portuguese]
EC (2005) Forest fires in Europe 2004. Official Publication of the European Commission, S.P.I.05.147 EN.
ESRI (2005) ‘ArcGIS 9.1. software’ (Environmental Systems Research Institute: Redlands, CA)
FAO (1986) Wildland fire management terminology. FAO Forestry Paper 70, Food and Agriculture Organization of the United Nations, 257 pp.
Finney MA (2005) The challenge of quantitative risk analysis for wildland fire.
38

Forest Ecology and Management 211, 97-108. Garcia CV, Woodard PM, Titus SJ, Adamowicz WL, Lee BS (1995) A logit
model for predicting the daily occurrence of human caused forest fires. International Journal of Wildland Fire 5 (2), 101–111.
Genton MG, Butry DT, Gumpertz ML, Prestemon JP (2006) Spatio-temporal analysis of wildfire ignitions in the St Johns River Warer Management District, Florida. International Journal of Wildland Fire 15, 87–97.
Hardy CC (2005) Wildland fire hazard and risk: problems, definitions and context. Forest Ecology and Management 211, 73–82.
Hessburg PF, Reynolds KM, Keane RE, Salter RB (2006) A multi-scale decision support system for evaluating wildland fire hazard and prioritizing treatments. In ‘Proceedings of the 5th International Conference on Forest Fire Research’. (Ed. DX Viegas) CD Rom 3 pp. (Figueira da Foz).
Hosmer DW, Lemeshow S (1989) ‘Applied logistic regression.’ (John Wiley and Sons: New York).
IA (2005) CORINE Land Cover 2000 Portugal. Instituto do Ambiente. IA (2003) Atlas do Ambiente Digital. Instituto do Ambiente. Available at
www.iambiente.pt/atlas/est/index.jsp [Verified 2 March 2007] IGEOE (2005) Carta Militar Itinerária de Portugal. Instituto Geográfico do
Exército. Available at www.igeoe.pt [Verified 2 March 2007] IGP (2004a) Cartografia de risco de incêndio florestal. Relatório do distrito de
Viseu. Centro para a Exploração e Gestão de Informação e Situações de Emergência, Technical Report (Lisboa). [In Portuguese]
IGP (2004b) Carta administrativa oficial de Portugal. Instituto Geográfico Português. Available at www.igeo.pt/igeo/portugues/Frameset-egeo.htm [Verified 2 March 2007]
INE (2003) Dados estatísticos da população em Portugal - Censos 2001. Instituto Nacional de Estatística. [In Portuguese, database]
Johnson EA, Miyanishi K (2001) Forest fires: behavior and ecological effects. Academic press, USA, 594 p.
Koutsias N, Kalabokidis, KD, Allgöwer B (2004) Fire occurrence patterns at landscape level: beyond positional accuracy of ignition points with kernel density estimation methods. Natural Resources Modelling 17 (4), 359-375.
Kilinc M, Beringer J (2007) The spatial and temporal distribution of lightning strikes and their relationship. Journal of Climate 20 (7), 1161-1173.
Langhart R, Bachmann A, Allgöwer (1998) Temporal and spatial patterns of wildfire occurrence (Canton of Grison, Switzerland). In ‘Proceedings of the 3rd International Conference on Forest Fire Research – 14th Conference on Forest Fire Meteorology. Vol II (Ed. DX Viegas) pp. 2279-2292. (Coimbra)
Legendre P, Legendre L (1998) Numerical ecology. Second English Edition. Elsevier Science B.V., Amsterdam.
Manel S, Williams H, Ormerod SJ (2001) Evaluating presence-absence models in ecology: the need to account for prevalence. Journal of Applied Ecology 38, 921-931.
Mercer DE, Prestemon, JP (2005) Comparing production function models for wildfire risk analysis in the wildland-urban interface. Forest Policy and Economics 7, 782-795.
NASA, NIMA, DLR, ASI (2004) Digital elevation model. National Aeronautics
39

and Space Administration (NASA); National Imagery and Mapping Agency (NIMA); German space agency (DLR); Italian space agency (ASI). Available at ftp://edcsgs9.cr.usgs.gov/pub/data/srtm [Verified 8 August 2006]
NWCG (2006) Glossary of wildland fire terminology. PMS 205, National Wildfire Coordinating Group, 183 pp.
Norusis MJ (2002) SPSS for Windows – Base system user’s guide. SPSS Inc., Chicago.
Nunes A, Duarte J (2006) Assessment of forest fire risk in the Serra da Estrela Natural Park (Portugal): methodological application and validation. In ‘Proceedings of the 5th International Conference on Forest Fire Research’. CD Rom, 10 pp. (Figueira da Foz).
Pearce J, Ferrier S (2000) Evaluating the predictive performance of habitat models developed using logistic regression. Ecological Modelling 133, 225-245.
Preisler HK, Brillinger DR, Burgan RE, Benoir JW (2004) Probability based models for estimation of wildfire risk. International Journal of Wildland Fire 13, 133–142.
Rego FC, Catry FX (2006) Modelling the effects of distance on the probability of fire detection from lookouts. International Journal of Wildland Fire 15, 197-202.
Rego FC, Catry FX, Maia MJ, Santos TA, Gravato A, Castro IC, Moreira FO, Pinto PR, Almeida J (2004) Análise da Rede Nacional de Postos de Vigia em Portugal. Technical Report (Lisboa). [In Portuguese]
Robin JG, Carrega P, Fox D (2006) Modelling fire ignition in the Alpes-Maritimes Depertment, France, a comparison. In ‘Proceedings of the 5th International Conference on Forest Fire Research’. CD Rom, 12 pp. (Figueira da Foz).
Roloff GJ, Mealey SP, Clay C, Barry J, Yanish C, Neuenschwander L (2005) A process for modelling short and long-term risk in the southern Oregon Cascades. Forest Ecology and Management 211, 166-190.
Sokal RR, Rohlg FJ (1987) ‘Biometry.’ (W.H. Freeman and Company: New York)
SPSS (2006) SPSS for Windows. SPSS Inc. (Chicago). Swets JA (1988) Measuring the accuracy of diagnostic systems. Science 240,
1285-1293. Vasconcelos MJP, Silva S, Tomé M, Alvim M, Pereira JMC (2001) Spatial
prediction of fire ignition probabilities: comparing logistic regression and neural networks. Photogrametric Engineering & Remote Sensing 67 (1): 73-81.
Vazquez A, JM Moreno (1998) Patterns of lightning-, and human-caused fires in peninsular Spain. International Journal of Wildland Fire 8 (2), 103–115.
40

CAPÍTULO 3 - CONCLUSÕES O elevado número de ignições que normalmente se regista em Portugal, sobretudo
nos meses de Verão, pode constituir um sério problema ao nível da dispersão dos
meios de detecção e de combate a incêndios, contribuindo para uma redução da
sua eficácia, pelo que o conhecimento das suas características e padrões de
distribuição espacial poderão ser muito importantes para os gestores. A
capacidade de prever o risco de ignição é importante para a definição de
prioridades entre zonas com um risco de propagação idêntico, auxiliando a
avaliação do perigo de incêndio e a optimização da distribuição dos meios de
prevenção e combate.
Com este trabalho pretendeu-se contribuir para melhorar a capacidade de prever a
ocorrência de focos de incêndio a nível nacional. Com esse objectivo foram
analisados os padrões de distribuição espacial de 127 490 ignições registadas
durante um período de cinco anos, foram desenvolvidos modelos logísticos, e foi
produzido um mapa de risco de ignição que abrange todo o território de Portugal
continental, sendo posteriormente efectuada uma avaliação do grau de precisão
dos modelos e do mapa.
Concluiu-se que a ocorrência de ignições em Portugal está fortemente relacionada
com a presença e actividade humanas. A maior parte das ignições analisadas
concentra-se nas áreas mais densamente povoadas, e 98% ocorreu a menos de 2
km de uma estrada. As ignições ocorreram principalmente em áreas agrícolas e
nas zonas de interface entre áreas urbanas e outros tipos de ocupação do solo
(85%), sendo que apenas 15% ocorreu em áreas florestais ou outras áreas não
cultivadas.
O modelo seleccionado, obtido com quatro variáveis explicativas, mostrou uma
capacidade preditiva satisfatória, com uma precisão global de 79,9% quando
aplicado ao grupo de dados utilizado para validadação. Apesar deste modelo ter
sido desenvolvido para todo o território nacional, onde existe uma grande
variabilidade dos factores humanos e naturais, os resultados são bastante bons
quando comparados com outros modelos do mesmo género. Adicionalmente,
obtiveram-se erros de classificação aceitáveis para o ponto-de-corte considerado.
41

Foi demonstrado que é possível prever a probabilidade de ocorrência de ignições a
nível nacional e com um bom grau de fiabilidade. Os modelos e o mapa de risco
desenvolvidos podem ser facilmente utilizados num ambiente SIG para integrar
sistemas de avaliação do perigo de incêndio, constituindo ferramentas úteis no
auxílio à tomada de decisão na gestão do risco.
Apesar dos bons resultados obtidos, o modelo preditivo pode provavelmente ser
melhorado através da utilização de informação mais detalhada e actualizada, ou da
inclusão de outras variáveis explicativas. Espera-se que este estudo, o primeiro
desenvolvido em Portugal a nível nacional, possa encorajar investigação adicional
neste tema, como por exemplo o estudo da probabilidade de que uma ignição dê
origem a um grande incêndio, ou de medidas temporais da ocorrência de fogos
tais como a previsão do número de ignições diário. Seria igualmente útil
desenvolver investigação adicional relativa aos factores de variabilidade espaciais
e temporais associados às diferentes causas que estão na origem dos focos de
incêndio em Portugal.
42