modelling and simulation of an e-voting system: a case
TRANSCRIPT

e-Voting System: A simulation case study of Kenya
I
UNIVERSITY OF NAIROBI
e-VOTING SYSTEM: A SIMULATION CASE STUDY OF KENYA
BY
JAMES IRAYA NJOGU
A RESEARCH PROJECT REPORT SUBMITTED TO THE SCHOOL OF
COMPUTING AND INFORMATICS UNIVERSITY OF NAIROBI IN
PARTIAL FULFILMENT OF THE REQUIREMENTS FOR THE AWARD OF
THE DEGREE OF MASTERS OF SCIENCE IN COMPUTER SCIENCE OF
THE UNIVERSITY OF NAIROBI.
SEPTEMBER 2014

e-Voting System: A simulation case study of Kenya
II
DECLARATION
The work contained in this project report has not been previously submitted for any award at
any higher educational institution. To the best of my knowledge and belief, the project report
contains no material previously published or written by another person except where due
reference is made.
Signed.........................................................................Date..........................................................
P58/9173/2006
This project report has been submitted for examination with my approval as the University
Supervisor
Dr Elisha T. O. Opiyo
Signature...................................................................Date............................................................
.
e-Voting System: A simulation case study of Kenya
III
ACKNOWLEDGEMENTS
The Master journey has been an interesting and a valuable experience for me. I would like to
thank my supervisors and reviewers (anonymous or otherwise). Thanks to others that have
provided input in some way to this research project report or my life during time I spend at
the School of Computing and Informatics, University of Nairobi. I owe this project report to all
of them because if it was not for them, this project report would not have been feasible.
Firstly, I would like to express my heartfelt gratitude to Dr Elisha T. O. Opiyo, Prof. Peter
Waiganjo, and Mr Joseph Ogutu for their supervision, guidance, advice, encouragement,
understanding, and patience. I would like to thank in a special way Dr Elisha T. O. Opiyo for
accepting me as one of his apprentice and always making the time for my supervision.
I will also wish to thank all colleagues who provided vital inputs in various stages of
development of the project report. Special thanks also go to the University for providing a
conducive environment that enabled me to prepare this project report.
Finally, special thanks goes to my parents and partner, for being with me, supporting me,
keeping me going and chasing me every day to complete my study and to the Almighty God
for everything.
James Iraya Njogu
11th September, 2014

e-Voting System: A simulation case study of Kenya
IV
ABSTRACT
It is generally considered that a key component of electronic government in the future will be
electronic voting, as a means of facilitating the participation of citizens in elections and
public debates. The rapid advancement in information and communications technologies has
given rise to new applications that were impossible just few years ago. One of these
applications is e-voting. The term ―e-voting‖ is defined as any voting method where the
voter’s intention is expressed or collected by electronic means. This project report details the
requirements, design and simulation of a generic and secure electronic voting system a case
study of Kenya where voters can cast their votes anytime, anywhere and using a number of
electronic devices including private computer networks, web and mobile phones.
KEY TERMS
Voting, e-voting, election, ballot, internet, voting service provider (VSP), General purpose
simulation system (GPSS), Unified Modelling Language (UML), Short Message Services
(SMS), GPRS, GSM, HTTP, TCP/IP, Greedy Improve Algorithm(GIA), Utilization
Equalization Method (UEM) and RSA.
e-Voting System: A simulation case study of Kenya
V
LIST OF FIGURES
Figure 1. The classical ―paper form‖ voting process...............................................................18
Figure 2: Voting process flow chart.........................................................................................19
Figure 3. The remote voting process........................................................................................20
Figure 4. The electoral cycle....................................................................................................23
Figure 5: State Diagram of the Proposed Simulation Model...................................................28
Figure 6: Simulation Study Schematic.....................................................................................31
Figure 7. General Schematic diagram of the e-voting system.................................................38
Figure 8. Flowchart representation of Registration Process.....................................................39
Figure 9. Flowchart representation of Voting & Counting Process…………………………41
Figure 10: State Diagram of the Proposed Simulation Model.................................................43
Figure 11: Greedy Improvement vs. Utilization Equalization Allocation Strategies...............52
Figure 12: Voter Turnout Rates vs. Allocation Strategy .........................................................56
Figure 13: Voting Time Required vs. Allocation Strategy......................................................57
Figure 14: Size of County vs. Allocation Strategy...................................................................58
Figure 15: Machines per polling stations vs. Allocation Strategy ..........................................58

e-Voting System: A simulation case study of Kenya
VI
LIST OF TABLES
Table 1: Paper based election vs electronic voting..................................................................21
Table 2: Voter Arrivals by Time of Day..................................................................................46
Table 3: Factors and Levels for Experimental Design Factors................................................50
Table 4: Factors and Levels for Experimental Design.............................................................53
e-Voting System: A simulation case study of Kenya
VII
Table of Contents DECLARATION .................................................................................................................................... II
ACKNOWLEDGEMENTS ................................................................................................................... III
ABSTRACT ........................................................................................................................................... IV
LIST OF FIGURES ................................................................................................................................ V
LIST OF TABLES ................................................................................................................................. VI
CHAPTER ONE ..................................................................................................................................... 1
1.0 INTRODUCTION ............................................................................................................................. 1
1.1 Background ................................................................................................................................... 1
1.2 Problem statement ....................................................................................................................... 2
1.3 Objectives...................................................................................................................................... 3
1.4 Significance of the study ............................................................................................................... 4
CHAPTER TWO .................................................................................................................................... 6
2.0 LITERATURE REVIEW ..................................................................................................................... 6
2.1 Introduction .................................................................................................................................. 6
2.2 Election.......................................................................................................................................... 6
2.3 Voting systems .............................................................................................................................. 6
2.4 The e-voting system .................................................................................................................... 10
2.5 Related works ............................................................................................................................. 12
2.6 Modelling and Simulation ........................................................................................................... 16
2.7 Conceptual framework ............................................................................................................... 20
2.8 Summary ..................................................................................................................................... 21
2.9 Research gaps ............................................................................................................................. 21
CHAPTER THREE .............................................................................................................................. 22
3.0 RESEARCH METHODOLOGY ........................................................................................................ 22
3.1 Introduction ................................................................................................................................ 22
3.2 Data Collection Methods ............................................................................................................ 22
3.2 Data Analysis Methods ............................................................................................................... 23
3.3 Discrete event modelling methodology ...................................................................................... 23
3.4 Hardware and Software Requirements ...................................................................................... 25
CHAPTER FOUR ................................................................................................................................. 26
4.0 E-VOTING SYSTEM ANALYSIS, DESIGN AND IMPLEMENTATION ................................................ 26
e-Voting System: A simulation case study of Kenya
VIII
4.1 Introduction ................................................................................................................................ 26
4.2 The E-Voting System Architecture .............................................................................................. 26
4.3 Voting Requirements .................................................................................................................. 32
4.4 The e-Voting Simulation model .................................................................................................. 32
4.5 Analysis options .......................................................................................................................... 34
4.6 Simulation Analysis ..................................................................................................................... 35
CHAPTER FIVE .................................................................................................................................. 40
5.0 EXPERIMENTAL DESIGN AND RESULTS .............................................................................. 40
5.1 Factors and Levels ....................................................................................................................... 40
5.2 Results ......................................................................................................................................... 41
CHAPTER SIX ..................................................................................................................................... 44
6.0 SUMMARY, CONCLUSIONS AND RECOMMENDATIONS ................................................... 44
References: ............................................................................................................................................ 50
e-Voting System: A simulation case study of Kenya
1
CHAPTER ONE
1.0 INTRODUCTION
1.1 Background
Election is a process in which voters choose their representatives and express their
preferences for the way that they will be governed. A proper electoral system reflects the true
voice of the people in a nation and thus, a better government which respect and uphold the
ideals of constitutionalism.
There is a wide variety of different voting systems that are based on traditional paper ballots,
mechanical devices, or electronic ballots. In a traditional paper ballots, voters choose or mark
their favourite choices on ballots and place them in boxes, which are sealed and officially
opened under special conditions to warrant transparency. The ballots are then counted
manually, which is a tedious process that is subject to human error. With voting via
mechanical systems, meanwhile, voters make their choices by pulling down on mechanical
levers that correspond to their favourite choice of candidates. Each lever has a mechanical
counter that reports the number of votes for that position. On the other hand, some systems
use punch cards where voters punch holes in computer readable ballot cards. These systems
are not reliable because of problems in reading cards and were replaced by optical scan
device systems, which allow voters to record choices by filling in areas on the ballots. The
ballots are read using a computer scanner and then the votes are counted automatically using
a computer program. Finally, special-purpose computers are used as voting machines where
voters use touch screens or push buttons to select choices, which are stored and counted or
processed by a special program on the same machine.
The advancement of information and telecommunications technologies allow for a fully
automated online computerized election process. In addition to overcoming commonly
encountered election pitfalls, electoral vote counts are done in real time that by the end of
elections day, the results are automatically out. The election process can be easily enhanced
with various features based on the demand and requirements of different countries around the
world. The introduction of electronic voting has been the biggest change. E-Voting may soon
become a global reality or a global nightmare. Besides reliable e-Voting technologies, there is
a dire need for international standards to govern the technology, the software reliability and
accuracy, the processes and algorithms deployed within the technology, and the verification
of all hardware, software and protocols involved. Such standards will eventually allow

e-Voting System: A simulation case study of Kenya
2
elections to proceed in any part of the world without the need for monitoring bodies. The
design of a ―good‖ voting system, whether electronic or using traditional paper ballots or
mechanical devices must satisfy a number of sometimes competing criteria including a high
degree of security and accuracy, eligibility and authentication, integrity, verifiability and
auditability, reliability, flexibility, performance and scalability. More importantly, there is a
real need for a good simulation model which can guide the deployment of e-Voting resources
such that the election process can proceed with minimal faults and performance issues. In this
research, I will provide a simulation model for a generic e-Voting process. The model will be
designed to be flexible enough to be adapted to different election environments. The
objective of the simulation model is to study the effect of several parameters on the course of
an election process.
1.2 Problem statement
The current electoral systems in Kenya has a number weaknesses in terms of lack of Voter’s
mobility, security and accuracy of the tallying process due to human errors, eligibility and
authentication, integrity, individual verifiability and auditability, reliability, flexibility,
performance and scalability (Mercurio, 2004).
Accessibility means that voters should be enabled as far as possible to participate
directly in the election process. If this is impossible, there must be a way of taking
part indirectly, i.e. by proxy.
The Eligibility means that only authorized and eligible voters should be allowed to
cast ballots.
Accuracy mean’s that voter’s intent should be recorded and counted correctly, to
ensure that the will of the people is represented.
Uniqueness means voters should only be allowed to cast one ballot each. Integrity
means that votes which are forged, modified, or deleted should be detected.
Verifiability and auditability is the verification that all the votes have been accounted
for in the final tally and that reliable and authentic records exist to that effect.
Reliability means that no vote should be lost, even when faced with electoral failures.
Secrecy and non-coercibility means that voting is carried out in secret without voters
ever having to reveal how they cast their respective ballots.
Flexibility means election equipment should be accessible to all voters, including
those with disabilities.
e-Voting System: A simulation case study of Kenya
3
Convenience means that voters should be able to quickly cast their ballot without
undue delay.
Certifiability means voting systems should be regularly tested and certified to ensure
against electoral failure.
Cost-effectiveness means the voting systems should be affordable while still being
efficient and effective;
Transparency means that voters should possess a general understanding of the voting
process and should not be deceived into voting a certain way while
Fairness means result is not published till the end of the election. Counting comes
after the voting stage. No one can guess the content of any cast vote.
These qualities of a good election has proved difficult to achieve in Kenya as evidenced in
the last two elections (2007 and 2013) that were characterised by violence and court cases.
Voting systems involve sophisticated protocols, designed to be used in complex
environments. Specifying their properties in such context might therefore be a challenging
task. A more accessible challenge consists in specifying the expected behaviour of a voting
system in an ideal world, where parties can be trusted, and communication channels are
assumed to be private and authentic (Olivier de, 2007). This issues need to be well
understood and tested using a simulator before an e-voting system is implemented.
1.3 Objectives
1.3.1 Project Objectives
i. To conduct a real life voting scenario study
ii. To formulate a conceptual model and build an e-voting simulator
iii. To experiment with the e-voting simulator and analyze the result of the simulation
iv. To make recommendation based of the results obtained on what need to be done to
implement an electronic voting system for use by the electoral commission of Kenya
1.3.2 Research Objectives
i. To investigate the relevance of e-voting system in a developing country
ii. To investigate the possible challenges of an e-voting system in a developing country
iii. To investigate the feasibility of using an e-voting system in a developing country
iv. To applied the knowledge gathered in the field of computer science.
1.3.3 System objectives
i. To determine the effect of an increased voter turnout to the electoral process
ii. To enhance the security of the voting system.

e-Voting System: A simulation case study of Kenya
4
iii. To provide a simulation model that can provide a mechanism for better understanding
of the requirement of an electronic voting system before investing into such a system.
1.4 Significance of the study
The significance of building an e-voting simulator was to investigate the electoral process to
ensure it fulfils all or most of the main properties of e-voting system. E-voting systems deals
with the freewill of people, something that many nations fought for, this make the building e-
voting simulator a critical job. Some researchers suggested more complicated requirements
but I focused on the main requirements. These requirements are: (D. Veit, 2014)
Privacy: It is the inability to link a voter to a vote. Voter privacy must be preserved
during the election as well as after the election for a long time.
Eligibility: Only eligible voters participate in the election. They should register before
the Election Day and only registered eligible voters can cast votes.
Uniqueness: Only one vote for a voter should be counted. It is important to notice that
uniqueness does not mean un-reusability, where voters should not vote more than
once.
Uncoercibility: Any coercer, even authorities, should not be able to extract the value
of the vote and should not be able to coerce a voter to cast his vote in a particular way.
Voter must be able to vote freely.
Receipt-freeness: It is the inability to know what the vote is. Voters must neither be
able to obtain nor construct a receipt which can prove the content of their vote to a
third party both during the election and after the election ends. This is to prevent vote
buying or selling.
Fairness: No partial tally is revealed before the end of the voting period to ensure that
all candidates are given a fair decision. Even the counter authority should not be able
to have any idea about the results.
Transparency: The whole voting process must be transparent. Bulletin boards may be
used to publicize the election process. The security and reliability of the system must
not rely on the secrecy of the network which cannot be guaranteed.
Accuracy: All cast votes should be counted. Any vote cannot be altered, deleted,
invalidated or copied. Any attack on the votes should be detected. Uniqueness should
also be satisfied for accuracy.
Robustness: Any number of parties or authorities cannot disrupt or influence the
election and final tally. To have confidence in the election results, robustness should

e-Voting System: A simulation case study of Kenya
5
be assured. However, there are numerous ways for corruption. For example;
registration authorities may cheat by allowing ineligible voters to register; ineligible
voters may register under the name of someone else; ballot boxes, ballots and vote
counting machines may be compromised.
Mobility: a system is mobile if there are no restrictions (other than logical ones) on
the location from which the voter can cast.
These issues inspired this project report in which I have developed a simulator of an
electronic voting scheme over a secure platform. The use of electronic voting has the
potential to reduce or remove unwanted human errors. In addition to its reliability, e-voting
can handle multiple modalities, and provide better scalability for large elections. E-Voting is
also an excellent mechanism that does not require geographical proximity of the voters.
The research outcome was useful in providing vital information that can be used to improve
the management of elections in Kenya.
1.5 Scope and limitation
This project was aimed at developing a simulator to simulate the voting process in Kenya. The aim of
the e-voting simulator was to help evaluate the requirement of an electronic voting process which is
necessary before resources are committed to the actual system. The major limitation of this project
was the time constrains that was imposed by the strict delivery schedule. Financial resources also
provided some challenge in the course of developing this project. The simulation environment also
provided a challenge because no single simulation software was able to provide an environment that
was all inclusive with all the necessary tools.

e-Voting System: A simulation case study of Kenya
6
CHAPTER TWO
2.0 LITERATURE REVIEW
2.1 Introduction
This chapter document the available relevant literature concerning the problem domain. The
implication was that the researcher devoted sufficient time to reviewing research already
undertaken on related problems. This was done to find out what data and other materials are
already available from earlier research, and identify gaps that the present research may fill.
2.2 Election
Election is the process that gives the citizens the rights to select candidates to represent them
in a democratic pattern. Election deals with the democracy and freewill of citizens, for this
reason voting process is considered to be very critical and sensitive process, therefore
election implementation must serve many requirements in order to deliver a trustworthy
election. These requirements can be defined as user conventions requirements and delivery of
secure voting process requirements (Taha Kh. Ahmed, 2011).
Due to the fast development of network technology the world is going toward the use and
implementation of the e-technology in every aspect of our life including e-governments. E-
voting becomes one of these technologies. E-voting refers to the use of hardware and
software to establish an electronic system, useful in voting process, by generating an
electronic ballot that replaces the paper ballot. E-voting was introduced by e-governments
especially in Europe in order to serve voting convention by providing remote system so the
voter can cast his/her vote whenever and wherever he/she can. These systems will increase
voter’s participation and will speed up the votes counting.
Introducing remote voting technique over the internet (e-voting) will serve voter’s
convention. The main idea of this technology is to speed up the ballot counting and increase
voters’ participation by providing remote voting process.
2.3 Voting systems
There is a wide variety of different voting systems that are based on traditional paper ballots,
mechanical devices, or electronic ballots.(Douglas, 2001; Melanie, 2009)
2.3.1 Paper Ballots
e-Voting System: A simulation case study of Kenya
7
Hand written paper ballots were first used in Rome in 139 BCE, and their first use in America
was in 1629, to select a pastor for the Salem church. These early paper ballots offered only
modest voter privacy and they were fairly easy targets for various forms of election fraud.
The modern system of election using paper ballots was first used in 1858 in Australia. The
great Australian innovation was to print standardized ballots at government expense,
distribute them to the voters at the polling places, and require that the voters vote and return
the ballots immediately. Today, the security against election fraud this provides seems
obvious, but in the 19th century, it was not obvious to most observers, and it was not until
1888 that this ballot was used in the United States.
A properly administered Australian paper ballot sets a very high standard, assuring voter
privacy, preventing voters from revealing how they voted, and assuring an accurate and
impartial count.
2.3.2 Lever Voting Machines
Lever voting machines were first used in 1892 in New York, and were slowly adopted across
the country. They completely eliminate most of the approaches to manipulating the vote
count that were endemic a century ago, and they can easily be configured to handle a
complex general election ballot.
Lever voting machines offer excellent voter privacy, and the feel of a lever voting machine is
immensely reassuring to voters! Unfortunately, they are immense machines, expensive to
move and store, difficult to test, complex to maintain, and far from secure against vote fraud.
Furthermore, a lever voting machine maintains no audit trail. With paper ballots, it is possible
to recount the votes if there is an allegation of fraud. With lever voting machines, there is
nothing to recount!
In effect, lever voting machines were the "quick technological fix" for the problems of a
century ago; they eliminated the problems people understood while they introduced new
problems. Because they are expensive to test, complete tests are extremely rare. The
mechanism is secure against tampering by the public, but a technician can easily fix a
machine so that one voting position will never register more than some set number of votes,
and this may not be detected for years.
2.3.3 Punched Cards
The first new technology to effectively challenge lever voting machines was the now
infamous Votomatic voting machine. Punched card data processing dates back to the 1890's,

e-Voting System: A simulation case study of Kenya
8
but IBM did not introduce the Votomatic punched card voting system until 1964. The
Votomatic ballot and the more recent mark-sense ballot both represent a return to the
Australian secret ballot, but with the added benefit of automated and impartial vote count
produced using tabulating machinery.
With this return to paper ballots, we gained the ability to recount the vote in the event there is
a challenge, but we also introduce the question of how to interpret marginal votes.
From a legal perspective, a ballot is an instrument, just like a deed or a check. When the
ballot is deposited in the ballot box, it becomes anonymous, but just prior to the moment
when the ballot is deposited, it ought to be possible to hand the ballot to the voter and ask
"does this ballot properly represent your intent?". Votomatic punched card ballots fail this
simple test! While the ballot is in the Votomatic machine, the voter can punch holes in it but
is unable to see the ballot itself. Once removed from the machine, the voter can see the holes,
but without the ballot labels printed on the machine, the voter is unable to tell what those
holes mean.
2.3.4 Optical Mark Sense Ballots
Optical mark-sense voting systems were developed in the early 1970's by American
Information Systems of Omaha, alternately in competition with and in cooperation with
Westinghouse Learning Systems of Iowa City. The latter was the licensee of the University
of Iowa's patents on the optical mark-sense scanning machine. Essentially the only advantage
of mark-sense technology over punched card technology is that it uses marks on a printed
paper ballot. This is an important advantage! This means that no special machines are
required to vote on the ballot, it means that, with proper ballot design, a voter can easily
verify that the markings on the ballot exactly convey his or her intent, and it means that,
during a hand recount, no special expertise is required to interpret the intent of the voters.
Unfortunately, the first generation of optical mark-sense voting machines was extremely
sensitive to the particular type of pen or pencil used to mark the ballot, and to the exact
details of the mark itself. As a result, early machines, including many still in use today, had
real difficulty distinguishing faint deliberate marks from smudged erasures, and they tended
to have mark sensing thresholds that required a fairly dark mark.
The newest generation of optical mark-sense readers uses visible wavelength image
processing technology instead of simple infrared sensors to read the marks. Many of the more
recent offerings use either FAX machine scanning mechanisms or computer page-scanning
devices to obtain the image of the ballot, and they operate by finding each marking target
e-Voting System: A simulation case study of Kenya
9
before they search the target for acceptable marks. Such machines can easily ignore relatively
dark smudged erasures while catching relatively faint deliberate marks.
2.3.5 Direct Recording Electronic Voting Systems
The newest voting technology uses direct-recording electronic voting machines. These were
developed after microcomputers became sufficiently inexpensive that they could be
incorporated into a voting machine. The first of these was developed by Shoup in 1978; The
Shoup Voting Machine Company was one of the two companies that had been making lever
voting machines for much of the century. Their new electronic voting machine was built to
have the "look and feel" of a lever voting machine, thereby minimizing the voter education
problems that always accompany changes in voting technology.
Much of the rhetoric today about voting system reform asks why we can't have voting
machines that are as ubiquitous and convenient as automatic teller machines. This turn of
phrase is a reference to the newest generation of direct-recording voting machines; these
make no attempt to emulate earlier technology; physically, they are little more than
repackaged personal computers with touch screen input and special software to make them
function as voting systems.
All of today's direct-recording voting machines attempt to offer far stronger audit and
security tools than the old lever machines they functionally replace. Instead of simply storing
vote totals on odometer wheels inside the machine, they store an electronic record called a
ballot image recording each voter's choices, and they store an audit trail of all actions
involving the machine, from pre-election testing to the printing of vote totals after the polls
close. These records are stored in duplicate form, for example, in a hard drive in the machine
as well as in a removable memory pack of some kind or on an adding machine tape inside the
machine. Should any disaster strike or should a recount be requested, it should be possible to
recover all votes that have been cast on such a machine.
Unlike any system resting on paper ballots, none of the information stored inside a direct-
recording electronic voting machine can be said to have the status of a legal instrument.
Instead, the record is created by the software within the voting machine in response to the
voter's actions, and the record is only as trustworthy as the software itself. It is far from easy
to test and inspect software to assure that it functions as advertised, and it is far from easy to
assure that the software resident in a machine today is the same software that was authorized
for use in that machine months or years ago.

e-Voting System: A simulation case study of Kenya
10
2.4 The e-voting system
Electronic voting is similar to classic ―paper-form‖ voting. In classical ―paper-form‖ voting
voters entering the polling station have to be identified (Taha Kh. Ahmed, 2011). If
identification is passed, they are able to vote. The whole scenario of classical voting can be
seen in figure 1
Fig. 1. The classical ―paper form‖ voting process (Taha Kh. Ahmed, 2011)
There are two recognised types of electronic voting systems. The first one is based on visiting
a polling station. In this case voters are still identified by using identification cards. Voters do
not fill voting cards in the paper form but push buttons on various electronic devices. Then
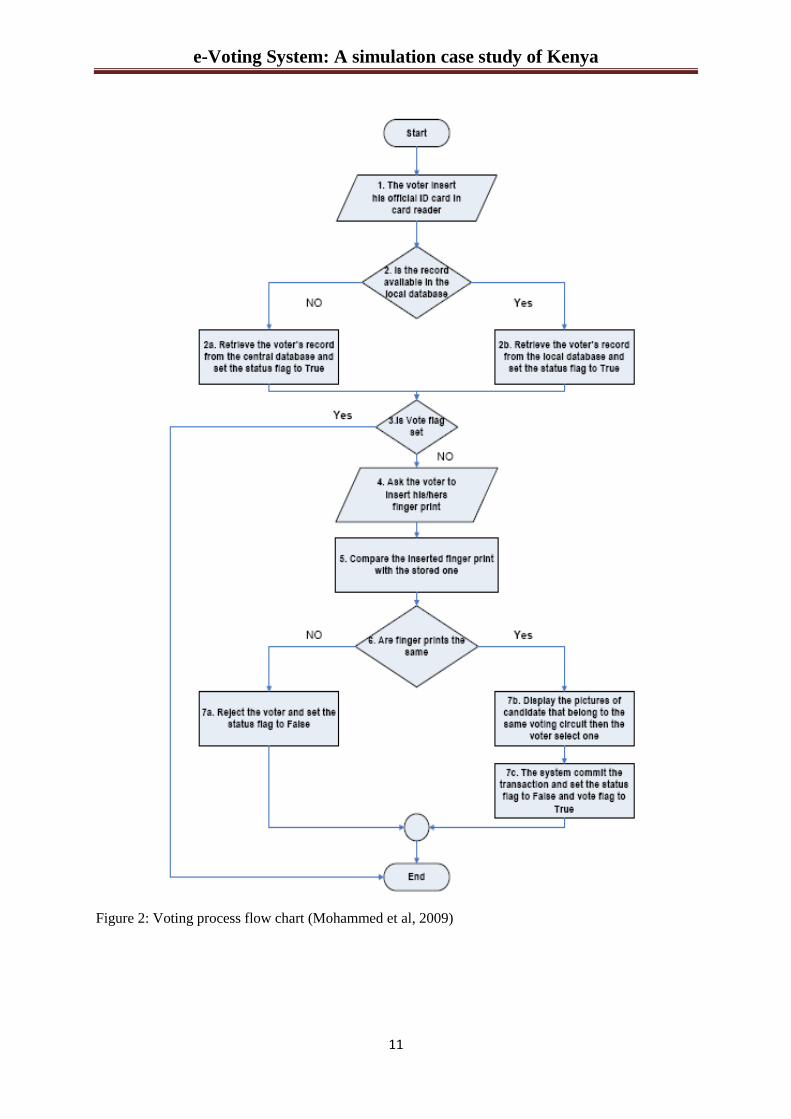
voters use the electronic device to vote.( figure 2)
The second type of electronic voting system is based on remote technology. Usually voters
have the chance to vote by using computers at remote locations or at polling stations.
They use computer and internet networks for voting. Voters can vote out with the normal
interval for voting (usually office hours). They can also vote from abroad. These constitute
the most important advantages of the remote-based voting system. This idea is usually called
internet voting.( figure 3)
e-Voting System: A simulation case study of Kenya
11
Figure 2: Voting process flow chart (Mohammed et al, 2009)

e-Voting System: A simulation case study of Kenya
12
Figure 3. The remote voting process (Taha Kh. Ahmed, 2011)
There are several conditions for electronic voting systems. The law in the country has to
support the electronic voting systems. The e-voting solution has to follow the technical and
process conditions listed below:
1. Participation in the voting process is granted only to registered voters.
2. Each voter has to vote only once.
3. Each voter has to vote personally.
4. Security and anonymity of voters and voting.
5. Security for the electronic ballot box.
2.5 Related works
Jean-Luc, 2006 in his paper describes the suitable properties for on electronic voting systems
as completeness, transitivity, unrestricted domain, unanimity and independent of irrelevant

e-Voting System: A simulation case study of Kenya
13
alternatives. This helps to design an ideal voting procedure that ensures the rights of voters
and their choices are respected in a democratic process.
In his book (Melanie, 2009) he discussed the requirement and evolution of procedures that
support election authorities that desires to use e-voting as a system. He discusses at length
the various forms of election, and compares the paper based voting and e-voting.
Table 1 below: Paper based election vs electronic voting (Melanie, 2009)
Paper Based Election Electronic Voting
- Easier to manipulate Technical know how necessary
- Decentralized Centralized
- Only small alteration to the results Alteration to the entire results.
- Trust in poll workers Trust in poll workers, system developers,
administration.
- Meaningful re-tallying Electronic re-tallying based on the same input.
- Equal ballot sheets Different Ballot layouts(depending on the device)
- Sometimes hard to decide about the
voter’s will
Unambiguously valid or invalid votes.
The requirement of an e-voting system is also discussed in this book which is summarized by
the following six commandments.
1. ―Thou shall keep each voter’s choices an inviolable secret‖.
2. ―Thou shall allow each eligible voter to vote only once, and for those offices for
which she is authorized to cast a vote‖.
3. ―Thou shall not permit tampering with thy voting system or the exchange of gold for
voters‖.
4. ―Thou shall report all votes accurately‖.
5. ―Thy voting system shall remain operable throughout each election‖.
6. ―Thou shall keep an audit trail to defect sins against commandments II-IV, but their
audit trail shall not violate commandment I‖.
The detailed requirements for the e-voting systems have also been discussed. In his paper
(Alexander, 2004) describes the e-voting process in which he identifies the following five
steps;

e-Voting System: A simulation case study of Kenya
14
1. Applet download – voter starts the remote electronic voting process by entering the
URL provided by the election administration
2. Preparation of validation token.
3. Authorization check and preparation of voting token.
4. Blind signature of the validation token.
5. Blind signature of the voting token.
In his paper (Salini et al, 2013) discuss the security requirements, which he identifies as;
1. To ensure eligible voters only able to cast a vote.
2. To ensure that every vote casted is counted.
3. To maintain the voter’s right and to express his or her opinion in a free manner,
without any influence.
4. To protect the secrecy of the vote at all stages of the voting process.
5. To guarantee accessibility and availability of the system to as many voters as possible.
6. To increase voter confidence by maximizing the transparency of information.
To secure e-voting system involves three layers; i.e. the network layer, host layer, and the
application layer. The article also identifies the following threats and vulnerability of the e-
voting system for which security requirement must be found.
Threats
1. Password cracking of users of e-voting system.
2. Network eavesdropping between browser and web server to capture voter’s
credentials.
3. SQL injections to execute commands and access or modify data like vote.
4. Cross – site scripting (XSS) where an attacker injects script code.
5. Information disclosure secret to whom the voter voted.
6. Unauthorized access to the election database.
7. Discovery of encryption keys used to encrypt sensitive data in the database.
8. Unauthorized access to web server resources and static files of e-voting.
Vulnerabilities.
1. Weak or blank passwords, passwords that contain everyday works.
2. Lack of password complexity enforcement.

e-Voting System: A simulation case study of Kenya
15
3. Missing or weak input validation at the server.
4. Failure to validate cookie input.
5. Failure to encode output leading to potential cross-site scripting issues.
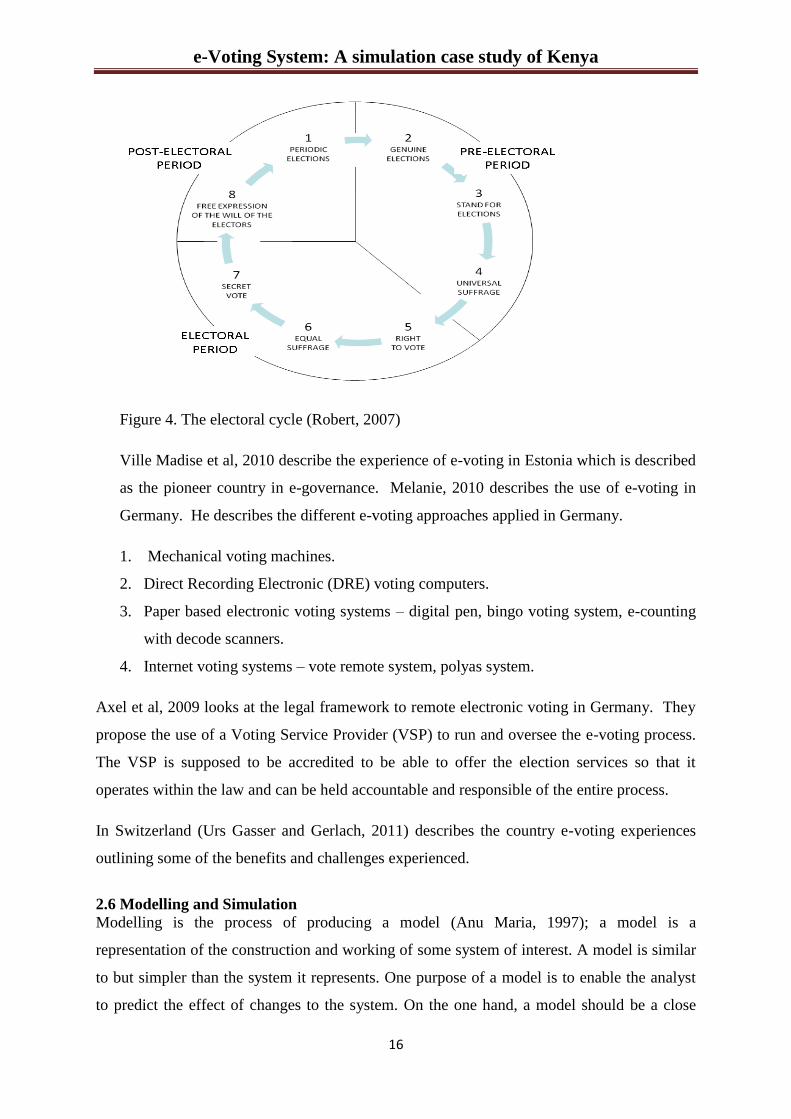
Robert, 2007 gives us a brief history of the development of remote e-voting around the world.
He defines the e-voting as the use of electronic means in at least the casting of the vote. They
consist of eight principles as per the UN agreement on the international covenant on Civil and
Political Rights.
i. Periodic election.
ii. Genuine election.
iii. Stand for election.
iv. Universal suffrage.
v. Voting in election on the basis of the right to vote.
vi. Equal suffrage.
vii. Secret vote
viii. Free expression of the will of the voters.
These principles are grouped into a cycle consisting of three periods.
1. Pre-electoral period – this is the time from calling an election until the actual start of
the polling.
2. Electoral period – this is the actual election day where the vote casting takes place.
3. Post electoral period – this is the time during which the results are announced and a
new election is called.
e-Voting System: A simulation case study of Kenya
16
Figure 4. The electoral cycle (Robert, 2007)
Ville Madise et al, 2010 describe the experience of e-voting in Estonia which is described
as the pioneer country in e-governance. Melanie, 2010 describes the use of e-voting in
Germany. He describes the different e-voting approaches applied in Germany.
1. Mechanical voting machines.
2. Direct Recording Electronic (DRE) voting computers.
3. Paper based electronic voting systems – digital pen, bingo voting system, e-counting
with decode scanners.
4. Internet voting systems – vote remote system, polyas system.
Axel et al, 2009 looks at the legal framework to remote electronic voting in Germany. They
propose the use of a Voting Service Provider (VSP) to run and oversee the e-voting process.
The VSP is supposed to be accredited to be able to offer the election services so that it
operates within the law and can be held accountable and responsible of the entire process.
In Switzerland (Urs Gasser and Gerlach, 2011) describes the country e-voting experiences
outlining some of the benefits and challenges experienced.
2.6 Modelling and Simulation
Modelling is the process of producing a model (Anu Maria, 1997); a model is a
representation of the construction and working of some system of interest. A model is similar
to but simpler than the system it represents. One purpose of a model is to enable the analyst
to predict the effect of changes to the system. On the one hand, a model should be a close
e-Voting System: A simulation case study of Kenya
17
approximation to the real system and incorporate most of its salient features. On the other
hand, it should not be so complex that it is impossible to understand and experiment with it.
A good model is a judicious tradeoff between realism and simplicity. Simulation practitioners
recommend increasing the complexity of a model iteratively. An important issue in modeling
is model validity. Model validation techniques include simulating the model under known
input conditions and comparing model output with system output.
Generally, a model intended for a simulation study is a mathematical model developed with
the help of simulation software. Mathematical model classifications include deterministic
(input and output variables are fixed values) or stochastic (at least one of the input or output
variables is probabilistic); static (time is not taken into account) or dynamic (time-varying
interactions among variables are taken into account). Typically, simulation models are
stochastic and dynamic.
A simulation of a system is the operation of a model of the system. The model can be
reconfigured and experimented with; usually, this is impossible, too expensive or impractical
to do in the system it represents. The operation of the model can be studied, and hence,
properties concerning the behaviour of the actual system or its subsystem can be inferred. In
its broadest sense, simulation is a tool to evaluate the performance of a system, existing or
proposed, under different configurations of interest and over long periods of real time.
Simulation is used before an existing system is altered or a new system built, to reduce the
chances of failure to meet specifications, to eliminate unforeseen bottlenecks, to prevent
under or over-utilization of resources, and to optimize system performance. For instance,
simulation can be used to answer questions like: What is the best design for a new
telecommunications network? What are the associated resource requirements? How will a
telecommunication network perform when the traffic load increases by 50%? How will a new
routing algorithm affect its performance? Which network protocol optimizes network
performance? What will be the impact of a link failure?
There are a number of modelling and simulation methods available which include.
2.6.1 System dynamics

e-Voting System: A simulation case study of Kenya
18
System dynamics is a method created in the mid-1950s by MIT Professor Jay Forrester,
whose original background was in science and engineering. Forrester's idea was to use the
laws of physics, in particular the laws of electrical circuits, to describe and investigate the
dynamics of economic and, later on, social systems. The principles and the modelling
language of system dynamics were formed in the 1950s and early 1960s, and remain
unchanged today. Most of the definitions below are taken from www.systemdynamics.org,
Wikipedia, and the book Business Dynamics by John Sterman.
System dynamics is a method of studying dynamic systems. It suggests that you should:
Take an endogenous point of view. Model the system as a causally closed
structure that itself defines its behaviour.
Discover the feedback loops (circular causality) in the system. Feedback loops are
the heart of system dynamics.
Identify stocks (accumulations) and the flows that affect them. Stocks are the
memory of the system, and sources of disequilibrium.
See things from a certain perspective. Consider individual events and decisions as
"surface phenomena that ride on an underlying tide of system structure and
behaviour.‖ Take a continuous view where events and decisions are blurred.
2.6.2 Discrete event modelling
Discrete event modelling is almost as old as system dynamics. In October 1961, IBM
engineer Geoffrey Gordon introduced the first version of GPSS (General Purpose Simulation
System, originally Gordon's Programmable Simulation System), which is considered to be
the first method of software implementation of discrete event modelling. These days, discrete
event modelling is supported by a large number of software tools, including modern versions
of GPSS itself.
The idea of discrete event modelling method is this: the modeller considers the system being
modelled as a process, i.e. a sequence of operations being performed across entities.
The operations include delays, service by various resources, choosing the process branch,
splitting, combining, and some others. As long as entities compete for resources and can be
delayed, queues are present in virtually any discrete event model. The model is specified
graphically as a process flowchart, where blocks represent operations (there are textual
languages as well, but they are in the minority). The flowchart usually begins with "source"
blocks that generate entities and inject them into the process, and ends with "sink" blocks that
e-Voting System: A simulation case study of Kenya
19
remove entities from the model. This type of diagram is familiar to the business world as a
process diagram and is ubiquitous in describing their process steps. This familiarity is one of
the reasons why discrete event modelling has been the most successful method in penetrating
the business community.
Entities (originally in GPSS they were called transactions) may represent clients, patients,
phone calls, documents (physical and electronic), parts, products, pallets, computer
transactions, vehicles, tasks, projects, and ideas. Resources represent various staff, doctors,
operators, workers, servers, CPUs, computer memory, equipment, and transport.
Service times, as well as entity arrival times, are usually stochastic, drawn from a probability
distribution. Therefore, discrete event models are stochastic themselves. This means that a
model must be run for a certain time, and/or needs a certain number of replications, before it
produces a meaningful output.
The typical output expected from a discrete event model is:
Utilization of resources
Time spent in the system or its part by an entity
Waiting times
Queue lengths
System throughput
Bottlenecks
Cost of the entity processing and its structure
2.6.3 Agent based modelling
Agent based modelling is a more recent modelling method than system dynamics or discrete
event modelling. Until the early 2000s, agent based modelling was pretty much an academic
topic. The adoption of agent based modelling by simulation practitioners started in 2002-
2003. It was triggered by:
Desire to get a deeper insight into systems that are not well-captured by traditional
modelling approaches
Advances in modelling technology coming from computer science, namely object
oriented modelling, UML, and statecharts
Rapid growth of the availability of CPU power and memory (agent based models are
more demanding of both, compared to system dynamics and discrete event models)
Agent based modelling suggests to the modeller yet another way of looking at the system.
e-Voting System: A simulation case study of Kenya
20
You may not know how the system as a whole behaves, what are the key variables
and dependencies between them, or simply don’t see that there is a process flow, but
you may have some insight into how the objects in the system behave individually.
Therefore, you can start building the model from the bottom up by identifying those
objects (agents) and defining their behaviours.
Sometimes, you can connect the agents to each other and let them interact; other
times, you can put them in an environment, which may have its own dynamics. The
global behaviour of the system then emerges out of many (tens, hundreds, thousands,
even millions) concurrent individual behaviours.
There are no standard languages for agent based modelling. The structure of an agent based
model is created using graphical editors or scripts, depending on the software. The behaviour
of agents is specified in many different ways. Frequently, the agent has a notion of state, and
its actions and reactions depend on its state. In such cases, behaviour is best defined with
statecharts. Sometimes, behaviour is defined in the form of rules executed upon special
events. In many cases, the internal dynamics of the agent can be best captured using system
dynamics or discrete event approach. In these cases, we can put a stock and flow diagram or a
process flowchart inside an agent. Similarly, outside agents and the dynamics of the
environment where they live are often naturally modelled using traditional methods. We find
that a large percentage agent based models, therefore, are multi-method models.
2.6.4 Monte Carlo Simulation
Monte Carlo Analysis is a computer-based method of analysis developed in the 1940's that
uses statistical sampling techniques in obtaining a probabilistic approximation to the solution
of a mathematical equation or model.
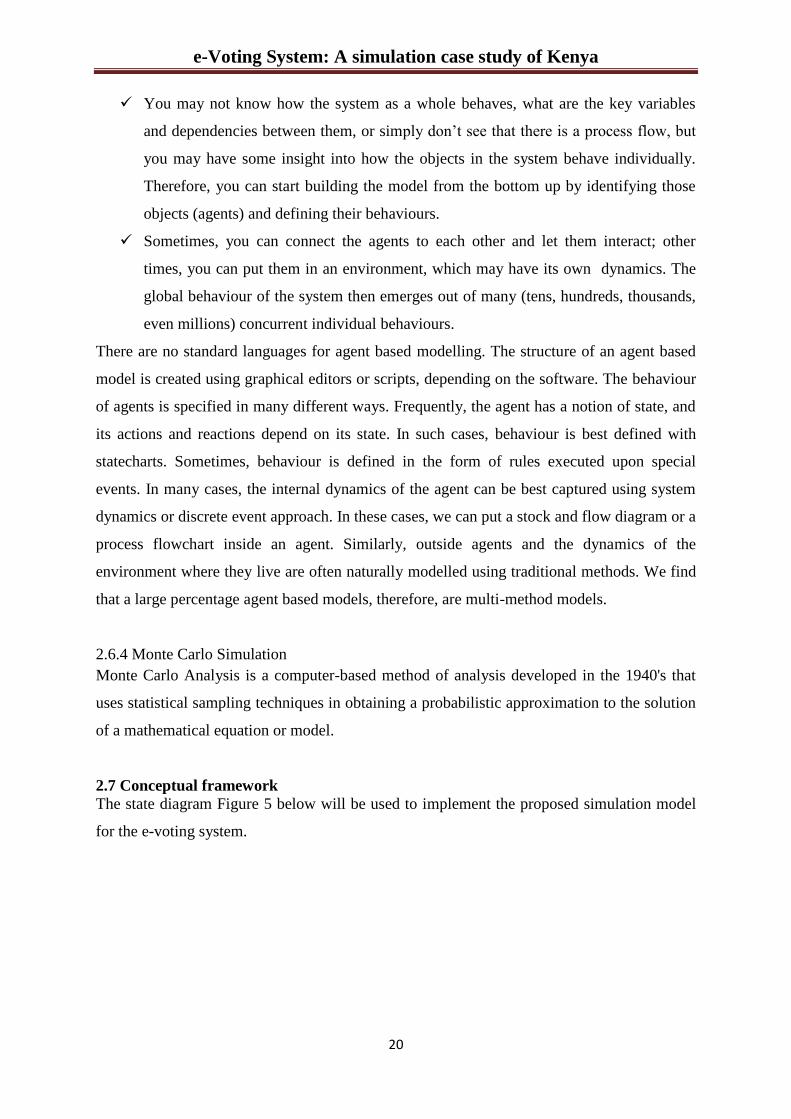
2.7 Conceptual framework
The state diagram Figure 5 below will be used to implement the proposed simulation model
for the e-voting system.

e-Voting System: A simulation case study of Kenya
21
Figure 5: State Diagram of the Proposed Simulation Model
2.8 Summary
The chapter covers the electoral process, voting system: paper ballots; lever voting machines;
punched cards; optical mark sense ballots; direct recording electronic voting system. The e-
voting system is also covered together with related works. The simulation and modelling is
also covered including simulation and modelling methods: system dynamics; discrete event
modelling; agent based modelling; and Monte Carlo simulation. The chapter concludes by
looking at the conceptual framework for the proposed simulation model.
2.9 Research gaps
The following were identified as the major research gaps:
1. Lack of universal protocol that can be used to implement an electronic voting system.
2. Lack of wider acceptability of technology especially in the conduct of an election.
3. Secure infrastructure which has hindered wider implementation and use of electronic
voting systems.

e-Voting System: A simulation case study of Kenya
22
CHAPTER THREE
3.0 RESEARCH METHODOLOGY
3.1 Introduction
This chapter presents the methodology that was used to design the e-voting simulator. It
presents the different requirements for the project report including functional and non
functional requirements. The software and hardware requirements are also listed in this
section that were used in the successfully implementation of the project.
3.2 Data Collection Methods
3.2.1 Sources of Data
The study utilized both primary and secondary data in generating additional facts on the
subject. A set of electoral historical data to demonstrate data mining was sourced from IEBC
in Kenya. Other sources of data included books, published papers, journals and the internet
among other relevant publications.
3.1.2 Data collection Tools
The following data collection methods were used:-
1. Experiments and Direct Observation
A series of experiments were carried out at various stages of the project incorporated with
direct observation of users using existing electoral systems. Users were encouraged to talk
through their actions (either as they perform the task or afterwards) to explain their reasons
for doing things.
Why use Experiments and Direct observation?
This helped the researcher get real time scenario of what was happening on the ground based
on the experimental outcomes.
2. Interviews
Citizens were be interviewed at random to get information from voters’ point of view relating
to the voting process. Employees of electoral commission were also be interviewed
regarding the existing voting systems. Unstructured interviews were used early on in the
process so that the analyst could get to know the user and find out background information.

e-Voting System: A simulation case study of Kenya
23
Structured interviews with pre-set questions were used later on in the process to gather more
detailed and precise information.
Why use interviews?
Interviews allow for verbal responses which allow the respondent room to give out any
suggestions and expectations.
3.2 Data Analysis Methods
The research project was partially base its findings through both quantitative and qualitative
research methods for flexibility and efficiency.
The choice and design of methods was constantly modified based on the progress of the
development phases of the project. Qualitative research methods focused on finding and
building on theories that explain e-voting system.
3.3 Discrete event modelling methodology
The idea of discrete event modelling method was that the modeller considered the system
being modelled as a process, i.e. a sequence of operations being performed across entities. In
discrete event simulation the central assumption was that the system changed instantaneously
in response to certain discrete events.
Figure 6: Simulation Study Schematic (Anu Maria, 1997)
e-Voting System: A simulation case study of Kenya
24
Figure 4 is a schematic of a simulation study. The iterative nature of the process was
indicated by the system under study becoming the altered system which then becomes the
system under study and the cycle repeats. In a simulation study, human decision making was
required at all stages, namely, model development, experiment design, output analysis,
conclusion formulation, and making decisions to alter the system under study. The only stage
where human intervention was not required was the running of the simulations, which the
simulation software packages perform efficiently.
The following steps were followed when developing a simulation model, designing a
simulation experiment, and performing simulation analysis:
Step 1. Identify the problem.
Step 2. Formulate the problem.
Step 3. Collect and process real system data.
Step 4. Formulate and develop a model.
Step 5. Validate the model.
Step 6. Document model for future use.
Step 7. Select appropriate experimental design.
Step 8. Establish experimental conditions for runs.
Step 9. Perform simulation runs.
Step 10. Interpret and present results.
Step 11. Recommend further course of action.
3.3.1 Why Discrete event modelling methodology
According to (Anu Maria, 1997) Discrete event simulation is less detailed (coarser in its
smallest time unit) than continuous simulation but it is much simpler to implement.
According to (L. Williams, 2007), software development often has too much change during
the time that the team is developing the product to be considered a defined process. L.
Williams (2007) further states that a set of predefined steps may not lead to a desirable,
predictable outcome because software development is a decidedly human activity:
requirements change, technology changes, people are added and taken off the team, and so
on.
e-Voting System: A simulation case study of Kenya
25
Basing on the fact that e-voting technology is still evolving with many applications being
developed, technological changes at some stages may lead to reviews in the proposed system
architectures to meet the changes.
3.3.2 Limitations of the Methodology
E-voting technologies being a relatively new area, the following challenges were experienced
in the course of the project development:-
1. Access to previously designed systems.
2. Learning and understanding electoral systems.
However, these challenges were mitigated by expounding the literature review with constant
consultations with the supervisor. Discrete event simulation methodology was used to bridge
any emerging gaps noticed during the development phase. Usability testing and evaluation
was also be employed constantly to help detect and solve any usability related aspects of the
system.
3.4 Hardware and Software Requirements
1. Hardware Requirements
Laptop with a minimum of 256 MB RAM and 200 MB disk space
2. Software Requirements
i. FLEXSIM software
FLEXSIM models is easy-to-use and provides endless opportunities to explore by
asking "what if," and watching what happens, inspiring the exciting ah-ha
moments of learning.
ii. Tortuga (software)
Tortuga is a software framework for discrete event simulation in Java. A Tortuga
simulation can be written either as interacting processes or as scheduled events. A
Tortuga simulation can have thousands of entities, and can be part of a larger Java
system.
iii. Microsoft Windows™ XP/Vista/7/8

e-Voting System: A simulation case study of Kenya
26
CHAPTER FOUR
4.0 E-VOTING SYSTEM ANALYSIS, DESIGN AND IMPLEMENTATION
4.1 Introduction
The chapter covers the requirement specification and the design and implementation of a
simulator for the e-voting system.
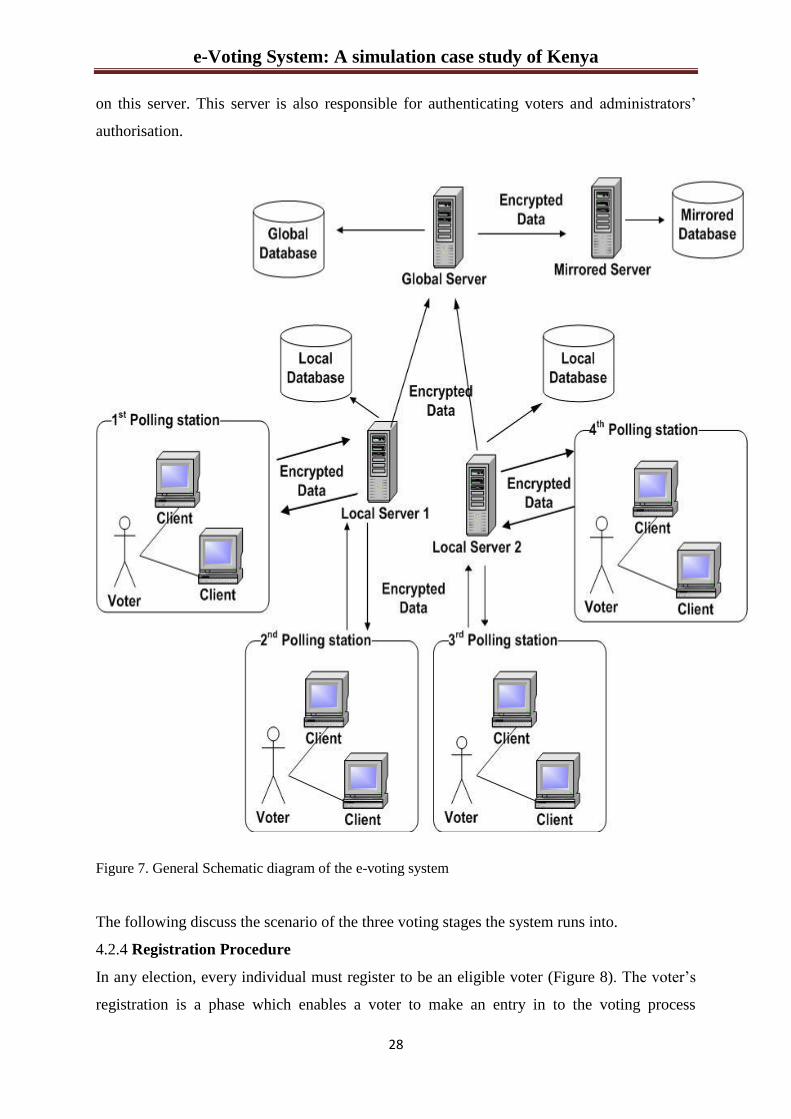
4.2 The E-Voting System Architecture
The system is subdivided into three modules: Registration phase, Voting phase and Counting
phase (Figure 7). There are mainly three different servers: Local Server, Global Server, and
Mirrored Server. Local Server performed three roles for three different processes. The three
roles include Administrator, Validator, and Counter. The Global Server received information
from different Local Servers and kept the record for future execution. The Mirrored Server is
mainly used in case of any loss of data or further verification purpose.
Client Machine: The Client program performed the functions on behalf of the voter. These
functions include exchanging messages with the servers, processing user input and
performing necessary cryptographic transformations.
Server: The cryptographic operation as well as the biometric authentication was done by the
server. Both the Registration process and Voting process were controlled by Administrator
Server and Counter Server.
Administrator: During Registration process the Administrator maintained the records of all
the voters who were eligible for voting. It also generates public-private key-pair
corresponding to each voter. A database for generating the unique Voter ID number for each
candidate was also maintained by the Administrator. During Voting, it checks whether the
person had already registered or not. It also checked whether the person was the eligible voter
or not by using the biometric of the person. It maintained the voting records of each voter
who cast the vote successfully. It also maintained the Candidate list for each region.
Validator: The main task of Validator was to keep voting record of those entire candidates
who casted the vote successfully.
Counter: The Counter server was responsible for collecting the valid votes and counting the
votes corresponding to each candidate.
e-Voting System: A simulation case study of Kenya
27
4.2.1 Client tier
The client tier is made up of the following components:
i. Mobile terminal voters and the mobile network operator: SMS voting is done through
mobile terminals. Communication between the mobile terminals and the SMS server
is through GPRS which is provided by the GSM network provider.
ii. Remote clients’ computers: Remote internet voting is done on the clients’ computers
(equipped with fingerprint reader) in locations outside the poll sites. The clients’
computers connect to the web server to load the web application over the internet via
HTTP. The e-vote is sent to the poll site server via TCP/IP (socket programming and
.NET remoting). A RSA encryption algorithm was implemented to secure end to end
messaging.
iii. Registration Centre and Poll Site Computers: The Registration Centre/Poll Site
Computers in practice should be special-purpose computers for voters’ registration
and poll site voting. Communication between the Registration Centre/Poll Site
Computers and the Poll site server is by TCP/IP (socket programming and .NET
remoting). A RSA encryption algorithm was implemented to secure end to end
messaging.
4.2.2 Application server tier
The application server tier is made up of:
i. The SMS sever which interacts with voters that use their mobile telephone set and the
SMS messaging service to access the e-voting system. At the lowest level, the SMS
server interfaces to GSM modem(s) that receive voters’ SMS messages through a
SMS service provider (mobile operator).
ii. The web server which interfaces the e-voting system to web voters. In addition, it
stores the different web page(s) containing the code required to interact with the user
as well as the database system.
iii. The poll site server which interfaces the e-voting system to the electorates during
registration and poll site voting.
4.2.3 Database server tier
Database server is the core service for storing, processing and securing data. The database
server provides controlled access and rapid transaction processing to meet the requirements
of the client tier. The voters’ records, candidates’ record and election results database resides
e-Voting System: A simulation case study of Kenya
28
on this server. This server is also responsible for authenticating voters and administrators’
authorisation.
Figure 7. General Schematic diagram of the e-voting system
The following discuss the scenario of the three voting stages the system runs into.
4.2.4 Registration Procedure
In any election, every individual must register to be an eligible voter (Figure 8). The voter’s
registration is a phase which enables a voter to make an entry in to the voting process

e-Voting System: A simulation case study of Kenya
29
Security Conscious E-Voting and generates an authentication id for casting vote later on. The
steps necessary for registration procedure is described below:
i) First of all, the user has to bring all his documents which are manually verified by the
polling agents.
ii) If the documents are verified, then the system checks the registration status of the
particular user and gives permission for further registration.
iii) In the next step, all his details will be entered into the system and checks the age
status.
iv) If eligible, the user is prompt to provide his fingerprint into the system.
v) System also captures the user’s photo.
vi) Now, all the information’s are send in an encrypted form to the server which keeps a
record for every individual and generates a unique Public-Private key pair which
is also maintained into the database.
vii) Finally a unique Voter ID no. is generated corresponding to every individual. The
user is provided with a card which stores the necessary information necessary for
voting process along with the Public key embedded into it. Finally, the registration
procedure is over and the Administrator server maintains a record of all the
individuals who have registered successfully for further process.
viii)

e-Voting System: A simulation case study of Kenya
30
Figure 8. Flowchart representation of Registration Process
4.2.5 Voting Procedure
After the registration process is over, next comes the main task i.e. the Voting procedure
which involves the participation of the voter in giving their choices for formation of the
government (Figure 9). The steps are described below:
i) The user shows the ID card given during registration process. The system captures the
Voter Identification number and checks whether this number is already registered
or not.
ii) If registered, then the system checks the voting status of that individual. If the voting
status is false, then the user is asked to provide his/her fingerprint.
iii) If the fingerprint is matched then the system recognizes that the individual is an
authentic voter and he/she is then provided with a unique vote ballot. The ballot is
depended on the location or area of the voter.
iv) Next the voter cast the vote according to his choice only once corresponding to his
favourite candidate.
v) The vote along with Voter Identification number and location is then send in an
encrypted form to the Administrator server who maintains a separate record of all
the votes along with voter authentication number and location. The information is
encrypted with voter’s Public key which is decrypted only by his Private key and
the information of key is known by the Administrator only.
vi) The voting status along with VI no. is also been updated in Validator’s database for
future verification.
vii) The vote received by Administrator after decryption consists only a serial no. which is
then send to the Counter server by encrypting with Counter’s Public key.
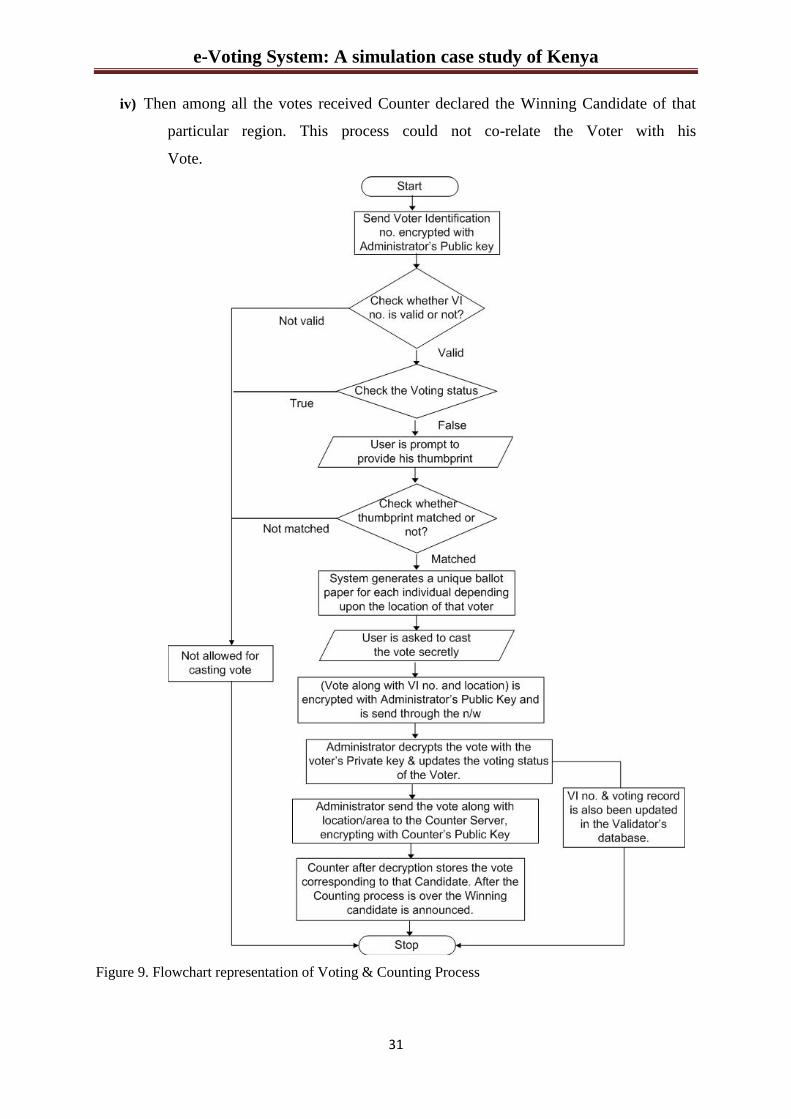
4.2.6 Tallying Procedure
The Counting procedure of the present e-Voting system includes the following steps (Figure
9):
i) Counter after receiving the vote, decrypts it with its Private Key and receives the
Serial number.
ii) The serial no. corresponds to a particular Candidate of that location, which is
maintained by Counter server.
iii) It then updates the voting record of that particular Candidate for whom the vote has
been cast.
e-Voting System: A simulation case study of Kenya
31
iv) Then among all the votes received Counter declared the Winning Candidate of that
particular region. This process could not co-relate the Voter with his
Vote.
Figure 9. Flowchart representation of Voting & Counting Process
e-Voting System: A simulation case study of Kenya
32
4.3 Voting Requirements
As in any conventional election, there are a certain number of requirements that must be
implemented. In this system the focus will be on the following requirements, which depend
strongly on the model for the voting system:
i) Accuracy: There should not be possible to alter a vote, to eliminate a valid vote or to
count an invalid one.
ii) Democracy: Each valid voter has the right to cast one, and only one, valid vote.
iii) Privacy: The voter, or anyone else, cannot prove which choice was made.
iv) Verifiability: There should be possibly to independently recount the votes.
v) Mobility: A voter should be able to vote independently from his location. The system
must be aware of voter origin which may imply different electoral
circumscriptions.
vi) Auditability: The voting system should be validated by external observers.
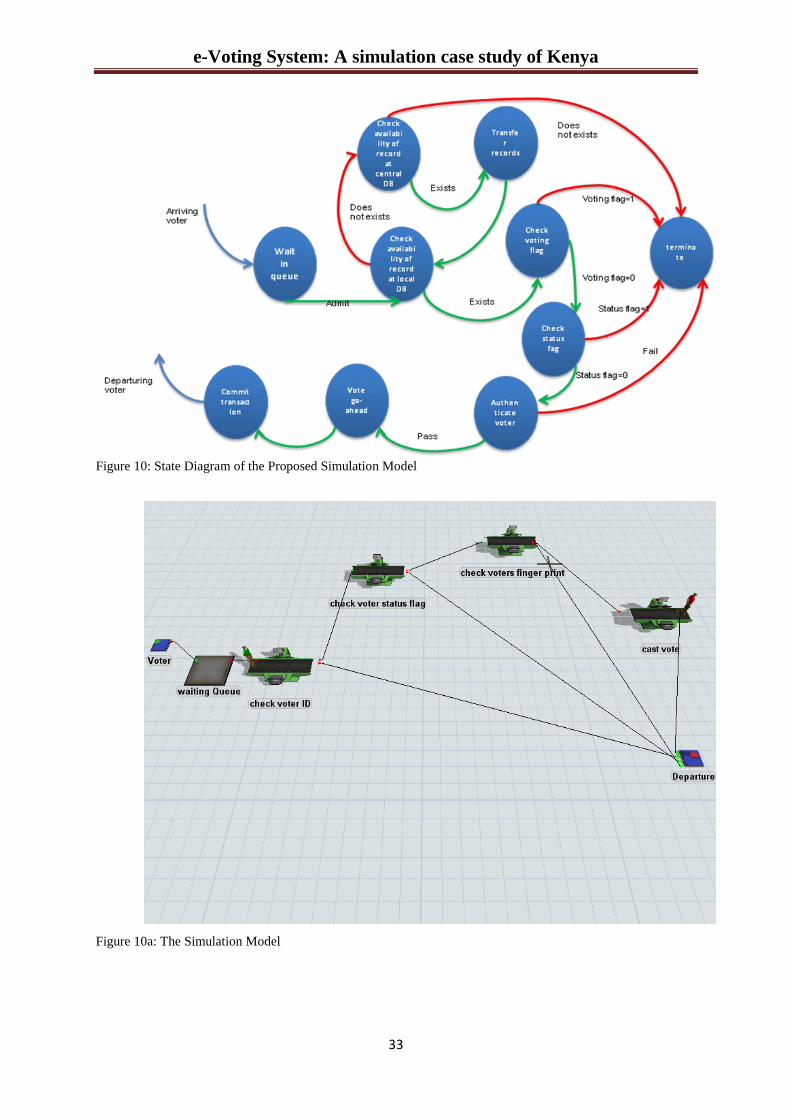
4.4 The e-Voting Simulation model
The voting process is shown in the state diagram of Figure (10). The simulations were
averaged over five voting runs. This is particularly important because the model entails
several random factors. The simulator, also, includes modules which emulate the arrival of
voters at voting centers and the voting process itself.
The simulator allows a voter to cast a vote at any voting center, irrespective of his actual
voting county (locality). This is one of the main advantages of an online e-Voting system. We
have conducted a fairly large number of simulations of the proposed voting system, taking
the number of voters over a sample range starting at 2000 voters per voting center and ending
at 30,000 voters per voting center. We realize that the number of voters in a given locality
may be much larger than the numbers we used in the simulator. However, the simulation
results are fairly scalable where the simulation model is capable of modelling fairly large
number of voters. We fixed the number of voters at a given voting center in the simulator.
Although in reality, this number may vary by a small percentage due to the fact that people
will be allowed to vote at any other center they choose for the sake of voting convenience,
especially those voters residing at townships outside their voting county, or those voters
casting their votes through embassies away from their home county/ies.
e-Voting System: A simulation case study of Kenya
33
Figure 10: State Diagram of the Proposed Simulation Model
Figure 10a: The Simulation Model

e-Voting System: A simulation case study of Kenya
34
4.5 Analysis options
4.5.1 Performance Metric
Simply minimizing total expected waiting time across all polling stations is insufficient as
this may allow long voter waiting times in some polling stations in order to decrease voter
waiting time in other polling stations. This is undesirable in an election process as we seek to
provide equity to all voters so that no one particular group of voters is disadvantaged or
disenfranchised. However, there is no universal way to interpret ―equity.‖ The ideal case is
that the expected waiting time in queue at every polling station is the same. But it is generally
not feasible to achieve this ideal situation. Therefore, the following metric (the average
absolute differences of expected waiting times among polling station) can be used as a proxy
for ―equity:‖
Z(X) = Wi(xi)-Wj(xj)│/(N(N -1)/2);
(where N is defined as the total number of voting polling station, X = (x1,x2, ...,xN)’, xi (i =
1,...,N) is the number of voting machines allocated to polling station i, and Wi(xi) (i = 1,...,N)
is the expected waiting time for voters at polling station i. Thus, the allocations that provide
the best ―equity‖ are the global optimal solutions to the following optimization problem:
Min{Z(X) │X }
where is the set of feasible solutions, and │ │ is finite.
4.5.2 Simulation Model vs. Analytical Model
One of the most difficult problems in dealing with voting queues is that voters do not arrive
according to a stationary arrival process. Moreover, steady-state may not be achieved in an
actual election where voting occurs over a single day and queues begin empty. Analytical
queuing models require strong simplifying assumptions (such as stationary arrivals, steady-
state queues, etc.) about the voting system. These models enable us to obtain insights and
generate metrics such as expected waiting times very quickly without dedicated simulation
software. Moreover, closed-form queueing-model formulas can be used in conjunction with
optimization models to determine optimal policy decisions. As an example of the insights
offered by such models for this application, an integer-programming-based solution method
for this problem using M/M/s closed-form queueing equations shows that voter equity may
be compromised if all available voting machines are allocated. The optimal solution to
maximize voter equity in some scenarios is to not allocate all available voting machines.

e-Voting System: A simulation case study of Kenya
35
While this is an interesting, and potentially useful, insight, solving realistically sized
problems through an integer program is not generally feasible. Thus, our solution methods
described in this paper rely on simulation and heuristic search techniques. Because of the
short time frame of an actual election day, analytical results for the voting-machine-allocation
problem require transient queueing analysis with non-stationary arrivals. Obtaining transient
information is generally considered much more complicated in comparison to a steady state
analysis (e.g., Houdt and Blondia 2005). Roughly speaking, two main approaches have been
developed to obtain transient distributions. The first method relies on numerically inverting
the Laplace transform or generating function involved (Choudhury, Lucantoni, and Whitt
1994; Hofkens, Spaey, and Blondia 2004; Lucantoni, Choudhury, and Whitt 1994). The
second method is based on recursive computations. Others (Ny and Sericola 2003; Lee and Li
1990) combine uniformization techniques to reduce the problem to discrete time and
afterward apply a recursive algorithm. Although these methods are effective in obtaining
transient distributions related to the initial system behaviour, their computational costs grow
rapidly when considering later events. Moreover, most of the literature considers only single-
server queues. Such limitations of the current analytical results on transient queues weakens
the advantages of analytical models, which become more difficult to implement and needs
more computational time to obtain results. Thus, it is natural to turn to stochastic simulation,
with its lesser reliance on simplifying assumptions that might render the model questionable
in terms of validity. However, we then need to apply proper statistical design and analysis
methods in order to deal with uncertainty in the output, and to enable valid and precise
conclusions.
4.6 Simulation Analysis
4.6.1 Description of Basic Polls Queueing Model
4.6.1.1 Model Logic
Our simulation model provides the expected waiting time in each polling station for a given
number of assigned voting machines. The numbers of DRE voting machines assigned to each
polling station are our decision variables. On election day, all polling stations open at 6:00
am and close at 6:00 pm. Once a voter arrives to his or her designated polling station, the
voter joins a single queue until there is a DRE voting machine available. There are multiple
DRE voting machines per polling station. We assume that all DRE voting machines are
identical and shared by all voters within a polling station.
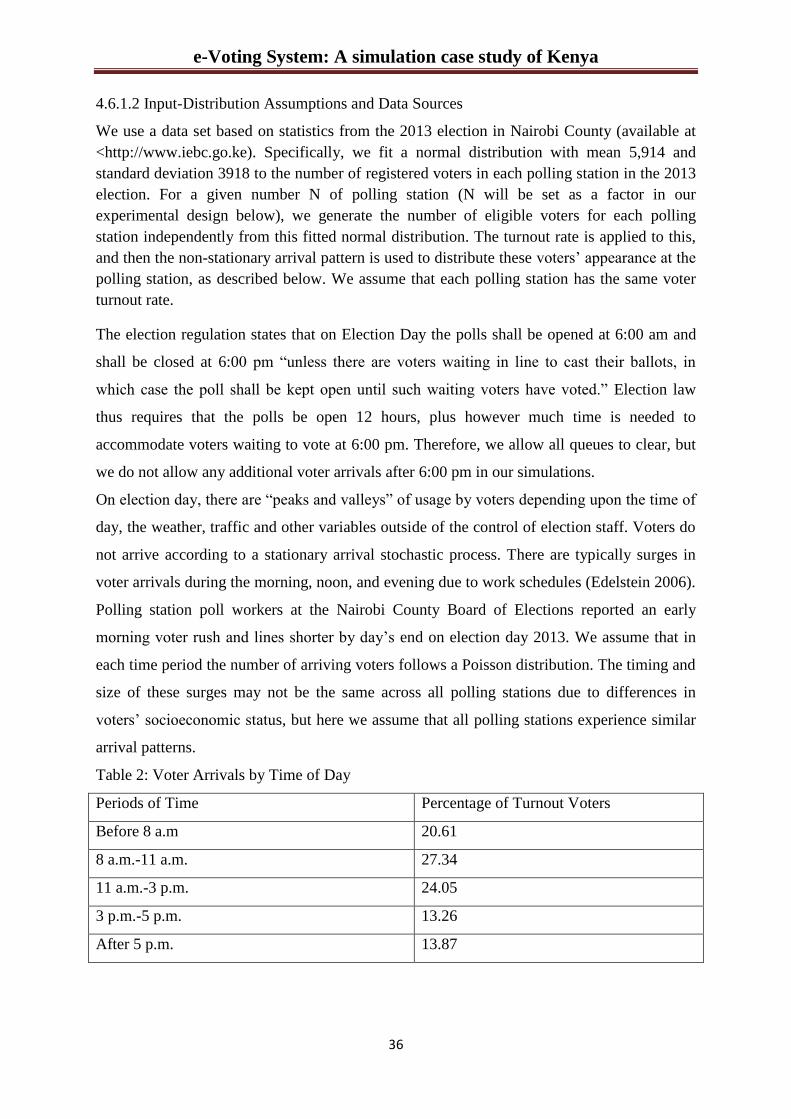
e-Voting System: A simulation case study of Kenya
36
4.6.1.2 Input-Distribution Assumptions and Data Sources
We use a data set based on statistics from the 2013 election in Nairobi County (available at
<http://www.iebc.go.ke). Specifically, we fit a normal distribution with mean 5,914 and
standard deviation 3918 to the number of registered voters in each polling station in the 2013
election. For a given number N of polling station (N will be set as a factor in our
experimental design below), we generate the number of eligible voters for each polling
station independently from this fitted normal distribution. The turnout rate is applied to this,
and then the non-stationary arrival pattern is used to distribute these voters’ appearance at the
polling station, as described below. We assume that each polling station has the same voter
turnout rate.
The election regulation states that on Election Day the polls shall be opened at 6:00 am and
shall be closed at 6:00 pm ―unless there are voters waiting in line to cast their ballots, in
which case the poll shall be kept open until such waiting voters have voted.‖ Election law
thus requires that the polls be open 12 hours, plus however much time is needed to
accommodate voters waiting to vote at 6:00 pm. Therefore, we allow all queues to clear, but
we do not allow any additional voter arrivals after 6:00 pm in our simulations.
On election day, there are ―peaks and valleys‖ of usage by voters depending upon the time of
day, the weather, traffic and other variables outside of the control of election staff. Voters do
not arrive according to a stationary arrival stochastic process. There are typically surges in
voter arrivals during the morning, noon, and evening due to work schedules (Edelstein 2006).
Polling station poll workers at the Nairobi County Board of Elections reported an early
morning voter rush and lines shorter by day’s end on election day 2013. We assume that in
each time period the number of arriving voters follows a Poisson distribution. The timing and
size of these surges may not be the same across all polling stations due to differences in
voters’ socioeconomic status, but here we assume that all polling stations experience similar
arrival patterns.
Table 2: Voter Arrivals by Time of Day
Periods of Time Percentage of Turnout Voters
Before 8 a.m 20.61
8 a.m.-11 a.m. 27.34
11 a.m.-3 p.m. 24.05
3 p.m.-5 p.m. 13.26
After 5 p.m. 13.87

e-Voting System: A simulation case study of Kenya
37
Election law states that voters are allowed up to five minutes to place their vote (Anthony et
al. 2004). However, anecdotal evidence suggests that this law is rarely, if ever, enforced.
Actual voter service times will depend on the length of the ballot - in particular, the number
of issues on the ballot, which generally require the most time for voters to read and on which
to make a choice.
For now, we assume that voting machines are perfectly reliable (i.e., there are no voting-
machine failures). We also assume that all available voting machines must be allocated to
polling station as this is often the policy used in practice, and will reduce the system-wide
voter wait time.
4.6.2 The Greedy Improvement Algorithm
4.6.2.1 Algorithm Description
We use a heuristic solution method to allocate voting machines to polling station. Our
method combines a simple greedy heuristic to reduce expected voter wait times with a local
improvement search where we use (1) as our objective function. We refer to this solution
method as the greedy improvement algorithm (GIA), which consists of two phases: Phase I is
a simple greedy heuristic and Phase II is a local improvement search.
Phase I: The simple greedy heuristic iteratively allocates a voting machine to the polling
station with the largest estimated expected waiting time. The steps are as follows,
Step 1. Assign initial values to xi for each polling station i (usually we set xi = 1 for all i).
Set Counter =
Step 2. Let xi = xi+1 for the polling station i with the largest estimated expected waiting time
in queue, Wi(xi).
Step 3. Counter = Counter + 1.
Step 4. If Counter = N, stop. Otherwise, go to step 2.
Phase II: To improve the performance of the simple greedy heuristic, we introduce a local
search component, which is shown as follows.
Step 1: Set the allocation obtained in Phase I as the initial allocation, X0 = (x01,x02, ...,x0N)’.
Let X* = X0, and Z(X
*) = Z(X0), where Z(X) is given by (1).
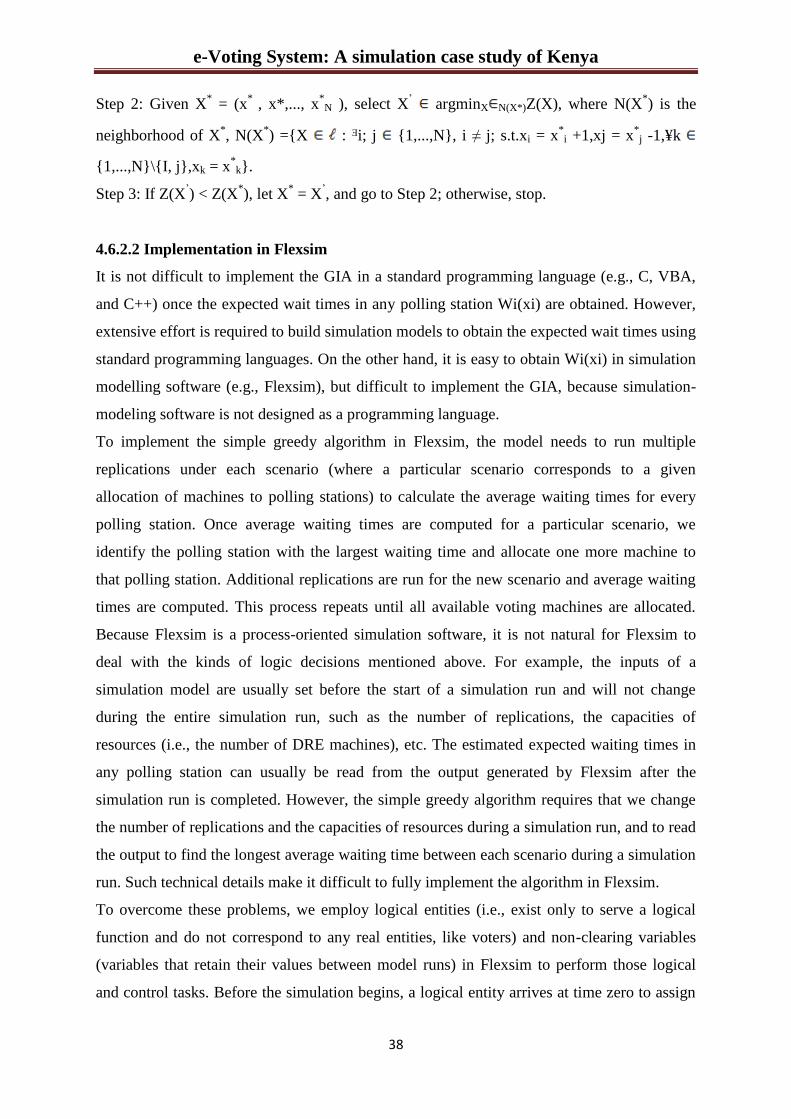
e-Voting System: A simulation case study of Kenya
38
Step 2: Given X* = (x
* , x*,..., x
*N ), select X
’ argminX N(X*)Z(X), where N(X
*) is the
neighborhood of X*, N(X
*) ={X : ᴲi; j {1,...,N}, i ≠ j; s.t.xi = x
*i +1,xj = x
*j -1,¥k
{1,...,N}\{I, j},xk = x*k}.
Step 3: If Z(X’) < Z(X
*), let X
* = X
’, and go to Step 2; otherwise, stop.
4.6.2.2 Implementation in Flexsim
It is not difficult to implement the GIA in a standard programming language (e.g., C, VBA,
and C++) once the expected wait times in any polling station Wi(xi) are obtained. However,
extensive effort is required to build simulation models to obtain the expected wait times using
standard programming languages. On the other hand, it is easy to obtain Wi(xi) in simulation
modelling software (e.g., Flexsim), but difficult to implement the GIA, because simulation-
modeling software is not designed as a programming language.
To implement the simple greedy algorithm in Flexsim, the model needs to run multiple
replications under each scenario (where a particular scenario corresponds to a given
allocation of machines to polling stations) to calculate the average waiting times for every
polling station. Once average waiting times are computed for a particular scenario, we
identify the polling station with the largest waiting time and allocate one more machine to
that polling station. Additional replications are run for the new scenario and average waiting
times are computed. This process repeats until all available voting machines are allocated.
Because Flexsim is a process-oriented simulation software, it is not natural for Flexsim to
deal with the kinds of logic decisions mentioned above. For example, the inputs of a
simulation model are usually set before the start of a simulation run and will not change
during the entire simulation run, such as the number of replications, the capacities of
resources (i.e., the number of DRE machines), etc. The estimated expected waiting times in
any polling station can usually be read from the output generated by Flexsim after the
simulation run is completed. However, the simple greedy algorithm requires that we change
the number of replications and the capacities of resources during a simulation run, and to read
the output to find the longest average waiting time between each scenario during a simulation
run. Such technical details make it difficult to fully implement the algorithm in Flexsim.
To overcome these problems, we employ logical entities (i.e., exist only to serve a logical
function and do not correspond to any real entities, like voters) and non-clearing variables
(variables that retain their values between model runs) in Flexsim to perform those logical
and control tasks. Before the simulation begins, a logical entity arrives at time zero to assign

e-Voting System: A simulation case study of Kenya
39
a current allocation of voting machines from a non-clearing vector variable of number of
machines, i.e., to assign the resource capacities accordingly for this scenario. (Non-clearing
means that values are retained between replications, not Flexsim’s default since one generally
wants to clear statistics between replications, but we need Arena to retain some variable
values across runs in order to implement the GIA.) The total number of machines allocated in
this scenario is also calculated.
Actual simulation of the voting day for all polling stations is built in a general and scalable
way. To change the number of polling stations in the model, we need only to modify the
Data/Spreadsheet modules in the Flexsim Basic Process and Advanced Process panels; no
other parts of the model needs to be modified, nor does its topological structure. The Flexsim
output can only be generated after the entire simulation is finished. We cannot use it to find
the longest waiting time in each scenario during a simulation run. We set up specific
procedures to calculate the average waiting time for every polling station in the model and
assign those values to a vector variable. At the end of each replication, another logical entity
arrives. At the conclusion of the final replication the logical entity identifies the polling
station with the longest waiting time from the vector variable of average waiting times, and
adds a machine to that polling station. Then the logical entity checks whether there are still
more machines available to allocate. If so, the internal Flexsim variable for the total number
of replications is increased by a set value to force Flexsim into running additional
replications; if not, the simulation terminates.
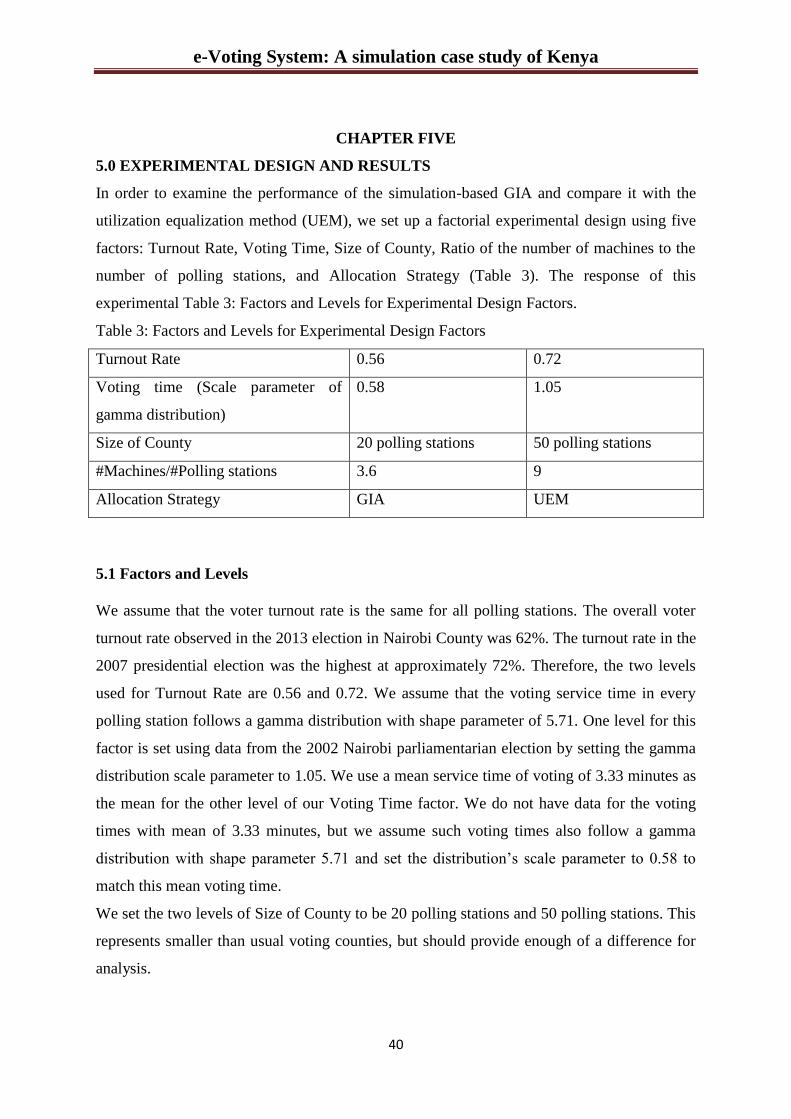
e-Voting System: A simulation case study of Kenya
40
CHAPTER FIVE
5.0 EXPERIMENTAL DESIGN AND RESULTS
In order to examine the performance of the simulation-based GIA and compare it with the
utilization equalization method (UEM), we set up a factorial experimental design using five
factors: Turnout Rate, Voting Time, Size of County, Ratio of the number of machines to the
number of polling stations, and Allocation Strategy (Table 3). The response of this
experimental Table 3: Factors and Levels for Experimental Design Factors.
Table 3: Factors and Levels for Experimental Design Factors
Turnout Rate 0.56 0.72
Voting time (Scale parameter of
gamma distribution)
0.58 1.05
Size of County 20 polling stations 50 polling stations
#Machines/#Polling stations 3.6 9
Allocation Strategy GIA UEM
5.1 Factors and Levels
We assume that the voter turnout rate is the same for all polling stations. The overall voter
turnout rate observed in the 2013 election in Nairobi County was 62%. The turnout rate in the
2007 presidential election was the highest at approximately 72%. Therefore, the two levels
used for Turnout Rate are 0.56 and 0.72. We assume that the voting service time in every
polling station follows a gamma distribution with shape parameter of 5.71. One level for this
factor is set using data from the 2002 Nairobi parliamentarian election by setting the gamma
distribution scale parameter to 1.05. We use a mean service time of voting of 3.33 minutes as
the mean for the other level of our Voting Time factor. We do not have data for the voting
times with mean of 3.33 minutes, but we assume such voting times also follow a gamma
distribution with shape parameter 5.71 and set the distribution’s scale parameter to 0.58 to
match this mean voting time.
We set the two levels of Size of County to be 20 polling stations and 50 polling stations. This
represents smaller than usual voting counties, but should provide enough of a difference for
analysis.

e-Voting System: A simulation case study of Kenya
41
We set the two level of Ratio of the number of machines to the number of polling stations to
3.6 and 9 to match observed average allocation values in the 2007 and 2013 elections,
respectively, in one particular county in Kenya. To obtain the allocations for each treatment
combinations of Turnout Rate, Service Time, Size of County and Ratio of the number of
machines to the number of polling stations, we run the GIA in Flexsim. We use 50
replications for each scenario so that the 95% confidence-interval half width will be less than
10% of the average waiting time in a polling station. UEM is based on M/M/s queues and
implemented in Microsoft Excel, which can easily find the machine allocations for each
treatment combination of the other four factors.
There are 25 = 32 design points in total (Table 4). We run 100 replications for each design
point, which satisfied our requirement that the 95% confidence-interval half widths are less
than 5% of the average values of the response. Different random number streams are used for
different design points to ensure that the design points are independent.
5.2 Results
The results of the factorial experimental design (Table 4) show that the GIA statistically
significantly outperforms the UEM in 14 out of 16 different treatment combinations of the
other four factors, ties in one scenario (Turnout Rate = 0.56, Scale Parameter = 1.05, Size of
County = 20 polling stations and Ratio of the number of machines to the number of polling
stations = 3.6), and underperforms UEM in a single scenario (Turnout Rate = 0.72, Scale
Parameter = 1.05, Size of County = 20 polling stations and Ratio of the number of machines
to the number of polling stations = 3.6). Figure 10 shows the scenario with Turnout Rate =
0.72, Scale Parameter = 1.05, Size of County = 50 polling stations and Ratio of the number of
machines to the number of polling stations = 3.6. It displays 95% confidence intervals and the
range of the response values against the allocations provided by the GIA and the UEM. It
clearly shows that the GIA is statistically significantly better in this scenario.
In the only scenario where the GIA underperforms, the average absolute differences of
waiting times across all polling stations is 78.73 minutes for the allocation provided by the
Greedy Improvement Algorithm, only 3 minutes more than the average absolute differences
of waiting times across all polling stations for the allocation provided by the UEM. Thus,
generally speaking, GIA generates better allocations than the UEM.
Figures 11 to 14 contain interaction plots of Allocation Strategy vs. the other four factors (on
horizontal axes) respectively, where the ―equity‖ metric (given in (1)) is on vertical axes.
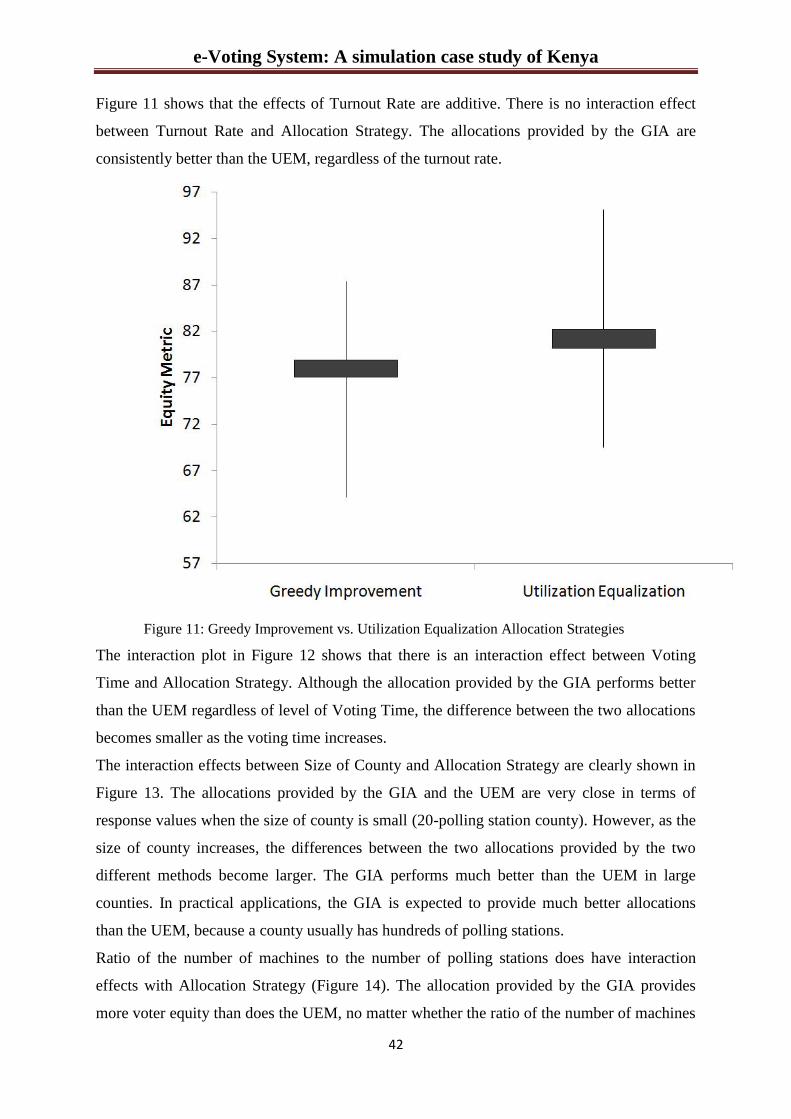
e-Voting System: A simulation case study of Kenya
42
Figure 11 shows that the effects of Turnout Rate are additive. There is no interaction effect
between Turnout Rate and Allocation Strategy. The allocations provided by the GIA are
consistently better than the UEM, regardless of the turnout rate.
Figure 11: Greedy Improvement vs. Utilization Equalization Allocation Strategies
The interaction plot in Figure 12 shows that there is an interaction effect between Voting
Time and Allocation Strategy. Although the allocation provided by the GIA performs better
than the UEM regardless of level of Voting Time, the difference between the two allocations
becomes smaller as the voting time increases.
The interaction effects between Size of County and Allocation Strategy are clearly shown in
Figure 13. The allocations provided by the GIA and the UEM are very close in terms of
response values when the size of county is small (20-polling station county). However, as the
size of county increases, the differences between the two allocations provided by the two
different methods become larger. The GIA performs much better than the UEM in large
counties. In practical applications, the GIA is expected to provide much better allocations
than the UEM, because a county usually has hundreds of polling stations.
Ratio of the number of machines to the number of polling stations does have interaction
effects with Allocation Strategy (Figure 14). The allocation provided by the GIA provides
more voter equity than does the UEM, no matter whether the ratio of the number of machines

e-Voting System: A simulation case study of Kenya
43
to the number of polling stations is small or large. However, a large amount of available
machines will compromise the advantages of the allocation generated by the GIA over the
UEM.

e-Voting System: A simulation case study of Kenya
44
CHAPTER SIX
6.0 SUMMARY, CONCLUSIONS AND RECOMMENDATIONS
Providing equitable voting experiences across voting polling stations is noted as an important
goal in elections. We seek to provide equity to all voters so that no one particular group of
voters is disadvantaged or disenfranchised. The average absolute difference of waiting times
across all polling stations is proposed in this project as a performance metric for ―equity.‖ To
deal with non-stationary voter arrivals and transient queues, we propose a simulation-based
greedy improvement algorithm to generate machine allocations to provide increased voter
equity. It is statistically shown that this heuristic outperforms the utilization equalization
method for allocating voting machines.
Turnout rate and time required by voters to cast their ballot are two factors in the voting
system that are essentially impossible to control. Our experimental results indicate that our
greedy improvement algorithm generates better machine allocations in terms of voter equity
than does the utilization equalization method, regardless of turnout rate and voting time
values.
Our results indicate that the size of a county affects the performance of machine allocation
policies. The more voting polling stations in a county, the better the allocation generated by
the greedy improvement algorithm performs in comparison to the utilization equalization
method. Not surprisingly, a large amount of available machines reduces the advantages of the
greedy improvement algorithm. As the number of available machines becomes very large, the
average voter waiting time approaches zero. In such a case, the allocation method used is
inconsequential. Increasing the number of DRE machines is always recommended when
feasible to reduce overall system voter wait times. However, analytical results suggest that
voter equity can be maximized by not allocating all available machines in some scenarios.
Table 4: Factors and Levels for Experimental Design
Design Points Turnout
Rate
Scale
Parameter
Size of
County(#
Polling
stations)
#Machines/
#Polling
stations
Allocation
Strategy
Equity
Metric
1 0.56 0.583 20 3.6 GIA 5.474
2 0.72 0.583 20 3.6 GIA 20.792
3 0.56 1.05 20 3.6 GIA 61.571
4 0.72 1.05 20 3.6 GIA 78.728

e-Voting System: A simulation case study of Kenya
45
5 0.56 0.583 50 3.6 GIA 6.501
6 0.72 0.583 50 3.6 GIA 23.679
7 0.56 1.05 50 3.6 GIA 62.02
8 0.72 1.05 50 3.6 GIA 77.99
9 0.56 0.583 20 9 GIA 0.007
10 0.72 0.583 20 9 GIA 0.02
11 0.56 1.05 20 9 GIA 0.334
12 0.72 1.05 20 9 GIA 2.01
13 0.56 0.583 50 9 GIA 0.007
14 0.72 0.583 50 9 GIA 0.025
15 0.56 1.05 50 9 GIA 0.409
16 0.72 1.05 50 9 GIA 2.406
17 0.56 0.583 20 3.6 UEM 6.049
18 0.72 0.583 20 3.6 UEM 23.11
19 0.56 1.05 20 3.6 UEM 60.898
20 0.72 1.05 20 3.6 UEM 75.666
21 0.56 0.583 50 3.6 UEM 9.213
22 0.72 0.583 50 3.6 UEM 29.503
23 0.56 1.05 50 3.6 UEM 64.794
24 0.72 1.05 50 3.6 UEM 81.261
25 0.56 0.583 20 9 UEM 0.013
26 0.72 0.583 20 9 UEM 0.038
27 0.56 1.05 20 9 UEM 0.42
28 0.72 1.05 20 9 UEM 1.982
29 0. 56 0.583 50 9 UEM 0.017
30 0.72 0.583 50 9 UEM 0.049
31 0.56 1.05 50 9 UEM 0.53
32 0.72 1.05 50 9 UEM 2.527
Although the greedy improvement algorithm is statistically significantly better than the
utilization equalization method, the absolute values of the response metric are often small. In
the experimental design, the maximum difference of the average values of response between
the two allocation methods is less than six minutes. The difference may increase when the
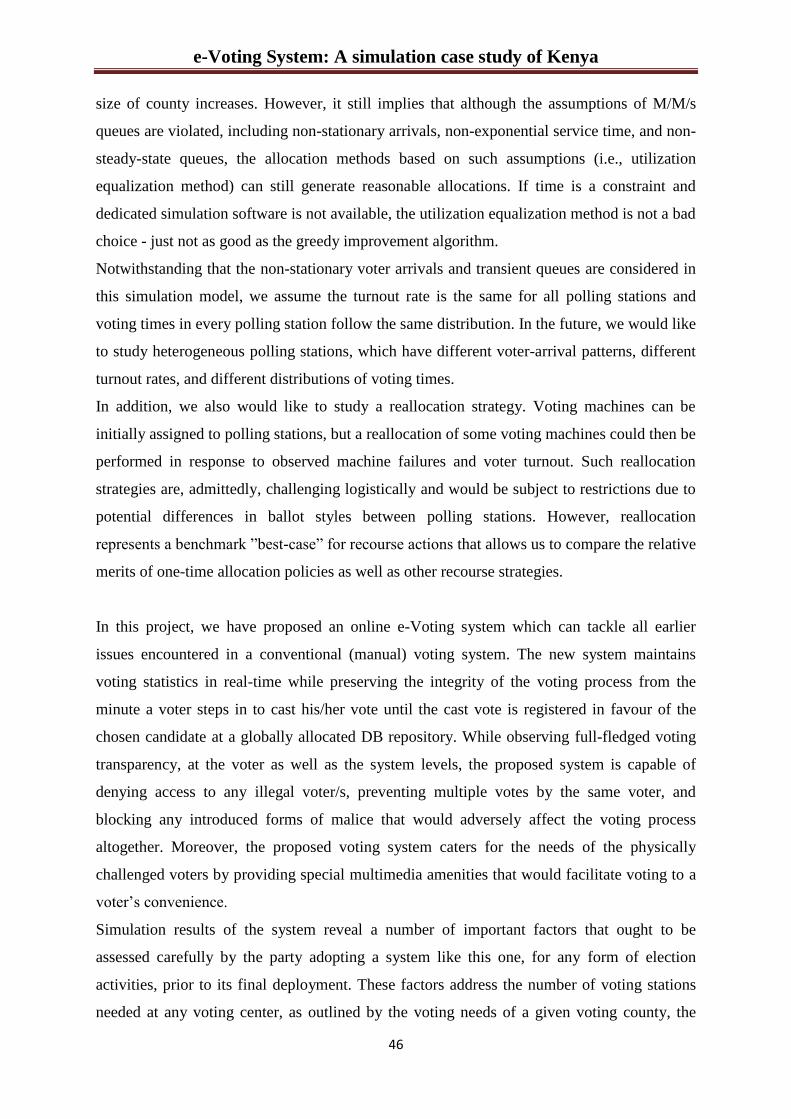
e-Voting System: A simulation case study of Kenya
46
size of county increases. However, it still implies that although the assumptions of M/M/s
queues are violated, including non-stationary arrivals, non-exponential service time, and non-
steady-state queues, the allocation methods based on such assumptions (i.e., utilization
equalization method) can still generate reasonable allocations. If time is a constraint and
dedicated simulation software is not available, the utilization equalization method is not a bad
choice - just not as good as the greedy improvement algorithm.
Notwithstanding that the non-stationary voter arrivals and transient queues are considered in
this simulation model, we assume the turnout rate is the same for all polling stations and
voting times in every polling station follow the same distribution. In the future, we would like
to study heterogeneous polling stations, which have different voter-arrival patterns, different
turnout rates, and different distributions of voting times.
In addition, we also would like to study a reallocation strategy. Voting machines can be
initially assigned to polling stations, but a reallocation of some voting machines could then be
performed in response to observed machine failures and voter turnout. Such reallocation
strategies are, admittedly, challenging logistically and would be subject to restrictions due to
potential differences in ballot styles between polling stations. However, reallocation
represents a benchmark ‖best-case‖ for recourse actions that allows us to compare the relative
merits of one-time allocation policies as well as other recourse strategies.
In this project, we have proposed an online e-Voting system which can tackle all earlier
issues encountered in a conventional (manual) voting system. The new system maintains
voting statistics in real-time while preserving the integrity of the voting process from the
minute a voter steps in to cast his/her vote until the cast vote is registered in favour of the
chosen candidate at a globally allocated DB repository. While observing full-fledged voting
transparency, at the voter as well as the system levels, the proposed system is capable of
denying access to any illegal voter/s, preventing multiple votes by the same voter, and
blocking any introduced forms of malice that would adversely affect the voting process
altogether. Moreover, the proposed voting system caters for the needs of the physically
challenged voters by providing special multimedia amenities that would facilitate voting to a
voter’s convenience.
Simulation results of the system reveal a number of important factors that ought to be
assessed carefully by the party adopting a system like this one, for any form of election
activities, prior to its final deployment. These factors address the number of voting stations
needed at any voting center, as outlined by the voting needs of a given voting county, the
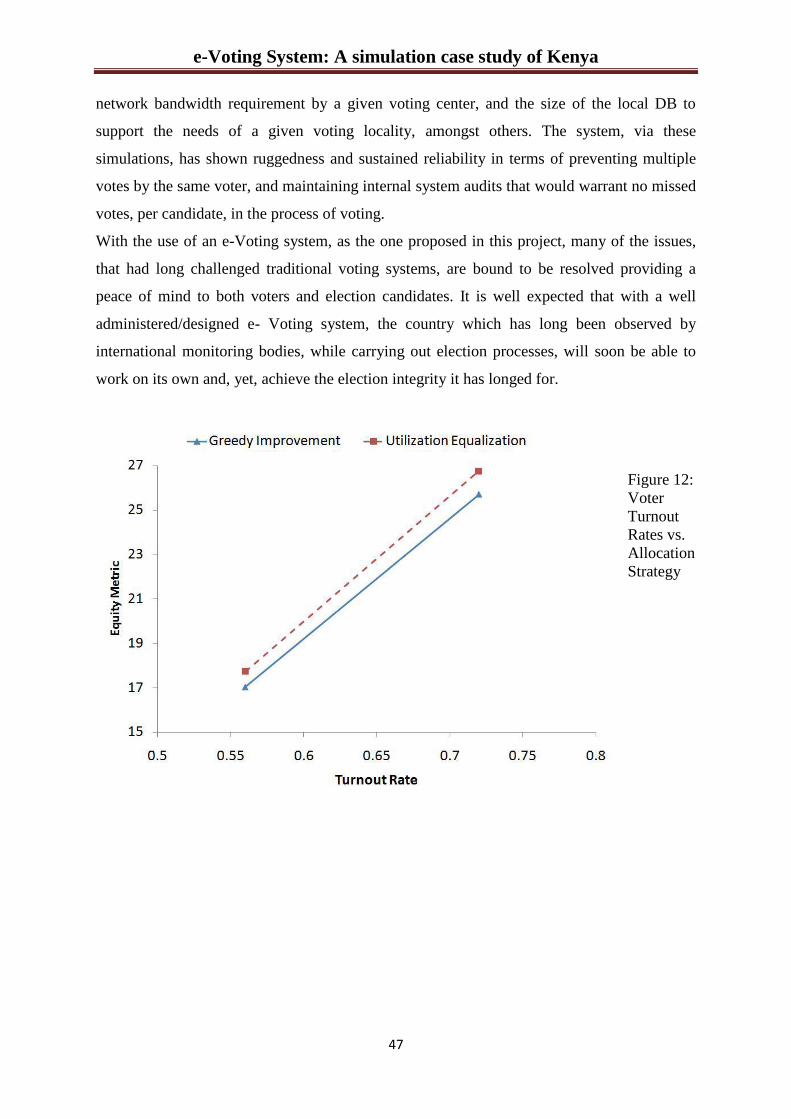
e-Voting System: A simulation case study of Kenya
47
network bandwidth requirement by a given voting center, and the size of the local DB to
support the needs of a given voting locality, amongst others. The system, via these
simulations, has shown ruggedness and sustained reliability in terms of preventing multiple
votes by the same voter, and maintaining internal system audits that would warrant no missed
votes, per candidate, in the process of voting.
With the use of an e-Voting system, as the one proposed in this project, many of the issues,
that had long challenged traditional voting systems, are bound to be resolved providing a
peace of mind to both voters and election candidates. It is well expected that with a well
administered/designed e- Voting system, the country which has long been observed by
international monitoring bodies, while carrying out election processes, will soon be able to
work on its own and, yet, achieve the election integrity it has longed for.
Figure 12:
Voter
Turnout
Rates vs.
Allocation
Strategy

e-Voting System: A simulation case study of Kenya
48
Figure 13: Voting Time Required vs. Allocation Strategy
e-Voting System: A simulation case study of Kenya
49
Figure 14: Size of County vs. Allocation Strategy
Figure 15: Machines per polling stations vs. Allocation Strategy

e-Voting System: A simulation case study of Kenya
50
References:
1. D. Veit and J. Huntgeburth, 2014, ―Foundations of Digital Government‖, Springer
Texts in Business and Economics, DOI 10.1007/978-3-642-38511-7_8, # Springer-
Verlag Berlin Heidelberg 2014
2. Mercurio BC (2004), ―Democracy in decline: can internet voting save the electoral
process?‖ John Marshall J Comp Inform Law 22:409–456
3. Jean-Luc Koning and Didier Dubois (2006), ―Suitable properties for any electronic
voting system‖ , Artificial Intelligence and Law (2006) 14:251–260 _ Springer 2006
doi: 10.1007/s10506-006-9000-6
4. Melanie Volkamer (2009), ―Evaluation of Electronic Voting‖, Springer Texts in
Business Information Processing, DOI 10.1007/ 978-3-642-01661-5, © Springer-
Verlag Berlin Heidelberg 2009
5. Alexander Prosser, Robert Krimmer, Robert Kofler (2004), ―Implementing an
internet-based voting system for public elections‖, Enterprise Information Systems V,
294-299, © 2004 Kluwer Academic Publishers. Printed in the Netherlands.
6. P. Salini and S. Kanmani (2013), ―Security Based Requirements Engineering for E-
Voting System‖, Proceedings of the Third International Conference on Trends in
Information, Telecommunication and Computing, Lecture Notes in Electrical
Engineering 150, DOI: 10.1007/978-1-4614-3363-7_52, © Springer
Science+Business Media New York 2013
7. Robert Krimmer, Stefan Triessnig, and Melanie Volkamer (2007), ―The development
of remote e-voting around the World: A review of roads and directions‖, VOTE-ID
2007, LNCS 4896, pp. 1–15, 2007. © Springer-Verlag Berlin Heidelberg 2007
8. Olivier de Marneffe, Olivier Pereira, and Jean-Jacques Quisquater (2007),
―Simulation-Based Analysis of E2E Voting Systems‖, VOTE-ID 2007, LNCS 4896,
pp. 137–149, 2007. ©Springer-Verlag Berlin Heidelberg 2007
9. Axel Schmidt, Dennis Heinson, Lucie Langer, Zoi Opitz-Talidou, Philipp Richter,
Melanie Volkamer, and Johannes Buchmann (2009), ―Developing a Legal Framework
for Remote Electronic Voting‖, VOTE-ID 2009, LNCS 5767, pp. 92–105, 2009. ©
Springer-Verlag Berlin Heidelberg 2009

e-Voting System: A simulation case study of Kenya
51
10. Taha Kh. Ahmed and Mohamed Aborizka (2011), ―Secure Biometric E-Voting
Scheme‖, ICICIS 2011, Part I, CCIS 134, pp. 380–388, 2011. © Springer-Verlag
Berlin Heidelberg 2011
11. Melanie Volkamer (2010), ―Electronic Voting in Germany‖, Data Protection in a
Profiled World, DOI 10.1007/978-90-481-8865-9_10, © Springer Science+Business
Media B.V. 2010
12. Ülle Madise and Epp Maaten (2010), ―Internet Voting in Estonia‖, e-Democracy,
Advances in Group Decision 301 and Negotiation 5, DOI 10.1007/978-90-481-9045-
4_17, ©Springer Science+Business Media B.V. 2010
13. Urs Gasser and Jan Gerlach (2011), ―Electronic Voting: Approaches, Strategies, and
Policy Issues—A Report from Switzerland‖, Innovating Government, Information
Technology and Law Series 20, DOI: 10.1007/978-90-6704-731-9_7, © T.M.C.
ASSER PRESS, The Hague, The Netherlands, and the authors 2011
14. Anu Maria (1997), ―Introduction to modeling and simulation‖, Proceedings of the
1997 Winter Simulation Conference ed. S. Andradóttir, K. J. Healy, D. H. Withers,
and B. L. Nelson
15. Ricardo Andr´e Costa, M´ario Jorge Leit˜ao, and Isidro Vila Verde, ―Electronic
Voting: An All-Purpose Platform‖, EGOV 2005, LNCS 3591, pp. 309–316, 2005. ©
Springer-Verlag Berlin Heidelberg 2005
16. Ying Qiu; Zhu, Huafei, "Somewhat Secure Mobile Electronic-Voting Systems Based
on the Cut-and-Choose Mechanism," Computational Intelligence and Security, 2009.
CIS '09. International Conference on , vol.1, no., pp.446,450, 11-14 Dec. 2009
doi: 10.1109/CIS.2009.39
URL: http://ieeexplore.ieee.org/stamp/stamp.jsp?tp=&arnumber=5376484&isnumber
=5375794 accessed on Feb, 2014
17. Kohno, T.; Stubblefield, A.; Rubin, A.D.; Wallach, D.S., "Analysis of an electronic
voting system," Security and Privacy, 2004. Proceedings. 2004 IEEE Symposium on ,
vol., no., pp.27,40, 9-12 May 2004
doi: 10.1109/SECPRI.2004.1301313
URL: http://ieeexplore.ieee.org/stamp/stamp.jsp?tp=&arnumber=1301313&isnumber
=28916 accessed on Feb, 2014
18. Seo-Il Kang; Im-Yeong Lee, "A Study on the Electronic Voting System using blind
Signature for Anonymity," Hybrid Information Technology, 2006. ICHIT '06.
International Conference on , vol.2, no., pp.660,663, 9-11 Nov. 2006

e-Voting System: A simulation case study of Kenya
52
doi: 10.1109/ICHIT.2006.253678
URL: http://ieeexplore.ieee.org/stamp/stamp.jsp?tp=&arnumber=4021283&isnumber
=4021174 accessed on Feb, 2014
19. Thammawaja, S.; Lertwatechakul, M., "Design a Secure Electronic Voting System for
Thailand's Election," Communications and Information Technologies, 2008. ISCIT
2008. International Symposium on , vol., no., pp.40,45, 21-23 Oct. 2008
doi: 10.1109/ISCIT.2008.4700151
URL: http://ieeexplore.ieee.org/stamp/stamp.jsp?tp=&arnumber=4700151&isnumber
=4700142 accessed on Feb, 2014
20. Cui Zhe; Dai Xiang, "A practical distributed electronic voting system," Electric
Information and Control Engineering (ICEICE), 2011 International Conference on ,
vol., no., pp.1095,1099, 15-17 April 2011
doi: 10.1109/ICEICE.2011.5777548
URL: http://ieeexplore.ieee.org/stamp/stamp.jsp?tp=&arnumber=5777548&isnumber
=5776798 accessed on Feb, 2014
21. Figueroa, K.; Lopez, E.; Garcia-Garcia, J.M., "Electronic Voting System in Mexican
Elections," Computer Science (ENC), 2013 Mexican International Conference on ,
vol., no., pp.1,6, Oct. 30 2013-Nov. 1 2013
doi: 10.1109/ENC.2013.6
URL: http://ieeexplore.ieee.org/stamp/stamp.jsp?tp=&arnumber=6679812&isnumber
=6679802 accessed on Feb, 2014
22. Weldemariam, K.; Kemmerer, R.A.; Villafiorita, A., "Formal Specification and
Analysis of an E-voting System," Availability, Reliability, and Security, 2010. ARES
'10 International Conference on , vol., no., pp.164,171, 15-18 Feb. 2010
doi: 10.1109/ARES.2010.83
URL: http://ieeexplore.ieee.org/stamp/stamp.jsp?tp=&arnumber=5438100&isnumber
=5437988 accessed on Feb, 2014
23. Al-Ameen, A.; Talab, S.A., "E-voting systems vulnerabilities," Information Science
and Digital Content Technology (ICIDT), 2012 8th International Conference on ,
vol.1, no., pp.67,73, 26-28 June 2012
URL: http://ieeexplore.ieee.org/stamp/stamp.jsp?tp=&arnumber=6269229&isnumber
=6269212 accessed on Feb, 2014
24. Epstein, J., "Electronic Voting," Computer , vol.40, no.8, pp.92,95, Aug. 2007
doi: 10.1109/MC.2007.271

e-Voting System: A simulation case study of Kenya
53
URL: http://ieeexplore.ieee.org/stamp/stamp.jsp?tp=&arnumber=4292024&isnumber
=4291993 accessed on Feb, 2014
25. Paul, N.; Tanenbaum, A.S., "The Design of a Trustworthy Voting System," Computer
Security Applications Conference, 2009. ACSAC '09. Annual , vol., no., pp.507,517,
7-11 Dec. 2009
doi: 10.1109/ACSAC.2009.54
URL: http://ieeexplore.ieee.org/stamp/stamp.jsp?tp=&arnumber=5380703&isnumber
=5380502 accessed on Feb, 2014
26. Sandikkaya, M.T.; Orencik, Bulent, "Agent-Based Offline Electronic Voting,"
Computer Software and Applications Conference, 2006. COMPSAC '06. 30th Annual
International , vol.2, no., pp.333,340, 17-21 Sept. 2006
doi: 10.1109/COMPSAC.2006.107
URL: http://ieeexplore.ieee.org/stamp/stamp.jsp?tp=&arnumber=4020189&isnumber
=4020118 accessed on Feb, 2014
27. Chun-Ta Li; Min-Shiang Hwang; Yan-Chi Lai, "A Verifiable Electronic Voting
Scheme over the Internet," Information Technology: New Generations, 2009. ITNG
'09. Sixth International Conference on , vol., no., pp.449,454, 27-29 April 2009
doi: 10.1109/ITNG.2009.93
URL: http://ieeexplore.ieee.org/stamp/stamp.jsp?tp=&arnumber=5070659&isnumber
=5070575 accessed on Feb, 2014
28. Fauzia, N.; Dey, T.; Bhuiyan, I.; Rahman, M.S., "An efficient implementation of
electronic election system," Computer and information technology, 2007. iccit 2007.
10th international conference on , vol., no., pp.1,6, 27-29 Dec. 2007
doi: 10.1109/ICCITECHN.2007.4579420
URL: http://ieeexplore.ieee.org/stamp/stamp.jsp?tp=&arnumber=4579420&isnumber
=4579351 accessed on Feb, 2014
29. Keshk, A.E.; Abdul-Kader, H.M., "Development of remotely secure e-voting system,"
Information and Communications Technology, 2007. ICICT 2007. ITI 5th
International Conference on , vol., no., pp.235,243, 16-18 Dec. 2007
doi: 10.1109/ITICT.2007.4475655
URL: http://ieeexplore.ieee.org/stamp/stamp.jsp?tp=&arnumber=4475655&isnumber
=4475588 accessed on Feb, 2014
30. Khasawneh, M.; Malkawi, M.; Al-Jarrah, O.; Barakat, L.; Hayajneh, T.S.; Ebaid,
M.S., "A biometric-secure e-voting system for election processes," Mechatronics and

e-Voting System: A simulation case study of Kenya
54
Its Applications, 2008. ISMA 2008. 5th International Symposium on , vol., no., pp.1,8,
27-29 May 2008
doi: 10.1109/ISMA.2008.4648818
URL: http://ieeexplore.ieee.org/stamp/stamp.jsp?tp=&arnumber=4648818&isnumber
=4648794 accessed on Feb, 2014
31. Kofler, R.; Krimmer, R.; Prosser, A., "Electronic voting: algorithmic and
implementation issues," System Sciences, 2003. Proceedings of the 36th Annual
Hawaii International Conference on , vol., no., pp.7 pp.,, 6-9 Jan. 2003
doi: 10.1109/HICSS.2003.1174319
URL: http://ieeexplore.ieee.org/stamp/stamp.jsp?tp=&arnumber=1174319&isnumber
=26341 accessed on Feb, 2014
32. Kramer, S.; Ryan, P. Y A, "A modular multi-modal specification of real-timed, end-
to-end voter-verifiable voting systems," Requirements Engineering for Electronic
Voting Systems (REVOTE), 2011 International Workshop on , vol., no., pp.9,21, 29-
29 Aug. 2011
doi: 10.1109/REVOTE.2011.6045911
URL: http://ieeexplore.ieee.org/stamp/stamp.jsp?tp=&arnumber=6045911&isnumber
=6045909 accessed on Feb, 2014
33. Mercurio BC (2004), ―Democracy in decline: can internet voting save the electoral
process?‖ John Marshall J Comp Inform Law 22:409–456
34. Smith AD, Clark JS (2005), ―Revolutionising the voting process through online
strategies.‖ Online Inform Rev 29:513–530
35. K. Elleithy (ed.), Innovations and Advanced Techniques in Systems, Computing
Sciences and Software Engineering, © Springer Science+Business Media B.V. 2008

e-Voting System: A simulation case study of Kenya
55